Asia Pacific Erp Market
Tamanho do mercado em biliões de dólares
CAGR :
% 
 USD
18.81 Billion
USD
47.76 Billion
2024
2032
USD
18.81 Billion
USD
47.76 Billion
2024
2032
| 2025 –2032 | |
| USD 18.81 Billion | |
| USD 47.76 Billion | |
| % | |
|
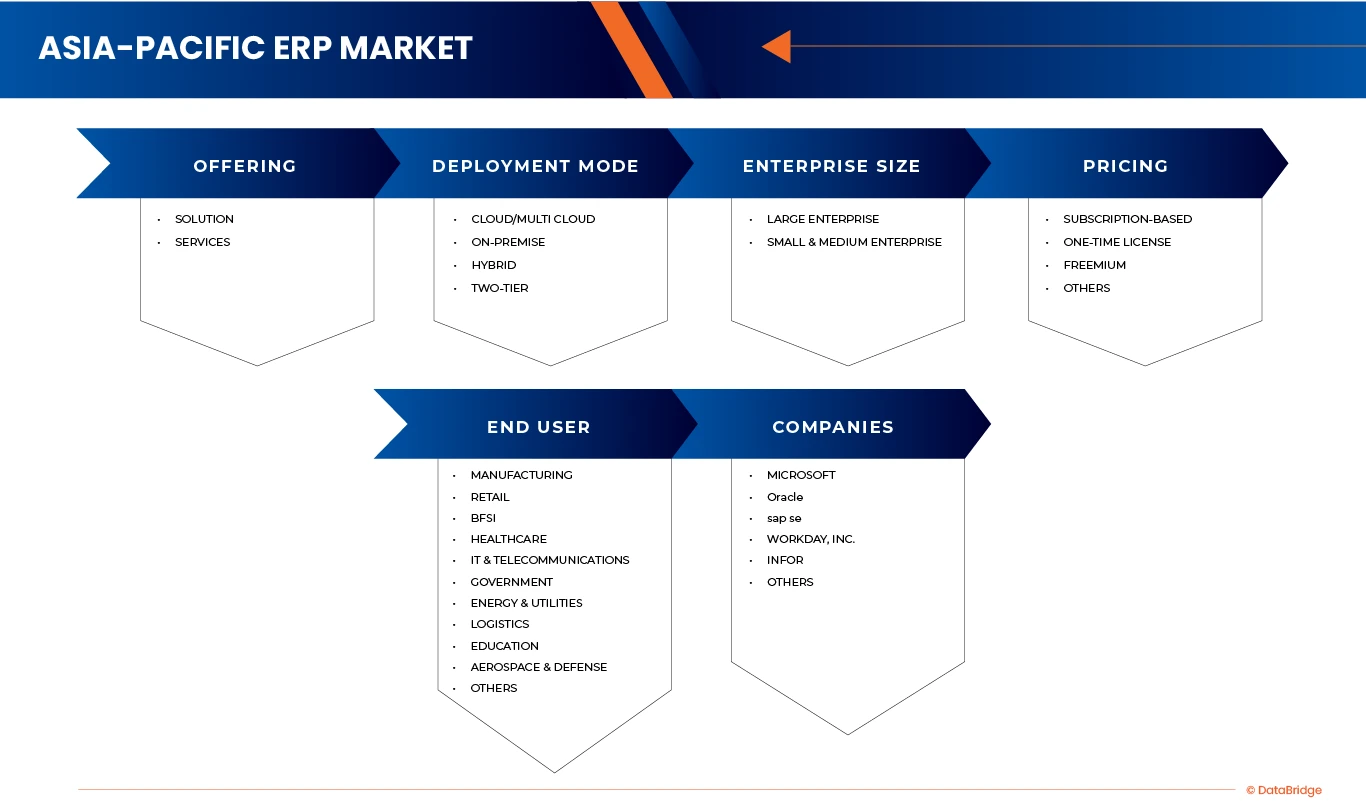
Mercado de ERP na Ásia-Pacífico, por oferta (soluções e serviços), modo de implantação (nuvem/multinuvem, local, híbrido e de duas camadas), porte da empresa (grandes empresas e pequenas e médias empresas), preços (assinatura, licença única, freemium e outros), usuário final (manufatura, varejo, serviços financeiros, saúde, TI e telecomunicações, governo, energia e serviços públicos, logística, educação, aeroespacial e defesa, outros) - Tendências e previsões do setor até 2032
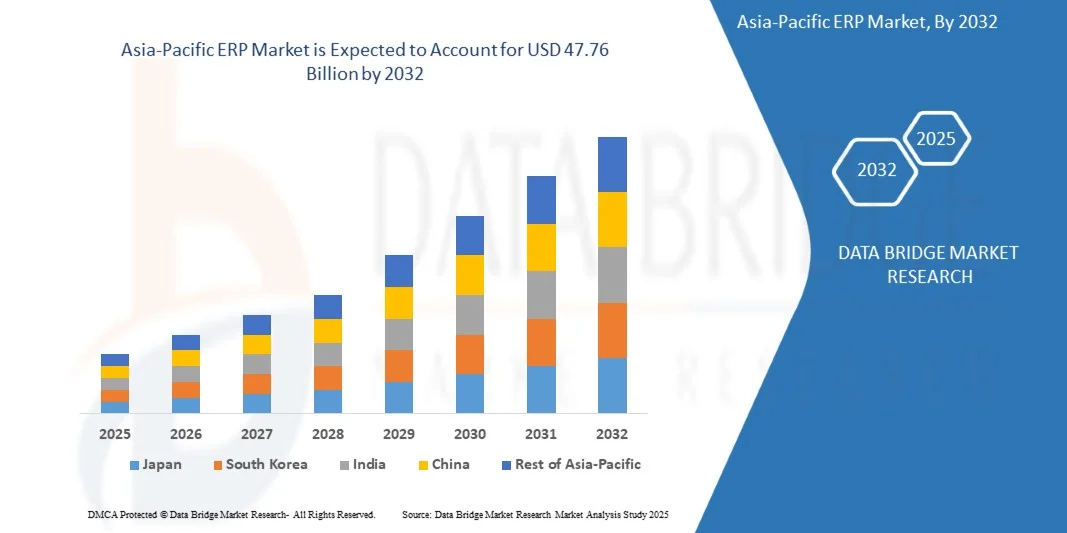
Tamanho do mercado de ERP na região Ásia-Pacífico
- O mercado de ERP na região Ásia-Pacífico foi avaliado em US$ 18,81 bilhões em 2024 e a expectativa é que alcance US$ 47,76 bilhões até 2032.
- Durante o período de previsão de 2025 a 2032, o mercado deverá crescer a uma taxa composta de crescimento anual (CAGR) de 12,4%, impulsionado pela crescente adoção de soluções baseadas em nuvem, iniciativas de transformação digital em diversos setores e pela necessidade cada vez maior de análises de dados em tempo real para aprimorar a eficiência dos negócios e a tomada de decisões.
- Esse crescimento é ainda mais impulsionado pela integração de tecnologias avançadas, como Inteligência Artificial (IA), Aprendizado de Máquina (ML) e Internet das Coisas (IoT), em sistemas ERP, que aprimoram a automação, a análise preditiva e a eficiência operacional em diversos setores da indústria.

Análise do mercado de ERP na região Ásia-Pacífico
- O mercado de ERP na região Ásia-Pacífico está passando por uma rápida expansão devido à aceleração da transformação digital, ao forte crescimento econômico e à crescente adoção de sistemas ERP baseados em nuvem pelas empresas, visando aprimorar a agilidade dos negócios e a eficiência operacional em tempo real.
- Iniciativas governamentais que promovem a digitalização, o aumento dos investimentos de PMEs em soluções ERP acessíveis e a crescente demanda por ferramentas integradas de inteligência de negócios são os principais fatores que impulsionam o crescimento do mercado nos setores de manufatura, varejo e serviços.
- China, Índia e Japão lideram o mercado de ERP na região Ásia-Pacífico, impulsionados pela automação industrial em larga escala, pela expansão da infraestrutura de TI e pela crescente adoção de soluções de ERP baseadas em IA que otimizam a gestão da cadeia de suprimentos, das finanças e do capital humano.
- A China deverá ser o país dominante e de crescimento mais rápido, com uma quota de mercado de 36,29%, devido ao forte apoio governamental, à rápida expansão industrial e aos crescentes investimentos em infraestrutura digital e tecnológica.
- Espera-se que o segmento de soluções domine o mercado com uma participação de 64,66%, devido à crescente demanda por plataformas integradas que aprimoram a eficiência operacional e otimizam os processos de negócios.
Escopo do relatório e segmentação do mercado de ERP na região Ásia-Pacífico
|
Atributos |
Principais insights de mercado sobre ERP |
|
Segmentos abrangidos |
|
|
Países abrangidos |
Ásia-Pacífico
|
|
Principais participantes do mercado |
|
|
Oportunidades de mercado |
|
|
Conjuntos de informações de dados de valor agregado |
Além de informações de mercado como valor de mercado, taxa de crescimento, segmentos de mercado, cobertura geográfica, participantes do mercado e cenário de mercado, o relatório de mercado elaborado pela equipe da Data Bridge Market Research inclui análises aprofundadas de especialistas, análises de importação/exportação, análises de preços, análises de produção e consumo e análises PESTLE. |
Tendências do mercado de ERP na região Ásia-Pacífico
“Adoção crescente de ERP baseado em nuvem”
- A crescente adoção de sistemas ERP baseados em nuvem na região da Ásia-Pacífico está impulsionando significativamente o crescimento do mercado. A demanda crescente por soluções de gestão empresarial escaláveis, econômicas e acessíveis está incentivando organizações dos setores de manufatura, varejo e serviços a migrarem de sistemas legados locais para plataformas em nuvem.
- Na região da Ásia-Pacífico, o acesso a dados em tempo real, a automação de processos e a colaboração aprimorada entre equipes distribuídas estão se tornando cada vez mais essenciais para a eficiência operacional. Além disso, o crescente número de iniciativas de transformação digital, a necessidade de tomada de decisões ágil e a expansão de pequenas e médias empresas estão acelerando a adoção de soluções ERP em nuvem para garantir flexibilidade, produtividade e continuidade dos negócios.
- O crescimento contínuo das iniciativas de transformação digital está impulsionando uma forte adoção de soluções ERP baseadas em nuvem. As organizações estão cada vez mais utilizando plataformas ERP em nuvem para aprimorar a eficiência operacional, otimizar fluxos de trabalho e possibilitar a tomada de decisões orientada por dados.
- Sistemas ERP automatizados, escaláveis e flexíveis estão se tornando essenciais para que as empresas otimizem a utilização de recursos, garantam a conformidade e apoiem a expansão regional. Como resultado, o ERP baseado em nuvem é cada vez mais reconhecido como um facilitador estratégico para operações comerciais integradas, econômicas e preparadas para o futuro nos mercados da região da Ásia-Pacífico.
Dinâmica do mercado de ERP na região Ásia-Pacífico
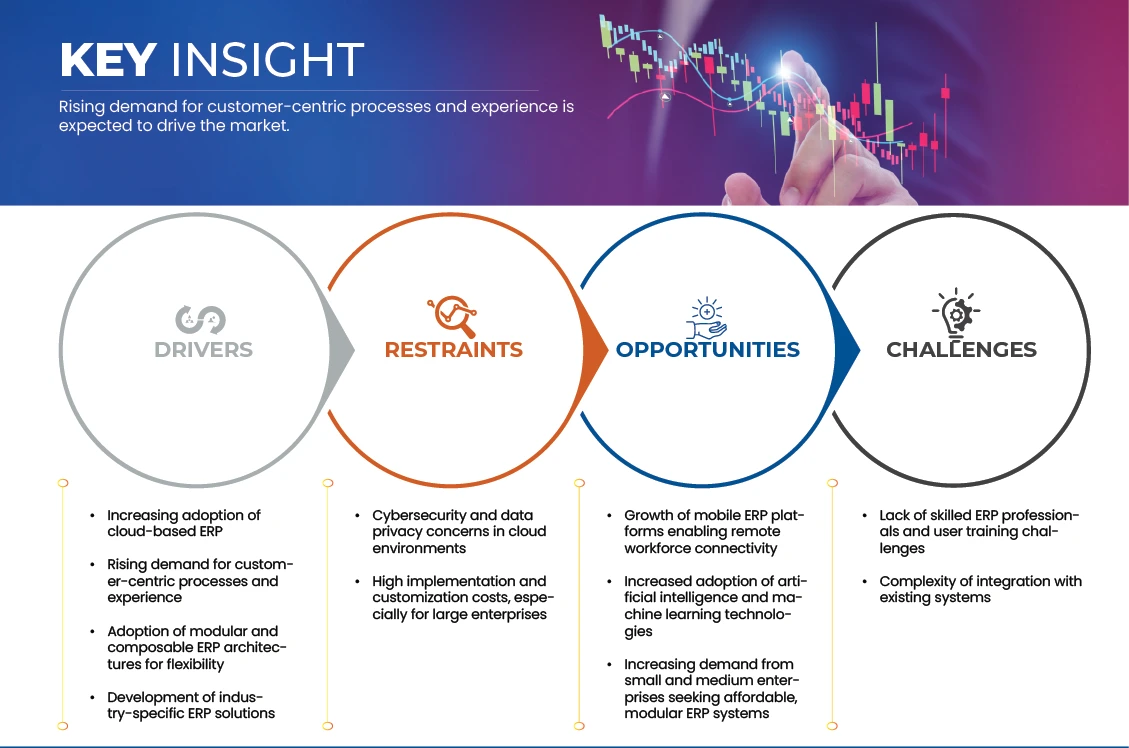
Motorista
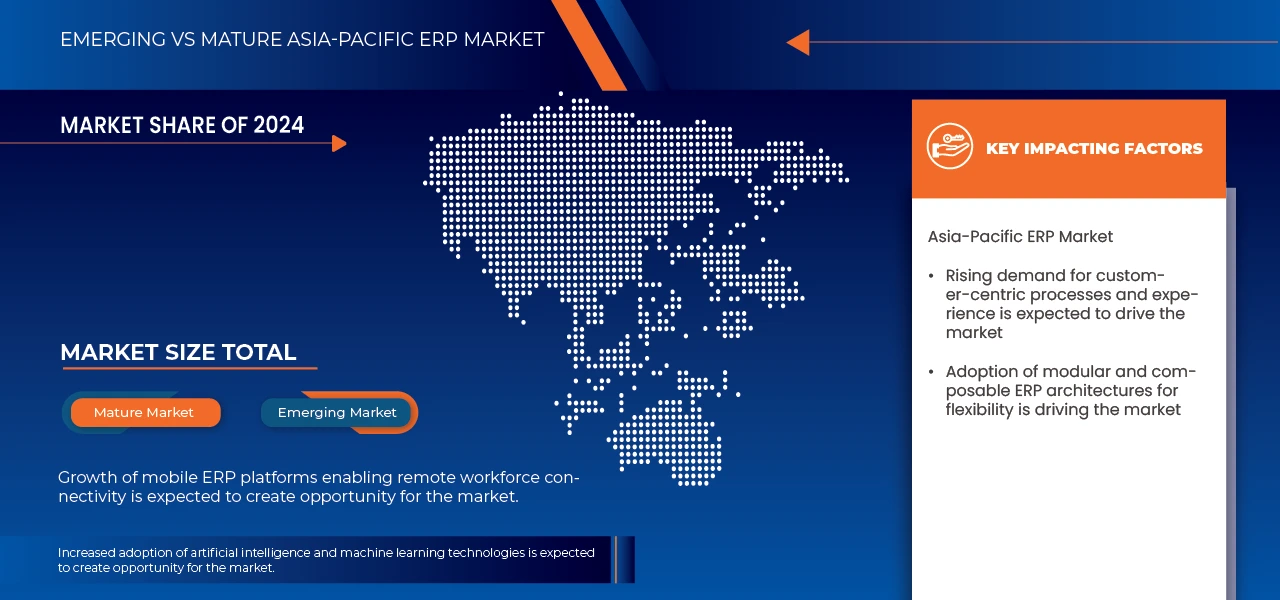
“Crescente demanda por processos e experiências centrados no cliente”
- A crescente demanda por processos e experiências centradas no cliente está impulsionando as organizações na região da Ásia-Pacífico a adotarem soluções ERP avançadas que otimizam as operações e aprimoram a tomada de decisões.
- Empresas dos setores de manufatura, varejo, farmacêutico e de bens de consumo estão investindo cada vez mais em sistemas ERP para aprimorar a eficiência operacional, garantir a precisão dos dados e facilitar o monitoramento de processos em tempo real. Plataformas ERP integradas permitem que as empresas gerenciem fluxos de trabalho complexos, otimizem a alocação de recursos e mantenham a conformidade regulatória, o que é crucial em setores altamente regulamentados.
- As soluções ERP que suportam múltiplos departamentos, diversos processos de negócios e fornecem análises em tempo real permitem que as organizações reduzam erros, minimizem custos operacionais e ofereçam produtos e serviços consistentes e de alta qualidade, fortalecendo, em última análise, a satisfação geral do cliente.
- O rápido crescimento dos setores de manufatura e produção na região da Ásia-Pacífico, incluindo alimentos, bebidas e cosméticos, está impulsionando as empresas a adotarem sistemas ERP que aprimoram a eficiência operacional, o controle de qualidade e a flexibilidade dos processos.
- As organizações buscam cada vez mais soluções integradas que otimizem os fluxos de trabalho, ofereçam visibilidade em tempo real e apoiem a tomada de decisões baseada em dados, permitindo que respondam rapidamente às necessidades dos clientes. Assim como as máquinas automatizadas de envase de líquidos otimizam a produção e garantem a qualidade consistente do produto,
- As plataformas ERP atuam como a espinha dorsal de operações modernas e centradas no cliente, ajudando as empresas a crescerem de forma eficiente, mantendo altos padrões de qualidade. Essa crescente demanda por automação de processos, precisão e transparência operacional ressalta a importância estratégica da adoção de ERP na região da Ásia-Pacífico como ferramenta para oferecer melhores produtos, serviços mais rápidos e experiências superiores ao cliente.
Oportunidade
“Crescimento das plataformas ERP móveis que possibilitam a conectividade da força de trabalho remota”
- O crescimento das plataformas de ERP móvel está transformando o mercado de ERP na região Ásia-Pacífico, possibilitando conectividade perfeita para equipes remotas e distribuídas. Com a rápida adoção de tecnologias móveis e baseadas em nuvem em toda a região Ásia-Pacífico, as empresas estão cada vez mais utilizando aplicativos de ERP móvel para fornecer aos funcionários acesso em tempo real a dados críticos de negócios, fluxos de trabalho e análises a partir de smartphones e tablets.
- Essa funcionalidade permite que equipes de campo, vendas e operações tomem decisões mais rápidas, atualizem registros em qualquer lugar e mantenham a colaboração entre várias localidades, melhorando a produtividade geral. Para a região da Ásia-Pacífico, onde as empresas frequentemente operam em áreas geograficamente dispersas, as plataformas de ERP móvel reduzem a dependência de escritórios centralizados, diminuem os atrasos na comunicação e otimizam as operações em setores como manufatura, logística, varejo e serviços.
- Além disso, essas plataformas suportam a integração com dispositivos IoT, serviços em nuvem e outros sistemas corporativos, proporcionando flexibilidade, escalabilidade e maior continuidade dos negócios, o que impulsiona uma maior adoção tanto por pequenas e médias empresas quanto por grandes corporações.
- A crescente adoção de tecnologias automatizadas e assépticas em mercados emergentes reflete uma tendência mais ampla em direção à eficiência operacional e ao controle de processos em tempo real, que acompanha diretamente o crescimento de plataformas ERP móveis que permitem a conectividade de equipes remotas na região da Ásia-Pacífico.
- Assim como os fabricantes investem em sistemas de envase avançados para otimizar a produção e garantir a conformidade, as empresas estão cada vez mais utilizando soluções de ERP móvel para fornecer aos funcionários remotos acesso em tempo real a fluxos de trabalho, dados e aprovações. Essa conectividade aumenta a produtividade, dá suporte a operações distribuídas e permite a tomada de decisões ágeis em empresas com várias unidades, tornando o ERP móvel uma oportunidade estratégica de crescimento na região.
Restrição/Desafio
“Falta de profissionais qualificados em ERP e desafios no treinamento de usuários”
- O mercado de ERP na região Ásia-Pacífico enfrenta desafios significativos devido à escassez de profissionais qualificados em ERP e à complexidade do treinamento de usuários. A implementação de sistemas ERP em grandes empresas geralmente envolve múltiplos módulos, integrações e personalizações, o que exige conhecimento técnico especializado para configuração, implantação e manutenção. Muitas organizações na região têm dificuldade em encontrar pessoal qualificado que possa gerenciar essas tarefas com eficácia, o que leva a prazos de implementação mais longos, custos aumentados e desempenho do sistema abaixo do ideal.
- Além disso, o treinamento do usuário final continua sendo um obstáculo crítico, visto que os funcionários precisam se adaptar a novos fluxos de trabalho, interfaces e processos automatizados. Treinamento insuficiente pode resultar em baixas taxas de adoção, erros operacionais e redução do ROI, complicando ainda mais as iniciativas de ERP. Na região da Ásia-Pacífico, esse problema é agravado pela diversidade de idiomas, diferenças culturais e níveis variáveis de alfabetização digital entre os países, o que torna desafiador o desenvolvimento de programas de treinamento padronizados. Superar essas lacunas de habilidades é crucial para garantir a implementação bem-sucedida do ERP e maximizar o valor para os negócios.
- A rápida evolução das tecnologias ERP na região da Ásia-Pacífico, incluindo módulos com inteligência artificial, soluções em nuvem e plataformas modulares, está criando um duplo desafio: oportunidades e obsolescência de habilidades. As organizações enfrentam uma crescente necessidade de profissionais treinados.
- Profissionais de ERP precisam implementar, gerenciar e otimizar esses sistemas avançados com eficácia. Sem treinamento e capacitação adequados, os funcionários podem subutilizar as funcionalidades do ERP, causando ineficiências, atrasos na implementação e redução do retorno sobre o investimento (ROI). Portanto, sanar as lacunas de habilidades e fornecer treinamento contínuo aos usuários é essencial para a adoção bem-sucedida do ERP e para a competitividade operacional.
Escopo do mercado de ERP na região Ásia-Pacífico
O mercado de ERP na região Ásia-Pacífico está segmentado em cinco segmentos com base na oferta, modo de desenvolvimento, porte da empresa, preço e usuário final.
• Ao oferecer
Com base na oferta, o mercado de ERP na região Ásia-Pacífico é segmentado em soluções e serviços. Em 2025, espera-se que o segmento de soluções domine o mercado com uma participação de 64,66%, impulsionado pela crescente adoção de plataformas integradas de gestão empresarial nos setores de manufatura, varejo, serviços financeiros, saúde e governo. A crescente demanda por visibilidade de dados em tempo real, automação de fluxos de trabalho complexos e integração perfeita entre departamentos continua a posicionar as soluções de ERP como a escolha preferida das empresas.
Prevê-se que o segmento de soluções se expanda de forma constante, com uma taxa de crescimento anual composta (CAGR) de 12,6% durante o período de previsão de 2025 a 2032, registrando a maior CAGR, impulsionado pela aceleração das iniciativas de transformação digital nas economias emergentes da região Ásia-Pacífico. Fatores como a rápida migração para a nuvem, a crescente adoção por pequenas e médias empresas (PMEs), os programas de infraestrutura digital liderados pelo governo e a integração cada vez maior de tecnologias avançadas, incluindo análises orientadas por inteligência artificial (IA), inteligência operacional habilitada por IoT e módulos ERP com foco em automação, impulsionarão um forte crescimento da demanda.
• Por Modo de Desenvolvimento
Com base no modo de implantação, o mercado de ERP na região Ásia-Pacífico é segmentado em on-premise, nuvem/multicloud, duas camadas e híbrido. Em 2025, espera-se que o segmento de nuvem/multicloud domine o mercado com 42,12% de participação, impulsionado pela rápida transição para implantações de ERP flexíveis, escaláveis e econômicas em empresas de todos os portes. A crescente preferência por modelos baseados em assinatura, a redução dos custos de infraestrutura de TI e a maior acessibilidade para equipes distribuídas aceleraram a adoção de soluções de ERP com foco em nuvem nos setores de manufatura, varejo, serviços financeiros, saúde e TI e telecomunicações.
Prevê-se que o segmento de nuvem/multinuvem apresente a maior taxa de crescimento anual composta (CAGR) de 12,7% durante o período de previsão de 2025 a 2032, impulsionado pela crescente ênfase na transformação digital, pela adoção cada vez maior por parte das PMEs e pela expansão de data centers hiperescaláveis na região Ásia-Pacífico. A demanda por plataformas ERP ágeis que permitam análises em tempo real, colaboração operacional internacional e escalabilidade rápida está levando as empresas a migrar de sistemas legados locais para arquiteturas nativas da nuvem.
• Por porte da empresa
Com base no porte da empresa, o mercado de ERP na região Ásia-Pacífico é segmentado em grandes empresas e pequenas e médias empresas (PMEs). Em 2025, espera-se que o segmento de grandes empresas domine o mercado com 57,86% de participação, impulsionado pela ampla adoção de plataformas ERP avançadas para otimizar operações complexas, aprimorar a coordenação entre países e dar suporte a iniciativas de transformação digital em larga escala. As grandes empresas continuam investindo fortemente em suítes ERP integradas para unificar as funções de finanças, cadeia de suprimentos, RH, manufatura e gestão de clientes, garantindo visibilidade de dados em tempo real e maior eficiência operacional.
Prevê-se também que o segmento de grandes empresas apresente a taxa de crescimento anual composta (CAGR) mais rápida, de 12,9%, durante o período de previsão de 2025 a 2032, impulsionado pela crescente demanda por soluções ERP habilitadas para nuvem, análises baseadas em inteligência artificial e módulos ERP específicos para os setores de manufatura, serviços financeiros, saúde, governo e telecomunicações. À medida que as grandes organizações aceleram sua transição de sistemas legados para arquiteturas ERP híbridas e escaláveis em nuvem, a necessidade de plataformas seguras, unificadas e de alto desempenho continua a crescer.
• Por preço
Com base nos preços, o mercado de ERP na região Ásia-Pacífico é segmentado em modelos baseados em assinatura, licença única, freemium e outros. Em 2025, espera-se que o segmento de ERP baseado em assinatura domine o mercado com 66,74% de participação, impulsionado pela crescente preferência por modelos de implantação de ERP econômicos, escaláveis e flexíveis em organizações de todos os portes. A mudança para gastos com TI baseados em despesas operacionais (OPEX), a redução dos requisitos de investimento inicial e a crescente disponibilidade de plataformas de ERP nativas da nuvem aceleraram significativamente a adoção do modelo de preços por assinatura.
Prevê-se que o segmento baseado em assinatura registre a maior taxa de crescimento anual composta (CAGR) de 12,6% durante o período de previsão de 2025 a 2032, impulsionado pela rápida tendência de migração para a nuvem, pela crescente adoção por pequenas e médias empresas (PMEs) e pela demanda cada vez maior por suítes de ERP modulares e personalizáveis. À medida que as empresas em toda a região Ásia-Pacífico priorizam agilidade, acessibilidade remota e insights de dados em tempo real, as ofertas de ERP baseadas em assinatura estão ganhando forte impulso.
• Pelo usuário final
Com base no usuário final, o mercado de ERP na região Ásia-Pacífico é segmentado em manufatura, varejo, serviços financeiros, saúde, TI e telecomunicações, governo, energia e serviços públicos, logística, educação, aeroespacial e defesa, entre outros. Em 2025, espera-se que o segmento de manufatura domine o mercado com 25,11% de participação, impulsionado pela rápida adoção de plataformas de ERP para otimizar o planejamento da produção, as operações da cadeia de suprimentos e gerenciar a utilização de recursos de ponta a ponta. O aumento das iniciativas de fábricas inteligentes, a integração da Indústria 4.0 e a crescente demanda por visibilidade em tempo real do estoque, das compras e do desempenho da produção continuam a posicionar o setor de manufatura como o principal adotante de ERP na região.
Prevê-se também que o segmento de manufatura registre a maior taxa de crescimento anual composta (CAGR) de 13,5% durante o período de previsão de 2025 a 2032, impulsionado pela implantação acelerada de sistemas ERP baseados em nuvem, pelo aumento dos investimentos em transformação digital tanto em grandes empresas quanto em PMEs e por um foco crescente em ecossistemas de manufatura conectados. À medida que os fabricantes adotam robótica, máquinas habilitadas para IoT, sistemas de manutenção preditiva e previsão de demanda orientada por IA, a demanda por plataformas ERP unificadas e inteligentes está se intensificando rapidamente.
Análise Regional do Mercado de ERP na Ásia-Pacífico
- A região da Ásia-Pacífico está passando por uma das ondas de transformação digital mais rápidas do mundo, impulsionada por iniciativas governamentais em larga escala, investimentos crescentes em infraestrutura inteligente e a adoção cada vez maior das tecnologias da Indústria 4.0.
- Empresas dos setores de manufatura, serviços financeiros, saúde, varejo, logística e setor público estão migrando ativamente de sistemas legados fragmentados para plataformas ERP unificadas, visando obter visibilidade operacional, automação de fluxos de trabalho e integração entre departamentos.
- Países como China, Japão, Coreia do Sul e Índia estão na vanguarda devido aos seus robustos ecossistemas industriais, investimentos significativos em tecnologias de automação e crescente demanda por sistemas de caixas de engrenagens compactos, eficientes e duráveis.
- A rápida expansão dos data centers em nuvem pelos principais provedores de hiperescala, como AWS, Google Cloud, Azure, Alibaba Cloud e Oracle Cloud, simplificou ainda mais a implementação de ERP, reduziu os investimentos iniciais e aumentou a escalabilidade. À medida que as organizações migram para ambientes híbridos e multicloud para dar suporte a equipes de trabalho distribuídas e acesso a dados em tempo real, as plataformas de ERP com arquiteturas nativas da nuvem, habilitadas para IA e modulares tornam-se essenciais, acelerando significativamente o crescimento do mercado em toda a região.
Análise do Mercado de ERP na Ásia-Pacífico
A região Ásia-Pacífico é o polo global da manufatura, abrangendo setores como eletrônica, automotivo, aeroespacial, máquinas industriais, têxtil e semicondutores. A rápida industrialização na China, Índia, Indonésia, Vietnã, Tailândia e Malásia está impulsionando a demanda por sistemas ERP avançados, capazes de gerenciar fluxos de trabalho complexos de produção, compras, estoque e logística em múltiplas unidades. O forte impulso da região em direção a fábricas inteligentes, integração de robótica, gêmeos digitais, linhas de produção habilitadas para IoT e manutenção preditiva está criando uma demanda robusta por plataformas ERP que suportem monitoramento em tempo real, integração com MES e automação orientada por IA. As interrupções na cadeia de suprimentos causadas por mudanças geopolíticas, volatilidade dos preços da energia e flutuações da demanda global também aumentaram a necessidade de sistemas ERP inteligentes que aprimorem a resiliência da cadeia de suprimentos, melhorem a precisão das previsões e otimizem a alocação de recursos. Essa mudança estrutural em direção a ecossistemas de manufatura digitalmente conectados é um dos principais fatores que impulsionam o mercado de ERP na região Ásia-Pacífico.
Análise do Mercado de ERP na China e na Região Ásia-Pacífico
O mercado de ERP na região Ásia-Pacífico, liderado pela China, é fortemente impulsionado por programas de transformação digital governamentais, incluindo as iniciativas “China Digital”, “Made in China 2025” e o “14º Plano Quinquenal”, que enfatizam a manufatura inteligente, a padronização de dados e a modernização digital em nível empresarial. Essas estratégias nacionais promovem a adoção de plataformas em nuvem, automação industrial e sistemas integrados de gestão empresarial em empresas estatais, polos industriais e indústrias emergentes impulsionadas pela tecnologia. O forte foco do governo em infraestrutura digital — como redes 5G, plataformas de internet industrial e hubs de computação em nuvem — aumentou significativamente a necessidade de sistemas ERP robustos, capazes de suportar processamento de dados em alto volume, análises em tempo real e automação de ponta a ponta.
Análise do Mercado de ERP na Ásia-Pacífico e no Japão
O mercado de ERP na região Ásia-Pacífico, no Japão, é fortemente impulsionado pela necessidade urgente de substituir sistemas legados obsoletos e fragmentados que há muito tempo dão suporte às operações dos setores de manufatura, automotivo, eletrônico, de saúde e público. Muitas empresas japonesas ainda dependem de infraestruturas de ERP locais e altamente personalizadas, construídas décadas atrás, que se tornaram difíceis de manter devido ao aumento dos custos de TI e à escassez de profissionais com habilidades específicas para lidar com esses sistemas. Ao mesmo tempo, a grave escassez de mão de obra no Japão, agravada pelo envelhecimento da população e pela diminuição da força de trabalho, acelerou a adoção de automação, fluxos de trabalho digitais e gestão operacional assistida por IA. À medida que as empresas buscam melhorar a produtividade, automatizar tarefas administrativas manuais e consolidar dados em plataformas unificadas, os modernos sistemas de ERP baseados em nuvem tornam-se essenciais. As iniciativas governamentais da "Agência Digital", o incentivo à transformação digital em todo o país e os incentivos à modernização de TI amplificam ainda mais a demanda por plataformas de ERP de última geração em diversos setores no Japão.
Os principais líderes de mercado que atuam no setor são:
- Microsoft (EUA)
- Oracle (EUA)
- SAP SE (Alemanha)
- Workday, Inc. (EUA)
- Infor (EUA)
- Odoo (Bélgica)
- Focus Softnet Pvt Ltd (Índia)
- HashMicro (Singapura)
- Sage Group plc (Reino Unido)
- Epicor Software Corporation (EUA)
- Exato (Países Baixos)
- QAD Inc. (EUA)
- Tally Solutions Private Limited (Índia)
- Deltek, Inc. (EUA)
- Ramco Systems (Índia)
- Zoho Corporation Pvt. Ltd (Índia)
- Acumatica, Inc. (EUA)
- Software BatchMaster (EUA)
- Deskera (Singapura)
- SYSPRO (África do Sul)
Novidades no mercado de ERP da Ásia-Pacífico
- Em junho de 2025, a QAD realizou um evento global, o QAD Redzone Champions of Manufacturing, reunindo líderes do setor para apresentar as mais recentes inovações da empresa, baseadas em IA, e soluções adaptáveis em nuvem para a manufatura. O evento destacou como a inteligência artificial e as tecnologias avançadas estão transformando o ERP em um sistema proativo que impulsiona a tomada de decisões mais rápidas e a excelência operacional. Os participantes puderam assistir a demonstrações de produtos ao vivo, participar de laboratórios interativos e analisar estudos de caso reais focados em ERP, cadeia de suprimentos e capacitação da força de trabalho.
- Em julho de 2025, a Exact anunciou a expansão de sua equipe de liderança e o lançamento das edições Premium do Exact Online, oferecendo mais flexibilidade e funcionalidades aprimoradas para usuários de ERP. A empresa também destacou seu foco em inovação, automação e parcerias como principais impulsionadores do crescimento no mercado de ERP da Ásia-Pacífico.
- Em janeiro de 2025, o BatchMaster ERP foi implementado para aumentar a eficiência da produção e otimizar as operações no setor farmacêutico. A implementação substituiu sistemas legados por uma solução ERP moderna, com ênfase em automação, rastreabilidade, conformidade e melhor planejamento da produção, visando uma manufatura mais inteligente e o cumprimento das normas regulatórias.
- Em setembro de 2025, a Acumatica lançou uma interface de usuário redesenhada, ferramentas de IA integradas e melhorias específicas para o setor. Os principais recursos incluem reconhecimento de faturas com IA, suporte a múltiplos EINs (Número de Identificação do Empregador) e funcionalidade aprimorada do portal do cliente.
- Em março de 2025, a Acumatica lançou sua atualização mais recente, apresentando usabilidade aprimorada, automação orientada por IA e inovações específicas para cada setor. A versão 2025 R1 introduziu fluxos de trabalho simplificados e melhorias significativas nos módulos de manufatura, distribuição, varejo e construção, juntamente com novos recursos baseados em IA para detecção de anomalias e reconhecimento de documentos.
SKU-
Obtenha acesso online ao relatório sobre a primeira nuvem de inteligência de mercado do mundo

- Painel interativo de análise de dados
- Painel de análise da empresa para oportunidades de elevado potencial de crescimento
- Acesso de analista de pesquisa para personalização e customização. consultas
- Análise da concorrência com painel interativo
- Últimas notícias, atualizações e atualizações Análise de tendências
- Aproveite o poder da análise de benchmark para um rastreio abrangente da concorrência
Índice
1 INTRODUÇÃO
1.1 OBJETIVOS DO ESTUDO
1.2 DEFINIÇÃO DE MERCADO
1.3 VISÃO GERAL DO MERCADO DE ERP NA ÁSIA-PACÍFICO
1.4 LIMITAÇÕES
1,5 MERCADOS COBERTOS
2. SEGMENTAÇÃO DE MERCADO
2.1 MERCADOS ABRANGIDOS
2.2 ÂMBITO GEOGRÁFICO
2,3 ANOS CONSIDERADOS PARA O ESTUDO
2.4 MOEDA E PREÇOS
2.5 Modelo de Validação de Dados Tripé DBMR
2.6 MODELAGEM MULTIVARIADA
2.7 ENTREVISTAS PRIMÁRIAS COM PRINCIPAIS LÍDERES DE OPINIÃO
2.8 MOLDE DE POSIÇÃO DE MERCADO DBMR
2.9 ANÁLISE DA PARTICIPAÇÃO DE MERCADO DOS FORNECEDORES DA DBMR
2.1 MOLDE DE COBERTURA DO USUÁRIO FINAL DO MERCADO
2.11 FONTES SECUNDÁRIAS
2.12 PRESSUPOSTOS
3 RESUMO EXECUTIVO
4 INFORMAÇÕES PREMIUM
4.1 ANÁLISE DAS CINCO FORÇAS DE PORTER
4.1.1 AMEAÇA DE NOVOS CONCORRENTES
4.1.2 PODER DE NEGOCIAÇÃO DOS FORNECEDORES
4.1.3 PODER DE NEGOCIAÇÃO DOS COMPRADORES
4.1.4 AMEAÇA DE PRODUTOS SUBSTITUTOS
4.1.5 RIVALIDADE NA INDÚSTRIA
4.2 ANÁLISE COMPARATIVA DE EMPRESAS
4.3 MATRIZ DA PLATAFORMA DE SERVIÇOS DA EMPRESA: ANÁLISE
4.4 COMPORTAMENTO DO CONSUMIDOR
4.4.1 PADRÃO DE COMPRA
4.4.2 ANÁLISE DE USOS
4.5 OPORTUNIDADES DE RECEITA PARA NOVOS NEGÓCIOS E EMPRESAS EMERGENTES NO MERCADO DE ERP DA ÁSIA-PACÍFICO
4.5.1 ERP EM NUVEM COM IA ESPECÍFICA PARA SETOR VERTICAL
4.5.2 ERP PARA PMEs E MICROEMPRESAS COM PRIORIDADE MÓVEL
4.5.3 MONETIZAÇÃO DE ERP ORIENTADA PARA A CONFORMIDADE
4.5.4 ECOSSISTEMAS ERP COMPOSÍVEIS E PLATAFORMAS DE MERCADO
4.5.5 ERP INTEGRADO COM IOT, GÊMEO DIGITAL E ATIVOS
4.5.6 INTEGRAÇÃO DE FINANÇAS EMBUTIDAS E PAGAMENTOS EM TEMPO REAL
4.6 ANÁLISE DA INDÚSTRIA E CENÁRIO FUTURISMO: MERCADO DE ERP NA ÁSIA-PACÍFICO
4.6.1 INTRODUÇÃO:
4.6.1.1 INICIATIVAS NACIONAIS E LIDERADAS PELO GOVERNO
4.6.1.2 IMPACTO E TRANSFORMAÇÃO ESPECÍFICOS DO SETOR
4.6.1.3 SAÚDE
4.6.1.4 ADOÇÃO E PERSONALIZAÇÃO DE TECNOLOGIA
4.6.1.5 ESTUDOS DE CASO
4.6.1.6 BARREIRAS AO USO MAIS AMPLO
4.6.1.7 TRAJETÓRIA E OPORTUNIDADES FUTURAS
4.7 MAPEAMENTO DE PENETRAÇÃO E PERSPECTIVAS DE CRESCIMENTO: MERCADO DE ERP NA ÁSIA-PACÍFICO
4.7.1 PANORAMA DE PENETRAÇÃO ATUAL
4.7.2 DETERMINANTES QUE INFLUENCIAM A PENETRAÇÃO
4.7.3 MAPEAMENTO DE PERSPECTIVAS DE CRESCIMENTO
4.7.4 PERSPECTIVAS FUTURAS
4.7.5 CONCLUSÃO
4.8 RESPOSTAS ESTRATÉGICAS E PERSPECTIVAS DO SETOR
4.9 DIVERSIFICAÇÃO DAS CADEIAS DE SUPRIMENTOS
4.1 APROVEITANDO A LOGÍSTICA AVANÇADA
4.11 DEFESA DE AJUSTES DE POLÍTICAS
4.12 ANÁLISE COMPARATIVA DE MARCAS: MERCADO DE ERP NA ÁSIA-PACÍFICO
4.12.1 DEFESA DE AJUSTES DE POLÍTICAS
4.12.2 RESIDÊNCIA DE DADOS E INTEROPERABILIDADE COM A NUVEM
4.12.3 INCENTIVO E APOIO À ADOÇÃO DE PMEs
4.12.4 PROGRAMAS DE CAPACITAÇÃO E CERTIFICAÇÃO
4.12.5 PADRONIZAÇÃO E INTEROPERABILIDADE
4.13 ANÁLISE DE TECNOLOGIA
4.13.1 KEY TECHNOLOGIES
4.13.2 ADVANCED INNOVATIONS
4.13.3 COMPLEMENTARY TECHNOLOGIES
4.13.4 DIGITAL ENABLEMENT STACK
4.13.5 ADJACENT TECHNOLOGIES
4.13.6 EXPANSION ECOSYSTEM FOR APAC ERP
4.14 COMPREHENSIVE EVALUATION OF ERP USE CASES ACROSS DEPLOYMENT, INTEGRATION, RELIABILITY, AND PERFORMANCE FACTORS
5 TARIFFS & IMPACT ON THE ASIA-PACIFIC ERP MARKET
5.1 OVERVIEW
5.2 TARIFF STRUCTURES
5.3 GLOBAL VS. REGIONAL TARIFF STRUCTURES
5.4 UNITED STATES: ICT TARIFF POLICIES
5.5 EUROPEAN UNION: CROSS-BORDER TARIFF REGULATIONS AND REIMBURSEMENT POLICIES
5.6 ASIA-PACIFIC: GOVERNMENT-IMPOSED TARIFFS ON SERVICES PROVIDED
5.7 EMERGING MARKETS: CHALLENGES IN TARIFF IMPLEMENTATION
5.8 INCREASED COSTS
5.9 SUPPLY CHAIN DISRUPTIONS
5.1 UNCERTAINTY AND INVESTMENT
5.11 IMPACT ON INNOVATION
5.12 COMPETITION AND MARKET DYNAMICS
5.13 EFFECT ON SMALL AND MEDIUM ENTERPRISES (SMES)
5.14 DEPLOYMENT OF TELECOMMUNICATION INFRASTRUCTURE
6 REGULATORY STANDARDS IN ASIA-PACIFIC ERP MARKET
6.1 QUALITY MANAGEMENT AND CERTIFICATION STANDARDS
6.2 MANUFACTURING AND TESTING REQUIREMENTS
6.3 ENVIRONMENTAL AND ENERGY EFFICIENCY REGULATIONS
6.4 SAFETY AND OPERATIONAL STANDARDS
6.5 REGIONAL COMPLIANCE CONSIDERATIONS
6.6 CONCLUSION
7 MARKET OVERVIEW
7.1 DRIVERS
7.1.1 INCREASING ADOPTION OF CLOUD-BASED ERP
7.1.2 RISING DEMAND FOR CUSTOMER-CENTRIC PROCESSES AND EXPERIENCE
7.1.3 ADOPTION OF MODULAR AND COMPOSABLE ERP ARCHITECTURES FOR FLEXIBILITY
7.1.4 DEVELOPMENT OF INDUSTRY-SPECIFIC ERP SOLUTIONS
7.2 RESTRAINTS
7.2.1 CYBERSECURITY AND DATA PRIVACY CONCERNS IN CLOUD ENVIRONMENTS
7.2.2 HIGH IMPLEMENTATION AND CUSTOMIZATION COSTS, ESPECIALLY FOR LARGE ENTERPRISES
7.3 OPPORTUNITIES
7.3.1 GROWTH OF MOBILE ERP PLATFORMS ENABLING REMOTE WORKFORCE CONNECTIVITY
7.3.2 INCREASED ADOPTION OF ARTIFICIAL INTELLIGENCE AND MACHINE LEARNING TECHNOLOGIES
7.3.3 INCREASING DEMAND FROM SMALL AND MEDIUM ENTERPRISES SEEKING AFFORDABLE, MODULAR ERP SYSTEMS
7.4 CHALLENGES
7.4.1 LACK OF SKILLED ERP PROFESSIONALS AND USER TRAINING CHALLENGES
7.4.2 COMPLEXITY OF INTEGRATION WITH EXISTING SYSTEMS
8 ASIA-PACIFIC ERP MARKET, BY OFFERING
8.1 OVERVIEW
8.2 SOLUTION
8.3 SERVICES
9 ASIA-PACIFIC ERP MARKET, BY DEPLOYMENT MODE
9.1 OVERVIEW
9.2 CLOUD/MULTI CLOUD
9.3 ON-PREMISE
9.4 HYBRID
9.5 TWO-TIER
10 ASIA-PACIFIC ERP MARKET, BY ENTERPRISE SIZE
10.1 OVERVIEW
10.2 LARGE ENTERPRISE
10.3 SMALL & MEDIUM ENTERPRISE
11 ASIA-PACIFIC ERP MARKET, BY PRICING
11.1 OVERVIEW
11.2 SUBSCRIPTION-BASED
11.3 ONE-TIME LICENSE
11.4 FREEMIUM
11.5 OTHERS
12 ASIA-PACIFIC ERP MARKET, BY END USER
12.1 OVERVIEW
12.2 MANUFACTURING
12.3 RETAIL
12.4 BFSI
12.5 HEALTHCARE
12.6 IT & TELECOMMUNICATIONS
12.7 GOVERNMENT
12.8 ENERGY & UTILITIES
12.9 LOGISTICS
12.1 EDUCATION
12.11 AEROSPACE & DEFENSE
12.12 OTHERS
13 ASIA-PACIFIC ERP MARKET, BY COUNTRY
13.1 ASIA PACIFIC
13.1.1 CHINA
13.1.2 JAPAN
13.1.3 INDIA
13.1.4 SOUTH KOREA
13.1.5 AUSTRALIA
13.1.6 INDONESIA
13.1.7 SINGAPORE
13.1.8 THAILAND
13.1.9 MALAYSIA
13.1.10 VIETNAM
13.1.11 TAIWAN
13.1.12 HONG KONG
13.1.13 PHILIPPINES
13.1.14 NEW ZEALAND
13.1.15 REST OF ASIA-PACIFIC
14 MERCADO DE ERP NA ÁSIA-PACÍFICO, PANORAMA DAS EMPRESAS
14.1 ANÁLISE DAS AÇÕES DA EMPRESA: ÁSIA-PACÍFICO
15 ANÁLISE SWOT
16 PERFIL DA EMPRESA
16.1 MICROSOFT
16.1.1 PERFIL DA EMPRESA
16.1.2 ANÁLISE DE RECEITAS
16.1.3 PORTFÓLIO DE PRODUTOS
16.1.4 DESENVOLVIMENTOS RECENTES
16.2 ORACLE
16.2.1 PERFIL DA EMPRESA
16.2.2 ANÁLISE DE RECEITAS
16.2.3 PORTFÓLIO DE PRODUTOS
16.2.4 DESENVOLVIMENTOS RECENTES
16.3 SAP SE
16.3.1 PERFIL DA EMPRESA
16.3.2 ANÁLISE DE RECEITAS
16.3.3 PORTFÓLIO DE PRODUTOS
16.3.4 DESENVOLVIMENTOS RECENTES
16.4 WORKDAY, INC.
16.4.1 PERFIL DA EMPRESA
16.4.2 ANÁLISE DE RECEITAS
16.4.3 PORTFÓLIO DE PRODUTOS
16.4.4 DESENVOLVIMENTOS RECENTES
16.5 INFORMAÇÕES
16.5.1 PERFIL DA EMPRESA
16.5.2 PORTFÓLIO DE PRODUTOS
16.5.3 DESENVOLVIMENTOS RECENTES
16.6 ACUMATICA, INC.
16.6.1 PERFIL DA EMPRESA
16.6.2 PORTFÓLIO DE PRODUTOS
16.6.3 DESENVOLVIMENTOS RECENTES
16.7 SOFTWARE BATCHMASTER
16.7.1 PERFIL DA EMPRESA
16.7.2 PORTFÓLIO DE PRODUTOS
16.7.3 DESENVOLVIMENTOS RECENTES
16.8 DELTEK, INC.
16.8.1 PERFIL DA EMPRESA
16.8.2 PORTFÓLIO DE PRODUTOS
16.8.3 DESENVOLVIMENTOS RECENTES
16.9 DESKERA
16.9.1 PERFIL DA EMPRESA
16.9.2 PORTFÓLIO DE PRODUTOS
16.9.3 DESENVOLVIMENTOS RECENTES
16.1 EPICOR SOFTWARE CORPORATION
16.10.1 PERFIL DA EMPRESA
16.10.2 PORTFÓLIO DE PRODUTOS
16.10.3 DESENVOLVIMENTOS RECENTES
16.11 EXATO
16.11.1 PERFIL DA EMPRESA
16.11.2 PORTFÓLIO DE PRODUTOS
16.11.3 DESENVOLVIMENTOS RECENTES
16.12 FOCUS SOFTNET PVT LTD
16.12.1 PERFIL DA EMPRESA
16.12.2 PORTFÓLIO DE PRODUTOS
16.12.3 DESENVOLVIMENTOS RECENTES
16.13 HASHMICRO
16.13.1 PERFIL DA EMPRESA
16.13.2 PORTFÓLIO DE PRODUTOS
16.13.3 DESENVOLVIMENTOS RECENTES
16.14 ODOO
16.14.1 PERFIL DA EMPRESA
16.14.2 PORTFÓLIO DE PRODUTOS
16.14.3 DESENVOLVIMENTOS RECENTES
16.15 QAD INC.
16.15.1 PERFIL DA EMPRESA
16.15.2 PORTFÓLIO DE PRODUTOS
16.15.3 DESENVOLVIMENTOS RECENTES
16.16 RAMCO SYSTEMS
16.16.1 PERFIL DA EMPRESA
16.16.2 ANÁLISE DE RECEITAS
16.16.3 PORTFÓLIO DE PRODUTOS
16.16.4 DESENVOLVIMENTOS RECENTES
16.17 SAGE GROUP PLC
16.17.1 PERFIL DA EMPRESA
16.17.2 ANÁLISE DE RECEITAS
16.17.3 PORTFÓLIO DE PRODUTOS
16.17.4 DESENVOLVIMENTOS RECENTES
16.18 SYSPRO
16.18.1 PERFIL DA EMPRESA
16.18.2 PORTFÓLIO DE PRODUTOS
16.18.3 DESENVOLVIMENTOS RECENTES
16.19 TALLY SOLUTIONS PRIVATE LIMITED
16.19.1 PERFIL DA EMPRESA
16.19.2 PORTFÓLIO DE PRODUTOS
16.19.3 DESENVOLVIMENTOS RECENTES
16.2 ZOHO CORPORATION PVT. LTD.
16.20.1 PERFIL DA EMPRESA
16.20.2 PORTFÓLIO DE PRODUTOS
16.20.3 DESENVOLVIMENTOS RECENTES
17 QUESTIONÁRIO
18 RELATÓRIOS RELACIONADOS
Lista de Tabela
TABELA 1 ANÁLISE COMPARATIVA DAS EMPRESAS
TABELA 2 MATRIZ DA PLATAFORMA DE SERVIÇOS DA EMPRESA
TABELA 3 ANÁLISE COMPARATIVA DAS PRINCIPAIS MARCAS DE ERP NO MERCADO DA ÁSIA-PACÍFICO
TABELA 4 MATRIZ TECNOLÓGICA DO MERCADO DE ERP DA ÁSIA-PACÍFICO
TABELA 5 ANÁLISE DE CASOS UTILIZADOS
TABELA 6 MERCADO DE ERP NA ÁSIA-PACÍFICO, POR OFERTA, 2018-2032 (EM MILHARES DE USD)
TABELA 7 SOLUÇÕES DE ERP NA ÁSIA-PACÍFICO, POR TIPO, 2018-2032 (EM MILHARES DE USD)
TABELA 8 SERVIÇOS DA ÁSIA-PACÍFICO NO MERCADO DE ERP, POR TIPO, 2018-2032 (EM MILHARES DE USD)
TABELA 9 SERVIÇOS PROFISSIONAIS NO MERCADO DE ERP DA ÁSIA-PACÍFICO, POR TIPO, 2018-2032 (EM MILHARES DE USD)
TABELA 10 MERCADO DE ERP NA ÁSIA-PACÍFICO, POR MODO DE IMPLANTAÇÃO, 2018-2032 (EM MILHARES DE USD)
TABELA 11 MERCADO DE ERP EM NUVEM/MULTI-NUVEM NA ÁSIA-PACÍFICO, POR TIPO, 2018-2032 (EM MILHARES DE USD)
TABELA 12 MERCADO DE ERP NA ÁSIA-PACÍFICO, POR TAMANHO DA EMPRESA, 2018-2032 (EM MILHARES DE DÓLARES AMERICANOS)
TABELA 13 MERCADO DE ERP PARA GRANDES EMPRESAS NA ÁSIA-PACÍFICO, POR MODO DE IMPLANTAÇÃO, 2018-2032 (EM MILHARES DE USD)
TABELA 14 MERCADO DE ERP EM NUVEM/MULTI NUVEM NA ÁSIA-PACÍFICO, POR TIPO, 2018-2032 (EM MILHARES DE USD)
TABELA 15 MERCADO DE ERP NA ÁSIA-PACÍFICO, POR PREÇOS, 2018-2032 (EM MILHARES DE USD)
TABELA 16 MERCADO DE ERP COM BASE EM ASSINATURAS NA ÁSIA-PACÍFICO, POR TIPO, 2018-2032 (EM MILHARES DE USD)
TABELA 17 MERCADO DE ERP NA ÁSIA-PACÍFICO, POR USUÁRIO FINAL, 2018-2032 (EM MILHARES DE USD)
TABELA 18 MERCADO DE FABRICAÇÃO NA ÁSIA-PACÍFICO EM ERP, POR APLICAÇÃO, 2018-2032 (EM MILHARES DE USD)
TABELA 19 FABRICAÇÃO NA ÁSIA-PACÍFICO NO MERCADO DE ERP, POR MODO DE IMPLANTAÇÃO, 2018-2032 (EM MILHARES DE USD)
TABELA 20 MERCADO DE ERP EM NUVEM/MULTI-NUVEM NA ÁSIA-PACÍFICO, POR TIPO, 2018-2032 (EM MILHARES DE USD)
TABELA 21 MERCADO DE VAREJO NA ÁSIA-PACÍFICO COM ERP, POR APLICAÇÃO, 2018-2032 (EM MILHARES DE USD)
TABELA 22 VAREJO DA ÁSIA-PACÍFICO NO MERCADO DE ERP, POR MODO DE IMPLANTAÇÃO, 2018-2032 (EM MILHARES DE USD)
TABELA 23 MERCADO DE ERP EM NUVEM/MULTI-NUVEM NA ÁSIA-PACÍFICO, POR TIPO, 2018-2032 (EM MILHARES DE USD)
TABELA 24 MERCADO DE ERP NO SETOR DE FINANÇAS, SERVIÇOS E INVESTIMENTOS DE RENDA NA ÁSIA-PACÍFICO, POR APLICAÇÃO, 2018-2032 (EM MILHARES DE DÓLARES AMERICANOS)
TABELA 25 MERCADO DE ERP NO SETOR DE SERVIÇOS FINANCEIROS, BANCÁRIO E DE BANCOS E INVESTIMENTOS NA ÁSIA-PACÍFICO, POR MODO DE IMPLANTAÇÃO, 2018-2032 (EM MILHARES DE USD)
TABELA 26 MERCADO DE ERP EM NUVEM/MULTI-NUVEM NA ÁSIA-PACÍFICO, POR TIPO, 2018-2032 (EM MILHARES DE USD)
TABELA 27 MERCADO DE ERP NA ÁSIA-PACÍFICO PARA O SETOR DE SAÚDE, POR APLICAÇÃO, 2018-2032 (EM MILHARES DE DÓLARES AMERICANOS)
TABELA 28 MERCADO DE ERP NA ÁSIA-PACÍFICO PARA O SETOR DE SAÚDE, POR MODO DE IMPLANTAÇÃO, 2018-2032 (EM MILHARES DE USD)
TABELA 29 MERCADO DE ERP EM NUVEM/MULTI-NUVEM NA ÁSIA-PACÍFICO, POR TIPO, 2018-2032 (EM MILHARES DE USD)
TABELA 30 MERCADO DE TI E TELECOMUNICAÇÕES EM ERP NA ÁSIA-PACÍFICO, POR APLICAÇÃO, 2018-2032 (EM MILHARES DE USD)
TABELA 31 MERCADO DE TI E TELECOMUNICAÇÕES EM ERP NA ÁSIA-PACÍFICO, POR MODO DE IMPLANTAÇÃO, 2018-2032 (EM MILHARES DE USD)
TABELA 32 MERCADO DE ERP EM NUVEM/MULTI-NUVEM NA ÁSIA-PACÍFICO, POR TIPO, 2018-2032 (EM MILHARES DE USD)
TABELA 33 GOVERNO DA ÁSIA-PACÍFICO NO MERCADO DE ERP, POR APLICAÇÃO, 2018-2032 (EM MILHARES DE USD)
TABELA 34 GOVERNO DA ÁSIA-PACÍFICO NO MERCADO DE ERP, POR MODO DE IMPLANTAÇÃO, 2018-2032 (EM MILHARES DE USD)
TABELA 35 MERCADO DE ERP EM NUVEM/MULTI-NUVEM NA ÁSIA-PACÍFICO, POR TIPO, 2018-2032 (EM MILHARES DE USD)
TABELA 36 MERCADO DE ENERGIA E SERVIÇOS PÚBLICOS NA ÁSIA-PACÍFICO EM ERP, POR APLICAÇÃO, 2018-2032 (EM MILHARES DE USD)
TABELA 37 VAREJO DA ÁSIA-PACÍFICO NO MERCADO DE ERP, POR MODO DE IMPLANTAÇÃO, 2018-2032 (EM MILHARES DE USD)
TABELA 38 MERCADO DE ERP EM NUVEM/MULTI-NUVEM NA ÁSIA-PACÍFICO, POR TIPO, 2018-2032 (EM MILHARES DE USD)
TABELA 39 MERCADO DE LOGÍSTICA EM ERP NA ÁSIA-PACÍFICO, POR APLICAÇÃO, 2018-2032 (EM MILHARES DE USD)
TABELA 40 MERCADO DE LOGÍSTICA ERP NA ÁSIA-PACÍFICO, POR MODO DE IMPLANTAÇÃO, 2018-2032 (EM MILHARES DE USD)
TABELA 41 MERCADO DE ERP EM NUVEM/MULTI NUVEM NA ÁSIA-PACÍFICO, POR TIPO, 2018-2032 (EM MILHARES DE USD)
TABELA 42 MERCADO DE EDUCAÇÃO EM ERP NA ÁSIA-PACÍFICO, POR APLICAÇÃO, 2018-2032 (EM MILHARES DE USD)
TABELA 43 MERCADO DE EDUCAÇÃO EM ERP NA ÁSIA-PACÍFICO, POR MODO DE IMPLANTAÇÃO, 2018-2032 (EM MILHARES DE USD)
TABELA 44 MERCADO DE ERP EM NUVEM/MULTI-NUVEM NA ÁSIA-PACÍFICO, POR TIPO, 2018-2032 (EM MILHARES DE USD)
TABELA 45 MERCADO DE ERP DA ÁSIA-PACÍFICO: AERONÁUTICA E DEFESA, POR APLICAÇÃO, 2018-2032 (EM MILHARES DE USD)
TABELA 46 MERCADO DE AEROESPACIAL E DEFESA DA ÁSIA-PACÍFICO NO ERP, POR MODO DE IMPLANTAÇÃO, 2018-2032 (EM MILHARES DE USD)
TABELA 47 MERCADO DE ERP EM NUVEM/MULTI-NUVEM NA ÁSIA-PACÍFICO, POR TIPO, 2018-2032 (EM MILHARES DE USD)
TABELA 48 OUTROS NO MERCADO DE ERP DA ÁSIA-PACÍFICO, POR MODO DE IMPLANTAÇÃO, 2018-2032 (EM MILHARES DE USD)
TABELA 49 MERCADO DE ERP EM NUVEM/MULTI-NUVEM NA ÁSIA-PACÍFICO, POR TIPO, 2018-2032 (EM MILHARES DE USD)
TABELA 50 MERCADO DE ERP NA ÁSIA-PACÍFICO, POR PAÍS, 2018-2032 (EM MILHARES DE USD)
TABELA 51 MERCADO DE ERP NA CHINA, POR OFERTA, 2018-2032 (EM MILHARES DE USD)
TABELA 52 SOLUÇÕES CHINESAS NO MERCADO DE ERP, POR TIPO, 2018-2032 (EM MILHARES DE USD)
TABELA 53 SERVIÇOS DA CHINA NO MERCADO DE ERP, POR TIPO, 2018-2032 (EM MILHARES DE USD)
TABELA 54 SERVIÇOS PROFISSIONAIS NA CHINA NO MERCADO DE ERP, POR TIPO, 2018-2032 (EM MILHARES DE USD)
TABELA 55 MERCADO DE ERP NA CHINA, POR MODO DE IMPLANTAÇÃO, 2018-2032 (EM MILHARES DE USD)
TABELA 56 MERCADO DE ERP EM NUVEM/MULTI NUVEM NA CHINA, POR TIPO, 2018-2032 (EM MILHARES DE USD)
TABELA 57 MERCADO DE ERP NA CHINA, POR TAMANHO DA EMPRESA, 2018-2032 (EM MILHARES DE USD)
TABELA 58 MERCADO DE ERP PARA GRANDES EMPRESAS NA CHINA, POR MODO DE IMPLANTAÇÃO, 2018-2032 (EM MILHARES DE USD)
TABELA 59 MERCADO DE ERP EM NUVEM/MULTI NUVEM NA CHINA, POR TIPO, 2018-2032 (EM MILHARES DE USD)
TABELA 60 MERCADO DE ERP NA CHINA, POR PREÇOS, 2018-2032 (EM MILHARES DE USD)
TABELA 61 MERCADO DE ERP NA CHINA COM BASE EM ASSINATURAS, POR TIPO, 2018-2032 (EM MILHARES DE USD)
TABELA 62 MERCADO DE ERP NA CHINA, POR USUÁRIO FINAL, 2018-2032 (EM MILHARES DE USD)
TABELA 63 MERCADO DE ERP PARA FABRICAÇÃO NA CHINA, POR APLICAÇÃO, 2018-2032 (EM MILHARES DE USD)
TABELA 64 FABRICAÇÃO CHINESA NO MERCADO DE ERP, POR MODO DE IMPLANTAÇÃO, 2018-2032 (EM MILHARES DE USD)
TABELA 65 MERCADO DE ERP EM NUVEM/MULTI NUVEM NA CHINA, POR TIPO, 2018-2032 (EM MILHARES DE USD)
TABELA 66 MERCADO DE ERP PARA VAREJO NA CHINA, POR APLICAÇÃO, 2018-2032 (EM MILHARES DE USD)
TABELA 67 VAREJO CHINÊS NO MERCADO DE ERP, POR MODO DE IMPLANTAÇÃO, 2018-2032 (EM MILHARES DE USD)
TABELA 68 MERCADO DE ERP EM NUVEM/MULTI NUVEM NA CHINA, POR TIPO, 2018-2032 (EM MILHARES DE USD)
TABELA 69 MERCADO DE ERP PARA O SETOR BFSI NA CHINA, POR APLICAÇÃO, 2018-2032 (EM MILHARES DE USD)
TABELA 70 MERCADO DE ERP DO SETOR BFSI DA CHINA, POR MODO DE IMPLANTAÇÃO, 2018-2032 (EM MILHARES DE USD)
TABELA 71 MERCADO DE ERP EM NUVEM/MULTI NUVEM NA CHINA, POR TIPO, 2018-2032 (EM MILHARES DE USD)
TABELA 72 MERCADO DE ERP PARA SAÚDE NA CHINA, POR APLICAÇÃO, 2018-2032 (EM MILHARES DE USD)
TABELA 73 MERCADO DE ERP NA CHINA PARA O SETOR DE SAÚDE, POR MODO DE IMPLANTAÇÃO, 2018-2032 (EM MILHARES DE USD)
TABELA 74 MERCADO DE ERP EM NUVEM/MULTI NUVEM NA CHINA, POR TIPO, 2018-2032 (EM MILHARES DE USD)
TABELA 75 MERCADO DE ERP DE TI E TELECOMUNICAÇÕES NA CHINA, POR APLICAÇÃO, 2018-2032 (EM MILHARES DE USD)
TABELA 76 MERCADO DE TI E TELECOMUNICAÇÕES DA CHINA EM ERP, POR MODO DE IMPLANTAÇÃO, 2018-2032 (EM MILHARES DE USD)
TABELA 77 MERCADO DE ERP EM NUVEM/MULTI NUVEM NA CHINA, POR TIPO, 2018-2032 (EM MILHARES DE USD)
TABELA 78 MERCADO DE ERP GOVERNAMENTAL CHINÊS, POR APLICAÇÃO, 2018-2032 (EM MILHARES DE USD)
TABELA 79 PARTICIPAÇÃO DO GOVERNO CHINÊS NO MERCADO DE ERP, POR MODO DE IMPLANTAÇÃO, 2018-2032 (EM MILHARES DE USD)
TABELA 80 MERCADO DE ERP EM NUVEM/MULTI NUVEM NA CHINA, POR TIPO, 2018-2032 (EM MILHARES DE USD)
TABELA 81 MERCADO DE ERP DE ENERGIA E SERVIÇOS PÚBLICOS DA CHINA, POR APLICAÇÃO, 2018-2032 (EM MILHARES DE USD)
TABELA 82 MERCADO DE ENERGIA E SERVIÇOS PÚBLICOS DA CHINA EM ERP, POR MODO DE IMPLANTAÇÃO, 2018-2032 (EM MILHARES DE USD)
TABELA 83 MERCADO DE ERP EM NUVEM/MULTI NUVEM NA CHINA, POR TIPO, 2018-2032 (EM MILHARES DE USD)
TABELA 84 MERCADO DE ERP DE LOGÍSTICA NA CHINA, POR APLICAÇÃO, 2018-2032 (EM MILHARES DE USD)
TABELA 85 LOGÍSTICA DA CHINA NO MERCADO DE ERP, POR MODO DE IMPLANTAÇÃO, 2018-2032 (EM MILHARES DE USD)
TABELA 86 MERCADO DE ERP EM NUVEM/MULTI NUVEM NA CHINA, POR TIPO, 2018-2032 (EM MILHARES DE USD)
TABELA 87 MERCADO DE ERP PARA EDUCAÇÃO NA CHINA, POR APLICAÇÃO, 2018-2032 (EM MILHARES DE USD)
TABELA 88 EDUCAÇÃO NA CHINA NO MERCADO DE ERP, POR MODO DE IMPLANTAÇÃO, 2018-2032 (EM MILHARES DE USD)
TABELA 89 MERCADO DE ERP EM NUVEM/MULTI NUVEM NA CHINA, POR TIPO, 2018-2032 (EM MILHARES DE USD)
TABELA 90 MERCADO DE ERP PARA OS SETOR AEROESPACIAL E DE DEFESA DA CHINA, POR APLICAÇÃO, 2018-2032 (EM MILHARES DE USD)
TABELA 91 MERCADO DE AEROESPACIAL E DEFESA DA CHINA EM ERP, POR MODO DE IMPLANTAÇÃO, 2018-2032 (EM MILHARES DE USD)
TABELA 92 MERCADO DE ERP EM NUVEM/MULTI NUVEM NA CHINA, POR TIPO, 2018-2032 (EM MILHARES DE USD)
TABELA 93 CHINA E OUTROS NO MERCADO DE ERP, POR MODO DE IMPLANTAÇÃO, 2018-2032 (EM MILHARES DE USD)
TABELA 94 MERCADO DE ERP EM NUVEM/MULTI NUVEM NA CHINA, POR TIPO, 2018-2032 (EM MILHARES DE USD)
TABELA 95 MERCADO DE ERP NO JAPÃO, POR OFERTA, 2018-2032 (EM MILHARES DE USD)
TABELA 96 SOLUÇÕES JAPONESAS NO MERCADO DE ERP, POR TIPO, 2018-2032 (EM MILHARES DE USD)
TABELA 97 SERVIÇOS NO MERCADO DE ERP DO JAPÃO, POR TIPO, 2018-2032 (EM MILHARES DE USD)
TABELA 98 SERVIÇOS PROFISSIONAIS NO MERCADO DE ERP DO JAPÃO, POR TIPO, 2018-2032 (EM MILHARES DE USD)
TABELA 99 MERCADO DE ERP NO JAPÃO, POR MODO DE IMPLANTAÇÃO, 2018-2032 (EM MILHARES DE USD)
TABELA 100 MERCADO DE ERP EM NUVEM/MULTI-NUVEM NO JAPÃO, POR TIPO, 2018-2032 (EM MILHARES DE USD)
TABELA 101 MERCADO DE ERP NO JAPÃO, POR TAMANHO DA EMPRESA, 2018-2032 (EM MILHARES DE USD)
TABELA 102 MERCADO DE ERP PARA GRANDES EMPRESAS NO JAPÃO, POR MODO DE IMPLANTAÇÃO, 2018-2032 (EM MILHARES DE USD)
TABELA 103 MERCADO DE ERP EM NUVEM/MULTI-NUVEM NO JAPÃO, POR TIPO, 2018-2032 (EM MILHARES DE USD)
TABELA 104 MERCADO DE ERP NO JAPÃO, POR PREÇOS, 2018-2032 (EM MILHARES DE USD)
TABELA 105 MERCADO DE ERP NO JAPÃO, POR TIPO (BASEADO EM ASSINATURAS), 2018-2032 (EM MILHARES DE DÓLARES AMERICANOS)
TABELA 106 MERCADO DE ERP NO JAPÃO, POR USUÁRIO FINAL, 2018-2032 (EM MILHARES DE USD)
TABELA 107 MERCADO DE ERP PARA FABRICAÇÃO NO JAPÃO, POR APLICAÇÃO, 2018-2032 (EM MILHARES DE USD)
TABELA 108 FABRICAÇÃO JAPONESA NO MERCADO DE ERP, POR MODO DE IMPLANTAÇÃO, 2018-2032 (EM MILHARES DE USD)
TABELA 109 MERCADO DE ERP EM NUVEM/MULTI-NUVEM NO JAPÃO, POR TIPO, 2018-2032 (EM MILHARES DE USD)
TABELA 110 MERCADO DE ERP PARA VAREJO NO JAPONÊS, POR APLICAÇÃO, 2018-2032 (EM MILHARES DE USD)
TABELA 111 VAREJO JAPONÊS NO MERCADO DE ERP, POR MODO DE IMPLANTAÇÃO, 2018-2032 (EM MILHARES DE USD)
TABELA 112 MERCADO DE ERP EM NUVEM/MULTI-NUVEM NO JAPÃO, POR TIPO, 2018-2032 (EM MILHARES DE USD)
TABELA 113 MERCADO DE ERP PARA O SETOR BFSI NO JAPÃO, POR APLICAÇÃO, 2018-2032 (EM MILHARES DE USD)
TABELA 114 MERCADO DE ERP DO BANCO, FINANCEIROS E SEGUROS DE INFUSÃO NO JAPÃO, POR MODO DE IMPLANTAÇÃO, 2018-2032 (EM MILHARES DE USD)
TABELA 115 MERCADO DE ERP EM NUVEM/MULTI-NUVEM NO JAPÃO, POR TIPO, 2018-2032 (EM MILHARES DE USD)
TABELA 116 MERCADO DE ERP PARA O SETOR DE SAÚDE NO JAPÃO, POR APLICAÇÃO, 2018-2032 (EM MILHARES DE DÓLARES AMERICANOS)
TABELA 117 MERCADO DE ERP NO JAPÃO, POR MODO DE IMPLANTAÇÃO, 2018-2032 (EM MILHARES DE USD)
TABELA 118 MERCADO DE ERP EM NUVEM/MULTI-NUVEM NO JAPÃO, POR TIPO, 2018-2032 (EM MILHARES DE USD)
TABELA 119 MERCADO DE ERP DE TI E TELECOMUNICAÇÕES NO JAPÃO, POR APLICAÇÃO, 2018-2032 (EM MILHARES DE USD)
TABELA 120 MERCADO DE TI E TELECOMUNICAÇÕES NO JAPÃO EM ERP, POR MODO DE IMPLANTAÇÃO, 2018-2032 (EM MILHARES DE USD)
TABELA 121 MERCADO DE ERP EM NUVEM/MULTI-NUVEM NO JAPÃO, POR TIPO, 2018-2032 (EM MILHARES DE USD)
TABELA 122 MERCADO DE ERP GOVERNAMENTAL JAPONÊS, POR APLICAÇÃO, 2018-2032 (EM MILHARES DE USD)
TABELA 123 PARTICIPAÇÃO DO GOVERNO JAPONÊS NO MERCADO DE ERP, POR MODO DE IMPLANTAÇÃO, 2018-2032 (EM MILHARES DE USD)
TABELA 124 MERCADO DE ERP EM NUVEM/MULTI NUVEM NO JAPÃO, POR TIPO, 2018-2032 (EM MILHARES DE USD)
TABELA 125 MERCADO DE ERP DE ENERGIA E SERVIÇOS PÚBLICOS NO JAPÃO, POR APLICAÇÃO, 2018-2032 (EM MILHARES DE USD)
TABELA 126 MERCADO DE ENERGIA E SERVIÇOS PÚBLICOS NO JAPÃO COM ERP, POR MODO DE IMPLANTAÇÃO, 2018-2032 (EM MILHARES DE USD)
TABELA 127 MERCADO DE ERP EM NUVEM/MULTI-NUVEM NO JAPÃO, POR TIPO, 2018-2032 (EM MILHARES DE USD)
TABELA 128 MERCADO DE ERP DE LOGÍSTICA NO JAPÃO, POR APLICAÇÃO, 2018-2032 (EM MILHARES DE USD)
TABELA 129 LOGÍSTICA NO MERCADO DE ERP DO JAPÃO, POR MODO DE IMPLANTAÇÃO, 2018-2032 (EM MILHARES DE USD)
TABELA 130 MERCADO DE ERP EM NUVEM/MULTI-NUVEM NO JAPÃO, POR TIPO, 2018-2032 (EM MILHARES DE USD)
TABELA 131 MERCADO DE ERP PARA EDUCAÇÃO NO JAPÃO, POR APLICAÇÃO, 2018-2032 (EM MILHARES DE USD)
TABELA 132 EDUCAÇÃO NO MERCADO DE ERP NO JAPÃO, POR MODO DE IMPLANTAÇÃO, 2018-2032 (EM MILHARES DE USD)
TABELA 133 MERCADO DE ERP EM NUVEM/MULTI-NUVEM NO JAPÃO, POR TIPO, 2018-2032 (EM MILHARES DE USD)
TABELA 134 MERCADO DE ERP PARA OS SETOR AEROESPACIAL E DE DEFESA DO JAPÃO, POR APLICAÇÃO, 2018-2032 (EM MILHARES DE USD)
TABELA 135 MERCADO DE AEROESPACIAL E DEFESA DO JAPÃO NO ERP, POR MODO DE IMPLANTAÇÃO, 2018-2032 (EM MILHARES DE USD)
TABELA 136 MERCADO DE ERP EM NUVEM/MULTI-NUVEM NO JAPÃO, POR TIPO, 2018-2032 (EM MILHARES DE USD)
TABELA 137 JAPÃO OUTROS NO MERCADO DE ERP, POR MODO DE IMPLANTAÇÃO, 2018-2032 (EM MILHARES DE USD)
TABELA 138 MERCADO DE ERP EM NUVEM/MULTI-NUVEM NO JAPÃO, POR TIPO, 2018-2032 (EM MILHARES DE USD)
TABELA 139 MERCADO DE ERP NA ÍNDIA, POR OFERTA, 2018-2032 (EM MILHARES DE USD)
TABELA 140 SOLUÇÕES NA ÍNDIA NO MERCADO DE ERP, POR TIPO, 2018-2032 (EM MILHARES DE USD)
TABELA 141 SERVIÇOS NA ÍNDIA NO MERCADO DE ERP, POR TIPO, 2018-2032 (EM MILHARES DE USD)
TABELA 142 SERVIÇOS PROFISSIONAIS NA ÍNDIA NO MERCADO DE ERP, POR TIPO, 2018-2032 (EM MILHARES DE USD)
TABELA 143 MERCADO DE ERP NA ÍNDIA, POR MODO DE IMPLANTAÇÃO, 2018-2032 (EM MILHARES DE USD)
TABELA 144 MERCADO DE ERP EM NUVEM/MULTI-NUVEM NA ÍNDIA, POR TIPO, 2018-2032 (EM MILHARES DE USD)
TABELA 145 MERCADO DE ERP NA ÍNDIA, POR TAMANHO DA EMPRESA, 2018-2032 (EM MILHARES DE USD)
TABELA 146 MERCADO DE ERP PARA GRANDES EMPRESAS NA ÍNDIA, POR MODO DE IMPLANTAÇÃO, 2018-2032 (EM MILHARES DE USD)
TABELA 147 MERCADO DE ERP NA ÍNDIA: NUVEM/MULTI-NUVEM, POR TIPO, 2018-2032 (EM MILHARES DE USD)
TABELA 148 MERCADO DE ERP NA ÍNDIA, POR PREÇOS, 2018-2032 (EM MILHARES DE USD)
TABELA 149 MERCADO DE ERP NA ÍNDIA COM BASE EM ASSINATURAS, POR TIPO, 2018-2032 (EM MILHARES DE USD)
TABELA 150 MERCADO DE ERP NA ÍNDIA, POR USUÁRIO FINAL, 2018-2032 (EM MILHARES DE USD)
TABELA 151 MERCADO DE ERP PARA FABRICAÇÃO NA ÍNDIA, POR APLICAÇÃO, 2018-2032 (EM MILHARES DE USD)
TABELA 152 FABRICAÇÃO NA ÍNDIA NO MERCADO DE ERP, POR MODO DE IMPLANTAÇÃO, 2018-2032 (EM MILHARES DE USD)
TABELA 153 MERCADO DE ERP NA ÍNDIA: NUVEM/MULTI-NUVEM, POR TIPO, 2018-2032 (EM MILHARES DE USD)
TABELA 154 MERCADO DE ERP PARA VAREJO NA ÍNDIA, POR APLICAÇÃO, 2018-2032 (EM MILHARES DE USD)
TABELA 155 VAREJO INDIANO NO MERCADO DE ERP, POR MODO DE IMPLANTAÇÃO, 2018-2032 (EM MILHARES DE USD)
TABELA 156 MERCADO DE ERP EM NUVEM/MULTI-NUVEM NA ÍNDIA, POR TIPO, 2018-2032 (EM MILHARES DE USD)
TABELA 157 MERCADO DE ERP PARA O SETOR BFSI NA ÍNDIA, POR APLICAÇÃO, 2018-2032 (EM MILHARES DE USD)
TABELA 158 MERCADO DE ERP NO SETOR BFSI DA ÍNDIA, POR MODO DE IMPLANTAÇÃO, 2018-2032 (EM MILHARES DE USD)
TABELA 159 MERCADO DE ERP EM NUVEM/MULTI-NUVEM NA ÍNDIA, POR TIPO, 2018-2032 (EM MILHARES DE USD)
TABELA 160 MERCADO DE ERP PARA SAÚDE NA ÍNDIA, POR APLICAÇÃO, 2018-2032 (EM MILHARES DE USD)
TABELA 161 MERCADO DE ERP NA ÍNDIA, POR MODO DE IMPLANTAÇÃO, 2018-2032 (EM MILHARES DE USD)
TABELA 162 MERCADO DE ERP NA ÍNDIA: NUVEM/MULTI-NUVEM, POR TIPO, 2018-2032 (EM MILHARES DE USD)
TABELA 163 MERCADO DE ERP DE TI E TELECOMUNICAÇÕES NA ÍNDIA, POR APLICAÇÃO, 2018-2032 (EM MILHARES DE USD)
TABELA 164 MERCADO DE ERP DE TI E TELECOMUNICAÇÕES NA ÍNDIA, POR MODO DE IMPLANTAÇÃO, 2018-2032 (EM MILHARES DE USD)
TABELA 165 MERCADO DE ERP EM NUVEM/MULTI-NUVEM NA ÍNDIA, POR TIPO, 2018-2032 (EM MILHARES DE USD)
TABELA 166 MERCADO DE ERP GOVERNAMENTAL NA ÍNDIA, POR APLICAÇÃO, 2018-2032 (EM MILHARES DE USD)
TABELA 167 GOVERNO DA ÍNDIA NO MERCADO DE ERP, POR MODO DE IMPLANTAÇÃO, 2018-2032 (EM MILHARES DE USD)
TABELA 168 MERCADO DE ERP EM NUVEM/MULTI-NUVEM NA ÍNDIA, POR TIPO, 2018-2032 (EM MILHARES DE USD)
TABELA 169 MERCADO DE ERP DE ENERGIA E SERVIÇOS PÚBLICOS NA ÍNDIA, POR APLICAÇÃO, 2018-2032 (EM MILHARES DE USD)
TABELA 170 MERCADO DE ENERGIA E SERVIÇOS PÚBLICOS NA ÍNDIA EM ERP, POR MODO DE IMPLANTAÇÃO, 2018-2032 (EM MILHARES DE USD)
TABELA 171 MERCADO DE ERP EM NUVEM/MULTI-NUVEM NA ÍNDIA, POR TIPO, 2018-2032 (EM MILHARES DE USD)
TABELA 172 MERCADO DE ERP DE LOGÍSTICA NA ÍNDIA, POR APLICAÇÃO, 2018-2032 (EM MILHARES DE USD)
TABELA 173 LOGÍSTICA NA ÍNDIA NO MERCADO DE ERP, POR MODO DE IMPLANTAÇÃO, 2018-2032 (EM MILHARES DE USD)
TABELA 174 MERCADO DE ERP EM NUVEM/MULTI-NUVEM NA ÍNDIA, POR TIPO, 2018-2032 (EM MILHARES DE USD)
TABELA 175 MERCADO DE ERP PARA EDUCAÇÃO NA ÍNDIA, POR APLICAÇÃO, 2018-2032 (EM MILHARES DE USD)
TABELA 176 EDUCAÇÃO NA ÍNDIA NO MERCADO DE ERP, POR MODO DE IMPLANTAÇÃO, 2018-2032 (EM MILHARES DE USD)
TABELA 177 MERCADO DE ERP NA ÍNDIA: NUVEM/MULTI-NUVEM, POR TIPO, 2018-2032 (EM MILHARES DE USD)
TABELA 178 MERCADO DE ERP PARA OS SETOR AEROESPACIAL E DE DEFESA NA ÍNDIA, POR APLICAÇÃO, 2018-2032 (EM MILHARES DE USD)
TABELA 179 MERCADO DE AEROESPACIAL E DEFESA DA ÍNDIA NO ERP, POR MODO DE IMPLANTAÇÃO, 2018-2032 (EM MILHARES DE USD)
TABELA 180 MERCADO DE ERP EM NUVEM/MULTI-NUVEM NA ÍNDIA, POR TIPO, 2018-2032 (EM MILHARES DE USD)
TABELA 181 ÍNDIA OUTROS NO MERCADO DE ERP, POR MODO DE IMPLANTAÇÃO, 2018-2032 (MILHARES DE USD)
TABELA 182 MERCADO DE ERP EM NUVEM/MULTI-NUVEM NA ÍNDIA, POR TIPO, 2018-2032 (EM MILHARES DE USD)
TABELA 183 MERCADO DE ERP DA COREIA DO SUL, POR OFERTA, 2018-2032 (EM MILHARES DE USD)
TABELA 184 SOLUÇÕES DA COREIA DO SUL NO MERCADO DE ERP, POR TIPO, 2018-2032 (EM MILHARES DE USD)
TABELA 185 SERVIÇOS DA COREIA DO SUL NO MERCADO DE ERP, POR TIPO, 2018-2032 (EM MILHARES DE USD)
TABELA 186 SERVIÇOS PROFISSIONAIS DA COREIA DO SUL NO MERCADO DE ERP, POR TIPO, 2018-2032 (EM MILHARES DE USD)
TABELA 187 MERCADO DE ERP DA COREIA DO SUL, POR MODO DE IMPLANTAÇÃO, 2018-2032 (EM MILHARES DE USD)
TABELA 188 MERCADO DE ERP EM NUVEM/MULTI NUVEM NA COREIA DO SUL, POR TIPO, 2018-2032 (EM MILHARES DE USD)
TABELA 189 MERCADO DE ERP DA COREIA DO SUL, POR TAMANHO DA EMPRESA, 2018-2032 (EM MILHARES DE USD)
TABELA 190 MERCADO DE ERP PARA GRANDES EMPRESAS NA COREIA DO SUL, POR MODO DE IMPLANTAÇÃO, 2018-2032 (EM MILHARES DE USD)
TABELA 191 MERCADO DE ERP EM NUVEM/MULTI NUVEM NA COREIA DO SUL, POR TIPO, 2018-2032 (EM MILHARES DE USD)
TABELA 192 MERCADO DE ERP DA COREIA DO SUL, POR PREÇOS, 2018-2032 (EM MILHARES DE USD)
TABELA 193 MERCADO DE ERP NA COREIA DO SUL COM BASE EM ASSINATURAS, POR TIPO, 2018-2032 (EM MILHARES DE USD)
TABELA 194 MERCADO DE ERP DA COREIA DO SUL, POR USUÁRIO FINAL, 2018-2032 (EM MILHARES DE USD)
TABELA 195 MERCADO DE ERP PARA FABRICAÇÃO NA COREIA DO SUL, POR APLICAÇÃO, 2018-2032 (EM MILHARES DE USD)
TABELA 196 FABRICAÇÃO DA COREIA DO SUL NO MERCADO DE ERP, POR MODO DE IMPLANTAÇÃO, 2018-2032 (EM MILHARES DE USD)
TABELA 197 MERCADO DE ERP EM NUVEM/MULTI NUVEM NA COREIA DO SUL, POR TIPO, 2018-2032 (EM MILHARES DE USD)
TABELA 198 MERCADO DE ERP PARA VAREJO NA COREIA DO SUL, POR APLICAÇÃO, 2018-2032 (EM MILHARES DE USD)
TABELA 199 VAREJO DA COREIA DO SUL NO MERCADO DE ERP, POR MODO DE IMPLANTAÇÃO, 2018-2032 (EM MILHARES DE USD)
TABELA 200 MERCADO DE ERP EM NUVEM/MULTI NUVEM NA COREIA DO SUL, POR TIPO, 2018-2032 (EM MILHARES DE USD)
TABELA 201 MERCADO DE ERP PARA O SETOR BFSI NA COREIA DO SUL, POR APLICAÇÃO, 2018-2032 (EM MILHARES DE USD)
TABELA 202 MERCADO DE ERP DO SETOR BFSI DA COREIA DO SUL, POR MODO DE IMPLANTAÇÃO, 2018-2032 (EM MILHARES DE USD)
TABELA 203 MERCADO DE ERP EM NUVEM/MULTI NUVEM NA COREIA DO SUL, POR TIPO, 2018-2032 (EM MILHARES DE USD)
TABELA 204 MERCADO DE ERP PARA SAÚDE NA COREIA DO SUL, POR APLICAÇÃO, 2018-2032 (EM MILHARES DE USD)
TABELA 205 MERCADO DE SAÚDE ERP DA COREIA DO SUL, POR MODO DE IMPLANTAÇÃO, 2018-2032 (EM MILHARES DE USD)
TABELA 206 MERCADO DE ERP EM NUVEM/MULTI-NUVEM NA COREIA DO SUL, POR TIPO, 2018-2032 (EM MILHARES DE USD)
TABELA 207 MERCADO DE ERP DE TI E TELECOMUNICAÇÕES DA COREIA DO SUL, POR APLICAÇÃO, 2018-2032 (EM MILHARES DE USD)
TABELA 208 MERCADO DE TI E TELECOMUNICAÇÕES DA COREIA DO SUL EM ERP, POR MODO DE IMPLANTAÇÃO, 2018-2032 (EM MILHARES DE USD)
TABELA 209 MERCADO DE ERP EM NUVEM/MULTI NUVEM NA COREIA DO SUL, POR TIPO, 2018-2032 (EM MILHARES DE USD)
TABELA 210 MERCADO DE ERP GOVERNAMENTAL DA COREIA DO SUL, POR APLICAÇÃO, 2018-2032 (EM MILHARES DE USD)
TABELA 211 GOVERNO DA COREIA DO SUL NO MERCADO DE ERP, POR MODO DE IMPLANTAÇÃO, 2018-2032 (EM MILHARES DE USD)
TABELA 212 MERCADO DE ERP EM NUVEM/MULTI NUVEM NA COREIA DO SUL, POR TIPO, 2018-2032 (EM MILHARES DE USD)
TABELA 213 MERCADO DE ERP DE ENERGIA E SERVIÇOS PÚBLICOS DA COREIA DO SUL, POR APLICAÇÃO, 2018-2032 (EM MILHARES DE USD)
TABELA 214 MERCADO DE ENERGIA E SERVIÇOS PÚBLICOS DA COREIA DO SUL NO ERP, POR MODO DE IMPLANTAÇÃO, 2018-2032 (EM MILHARES DE USD)
TABELA 215 MERCADO DE ERP EM NUVEM/MULTI NUVEM NA COREIA DO SUL, POR TIPO, 2018-2032 (EM MILHARES DE USD)
TABELA 216 MERCADO DE ERP DE LOGÍSTICA NA COREIA DO SUL, POR APLICAÇÃO, 2018-2032 (EM MILHARES DE USD)
TABELA 217 LOGÍSTICA DA COREIA DO SUL NO MERCADO DE ERP, POR MODO DE IMPLANTAÇÃO, 2018-2032 (EM MILHARES DE USD)
TABELA 218 MERCADO DE ERP EM NUVEM/MULTI-NUVEM NA COREIA DO SUL, POR TIPO, 2018-2032 (EM MILHARES DE USD)
TABELA 219 MERCADO DE ERP PARA EDUCAÇÃO NA COREIA DO SUL, POR APLICAÇÃO, 2018-2032 (EM MILHARES DE USD)
TABELA 220 EDUCAÇÃO NA COREIA DO SUL NO MERCADO DE ERP, POR MODO DE IMPLANTAÇÃO, 2018-2032 (EM MILHARES DE USD)
TABELA 221 MERCADO DE ERP EM NUVEM/MULTI NUVEM NA COREIA DO SUL, POR TIPO, 2018-2032 (EM MILHARES DE USD)
TABELA 222 MERCADO DE ERP PARA OS SETOR AEROESPACIAL E DE DEFESA DA COREIA DO SUL, POR APLICAÇÃO, 2018-2032 (EM MILHARES DE USD)
TABELA 223 MERCADO DE AEROESPACIAL E DEFESA DA COREIA DO SUL NO ERP, POR MODO DE IMPLANTAÇÃO, 2018-2032 (EM MILHARES DE USD)
TABELA 224 MERCADO DE ERP EM NUVEM/MULTI NUVEM NA COREIA DO SUL, POR TIPO, 2018-2032 (EM MILHARES DE USD)
TABELA 225 COREIA DO SUL OUTROS NO MERCADO DE ERP, POR MODO DE IMPLANTAÇÃO, 2018-2032 (EM MILHARES DE USD)
TABELA 226 MERCADO DE ERP EM NUVEM/MULTI NUVEM NA COREIA DO SUL, POR TIPO, 2018-2032 (EM MILHARES DE USD)
TABELA 227 MERCADO DE ERP NA AUSTRÁLIA, POR OFERTA, 2018-2032 (EM MILHARES DE USD)
TABELA 228 SOLUÇÕES AUSTRALIANAS NO MERCADO DE ERP, POR TIPO, 2018-2032 (EM MILHARES DE USD)
TABELA 229 SERVIÇOS DA AUSTRÁLIA NO MERCADO DE ERP, POR TIPO, 2018-2032 (EM MILHARES DE USD)
TABELA 230 SERVIÇOS PROFISSIONAIS NO MERCADO DE ERP DA AUSTRÁLIA, POR TIPO, 2018-2032 (EM MILHARES DE USD)
TABELA 231 MERCADO DE ERP NA AUSTRÁLIA, POR MODO DE IMPLANTAÇÃO, 2018-2032 (EM MILHARES DE USD)
TABELA 232 MERCADO DE ERP EM NUVEM/MULTI-NUVEM NA AUSTRÁLIA, POR TIPO, 2018-2032 (EM MILHARES DE USD)
TABELA 233 MERCADO DE ERP NA AUSTRÁLIA, POR TAMANHO DA EMPRESA, 2018-2032 (EM MILHARES DE USD)
TABELA 234 MERCADO DE ERP PARA GRANDES EMPRESAS NA AUSTRÁLIA, POR MODO DE IMPLANTAÇÃO, 2018-2032 (EM MILHARES DE USD)
TABELA 235 MERCADO DE ERP EM NUVEM/MULTI-NUVEM NA AUSTRÁLIA, POR TIPO, 2018-2032 (EM MILHARES DE USD)
TABELA 236 MERCADO DE ERP NA AUSTRÁLIA, POR PREÇOS, 2018-2032 (EM MILHARES DE USD)
TABELA 237 MERCADO DE ERP NA AUSTRÁLIA COM BASE EM ASSINATURAS, POR TIPO, 2018-2032 (EM MILHARES DE USD)
TABELA 238 MERCADO DE ERP NA AUSTRÁLIA, POR USUÁRIO FINAL, 2018-2032 (EM MILHARES DE USD)
TABELA 239 MERCADO DE ERP PARA FABRICAÇÃO NA AUSTRÁLIA, POR APLICAÇÃO, 2018-2032 (EM MILHARES DE USD)
TABELA 240 MERCADO DE FABRICAÇÃO ERP NA AUSTRÁLIA, POR MODO DE IMPLANTAÇÃO, 2018-2032 (EM MILHARES DE USD)
TABELA 241 MERCADO DE ERP EM NUVEM/MULTI-NUVEM NA AUSTRÁLIA, POR TIPO, 2018-2032 (EM MILHARES DE USD)
TABELA 242 MERCADO DE ERP PARA VAREJO NA AUSTRÁLIA, POR APLICAÇÃO, 2018-2032 (EM MILHARES DE USD)
TABELA 243 VAREJO AUSTRALIANO NO MERCADO DE ERP, POR MODO DE IMPLANTAÇÃO, 2018-2032 (EM MILHARES DE USD)
TABELA 244 MERCADO DE ERP EM NUVEM/MULTI-NUVEM NA AUSTRÁLIA, POR TIPO, 2018-2032 (EM MILHARES DE USD)
TABELA 245 MERCADO DE ERP PARA O SETOR BFSI NA AUSTRÁLIA, POR APLICAÇÃO, 2018-2032 (EM MILHARES DE USD)
TABELA 246 MERCADO DE ERP DO SETOR BFSI DA AUSTRÁLIA, POR MODO DE IMPLANTAÇÃO, 2018-2032 (EM MILHARES DE USD)
TABELA 247 MERCADO DE ERP EM NUVEM/MULTI-NUVEM NA AUSTRÁLIA, POR TIPO, 2018-2032 (EM MILHARES DE USD)
TABELA 248 MERCADO DE ERP PARA O SETOR DE SAÚDE NA AUSTRÁLIA, POR APLICAÇÃO, 2018-2032 (EM MILHARES DE DÓLARES AMERICANOS)
TABELA 249 MERCADO DE ERP NA AUSTRÁLIA, POR MODO DE IMPLANTAÇÃO, 2018-2032 (EM MILHARES DE USD)
TABELA 250 MERCADO DE ERP EM NUVEM/MULTI-NUVEM NA AUSTRÁLIA, POR TIPO, 2018-2032 (EM MILHARES DE USD)
TABELA 251 MERCADO DE ERP DE TI E TELECOMUNICAÇÕES DA AUSTRÁLIA, POR APLICAÇÃO, 2018-2032 (EM MILHARES DE USD)
TABELA 252 MERCADO DE TI E TELECOMUNICAÇÕES NA AUSTRÁLIA EM ERP, POR MODO DE IMPLANTAÇÃO, 2018-2032 (EM MILHARES DE USD)
TABELA 253 MERCADO DE ERP EM NUVEM/MULTI-NUVEM NA AUSTRÁLIA, POR TIPO, 2018-2032 (EM MILHARES DE USD)
TABELA 254 MERCADO DE ERP GOVERNAMENTAL AUSTRALIANO, POR APLICAÇÃO, 2018-2032 (EM MILHARES DE USD)
TABELA 255 GOVERNO AUSTRALIANO NO MERCADO DE ERP, POR MODO DE IMPLANTAÇÃO, 2018-2032 (EM MILHARES DE USD)
TABELA 256 MERCADO DE ERP EM NUVEM/MULTI-NUVEM NA AUSTRÁLIA, POR TIPO, 2018-2032 (EM MILHARES DE USD)
TABELA 257 MERCADO DE ERP DE ENERGIA E SERVIÇOS PÚBLICOS DA AUSTRÁLIA, POR APLICAÇÃO, 2018-2032 (EM MILHARES DE USD)
TABELA 258 MERCADO DE ENERGIA E SERVIÇOS PÚBLICOS DA AUSTRÁLIA EM ERP, POR MODO DE IMPLANTAÇÃO, 2018-2032 (EM MILHARES DE USD)
TABELA 259 MERCADO DE ERP EM NUVEM/MULTI-NUVEM NA AUSTRÁLIA, POR TIPO, 2018-2032 (EM MILHARES DE USD)
TABELA 260 MERCADO DE ERP DE LOGÍSTICA NA AUSTRÁLIA, POR APLICAÇÃO, 2018-2032 (EM MILHARES DE USD)
TABELA 261 LOGÍSTICA NA AUSTRÁLIA NO MERCADO DE ERP, POR MODO DE IMPLANTAÇÃO, 2018-2032 (EM MILHARES DE USD)
TABELA 262 MERCADO DE ERP EM NUVEM/MULTI-NUVEM NA AUSTRÁLIA, POR TIPO, 2018-2032 (EM MILHARES DE USD)
TABELA 263 MERCADO DE ERP PARA EDUCAÇÃO NA AUSTRÁLIA, POR APLICAÇÃO, 2018-2032 (EM MILHARES DE USD)
TABELA 264 EDUCAÇÃO NA AUSTRÁLIA NO MERCADO DE ERP, POR MODO DE IMPLANTAÇÃO, 2018-2032 (EM MILHARES DE USD)
TABELA 265 MERCADO DE ERP EM NUVEM/MULTI-NUVEM NA AUSTRÁLIA, POR TIPO, 2018-2032 (EM MILHARES DE USD)
TABELA 266 MERCADO DE ERP PARA OS SETOR AEROESPACIAL E DE DEFESA DA AUSTRÁLIA, POR APLICAÇÃO, 2018-2032 (EM MILHARES DE USD)
TABELA 267 MERCADO AEROESPACIAL E DE DEFESA DA AUSTRÁLIA NO ERP, POR MODO DE IMPLANTAÇÃO, 2018-2032 (EM MILHARES DE USD)
TABELA 268 MERCADO DE ERP EM NUVEM/MULTI-NUVEM NA AUSTRÁLIA, POR TIPO, 2018-2032 (EM MILHARES DE USD)
TABELA 269 AUSTRÁLIA OUTROS NO MERCADO DE ERP, POR MODO DE IMPLANTAÇÃO, 2018-2032 (EM MILHARES DE USD)
TABELA 270 MERCADO DE ERP EM NUVEM/MULTI-NUVEM NA AUSTRÁLIA, POR TIPO, 2018-2032 (EM MILHARES DE USD)
TABELA 271 MERCADO DE ERP NA INDONÉSIA, POR OFERTA, 2018-2032 (EM MILHARES DE USD)
TABELA 272 SOLUÇÕES INDONÉSIA NO MERCADO DE ERP, POR TIPO, 2018-2032 (EM MILHARES DE USD)
TABELA 273 SERVIÇOS DA INDONÉSIA NO MERCADO DE ERP, POR TIPO, 2018-2032 (EM MILHARES DE USD)
TABELA 274 SERVIÇOS PROFISSIONAIS NA INDONÉSIA NO MERCADO DE ERP, POR TIPO, 2018-2032 (EM MILHARES DE USD)
TABELA 275 MERCADO DE ERP NA INDONÉSIA, POR MODO DE IMPLANTAÇÃO, 2018-2032 (EM MILHARES DE USD)
TABELA 276 MERCADO DE ERP EM NUVEM/MULTI-NUVEM NA INDONÉSIA, POR TIPO, 2018-2032 (EM MILHARES DE USD)
TABELA 277 MERCADO DE ERP NA INDONÉSIA, POR TAMANHO DA EMPRESA, 2018-2032 (EM MILHARES DE USD)
TABELA 278 MERCADO DE ERP PARA GRANDES EMPRESAS NA INDONÉSIA, POR MODO DE IMPLANTAÇÃO, 2018-2032 (EM MILHARES DE USD)
TABELA 279 MERCADO DE ERP EM NUVEM/MULTI-NUVEM NA INDONÉSIA, POR TIPO, 2018-2032 (EM MILHARES DE USD)
TABELA 280 MERCADO DE ERP NA INDONÉSIA, POR PREÇOS, 2018-2032 (EM MILHARES DE USD)
TABELA 281 MERCADO DE ERP NA INDONÉSIA COM BASE EM ASSINATURAS, POR TIPO, 2018-2032 (EM MILHARES DE USD)
TABELA 282 MERCADO DE ERP NA INDONÉSIA, POR USUÁRIO FINAL, 2018-2032 (EM MILHARES DE USD)
TABELA 283 MERCADO DE ERP PARA FABRICAÇÃO NA INDONÉSIA, POR APLICAÇÃO, 2018-2032 (EM MILHARES DE USD)
TABELA 284 FABRICAÇÃO NA INDONÉSIA NO MERCADO DE ERP, POR MODO DE IMPLANTAÇÃO, 2018-2032 (EM MILHARES DE USD)
TABELA 285 MERCADO DE ERP EM NUVEM/MULTI-NUVEM NA INDONÉSIA, POR TIPO, 2018-2032 (EM MILHARES DE USD)
TABELA 286 MERCADO DE ERP PARA VAREJO NA INDONÉSIA, POR APLICAÇÃO, 2018-2032 (EM MILHARES DE USD)
TABELA 287 VAREJO INDONÉSIO NO MERCADO DE ERP, POR MODO DE IMPLANTAÇÃO, 2018-2032 (EM MILHARES DE USD)
TABELA 288 MERCADO DE ERP EM NUVEM/MULTI-NUVEM NA INDONÉSIA, POR TIPO, 2018-2032 (EM MILHARES DE USD)
TABELA 289 MERCADO DE ERP PARA O SETOR BFSI NA INDONÉSIA, POR APLICAÇÃO, 2018-2032 (EM MILHARES DE USD)
TABELA 290 MERCADO DE ERP DO SETOR BFSI DA INDONÉSIA, POR MODO DE IMPLANTAÇÃO, 2018-2032 (EM MILHARES DE USD)
TABELA 291 MERCADO DE ERP EM NUVEM/MULTI-NUVEM NA INDONÉSIA, POR TIPO, 2018-2032 (EM MILHARES DE USD)
TABELA 292 MERCADO DE ERP PARA SAÚDE NA INDONÉSIA, POR APLICAÇÃO, 2018-2032 (EM MILHARES DE USD)
TABELA 293 MERCADO DE SAÚDE ERP NA INDONÉSIA, POR MODO DE IMPLANTAÇÃO, 2018-2032 (EM MILHARES DE USD)
TABELA 294 MERCADO DE ERP EM NUVEM/MULTI-NUVEM NA INDONÉSIA, POR TIPO, 2018-2032 (EM MILHARES DE USD)
TABELA 295 MERCADO DE ERP DE TI E TELECOMUNICAÇÕES NA INDONÉSIA, POR APLICAÇÃO, 2018-2032 (EM MILHARES DE USD)
TABELA 296 MERCADO DE TI E TELECOMUNICAÇÕES NA INDONÉSIA EM ERP, POR MODO DE IMPLANTAÇÃO, 2018-2032 (EM MILHARES DE USD)
TABELA 297 MERCADO DE ERP EM NUVEM/MULTI-NUVEM NA INDONÉSIA, POR TIPO, 2018-2032 (EM MILHARES DE USD)
TABELA 298 MERCADO DE ERP GOVERNAMENTAL DA INDONÉSIA, POR APLICAÇÃO, 2018-2032 (EM MILHARES DE USD)
TABELA 299 GOVERNO DA INDONÉSIA NO MERCADO DE ERP, POR MODO DE IMPLANTAÇÃO, 2018-2032 (EM MILHARES DE USD)
TABELA 300 MERCADO DE ERP EM NUVEM/MULTI-NUVEM NA INDONÉSIA, POR TIPO, 2018-2032 (EM MILHARES DE USD)
TABELA 301 MERCADO DE ERP DE ENERGIA E SERVIÇOS PÚBLICOS NA INDONÉSIA, POR APLICAÇÃO, 2018-2032 (EM MILHARES DE USD)
TABELA 302 MERCADO DE ENERGIA E SERVIÇOS PÚBLICOS DA INDONÉSIA NO ERP, POR MODO DE IMPLANTAÇÃO, 2018-2032 (EM MILHARES DE USD)
TABELA 303 MERCADO DE ERP EM NUVEM/MULTI-NUVEM NA INDONÉSIA, POR TIPO, 2018-2032 (EM MILHARES DE USD)
TABELA 304 MERCADO DE ERP DE LOGÍSTICA NA INDONÉSIA, POR APLICAÇÃO, 2018-2032 (EM MILHARES DE USD)
TABELA 305 LOGÍSTICA DA INDONÉSIA NO MERCADO DE ERP, POR MODO DE IMPLANTAÇÃO, 2018-2032 (EM MILHARES DE USD)
TABELA 306 MERCADO DE ERP EM NUVEM/MULTI-NUVEM NA INDONÉSIA, POR TIPO, 2018-2032 (EM MILHARES DE USD)
TABELA 307 MERCADO DE ERP EDUCACIONAL NA INDONÉSIA, POR APLICAÇÃO, 2018-2032 (EM MILHARES DE USD)
TABELA 308 EDUCAÇÃO NA INDONÉSIA NO MERCADO DE ERP, POR MODO DE IMPLANTAÇÃO, 2018-2032 (EM MILHARES DE USD)
TABELA 309 MERCADO DE ERP EM NUVEM/MULTI-NUVEM NA INDONÉSIA, POR TIPO, 2018-2032 (EM MILHARES DE USD)
TABELA 310 MERCADO DE ERP PARA OS SETOR AEROESPACIAL E DE DEFESA DA INDONÉSIA, POR APLICAÇÃO, 2018-2032 (EM MILHARES DE USD)
TABELA 311 INDONÉSIA AEROESPACIAL E DEFESA NO MERCADO DE ERP, POR MODO DE IMPLANTAÇÃO, 2018-2032 (EM MILHARES DE USD)
TABELA 312 MERCADO DE ERP EM NUVEM/MULTI-NUVEM NA INDONÉSIA, POR TIPO, 2018-2032 (EM MILHARES DE USD)
TABELA 313 INDONÉSIA OUTROS NO MERCADO DE ERP, POR MODO DE IMPLANTAÇÃO, 2018-2032 (MILHARES DE USD)
TABELA 314 MERCADO DE ERP EM NUVEM/MULTI-NUVEM NA INDONÉSIA, POR TIPO, 2018-2032 (EM MILHARES DE USD)
TABELA 315 MERCADO DE ERP DE CINGAPURA, POR OFERTA, 2018-2032 (EM MILHARES DE USD)
TABELA 316 SOLUÇÕES DE SINGAPURA NO MERCADO DE ERP, POR TIPO, 2018-2032 (EM MILHARES DE USD)
TABELA 317 SERVIÇOS DE SINGAPURA NO MERCADO DE ERP, POR TIPO, 2018-2032 (EM MILHARES DE USD)
TABELA 318 SERVIÇOS PROFISSIONAIS EM MERCADO DE ERP EM CINGAPURA, POR TIPO, 2018-2032 (EM MILHARES DE USD)
TABELA 319 MERCADO DE ERP EM CINGAPURA, POR MODO DE IMPLANTAÇÃO, 2018-2032 (EM MILHARES DE USD)
TABELA 320 MERCADO DE ERP EM NUVEM/MULTI-NUVEM EM CINGAPURA, POR TIPO, 2018-2032 (EM MILHARES DE USD)
TABELA 321 MERCADO DE ERP DE CINGAPURA, POR TAMANHO DA EMPRESA, 2018-2032 (EM MILHARES DE USD)
TABELA 322 MERCADO DE ERP PARA GRANDES EMPRESAS EM CINGAPURA, POR MODO DE IMPLANTAÇÃO, 2018-2032 (EM MILHARES DE USD)
TABELA 323 MERCADO DE ERP EM NUVEM/MULTI-NUVEM EM CINGAPURA, POR TIPO, 2018-2032 (EM MILHARES DE USD)
TABELA 324 MERCADO DE ERP DE CINGAPURA, POR PREÇOS, 2018-2032 (EM MILHARES DE USD)
TABELA 325 MERCADO DE ERP EM CINGAPURA COM BASE EM ASSINATURAS, POR TIPO, 2018-2032 (EM MILHARES DE USD)
TABELA 326 MERCADO DE ERP EM CINGAPURA, POR USUÁRIO FINAL, 2018-2032 (EM MILHARES DE USD)
TABELA 327 MERCADO DE ERP PARA FABRICAÇÃO EM CINGAPURA, POR APLICAÇÃO, 2018-2032 (EM MILHARES DE USD)
TABELA 328 FABRICAÇÃO EM SINGAPURA NO MERCADO DE ERP, POR MODO DE IMPLANTAÇÃO, 2018-2032 (EM MILHARES DE USD)
TABELA 329 MERCADO DE ERP EM NUVEM/MULTI-NUVEM EM CINGAPURA, POR TIPO, 2018-2032 (EM MILHARES DE USD)
TABELA 330 MERCADO DE ERP PARA VAREJO EM CINGAPURA, POR APLICAÇÃO, 2018-2032 (EM MILHARES DE USD)
TABELA 331 VAREJO DE CINGAPURA NO MERCADO DE ERP, POR MODO DE IMPLANTAÇÃO, 2018-2032 (EM MILHARES DE USD)
TABELA 332 MERCADO DE ERP EM NUVEM/MULTI-NUVEM EM CINGAPURA, POR TIPO, 2018-2032 (EM MILHARES DE USD)
TABELA 333 MERCADO DE ERP PARA O SETOR DE SERVIÇOS FINANCEIROS E DE INVESTIMENTOS EM SINGAPURA, POR APLICAÇÃO, 2018-2032 (EM MILHARES DE USD)
TABELA 334 MERCADO DE ERP DO SETOR BFSI DE CINGAPURA, POR MODO DE IMPLANTAÇÃO, 2018-2032 (EM MILHARES DE USD)
TABELA 335 MERCADO DE ERP EM NUVEM/MULTI-NUVEM EM CINGAPURA, POR TIPO, 2018-2032 (EM MILHARES DE USD)
TABELA 336 MERCADO DE ERP PARA O SETOR DE SAÚDE EM CINGAPURA, POR APLICAÇÃO, 2018-2032 (EM MILHARES DE USD)
TABELA 337 MERCADO DE SAÚDE ERP EM SINGAPURA, POR MODO DE IMPLANTAÇÃO, 2018-2032 (EM MILHARES DE USD)
TABELA 338 MERCADO DE ERP EM NUVEM/MULTI-NUVEM EM CINGAPURA, POR TIPO, 2018-2032 (EM MILHARES DE USD)
TABELA 339 MERCADO DE ERP DE TI E TELECOMUNICAÇÕES DE CINGAPURA, POR APLICAÇÃO, 2018-2032 (EM MILHARES DE USD)
TABELA 340 MERCADO DE TI E TELECOMUNICAÇÕES EM ERP EM CINGAPURA, POR MODO DE IMPLANTAÇÃO, 2018-2032 (EM MILHARES DE USD)
TABELA 341 MERCADO DE ERP EM NUVEM/MULTI-NUVEM EM CINGAPURA, POR TIPO, 2018-2032 (EM MILHARES DE USD)
TABELA 342 MERCADO DE ERP GOVERNAMENTAL DE SINGAPURA, POR APLICAÇÃO, 2018-2032 (EM MILHARES DE USD)
TABELA 343 GOVERNO DE SINGAPURA NO MERCADO DE ERP, POR MODO DE IMPLANTAÇÃO, 2018-2032 (EM MILHARES DE USD)
TABELA 344 MERCADO DE ERP EM NUVEM/MULTI-NUVEM EM CINGAPURA, POR TIPO, 2018-2032 (EM MILHARES DE USD)
TABELA 345 MERCADO DE ERP DE ENERGIA E SERVIÇOS PÚBLICOS DE CINGAPURA, POR APLICAÇÃO, 2018-2032 (EM MILHARES DE USD)
TABELA 346 MERCADO DE ENERGIA E SERVIÇOS PÚBLICOS DE SINGAPURA NO ERP, POR MODO DE IMPLANTAÇÃO, 2018-2032 (EM MILHARES DE USD)
TABELA 347 MERCADO DE ERP EM NUVEM/MULTI-NUVEM EM CINGAPURA, POR TIPO, 2018-2032 (EM MILHARES DE USD)
TABELA 348 MERCADO DE ERP DE LOGÍSTICA EM CINGAPURA, POR APLICAÇÃO, 2018-2032 (EM MILHARES DE USD)
TABELA 349 LOGÍSTICA DE SINGAPURA NO MERCADO DE ERP, POR MODO DE IMPLANTAÇÃO, 2018-2032 (EM MILHARES DE USD)
TABELA 350 MERCADO DE ERP EM NUVEM/MULTI-NUVEM EM CINGAPURA, POR TIPO, 2018-2032 (EM MILHARES DE USD)
TABELA 351 MERCADO DE ERP EDUCACIONAL EM CINGAPURA, POR APLICAÇÃO, 2018-2032 (EM MILHARES DE USD)
TABELA 352 EDUCAÇÃO EM CINGAPURA NO MERCADO DE ERP, POR MODO DE IMPLANTAÇÃO, 2018-2032 (EM MILHARES DE USD)
TABELA 353 MERCADO DE ERP EM NUVEM/MULTI-NUVEM EM CINGAPURA, POR TIPO, 2018-2032 (EM MILHARES DE USD)
TABELA 354 MERCADO DE ERP PARA OS SETOR AEROESPACIAL E DE DEFESA DE CINGAPURA, POR APLICAÇÃO, 2018-2032 (EM MILHARES DE USD)
TABELA 355 MERCADO DE AEROESPACIAL E DEFESA DE SINGAPURA NO ERP, POR MODO DE IMPLANTAÇÃO, 2018-2032 (EM MILHARES DE USD)
TABELA 356 MERCADO DE ERP EM NUVEM/MULTI-NUVEM EM CINGAPURA, POR TIPO, 2018-2032 (EM MILHARES DE USD)
TABELA 357 SINGAPURA OUTROS NO MERCADO DE ERP, POR MODO DE IMPLANTAÇÃO, 2018-2032 (EM MILHARES DE USD)
TABELA 358 MERCADO DE ERP EM NUVEM/MULTI-NUVEM EM CINGAPURA, POR TIPO, 2018-2032 (EM MILHARES DE USD)
TABELA 359 MERCADO DE ERP NA TAILÂNDIA, POR OFERTA, 2018-2032 (EM MILHARES DE USD)
TABELA 360 SOLUÇÕES DA TAILÂNDIA NO MERCADO DE ERP, POR TIPO, 2018-2032 (EM MILHARES DE USD)
TABELA 361 SERVIÇOS DA TAILÂNDIA NO MERCADO DE ERP, POR TIPO, 2018-2032 (EM MILHARES DE USD)
TABELA 362 SERVIÇOS PROFISSIONAIS NA TAILÂNDIA NO MERCADO DE ERP, POR TIPO, 2018-2032 (EM MILHARES DE USD)
TABELA 363 MERCADO DE ERP NA TAILÂNDIA, POR MODO DE IMPLANTAÇÃO, 2018-2032 (EM MILHARES DE USD)
TABELA 364 MERCADO DE ERP EM NUVEM/MULTI-NUVEM NA TAILÂNDIA, POR TIPO, 2018-2032 (EM MILHARES DE USD)
TABELA 365 MERCADO DE ERP NA TAILÂNDIA, POR TAMANHO DA EMPRESA, 2018-2032 (EM MILHARES DE USD)
TABELA 366 MERCADO DE ERP PARA GRANDES EMPRESAS NA TAILÂNDIA, POR MODO DE IMPLANTAÇÃO, 2018-2032 (EM MILHARES DE USD)
TABELA 367 MERCADO DE ERP EM NUVEM/MULTI-NUVEM NA TAILÂNDIA, POR TIPO, 2018-2032 (EM MILHARES DE USD)
TABELA 368 MERCADO DE ERP NA TAILÂNDIA, POR PREÇOS, 2018-2032 (EM MILHARES DE USD)
TABELA 369 MERCADO DE ERP NA TAILÂNDIA, POR TIPO (BASEADO EM ASSINATURAS), 2018-2032 (EM MILHARES DE USD)
TABELA 370 MERCADO DE ERP NA TAILÂNDIA, POR USUÁRIO FINAL, 2018-2032 (EM MILHARES DE USD)
TABELA 371 MERCADO DE ERP PARA FABRICAÇÃO NA TAILÂNDIA, POR APLICAÇÃO, 2018-2032 (EM MILHARES DE USD)
TABELA 372 FABRICAÇÃO NA TAILÂNDIA NO MERCADO DE ERP, POR MODO DE IMPLANTAÇÃO, 2018-2032 (EM MILHARES DE USD)
TABELA 373 MERCADO DE ERP EM NUVEM/MULTI-NUVEM NA TAILÂNDIA, POR TIPO, 2018-2032 (EM MILHARES DE USD)
TABELA 374 MERCADO DE ERP PARA VAREJO NA TAILÂNDIA, POR APLICAÇÃO, 2018-2032 (EM MILHARES DE USD)
TABELA 375 VAREJO TAILÂNDIA NO MERCADO DE ERP, POR MODO DE IMPLANTAÇÃO, 2018-2032 (EM MILHARES DE USD)
TABELA 376 MERCADO DE ERP EM NUVEM/MULTI-NUVEM NA TAILÂNDIA, POR TIPO, 2018-2032 (EM MILHARES DE USD)
TABELA 377 MERCADO DE ERP PARA O SETOR BFSI NA TAILÂNDIA, POR APLICAÇÃO, 2018-2032 (EM MILHARES DE USD)
TABELA 378 MERCADO DE ERP DO SETOR BFSI DA TAILÂNDIA, POR MODO DE IMPLANTAÇÃO, 2018-2032 (EM MILHARES DE USD)
TABELA 379 MERCADO DE ERP EM NUVEM/MULTI-NUVEM NA TAILÂNDIA, POR TIPO, 2018-2032 (EM MILHARES DE USD)
TABELA 380 MERCADO DE ERP PARA SAÚDE NA TAILÂNDIA, POR APLICAÇÃO, 2018-2032 (EM MILHARES DE USD)
TABELA 381 MERCADO DE SAÚDE ERP NA TAILÂNDIA, POR MODO DE IMPLANTAÇÃO, 2018-2032 (EM MILHARES DE USD)
TABELA 382 MERCADO DE ERP EM NUVEM/MULTI-NUVEM NA TAILÂNDIA, POR TIPO, 2018-2032 (EM MILHARES DE USD)
TABELA 383 MERCADO DE ERP DE TI E TELECOMUNICAÇÕES NA TAILÂNDIA, POR APLICAÇÃO, 2018-2032 (EM MILHARES DE USD)
TABELA 384 MERCADO DE TI E TELECOMUNICAÇÕES DA TAILÂNDIA EM ERP, POR MODO DE IMPLANTAÇÃO, 2018-2032 (EM MILHARES DE USD)
TABELA 385 MERCADO DE ERP EM NUVEM/MULTI-NUVEM NA TAILÂNDIA, POR TIPO, 2018-2032 (EM MILHARES DE USD)
TABELA 386 MERCADO DE ERP GOVERNAMENTAL DA TAILÂNDIA, POR APLICAÇÃO, 2018-2032 (EM MILHARES DE USD)
TABELA 387 GOVERNO DA TAILÂNDIA NO MERCADO DE ERP, POR MODO DE IMPLANTAÇÃO, 2018-2032 (EM MILHARES DE USD)
TABELA 388 MERCADO DE ERP EM NUVEM/MULTI-NUVEM NA TAILÂNDIA, POR TIPO, 2018-2032 (EM MILHARES DE USD)
TABELA 389 MERCADO DE ERP DE ENERGIA E SERVIÇOS PÚBLICOS DA TAILÂNDIA, POR APLICAÇÃO, 2018-2032 (EM MILHARES DE USD)
TABELA 390 ENERGIA E SERVIÇOS PÚBLICOS DA TAILÂNDIA NO MERCADO DE ERP, POR MODO DE IMPLANTAÇÃO, 2018-2032 (EM MILHARES DE USD)
TABELA 391 MERCADO DE ERP EM NUVEM/MULTI-NUVEM NA TAILÂNDIA, POR TIPO, 2018-2032 (EM MILHARES DE USD)
TABELA 392 MERCADO DE ERP DE LOGÍSTICA NA TAILÂNDIA, POR APLICAÇÃO, 2018-2032 (EM MILHARES DE USD)
TABELA 393 LOGÍSTICA DA TAILÂNDIA NO MERCADO DE ERP, POR MODO DE IMPLANTAÇÃO, 2018-2032 (EM MILHARES DE USD)
TABELA 394 MERCADO DE ERP EM NUVEM/MULTI-NUVEM NA TAILÂNDIA, POR TIPO, 2018-2032 (EM MILHARES DE USD)
TABELA 395 MERCADO DE ERP PARA EDUCAÇÃO NA TAILÂNDIA, POR APLICAÇÃO, 2018-2032 (EM MILHARES DE USD)
TABELA 396 EDUCAÇÃO NA TAILÂNDIA NO MERCADO DE ERP, POR MODO DE IMPLANTAÇÃO, 2018-2032 (EM MILHARES DE USD)
TABELA 397 MERCADO DE ERP EM NUVEM/MULTI-NUVEM NA TAILÂNDIA, POR TIPO, 2018-2032 (EM MILHARES DE USD)
TABELA 398 MERCADO DE ERP PARA OS SETOR AEROESPACIAL E DE DEFESA DA TAILÂNDIA, POR APLICAÇÃO, 2018-2032 (EM MILHARES DE USD)
TABELA 399 MERCADO DE AEROESPACIAL E DEFESA DA TAILÂNDIA NO ERP, POR MODO DE IMPLANTAÇÃO, 2018-2032 (EM MILHARES DE USD)
TABELA 400 MERCADO DE ERP EM NUVEM/MULTI-NUVEM NA TAILÂNDIA, POR TIPO, 2018-2032 (EM MILHARES DE USD)
TABELA 401 TAILÂNDIA E OUTROS NO MERCADO DE ERP, POR MODO DE IMPLANTAÇÃO, 2018-2032 (EM MILHARES DE USD)
TABELA 402 MERCADO DE ERP EM NUVEM/MULTI-NUVEM NA TAILÂNDIA, POR TIPO, 2018-2032 (EM MILHARES DE USD)
TABELA 403 MERCADO DE ERP DA MALÁSIA, POR OFERTA, 2018-2032 (EM MILHARES DE USD)
TABELA 404 SOLUÇÕES DA MALÁSIA NO MERCADO DE ERP, POR TIPO, 2018-2032 (EM MILHARES DE USD)
TABELA 405 SERVIÇOS DA MALÁSIA NO MERCADO DE ERP, POR TIPO, 2018-2032 (EM MILHARES DE USD)
TABELA 406 SERVIÇOS PROFISSIONAIS DA MALÁSIA NO MERCADO DE ERP, POR TIPO, 2018-2032 (EM MILHARES DE USD)
TABELA 407 MERCADO DE ERP DA MALÁSIA, POR MODO DE IMPLANTAÇÃO, 2018-2032 (EM MILHARES DE USD)
TABELA 408 MERCADO DE ERP EM NUVEM/MULTI-NUVEM NA MALÁSIA, POR TIPO, 2018-2032 (EM MILHARES DE USD)
TABELA 409 MERCADO DE ERP DA MALÁSIA, POR TAMANHO DA EMPRESA, 2018-2032 (EM MILHARES DE USD)
TABELA 410 MERCADO DE ERP PARA GRANDES EMPRESAS NA MALÁSIA, POR MODO DE IMPLANTAÇÃO, 2018-2032 (EM MILHARES DE USD)
TABELA 411 MERCADO DE ERP EM NUVEM/MULTI-NUVEM NA MALÁSIA, POR TIPO, 2018-2032 (EM MILHARES DE USD)
TABELA 412 MERCADO DE ERP DA MALÁSIA, POR PREÇOS, 2018-2032 (EM MILHARES DE USD)
TABELA 413 MERCADO DE ERP NA MALÁSIA COM BASE EM ASSINATURAS, POR TIPO, 2018-2032 (EM MILHARES DE USD)
TABELA 414 MERCADO DE ERP DA MALÁSIA, POR USUÁRIO FINAL, 2018-2032 (EM MILHARES DE USD)
TABELA 415 MERCADO DE ERP PARA FABRICAÇÃO NA MALÁSIA, POR APLICAÇÃO, 2018-2032 (EM MILHARES DE USD)
TABELA 416 FABRICAÇÃO NA MALÁSIA NO MERCADO DE ERP, POR MODO DE IMPLANTAÇÃO, 2018-2032 (EM MILHARES DE USD)
TABELA 417 MERCADO DE ERP EM NUVEM/MULTI-NUVEM NA MALÁSIA, POR TIPO, 2018-2032 (EM MILHARES DE USD)
TABELA 418 MERCADO DE ERP PARA VAREJO NA MALÁSIA, POR APLICAÇÃO, 2018-2032 (EM MILHARES DE USD)
TABELA 419 VAREJO DA MALÁSIA NO MERCADO DE ERP, POR MODO DE IMPLANTAÇÃO, 2018-2032 (EM MILHARES DE USD)
TABELA 420 MERCADO DE ERP EM NUVEM/MULTI-NUVEM NA MALÁSIA, POR TIPO, 2018-2032 (EM MILHARES DE USD)
TABELA 421 MERCADO DE ERP PARA O SETOR BFSI DA MALÁSIA, POR APLICAÇÃO, 2018-2032 (EM MILHARES DE USD)
TABELA 422 MERCADO DE ERP DA MALÁSIA NO SETOR BFSI, POR MODO DE IMPLANTAÇÃO, 2018-2032 (EM MILHARES DE USD)
TABELA 423 MERCADO DE ERP EM NUVEM/MULTI-NUVEM NA MALÁSIA, POR TIPO, 2018-2032 (EM MILHARES DE USD)
TABELA 424 MERCADO DE ERP PARA O SETOR DE SAÚDE DA MALÁSIA, POR APLICAÇÃO, 2018-2032 (EM MILHARES DE USD)
TABELA 425 MERCADO DE SAÚDE ERP DA MALÁSIA, POR MODO DE IMPLANTAÇÃO, 2018-2032 (EM MILHARES DE USD)
TABELA 426 MERCADO DE ERP EM NUVEM/MULTI-NUVEM NA MALÁSIA, POR TIPO, 2018-2032 (EM MILHARES DE USD)
TABELA 427 MERCADO DE ERP DE TI E TELECOMUNICAÇÕES DA MALÁSIA, POR APLICAÇÃO, 2018-2032 (EM MILHARES DE USD)
TABELA 428 MERCADO DE TI E TELECOMUNICAÇÕES DA MALÁSIA EM ERP, POR MODO DE IMPLANTAÇÃO, 2018-2032 (EM MILHARES DE USD)
TABELA 429 MERCADO DE ERP EM NUVEM/MULTI-NUVEM NA MALÁSIA, POR TIPO, 2018-2032 (EM MILHARES DE USD)
TABELA 430 MERCADO DE ERP GOVERNAMENTAL DA MALÁSIA, POR APLICAÇÃO, 2018-2032 (EM MILHARES DE USD)
TABELA 431 GOVERNO DA MALÁSIA NO MERCADO DE ERP, POR MODO DE IMPLANTAÇÃO, 2018-2032 (EM MILHARES DE USD)
TABELA 432 MERCADO DE ERP EM NUVEM/MULTI-NUVEM NA MALÁSIA, POR TIPO, 2018-2032 (EM MILHARES DE USD)
TABELA 433 MERCADO DE ERP DE ENERGIA E SERVIÇOS PÚBLICOS DA MALÁSIA, POR APLICAÇÃO, 2018-2032 (EM MILHARES DE USD)
TABELA 434 MERCADO DE ENERGIA E SERVIÇOS PÚBLICOS DA MALÁSIA NO ERP, POR MODO DE IMPLANTAÇÃO, 2018-2032 (EM MILHARES DE USD)
TABELA 435 MERCADO DE ERP EM NUVEM/MULTI-NUVEM NA MALÁSIA, POR TIPO, 2018-2032 (EM MILHARES DE USD)
TABELA 436 MERCADO DE ERP DE LOGÍSTICA DA MALÁSIA, POR APLICAÇÃO, 2018-2032 (EM MILHARES DE USD)
TABELA 437 LOGÍSTICA DA MALÁSIA NO MERCADO DE ERP, POR MODO DE IMPLANTAÇÃO, 2018-2032 (EM MILHARES DE USD)
TABELA 438 MERCADO DE ERP EM NUVEM/MULTI-NUVEM NA MALÁSIA, POR TIPO, 2018-2032 (EM MILHARES DE USD)
TABELA 439 MERCADO DE ERP PARA EDUCAÇÃO NA MALÁSIA, POR APLICAÇÃO, 2018-2032 (EM MILHARES DE USD)
TABELA 440 MERCADO DE EDUCAÇÃO ERP NA MALÁSIA, POR MODO DE IMPLANTAÇÃO, 2018-2032 (EM MILHARES DE USD)
TABELA 441 MERCADO DE ERP EM NUVEM/MULTI-NUVEM NA MALÁSIA, POR TIPO, 2018-2032 (EM MILHARES DE USD)
TABELA 442 MERCADO DE ERP PARA OS SETOR AEROESPACIAL E DE DEFESA DA MALÁSIA, POR APLICAÇÃO, 2018-2032 (EM MILHARES DE USD)
TABELA 443 MALÁSIA AEROESPACIAL E DEFESA NO MERCADO DE ERP, POR MODO DE IMPLANTAÇÃO, 2018-2032 (EM MILHARES DE USD)
TABELA 444 MERCADO DE ERP EM NUVEM/MULTI-NUVEM NA MALÁSIA, POR TIPO, 2018-2032 (EM MILHARES DE USD)
TABELA 445 MALÁSIA OUTROS NO MERCADO DE ERP, POR MODO DE IMPLANTAÇÃO, 2018-2032 (MILHARES DE USD)
TABELA 446 MERCADO DE ERP EM NUVEM/MULTI-NUVEM NA MALÁSIA, POR TIPO, 2018-2032 (EM MILHARES DE USD)
TABELA 447 MERCADO DE ERP DO VIETNÃ, POR OFERTA, 2018-2032 (EM MILHARES DE USD)
TABELA 448 SOLUÇÕES DO VIETNÃ NO MERCADO DE ERP, POR TIPO, 2018-2032 (EM MILHARES DE USD)
TABELA 449 SERVIÇOS DO VIETNÃ NO MERCADO DE ERP, POR TIPO, 2018-2032 (EM MILHARES DE USD)
TABELA 450 SERVIÇOS PROFISSIONAIS DO VIETNÃ NO MERCADO DE ERP, POR TIPO, 2018-2032 (EM MILHARES DE USD)
TABELA 451 MERCADO DE ERP NO VIETNÃ, POR MODO DE IMPLANTAÇÃO, 2018-2032 (EM MILHARES DE USD)
TABELA 452 MERCADO DE ERP EM NUVEM/MULTI-NUVEM NO VIETNÃ, POR TIPO, 2018-2032 (EM MILHARES DE USD)
TABELA 453 MERCADO DE ERP DO VIETNÃ, POR TAMANHO DA EMPRESA, 2018-2032 (EM MILHARES DE USD)
TABELA 454 MERCADO DE ERP PARA GRANDES EMPRESAS NO VIETNÃ, POR MODO DE IMPLANTAÇÃO, 2018-2032 (EM MILHARES DE USD)
TABELA 455 MERCADO DE ERP EM NUVEM/MULTI-NUVEM NO VIETNÃ, POR TIPO, 2018-2032 (EM MILHARES DE USD)
TABELA 456 MERCADO DE ERP DO VIETNÃ, POR PREÇOS, 2018-2032 (MILHARES DE USD)
TABELA 457 MERCADO DE ERP NO VIETNÃ COM BASE EM ASSINATURAS, POR TIPO, 2018-2032 (EM MILHARES DE USD)
TABELA 458 MERCADO DE ERP NO VIETNÃ, POR USUÁRIO FINAL, 2018-2032 (EM MILHARES DE USD)
TABELA 459 MERCADO DE ERP PARA FABRICAÇÃO NO VIETNÃ, POR APLICAÇÃO, 2018-2032 (EM MILHARES DE USD)
TABELA 460 FABRICAÇÃO VIETNAMITA NO MERCADO DE ERP, POR MODO DE IMPLANTAÇÃO, 2018-2032 (EM MILHARES DE USD)
TABELA 461 MERCADO DE ERP EM NUVEM/MULTI-NUVEM NO VIETNÃ, POR TIPO, 2018-2032 (EM MILHARES DE USD)
TABELA 462 MERCADO DE ERP PARA VAREJO NO VIETNÃ, POR APLICAÇÃO, 2018-2032 (EM MILHARES DE USD)
TABELA 463 VAREJO DO VIETNÃ NO MERCADO DE ERP, POR MODO DE IMPLANTAÇÃO, 2018-2032 (EM MILHARES DE USD)
TABELA 464 MERCADO DE ERP EM NUVEM/MULTI-NUVEM NO VIETNÃ, POR TIPO, 2018-2032 (EM MILHARES DE USD)
TABELA 465 MERCADO DE ERP PARA O SETOR BFSI DO VIETNÃ, POR APLICAÇÃO, 2018-2032 (EM MILHARES DE USD)
TABELA 466 MERCADO DE BFSI DO VIETNÃ EM ERP, POR MODO DE IMPLANTAÇÃO, 2018-2032 (EM MILHARES DE USD)
TABELA 467 MERCADO DE ERP EM NUVEM/MULTI-NUVEM NO VIETNÃ, POR TIPO, 2018-2032 (EM MILHARES DE USD)
TABELA 468 MERCADO DE ERP PARA SAÚDE NO VIETNÃ, POR APLICAÇÃO, 2018-2032 (EM MILHARES DE USD)
TABELA 469 MERCADO DE SAÚDE ERP DO VIETNÃ, POR MODO DE IMPLANTAÇÃO, 2018-2032 (EM MILHARES DE USD)
TABELA 470 MERCADO DE ERP EM NUVEM/MULTI-NUVEM NO VIETNÃ, POR TIPO, 2018-2032 (EM MILHARES DE USD)
TABELA 471 MERCADO DE ERP DE TI E TELECOMUNICAÇÕES DO VIETNÃ, POR APLICAÇÃO, 2018-2032 (EM MILHARES DE USD)
TABELA 472 MERCADO DE TI E TELECOMUNICAÇÕES DO VIETNÃ EM ERP, POR MODO DE IMPLANTAÇÃO, 2018-2032 (EM MILHARES DE USD)
TABELA 473 MERCADO DE ERP EM NUVEM/MULTI-NUVEM NO VIETNÃ, POR TIPO, 2018-2032 (EM MILHARES DE USD)
TABELA 474 MERCADO DE ERP GOVERNAMENTAL DO VIETNÃ, POR APLICAÇÃO, 2018-2032 (EM MILHARES DE USD)
TABELA 475 PRESENÇA DO GOVERNO DO VIETNÃ NO MERCADO DE ERP, POR MODO DE IMPLANTAÇÃO, 2018-2032 (EM MILHARES DE USD)
TABELA 476 MERCADO DE ERP EM NUVEM/MULTI-NUVEM NO VIETNÃ, POR TIPO, 2018-2032 (EM MILHARES DE USD)
TABELA 477 MERCADO DE ERP DE ENERGIA E SERVIÇOS PÚBLICOS DO VIETNÃ, POR APLICAÇÃO, 2018-2032 (EM MILHARES DE USD)
TABELA 478 MERCADO DE ENERGIA E SERVIÇOS PÚBLICOS DO VIETNÃ NO ERP, POR MODO DE IMPLANTAÇÃO, 2018-2032 (EM MILHARES DE USD)
TABELA 479 MERCADO DE ERP EM NUVEM/MULTI-NUVEM NO VIETNÃ, POR TIPO, 2018-2032 (EM MILHARES DE USD)
TABELA 480 MERCADO DE ERP DE LOGÍSTICA DO VIETNÃ, POR APLICAÇÃO, 2018-2032 (EM MILHARES DE USD)
TABELA 481 LOGÍSTICA DO VIETNÃ NO MERCADO DE ERP, POR MODO DE IMPLANTAÇÃO, 2018-2032 (EM MILHARES DE USD)
TABELA 482 MERCADO DE ERP EM NUVEM/MULTI-NUVEM NO VIETNÃ, POR TIPO, 2018-2032 (EM MILHARES DE USD)
TABELA 483 MERCADO DE ERP PARA EDUCAÇÃO NO VIETNÃ, POR APLICAÇÃO, 2018-2032 (EM MILHARES DE USD)
TABELA 484 EDUCAÇÃO NO MERCADO DE ERP DO VIETNÃ, POR MODO DE IMPLANTAÇÃO, 2018-2032 (EM MILHARES DE USD)
TABELA 485 MERCADO DE ERP EM NUVEM/MULTI-NUVEM NO VIETNÃ, POR TIPO, 2018-2032 (EM MILHARES DE USD)
TABELA 486 MERCADO DE ERP PARA OS SETOR AEROESPACIAL E DE DEFESA DO VIETNÃ, POR APLICAÇÃO, 2018-2032 (EM MILHARES DE USD)
TABELA 487 VIETNÃ AEROESPACIAL E DEFESA NO MERCADO ERP, POR MODO DE IMPLANTAÇÃO, 2018-2032 (EM MILHARES DE USD)
TABELA 488 MERCADO DE ERP EM NUVEM/MULTI-NUVEM NO VIETNÃ, POR TIPO, 2018-2032 (EM MILHARES DE USD)
TABELA 489 VIETNÃ OUTROS NO MERCADO DE ERP, POR MODO DE IMPLANTAÇÃO, 2018-2032 (EM MILHARES DE USD)
TABELA 490 MERCADO DE ERP EM NUVEM/MULTI-NUVEM NO VIETNÃ, POR TIPO, 2018-2032 (EM MILHARES DE USD)
TABELA 491 MERCADO DE ERP DE TAIWAN, POR OFERTA, 2018-2032 (EM MILHARES DE USD)
TABELA 492 SOLUÇÕES TAIWANESAS NO MERCADO DE ERP, POR TIPO, 2018-2032 (EM MILHARES DE USD)
TABELA 493 SERVIÇOS DE TAIWAN NO MERCADO DE ERP, POR TIPO, 2018-2032 (EM MILHARES DE USD)
TABELA 494 SERVIÇOS PROFISSIONAIS DE TAIWAN NO MERCADO DE ERP, POR TIPO, 2018-2032 (EM MILHARES DE USD)
TABELA 495 MERCADO DE ERP DE TAIWAN, POR MODO DE IMPLANTAÇÃO, 2018-2032 (EM MILHARES DE USD)
TABELA 496 MERCADO DE ERP EM NUVEM/MULTI-NUVEM DE TAIWAN, POR TIPO, 2018-2032 (EM MILHARES DE USD)
TABELA 497 MERCADO DE ERP DE TAIWAN, POR TAMANHO DA EMPRESA, 2018-2032 (EM MILHARES DE USD)
TABELA 498 MERCADO DE ERP PARA GRANDES EMPRESAS EM TAIWAN, POR MODO DE IMPLANTAÇÃO, 2018-2032 (EM MILHARES DE USD)
TABELA 499 MERCADO DE ERP EM NUVEM/MULTI-NUVEM DE TAIWAN, POR TIPO, 2018-2032 (EM MILHARES DE USD)
TABELA 500 MERCADO DE ERP DE TAIWAN, POR PREÇOS, 2018-2032 (EM MILHARES DE USD)
TABELA 501 MERCADO DE ERP EM TAIWAN COM BASE EM ASSINATURAS, POR TIPO, 2018-2032 (EM MILHARES DE USD)
TABELA 502 MERCADO DE ERP DE TAIWAN, POR USUÁRIO FINAL, 2018-2032 (EM MILHARES DE USD)
TABELA 503 MERCADO DE ERP PARA FABRICAÇÃO EM TAIWAN, POR APLICAÇÃO, 2018-2032 (EM MILHARES DE USD)
TABELA 504 FABRICAÇÃO TAIWANESA NO MERCADO DE ERP, POR MODO DE IMPLANTAÇÃO, 2018-2032 (EM MILHARES DE USD)
TABELA 505 MERCADO DE ERP EM NUVEM/MULTI-NUVEM DE TAIWAN, POR TIPO, 2018-2032 (EM MILHARES DE USD)
TABELA 506 MERCADO DE ERP PARA VAREJO EM TAIWAN, POR APLICAÇÃO, 2018-2032 (EM MILHARES DE USD)
TABELA 507 VAREJO TAIWANÊS NO MERCADO DE ERP, POR MODO DE IMPLANTAÇÃO, 2018-2032 (EM MILHARES DE USD)
TABELA 508 MERCADO DE ERP EM NUVEM/MULTI-NUVEM DE TAIWAN, POR TIPO, 2018-2032 (EM MILHARES DE USD)
TABELA 509 MERCADO DE ERP PARA O SETOR BFSI DE TAIWAN, POR APLICAÇÃO, 2018-2032 (EM MILHARES DE USD)
TABELA 510 MERCADO DE ERP DO SETOR BFSI DE TAIWAN, POR MODO DE IMPLANTAÇÃO, 2018-2032 (EM MILHARES DE USD)
TABELA 511 MERCADO DE ERP EM NUVEM/MULTI-NUVEM DE TAIWAN, POR TIPO, 2018-2032 (EM MILHARES DE USD)
TABELA 512 MERCADO DE ERP PARA SAÚDE EM TAIWAN, POR APLICAÇÃO, 2018-2032 (EM MILHARES DE USD)
TABELA 513 MERCADO DE SAÚDE ERP EM TAIWAN, POR MODO DE IMPLANTAÇÃO, 2018-2032 (EM MILHARES DE USD)
TABELA 514 MERCADO DE ERP EM NUVEM/MULTI-NUVEM DE TAIWAN, POR TIPO, 2018-2032 (EM MILHARES DE USD)
TABELA 515 MERCADO DE ERP DE TI E TELECOMUNICAÇÕES DE TAIWAN, POR APLICAÇÃO, 2018-2032 (EM MILHARES DE USD)
TABELA 516 MERCADO DE TI E TELECOMUNICAÇÕES DE TAIWAN EM ERP, POR MODO DE IMPLANTAÇÃO, 2018-2032 (EM MILHARES DE USD)
TABELA 517 MERCADO DE ERP EM NUVEM/MULTI-NUVEM DE TAIWAN, POR TIPO, 2018-2032 (EM MILHARES DE USD)
TABELA 518 MERCADO DE ERP GOVERNAMENTAL DE TAIWAN, POR APLICAÇÃO, 2018-2032 (EM MILHARES DE USD)
TABELA 519 PARTICIPAÇÃO DO GOVERNO DE TAIWAN NO MERCADO DE ERP, POR MODO DE IMPLANTAÇÃO, 2018-2032 (EM MILHARES DE USD)
TABELA 520 MERCADO DE ERP EM NUVEM/MULTI-NUVEM DE TAIWAN, POR TIPO, 2018-2032 (EM MILHARES DE USD)
TABELA 521 MERCADO DE ERP DE ENERGIA E SERVIÇOS PÚBLICOS DE TAIWAN, POR APLICAÇÃO, 2018-2032 (EM MILHARES DE USD)
TABELA 522 MERCADO DE ENERGIA E SERVIÇOS PÚBLICOS DE TAIWAN NO ERP, POR MODO DE IMPLANTAÇÃO, 2018-2032 (EM MILHARES DE USD)
TABELA 523 MERCADO DE ERP EM NUVEM/MULTI-NUVEM DE TAIWAN, POR TIPO, 2018-2032 (EM MILHARES DE USD)
TABELA 524 MERCADO DE ERP DE LOGÍSTICA DE TAIWAN, POR APLICAÇÃO, 2018-2032 (EM MILHARES DE USD)
TABELA 525 LOGÍSTICA DE TAIWAN NO MERCADO DE ERP, POR MODO DE IMPLANTAÇÃO, 2018-2032 (EM MILHARES DE USD)
TABELA 526 MERCADO DE ERP EM NUVEM/MULTI-NUVEM DE TAIWAN, POR TIPO, 2018-2032 (EM MILHARES DE USD)
TABELA 527 MERCADO DE ERP PARA EDUCAÇÃO EM TAIWAN, POR APLICAÇÃO, 2018-2032 (EM MILHARES DE USD)
TABELA 528 EDUCAÇÃO EM TAIWAN NO MERCADO DE ERP, POR MODO DE IMPLANTAÇÃO, 2018-2032 (EM MILHARES DE USD)
TABELA 529 MERCADO DE ERP EM NUVEM/MULTI-NUVEM DE TAIWAN, POR TIPO, 2018-2032 (EM MILHARES DE USD)
TABELA 530 MERCADO DE ERP PARA OS SETOR AEROESPACIAL E DE DEFESA DE TAIWAN, POR APLICAÇÃO, 2018-2032 (EM MILHARES DE USD)
TABELA 531 MERCADO DE AEROESPACIAL E DEFESA DE TAIWAN NO ERP, POR MODO DE IMPLANTAÇÃO, 2018-2032 (EM MILHARES DE USD)
TABELA 532 MERCADO DE ERP EM NUVEM/MULTI-NUVEM DE TAIWAN, POR TIPO, 2018-2032 (EM MILHARES DE USD)
TABELA 533 OUTROS PAÍSES DE TAIWAN NO MERCADO DE ERP, POR MODO DE IMPLANTAÇÃO, 2018-2032 (EM MILHARES DE USD)
TABELA 534 MERCADO DE ERP EM NUVEM/MULTI-NUVEM DE TAIWAN, POR TIPO, 2018-2032 (EM MILHARES DE USD)
TABELA 535 MERCADO DE ERP DE HONG KONG, POR OFERTA, 2018-2032 (EM MILHARES DE USD)
TABELA 536 SOLUÇÕES DE HONG KONG NO MERCADO DE ERP, POR TIPO, 2018-2032 (EM MILHARES DE USD)
TABELA 537 SERVIÇOS DE HONG KONG NO MERCADO DE ERP, POR TIPO, 2018-2032 (EM MILHARES DE USD)
TABELA 538 SERVIÇOS PROFISSIONAIS DE HONG KONG NO MERCADO DE ERP, POR TIPO, 2018-2032 (EM MILHARES DE USD)
TABELA 539 MERCADO DE ERP DE HONG KONG, POR MODO DE IMPLANTAÇÃO, 2018-2032 (EM MILHARES DE USD)
TABELA 540 MERCADO DE ERP EM NUVEM/MULTI NUVEM DE HONG KONG, POR TIPO, 2018-2032 (EM MILHARES DE USD)
TABELA 541 MERCADO DE ERP DE HONG KONG, POR TAMANHO DA EMPRESA, 2018-2032 (EM MILHARES DE USD)
TABELA 542 MERCADO DE ERP PARA GRANDES EMPRESAS EM HONG KONG, POR MODO DE IMPLANTAÇÃO, 2018-2032 (EM MILHARES DE USD)
TABELA 543 MERCADO DE ERP EM NUVEM/MULTI NUVEM DE HONG KONG, POR TIPO, 2018-2032 (EM MILHARES DE USD)
TABELA 544 MERCADO DE ERP DE HONG KONG, POR PREÇOS, 2018-2032 (EM MILHARES DE USD)
TABELA 545 MERCADO DE ERP EM HONG KONG COM BASE EM ASSINATURAS, POR TIPO, 2018-2032 (EM MILHARES DE USD)
TABELA 546 MERCADO DE ERP DE HONG KONG, POR USUÁRIO FINAL, 2018-2032 (EM MILHARES DE USD)
TABELA 547 MERCADO DE ERP PARA FABRICAÇÃO EM HONG KONG, POR APLICAÇÃO, 2018-2032 (EM MILHARES DE USD)
TABELA 548 FABRICAÇÃO DE HONG KONG NO MERCADO DE ERP, POR MODO DE IMPLANTAÇÃO, 2018-2032 (EM MILHARES DE USD)
TABELA 549 MERCADO DE ERP EM NUVEM/MULTI NUVEM DE HONG KONG, POR TIPO, 2018-2032 (EM MILHARES DE USD)
TABELA 550 MERCADO DE ERP PARA VAREJO EM HONG KONG, POR APLICAÇÃO, 2018-2032 (EM MILHARES DE USD)
TABELA 551 VAREJO DE HONG KONG NO MERCADO DE ERP, POR MODO DE IMPLANTAÇÃO, 2018-2032 (EM MILHARES DE USD)
TABELA 552 MERCADO DE ERP EM NUVEM/MULTI NUVEM DE HONG KONG, POR TIPO, 2018-2032 (EM MILHARES DE USD)
TABELA 553 MERCADO DE ERP PARA O SETOR BFSI DE HONG KONG, POR APLICAÇÃO, 2018-2032 (EM MILHARES DE USD)
TABELA 554 MERCADO DE BFSI DE HONG KONG EM ERP, POR MODO DE IMPLANTAÇÃO, 2018-2032 (EM MILHARES DE USD)
TABELA 555 MERCADO DE ERP EM NUVEM/MULTI-NUVEM DE HONG KONG, POR TIPO, 2018-2032 (EM MILHARES DE USD)
TABELA 556 MERCADO DE ERP PARA SAÚDE EM HONG KONG, POR APLICAÇÃO, 2018-2032 (EM MILHARES DE USD)
TABELA 557 MERCADO DE SAÚDE ERP EM HONG KONG, POR MODO DE IMPLANTAÇÃO, 2018-2032 (EM MILHARES DE USD)
TABELA 558 MERCADO DE ERP EM NUVEM/MULTI NUVEM DE HONG KONG, POR TIPO, 2018-2032 (EM MILHARES DE USD)
TABELA 559 MERCADO DE ERP DE TI E TELECOMUNICAÇÕES DE HONG KONG, POR APLICAÇÃO, 2018-2032 (EM MILHARES DE USD)
TABELA 560 MERCADO DE TI E TELECOMUNICAÇÕES DE HONG KONG EM ERP, POR MODO DE IMPLANTAÇÃO, 2018-2032 (EM MILHARES DE USD)
TABELA 561 MERCADO DE ERP EM NUVEM/MULTI NUVEM DE HONG KONG, POR TIPO, 2018-2032 (EM MILHARES DE USD)
TABELA 562 MERCADO DE ERP GOVERNAMENTAL DE HONG KONG, POR APLICAÇÃO, 2018-2032 (EM MILHARES DE USD)
TABELA 563 GOVERNO DE HONG KONG NO MERCADO DE ERP, POR MODO DE IMPLANTAÇÃO, 2018-2032 (EM MILHARES DE USD)
TABELA 564 MERCADO DE ERP EM NUVEM/MULTI NUVEM DE HONG KONG, POR TIPO, 2018-2032 (EM MILHARES DE USD)
TABELA 565 MERCADO DE ERP DE ENERGIA E SERVIÇOS PÚBLICOS DE HONG KONG, POR APLICAÇÃO, 2018-2032 (EM MILHARES DE USD)
TABELA 566 MERCADO DE ENERGIA E SERVIÇOS PÚBLICOS DE HONG KONG NO ERP, POR MODO DE IMPLANTAÇÃO, 2018-2032 (EM MILHARES DE USD)
TABELA 567 MERCADO DE ERP EM NUVEM/MULTI NUVEM DE HONG KONG, POR TIPO, 2018-2032 (EM MILHARES DE USD)
TABELA 568 MERCADO DE ERP DE LOGÍSTICA DE HONG KONG, POR APLICAÇÃO, 2018-2032 (EM MILHARES DE USD)
TABELA 569 LOGÍSTICA DE HONG KONG NO MERCADO DE ERP, POR MODO DE IMPLANTAÇÃO, 2018-2032 (EM MILHARES DE USD)
TABELA 570 MERCADO DE ERP EM NUVEM/MULTI NUVEM DE HONG KONG, POR TIPO, 2018-2032 (EM MILHARES DE USD)
TABELA 571 MERCADO DE ERP PARA EDUCAÇÃO EM HONG KONG, POR APLICAÇÃO, 2018-2032 (EM MILHARES DE USD)
TABELA 572 MERCADO DE EDUCAÇÃO EM HONG KONG NO ERP, POR MODO DE IMPLANTAÇÃO, 2018-2032 (EM MILHARES DE USD)
TABELA 573 MERCADO DE ERP EM NUVEM/MULTI NUVEM DE HONG KONG, POR TIPO, 2018-2032 (EM MILHARES DE USD)
TABELA 574 MERCADO DE ERP PARA OS SETOR AEROESPACIAL E DE DEFESA DE HONG KONG, POR APLICAÇÃO, 2018-2032 (EM MILHARES DE USD)
TABELA 575 MERCADO DE AEROESPACIAL E DEFESA DE HONG KONG NO ERP, POR MODO DE IMPLANTAÇÃO, 2018-2032 (EM MILHARES DE USD)
TABELA 576 MERCADO DE ERP EM NUVEM/MULTI NUVEM DE HONG KONG, POR TIPO, 2018-2032 (EM MILHARES DE USD)
TABELA 577 OUTROS EM HONG KONG NO MERCADO DE ERP, POR MODO DE IMPLANTAÇÃO, 2018-2032 (EM MILHARES DE USD)
TABELA 578 MERCADO DE ERP EM NUVEM/MULTI NUVEM DE HONG KONG, POR TIPO, 2018-2032 (EM MILHARES DE USD)
TABELA 579 MERCADO DE ERP NAS FILIPINAS, POR OFERTA, 2018-2032 (EM MILHARES DE USD)
TABELA 580 SOLUÇÕES NAS FILIPINAS NO MERCADO DE ERP, POR TIPO, 2018-2032 (EM MILHARES DE USD)
TABELA 581 SERVIÇOS NAS FILIPINAS NO MERCADO DE ERP, POR TIPO, 2018-2032 (EM MILHARES DE USD)
TABELA 582 SERVIÇOS PROFISSIONAIS NAS FILIPINAS NO MERCADO DE ERP, POR TIPO, 2018-2032 (EM MILHARES DE USD)
TABELA 583 MERCADO DE ERP NAS FILIPINAS, POR MODO DE IMPLANTAÇÃO, 2018-2032 (EM MILHARES DE USD)
TABELA 584 MERCADO DE ERP EM NUVEM/MULTI-NUVEM NAS FILIPINAS, POR TIPO, 2018-2032 (EM MILHARES DE USD)
TABELA 585 MERCADO DE ERP NAS FILIPINAS, POR TAMANHO DA EMPRESA, 2018-2032 (EM MILHARES DE USD)
TABELA 586 MERCADO DE ERP PARA GRANDES EMPRESAS NAS FILIPINAS, POR MODO DE IMPLANTAÇÃO, 2018-2032 (EM MILHARES DE USD)
TABELA 587 MERCADO DE ERP EM NUVEM/MULTI-NUVEM NAS FILIPINAS, POR TIPO, 2018-2032 (EM MILHARES DE USD)
TABELA 588 MERCADO DE ERP NAS FILIPINAS, POR PREÇOS, 2018-2032 (EM MILHARES DE USD)
TABELA 589 MERCADO DE ERP BASEADO EM ASSINATURAS NAS FILIPINAS, POR TIPO, 2018-2032 (EM MILHARES DE USD)
TABELA 590 MERCADO DE ERP NAS FILIPINAS, POR USUÁRIO FINAL, 2018-2032 (EM MILHARES DE USD)
TABELA 591 MERCADO DE ERP PARA FABRICAÇÃO NAS FILIPINAS, POR APLICAÇÃO, 2018-2032 (EM MILHARES DE USD)
TABELA 592 FABRICAÇÃO NAS FILIPINAS NO MERCADO DE ERP, POR MODO DE IMPLANTAÇÃO, 2018-2032 (EM MILHARES DE USD)
TABELA 593 MERCADO DE ERP EM NUVEM/MULTI-NUVEM NAS FILIPINAS, POR TIPO, 2018-2032 (EM MILHARES DE USD)
TABELA 594 MERCADO DE ERP PARA VAREJO NAS FILIPINAS, POR APLICAÇÃO, 2018-2032 (EM MILHARES DE USD)
TABELA 595 VAREJO FILIPINO NO MERCADO DE ERP, POR MODO DE IMPLANTAÇÃO, 2018-2032 (EM MILHARES DE USD)
TABELA 596 MERCADO DE ERP EM NUVEM/MULTI-NUVEM NAS FILIPINAS, POR TIPO, 2018-2032 (EM MILHARES DE USD)
TABELA 597 MERCADO DE ERP PARA O SETOR DE SERVIÇOS FINANCEIROS E DE INVESTIMENTOS NAS FILIPINAS, POR APLICAÇÃO, 2018-2032 (EM MILHARES DE DÓLARES AMERICANOS)
TABELA 598 MERCADO DE ERP DAS FILIPINAS NO SETOR BFSI, POR MODO DE IMPLANTAÇÃO, 2018-2032 (EM MILHARES DE USD)
TABELA 599 MERCADO DE ERP EM NUVEM/MULTI-NUVEM NAS FILIPINAS, POR TIPO, 2018-2032 (EM MILHARES DE USD)
TABELA 600 MERCADO DE ERP PARA SAÚDE NAS FILIPINAS, POR APLICAÇÃO, 2018-2032 (EM MILHARES DE USD)
TABELA 601 MERCADO DE SAÚDE ERP NAS FILIPINAS, POR MODO DE IMPLANTAÇÃO, 2018-2032 (EM MILHARES DE USD)
TABELA 602 MERCADO DE ERP EM NUVEM/MULTI-NUVEM NAS FILIPINAS, POR TIPO, 2018-2032 (EM MILHARES DE USD)
TABELA 603 MERCADO DE ERP DE TI E TELECOMUNICAÇÕES NAS FILIPINAS, POR APLICAÇÃO, 2018-2032 (EM MILHARES DE USD)
TABELA 604 MERCADO DE TI E TELECOMUNICAÇÕES NAS FILIPINAS EM ERP, POR MODO DE IMPLANTAÇÃO, 2018-2032 (EM MILHARES DE USD)
TABELA 605 MERCADO DE ERP EM NUVEM/MULTI-NUVEM NAS FILIPINAS, POR TIPO, 2018-2032 (EM MILHARES DE USD)
TABELA 606 MERCADO DE ERP GOVERNAMENTAL DAS FILIPINAS, POR APLICAÇÃO, 2018-2032 (EM MILHARES DE USD)
TABELA 607 GOVERNO FILIPINO NO MERCADO DE ERP, POR MODO DE IMPLANTAÇÃO, 2018-2032 (EM MILHARES DE USD)
TABELA 608 MERCADO DE ERP EM NUVEM/MULTI-NUVEM NAS FILIPINAS, POR TIPO, 2018-2032 (EM MILHARES DE USD)
TABELA 609 MERCADO DE ERP DE ENERGIA E SERVIÇOS PÚBLICOS NAS FILIPINAS, POR APLICAÇÃO, 2018-2032 (EM MILHARES DE USD)
TABELA 610 MERCADO DE ENERGIA E SERVIÇOS PÚBLICOS NAS FILIPINAS NO ERP, POR MODO DE IMPLANTAÇÃO, 2018-2032 (EM MILHARES DE USD)
TABELA 611 MERCADO DE ERP EM NUVEM/MULTI-NUVEM NAS FILIPINAS, POR TIPO, 2018-2032 (EM MILHARES DE USD)
TABELA 612 MERCADO DE ERP DE LOGÍSTICA NAS FILIPINAS, POR APLICAÇÃO, 2018-2032 (EM MILHARES DE USD)
TABELA 613 LOGÍSTICA NAS FILIPINAS NO MERCADO DE ERP, POR MODO DE IMPLANTAÇÃO, 2018-2032 (EM MILHARES DE USD)
TABELA 614 MERCADO DE ERP EM NUVEM/MULTI-NUVEM NAS FILIPINAS, POR TIPO, 2018-2032 (EM MILHARES DE USD)
TABELA 615 MERCADO DE ERP PARA EDUCAÇÃO NAS FILIPINAS, POR APLICAÇÃO, 2018-2032 (EM MILHARES DE USD)
TABELA 616 EDUCAÇÃO NAS FILIPINAS NO MERCADO DE ERP, POR MODO DE IMPLANTAÇÃO, 2018-2032 (EM MILHARES DE USD)
TABELA 617 MERCADO DE ERP EM NUVEM/MULTI-NUVEM NAS FILIPINAS, POR TIPO, 2018-2032 (EM MILHARES DE USD)
TABELA 618 MERCADO DE ERP PARA OS SETOR AEROESPACIAL E DE DEFESA DAS FILIPINAS, POR APLICAÇÃO, 2018-2032 (EM MILHARES DE USD)
TABELA 619 FILIPINAS AEROESPACIAL E DEFESA NO MERCADO DE ERP, POR MODO DE IMPLANTAÇÃO, 2018-2032 (EM MILHARES DE USD)
TABELA 620 MERCADO DE ERP EM NUVEM/MULTI-NUVEM NAS FILIPINAS, POR TIPO, 2018-2032 (EM MILHARES DE USD)
TABELA 621 FILIPINAS OUTROS NO MERCADO DE ERP, POR MODO DE IMPLANTAÇÃO, 2018-2032 (EM MILHARES DE USD)
TABELA 622 MERCADO DE ERP EM NUVEM/MULTI-NUVEM NAS FILIPINAS, POR TIPO, 2018-2032 (EM MILHARES DE USD)
TABELA 623 MERCADO DE ERP DA NOVA ZELÂNDIA, POR OFERTA, 2018-2032 (EM MILHARES DE USD)
TABELA 624 SOLUÇÕES DA NOVA ZELÂNDIA NO MERCADO DE ERP, POR TIPO, 2018-2032 (EM MILHARES DE USD)
TABELA 625 SERVIÇOS DA NOVA ZELÂNDIA NO MERCADO DE ERP, POR TIPO, 2018-2032 (EM MILHARES DE USD)
TABELA 626 SERVIÇOS PROFISSIONAIS DA NOVA ZELÂNDIA NO MERCADO DE ERP, POR TIPO, 2018-2032 (EM MILHARES DE USD)
TABELA 627 MERCADO DE ERP NA NOVA ZELÂNDIA, POR MODO DE IMPLANTAÇÃO, 2018-2032 (EM MILHARES DE USD)
TABELA 628 MERCADO DE ERP EM NUVEM/MULTI-NUVEM NA NOVA ZELÂNDIA, POR TIPO, 2018-2032 (EM MILHARES DE USD)
TABELA 629 MERCADO DE ERP DA NOVA ZELÂNDIA, POR TAMANHO DA EMPRESA, 2018-2032 (EM MILHARES DE USD)
TABELA 630 MERCADO DE ERP PARA GRANDES EMPRESAS NA NOVA ZELÂNDIA, POR MODO DE IMPLANTAÇÃO, 2018-2032 (EM MILHARES DE USD)
TABELA 631 MERCADO DE ERP EM NUVEM/MULTI NUVEM NA NOVA ZELÂNDIA, POR TIPO, 2018-2032 (EM MILHARES DE USD)
TABELA 632 MERCADO DE ERP DA NOVA ZELÂNDIA, POR PREÇOS, 2018-2032 (EM MILHARES DE USD)
TABELA 633 MERCADO DE ERP DA NOVA ZELÂNDIA COM BASE EM ASSINATURAS, POR TIPO, 2018-2032 (EM MILHARES DE USD)
TABELA 634 MERCADO DE ERP DA NOVA ZELÂNDIA, POR USUÁRIO FINAL, 2018-2032 (EM MILHARES DE USD)
TABELA 635 MERCADO DE ERP PARA FABRICAÇÃO NA NOVA ZELÂNDIA, POR APLICAÇÃO, 2018-2032 (EM MILHARES DE USD)
TABELA 636 FABRICAÇÃO NA NOVA ZELÂNDIA NO MERCADO DE ERP, POR MODO DE IMPLANTAÇÃO, 2018-2032 (EM MILHARES DE USD)
TABELA 637 MERCADO DE ERP EM NUVEM/MULTI-NUVEM NA NOVA ZELÂNDIA, POR TIPO, 2018-2032 (EM MILHARES DE USD)
TABELA 638 MERCADO DE ERP PARA VAREJO NA NOVA ZELÂNDIA, POR APLICAÇÃO, 2018-2032 (EM MILHARES DE USD)
TABELA 639 VAREJO DA NOVA ZELÂNDIA NO MERCADO DE ERP, POR MODO DE IMPLANTAÇÃO, 2018-2032 (EM MILHARES DE USD)
TABELA 640 MERCADO DE ERP EM NUVEM/MULTI-NUVEM NA NOVA ZELÂNDIA, POR TIPO, 2018-2032 (EM MILHARES DE USD)
TABELA 641 MERCADO DE ERP PARA O SETOR BFSI DA NOVA ZELÂNDIA, POR APLICAÇÃO, 2018-2032 (EM MILHARES DE USD)
TABELA 642 MERCADO DE ERP DO SETOR BFSI DA NOVA ZELÂNDIA, POR MODO DE IMPLANTAÇÃO, 2018-2032 (EM MILHARES DE USD)
TABELA 643 MERCADO DE ERP EM NUVEM/MULTI-NUVEM NA NOVA ZELÂNDIA, POR TIPO, 2018-2032 (EM MILHARES DE USD)
TABELA 644 MERCADO DE ERP PARA SAÚDE NA NOVA ZELÂNDIA, POR APLICAÇÃO, 2018-2032 (EM MILHARES DE USD)
TABELA 645 MERCADO DE ERP NA ÁREA DA SAÚDE DA NOVA ZELÂNDIA, POR MODO DE IMPLANTAÇÃO, 2018-2032 (EM MILHARES DE USD)
TABELA 646 MERCADO DE ERP EM NUVEM/MULTI-NUVEM NA NOVA ZELÂNDIA, POR TIPO, 2018-2032 (EM MILHARES DE USD)
TABELA 647 MERCADO DE ERP DE TI E TELECOMUNICAÇÕES DA NOVA ZELÂNDIA, POR APLICAÇÃO, 2018-2032 (EM MILHARES DE USD)
TABELA 648 MERCADO DE TI E TELECOMUNICAÇÕES DA NOVA ZELÂNDIA EM ERP, POR MODO DE IMPLANTAÇÃO, 2018-2032 (EM MILHARES DE USD)
TABELA 649 MERCADO DE ERP EM NUVEM/MULTI NUVEM NA NOVA ZELÂNDIA, POR TIPO, 2018-2032 (EM MILHARES DE USD)
TABELA 650 MERCADO DE ERP GOVERNAMENTAL DA NOVA ZELÂNDIA, POR APLICAÇÃO, 2018-2032 (EM MILHARES DE USD)
TABELA 651 GOVERNO DA NOVA ZELÂNDIA NO MERCADO DE ERP, POR MODO DE IMPLANTAÇÃO, 2018-2032 (EM MILHARES DE USD)
TABELA 652 MERCADO DE ERP EM NUVEM/MULTI-NUVEM NA NOVA ZELÂNDIA, POR TIPO, 2018-2032 (EM MILHARES DE USD)
TABELA 653 MERCADO DE ERP DE ENERGIA E SERVIÇOS PÚBLICOS DA NOVA ZELÂNDIA, POR APLICAÇÃO, 2018-2032 (EM MILHARES DE USD)
TABELA 654 MERCADO DE ENERGIA E SERVIÇOS PÚBLICOS DA NOVA ZELÂNDIA NO ERP, POR MODO DE IMPLANTAÇÃO, 2018-2032 (EM MILHARES DE USD)
TABELA 655 MERCADO DE ERP EM NUVEM/MULTI NUVEM NA NOVA ZELÂNDIA, POR TIPO, 2018-2032 (EM MILHARES DE USD)
TABELA 656 MERCADO DE ERP DE LOGÍSTICA DA NOVA ZELÂNDIA, POR APLICAÇÃO, 2018-2032 (EM MILHARES DE USD)
TABELA 657 LOGÍSTICA DA NOVA ZELÂNDIA NO MERCADO DE ERP, POR MODO DE IMPLANTAÇÃO, 2018-2032 (EM MILHARES DE USD)
TABELA 658 MERCADO DE ERP EM NUVEM/MULTI-NUVEM NA NOVA ZELÂNDIA, POR TIPO, 2018-2032 (EM MILHARES DE USD)
TABELA 659 MERCADO DE ERP EDUCACIONAL DA NOVA ZELÂNDIA, POR APLICAÇÃO, 2018-2032 (EM MILHARES DE USD)
TABELA 660 MERCADO DE EDUCAÇÃO E ERP NA NOVA ZELÂNDIA, POR MODO DE IMPLANTAÇÃO, 2018-2032 (EM MILHARES DE USD)
TABELA 661 MERCADO DE ERP EM NUVEM/MULTI NUVEM NA NOVA ZELÂNDIA, POR TIPO, 2018-2032 (EM MILHARES DE USD)
TABELA 662 MERCADO DE ERP PARA OS SETOR AEROESPACIAL E DE DEFESA DA NOVA ZELÂNDIA, POR APLICAÇÃO, 2018-2032 (EM MILHARES DE USD)
TABELA 663 MERCADO DE AEROESPACIAL E DEFESA DA NOVA ZELÂNDIA NO ERP, POR MODO DE IMPLANTAÇÃO, 2018-2032 (EM MILHARES DE USD)
TABELA 664 MERCADO DE ERP EM NUVEM/MULTI NUVEM NA NOVA ZELÂNDIA, POR TIPO, 2018-2032 (EM MILHARES DE USD)
TABELA 665 NOVA ZELÂNDIA OUTROS NO MERCADO DE ERP, POR MODO DE IMPLANTAÇÃO, 2018-2032 (EM MILHARES DE USD)
TABELA 666 MERCADO DE ERP EM NUVEM/MULTI-NUVEM NA NOVA ZELÂNDIA, POR TIPO, 2018-2032 (EM MILHARES DE USD)
TABELA 667 RESTO DO MERCADO DE ERP NA ÁSIA-PACÍFICO, POR OFERTA, 2018-2032 (EM MILHARES DE USD)
Lista de Figura
FIGURA 1 MERCADO DE ERP NA ÁSIA-PACÍFICO: SEGMENTAÇÃO
FIGURA 2 MERCADO DE ERP DA ÁSIA-PACÍFICO: TRIANGULAÇÃO DE DADOS
FIGURA 3 MERCADO DE ERP NA ÁSIA-PACÍFICO: ANÁLISE DROC
FIGURA 4 MERCADO DE ERP NA ÁSIA-PACÍFICO: ANÁLISE GLOBAL VS. REGIONAL
FIGURA 5 MERCADO DE ERP NA ÁSIA-PACÍFICO: ANÁLISE DE PESQUISA DE EMPRESAS
FIGURA 6 MERCADO DE ERP NA ÁSIA-PACÍFICO: DADOS DEMOGRÁFICOS DAS ENTREVISTAS
FIGURA 7 MERCADO DE ERP DA ÁSIA-PACÍFICO: MATRIZ DE POSICIONAMENTO DE MERCADO DA DBMR
FIGURA 8 MERCADO DE ERP NA ÁSIA-PACÍFICO: ANÁLISE DA PARTICIPAÇÃO DE MERCADO DOS FORNECEDORES
FIGURA 9 MERCADO DE ERP NA ÁSIA-PACÍFICO: MATRIZ DE COBERTURA DE USUÁRIOS FINAIS DO MERCADO
FIGURA 10 MERCADO DE ERP NA ÁSIA-PACÍFICO: SEGMENTAÇÃO
FIGURA 11 RESUMO EXECUTIVO
FIGURA 12 DOIS SEGMENTOS COMPÕEM O MERCADO DE ERP DA ÁSIA-PACÍFICO, POR OFERTA (2024)
FIGURA 13 DECISÕES ESTRATÉGICAS
FIGURA 14: A crescente adoção de ERP baseado em nuvem deverá impulsionar o mercado de ERP na região Ásia-Pacífico no período de previsão de 2025 a 2032.
FIGURA 15: O segmento de soluções deverá representar a maior participação no mercado de ERP da Ásia-Pacífico em 2025 e 2032.
FIGURA 16 ANÁLISE DAS CINCO FORÇAS DE PORTER
FIGURA 17: MOTORES, RESTRIÇÕES, OPORTUNIDADES E DESAFIOS DO MERCADO DE ERP NA ÁSIA-PACÍFICO
FIGURA 18 MERCADO DE ERP NA ÁSIA-PACÍFICO: POR OFERTA, 2024
FIGURA 19 MERCADO DE ERP NA ÁSIA-PACÍFICO: POR MODO DE IMPLANTAÇÃO, 2024
FIGURA 20 MERCADO DE ERP NA ÁSIA-PACÍFICO: POR TAMANHO DA EMPRESA, 2024
FIGURA 21 MERCADO DE ERP NA ÁSIA-PACÍFICO: POR PREÇOS, 2024
FIGURA 22 MERCADO DE ERP NA ÁSIA-PACÍFICO: POR USUÁRIO FINAL, 2024
FIGURA 23 MERCADO DE ERP DA ÁSIA-PACÍFICO, PANORAMA (2024)
FIGURA 24 MERCADO DE ERP NA ÁSIA-PACÍFICO: PARTICIPAÇÃO DAS EMPRESAS EM 2024 (%)
Metodologia de Investigação
A recolha de dados e a análise do ano base são feitas através de módulos de recolha de dados com amostras grandes. A etapa inclui a obtenção de informações de mercado ou dados relacionados através de diversas fontes e estratégias. Inclui examinar e planear antecipadamente todos os dados adquiridos no passado. Da mesma forma, envolve o exame de inconsistências de informação observadas em diferentes fontes de informação. Os dados de mercado são analisados e estimados utilizando modelos estatísticos e coerentes de mercado. Além disso, a análise da quota de mercado e a análise das principais tendências são os principais fatores de sucesso no relatório de mercado. Para saber mais, solicite uma chamada de analista ou abra a sua consulta.
A principal metodologia de investigação utilizada pela equipa de investigação do DBMR é a triangulação de dados que envolve a mineração de dados, a análise do impacto das variáveis de dados no mercado e a validação primária (especialista do setor). Os modelos de dados incluem grelha de posicionamento de fornecedores, análise da linha de tempo do mercado, visão geral e guia de mercado, grelha de posicionamento da empresa, análise de patentes, análise de preços, análise da quota de mercado da empresa, normas de medição, análise global versus regional e de participação dos fornecedores. Para saber mais sobre a metodologia de investigação, faça uma consulta para falar com os nossos especialistas do setor.
Personalização disponível
A Data Bridge Market Research é líder em investigação formativa avançada. Orgulhamo-nos de servir os nossos clientes novos e existentes com dados e análises que correspondem e atendem aos seus objetivos. O relatório pode ser personalizado para incluir análise de tendências de preços de marcas-alvo, compreensão do mercado para países adicionais (solicite a lista de países), dados de resultados de ensaios clínicos, revisão de literatura, mercado remodelado e análise de base de produtos . A análise de mercado dos concorrentes-alvo pode ser analisada desde análises baseadas em tecnologia até estratégias de carteira de mercado. Podemos adicionar quantos concorrentes necessitar de dados no formato e estilo de dados que procura. A nossa equipa de analistas também pode fornecer dados em tabelas dinâmicas de ficheiros Excel em bruto (livro de factos) ou pode ajudá-lo a criar apresentações a partir dos conjuntos de dados disponíveis no relatório.

