Asia Pacific Plastic Compounding Market
Tamanho do mercado em biliões de dólares
CAGR :
% 
 USD
82.64 Billion
USD
125.54 Billion
2024
2032
USD
82.64 Billion
USD
125.54 Billion
2024
2032
| 2025 –2032 | |
| USD 82.64 Billion | |
| USD 125.54 Billion | |
| % | |
|
Segmentação do mercado de compostos plásticos da Ásia-Pacífico, por tipo de polímero (termoplásticos, plásticos termoendurecíveis, plásticos de engenharia, bioplásticos e outros), tipo de enchimento (enchimentos minerais, reforços, aditivos e outros), processo de fabricação (extrusão, compactação/prensagem, amassadeira/mistura Banbury, compostos baseados em moldagem por injeção e outros), propriedades (resistência, durabilidade, flexibilidade, resistência ao impacto, rigidez e outros), aplicação (aeroespacial e defesa, embalagens, elétrica e eletrônica, energia e eletricidade, construção civil, automotiva, dispositivos médicos, móveis e outros) - tendências do setor e previsão para 2032
Tamanho do mercado de compostos plásticos da Ásia-Pacífico
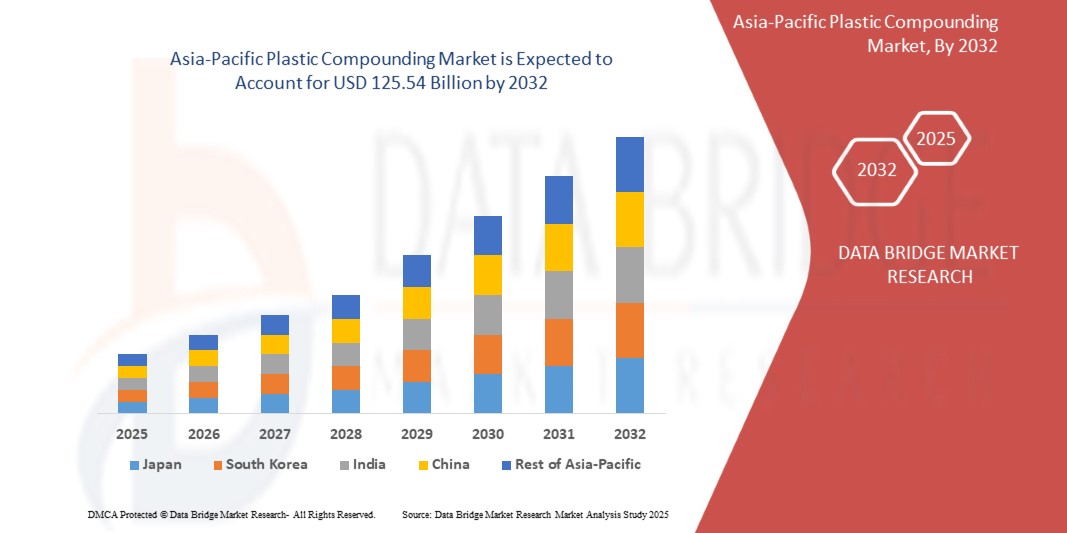
- O tamanho do mercado de compostos plásticos da Ásia-Pacífico foi avaliado em US$ 82,64 bilhões em 2024 e deve atingir US$ 125,54 bilhões até 2032 , com um CAGR de 5,41% durante o período previsto pela mudança para compostos plásticos recicláveis e biodegradáveis devido a regulamentações ambientais, avanços em tecnologias de compostos que melhoram o desempenho do produto e a eficiência de custos e políticas e iniciativas governamentais de apoio que promovem o uso de plásticos em vários setores
- Além disso, espera-se que o mercado aumente o uso de bioplásticos e alternativas de compostos sustentáveis, aumente a adoção de veículos elétricos que exigem polímeros avançados e aumente a demanda por soluções plásticas recicláveis e circulares.
Análise do Mercado de Compostos Plásticos da Ásia-Pacífico
- O aumento global na mudança para compostos plásticos recicláveis e biodegradáveis devido às regulamentações ambientais, avanços nas tecnologias de composição que melhoram o desempenho do produto e a eficiência de custos
- Os principais fatores incluem o aumento global na mudança para compostos plásticos recicláveis e biodegradáveis devido às regulamentações ambientais, avanços nas tecnologias de compostos que melhoram o desempenho do produto e a eficiência de custos, a crescente demanda dos setores de transmissão de energia e o aumento dos investimentos na modernização da rede e na infraestrutura transfronteiriça.
- A China domina o mercado de compostos plásticos da Ásia-Pacífico, detendo a maior fatia de receita de 23,14% em 2024, atribuída à forte capacidade de fabricação, infraestrutura avançada de P&D e crescente adoção de plásticos de alto desempenho nos setores automotivo, aeroespacial e elétrico.
- O segmento de termoplásticos domina o mercado com uma participação de mercado de 65,47% em 2024, crescendo com um CAGR de 5,12% no período previsto de 2025 a 2032. Impulsionado pela crescente demanda por propriedades de materiais aprimoradas, eficiência de custos e adoção crescente em várias aplicações industriais
Escopo do relatório e segmentação do mercado de compostos plásticos da Ásia-Pacífico
|
Atributos |
Principais insights do mercado de compostos plásticos da Ásia-Pacífico |
|
Segmentos abrangidos |
|
|
Países abrangidos |
Ásia-Pacífico
|
|
Principais participantes do mercado |
|
|
Oportunidades de mercado |
|
|
Conjuntos de informações de dados de valor agregado |
Além dos insights sobre cenários de mercado, como valor de mercado, taxa de crescimento, segmentação, cobertura geográfica e principais participantes, os relatórios de mercado selecionados pela Data Bridge Market Research também incluem análise de importação e exportação, visão geral da capacidade de produção, análise de consumo de produção, análise de tendência de preço, cenário de mudança climática, análise da cadeia de suprimentos, análise da cadeia de valor, visão geral de matéria-prima/consumíveis, critérios de seleção de fornecedores, análise PESTLE, análise de Porter e estrutura regulatória. |
Tendências do mercado de compostos plásticos da Ásia-Pacífico
Aumento da demanda por plásticos de alto desempenho
- A demanda por compostos plásticos de alto desempenho está crescendo rapidamente, impulsionada pela crescente urbanização, pela atividade industrial e pelo uso crescente de veículos elétricos e infraestrutura inteligente. Compostos plásticos avançados enfrentam esses desafios, oferecendo maior durabilidade, eficiência energética e desempenho aprimorado do produto.
- À medida que os países se concentram na redução das emissões de carbono e no aprimoramento da estabilidade da rede, observa-se uma crescente mudança em direção à modernização da infraestrutura elétrica, com o uso de compostos plásticos inovadores. Essa transição é crucial para atender à crescente demanda por eletricidade, ao mesmo tempo em que apoia sistemas de transmissão mais limpos e eficientes.
- Grandes players da indústria, como Covestro, LyondellBasell e BASF, estão aumentando significativamente seus esforços de P&D para desenvolver compostos plásticos de última geração que sejam mais sustentáveis, flexíveis e de alto desempenho, impulsionando ainda mais a inovação e o crescimento do mercado.
- Os avanços na tecnologia de compostos plásticos — caracterizados por maior estabilidade térmica, isolamento elétrico e resistência mecânica — estão impulsionando o crescimento do mercado. Os principais fabricantes estão desenvolvendo ativamente compostos especializados para apoiar a integração de energia renovável em larga escala e aprimorar a infraestrutura energética inter-regional, impulsionando a expansão do mercado global de compostos plásticos da Ásia-Pacífico.
Dinâmica do mercado de compostos plásticos da Ásia-Pacífico
Motorista
Mudança para compostos plásticos recicláveis e biodegradáveis devido às regulamentações ambientais
- A crescente demanda global por materiais sustentáveis — impulsionada por regulamentações ambientais rigorosas, aumento da conscientização do consumidor e metas corporativas de sustentabilidade — está exercendo imensa pressão sobre os métodos tradicionais de produção de plástico. Para enfrentar esse desafio, muitos fabricantes estão acelerando os investimentos em compostos plásticos recicláveis e biodegradáveis para reduzir o impacto ambiental e apoiar iniciativas de economia circular. Esses desenvolvimentos estão criando soluções de materiais mais sustentáveis, eficientes e preparadas para o futuro, de forma semelhante à forma como as tecnologias de eficiência energética otimizam o uso de recursos.
- Por exemplo, em 2024, diversas grandes empresas químicas anunciaram projetos de grande escala focados na expansão da capacidade de compostos plásticos biodegradáveis, visando atender à crescente demanda dos setores de embalagens, automotivo e bens de consumo. Essas iniciativas visam reduzir o desperdício de plástico, aumentar a reciclabilidade e cumprir com marcos regulatórios globais, como o Plano de Ação para a Economia Circular da UE.
- Esses investimentos não estão apenas transformando as formulações dos materiais, mas também permitindo uma adoção mais ampla de plásticos sustentáveis em todos os setores. Empresas líderes como BASF, Covestro e LyondellBasell estão investindo fortemente em P&D para desenvolver compostos plásticos de base biológica e recicláveis de última geração, garantindo melhor desempenho e conformidade ambiental.
- Além disso, o compromisso contínuo de governos, empresas privadas e órgãos reguladores desempenha um papel fundamental na promoção de plásticos recicláveis e biodegradáveis como um componente essencial dos esforços globais de sustentabilidade. Essas iniciativas estão consolidando os compostos plásticos ecológicos como um facilitador essencial da economia circular e um importante impulsionador do crescimento no mercado global de compostos plásticos da Ásia-Pacífico.
Restrição/Desafio
Volatilidade nos preços das matérias-primas, especialmente matérias-primas derivadas do petróleo, como polipropileno e polietileno
- A volatilidade dos preços das matérias-primas, especialmente de matérias-primas à base de petróleo, como polipropileno e polietileno, continua sendo uma restrição significativa ao mercado de compostos plásticos da Ásia-Pacífico. A flutuação dos preços impacta os custos de produção e a lucratividade, gerando incerteza tanto para fabricantes quanto para usuários finais.
- Além disso, a dependência dos mercados de petróleo bruto expõe a indústria de compostos a tensões geopolíticas, interrupções na cadeia de abastecimento e mudanças nas políticas comerciais, o que pode levar a picos repentinos de preços ou escassez.
- Por exemplo, no início de 2025, as flutuações globais do preço do petróleo bruto fizeram com que os preços do polipropileno variassem mais de 20% em poucos meses, afetando diretamente os custos de insumos dos fabricantes de compostos plásticos e forçando ajustes nas estratégias de preços.
- Além disso, matérias-primas alternativas, como matérias-primas de base biológica, embora promissoras, são atualmente limitadas por custos mais elevados e desafios de escalabilidade, impedindo a mitigação total da volatilidade do preço do petróleo.
- Essa instabilidade de preços representa desafios para o planejamento e o investimento de longo prazo no setor de compostos plásticos, especialmente para fabricantes menores e regiões com menor resiliência financeira. Apesar dos esforços para diversificar as fontes de matéria-prima e melhorar a flexibilidade da cadeia de suprimentos, a volatilidade nos preços da matéria-prima continua sendo um obstáculo fundamental para o crescimento estável.
Escopo do mercado de compostos plásticos da Ásia-Pacífico
O mercado é segmentado com base no tipo de polímero, tipo de enchimento, processo de fabricação, propriedades e aplicação.
- Tipo de polímero
Com base no tipo de polímero, o mercado é segmentado em termoplásticos, plásticos termofixos, plásticos de engenharia, bioplásticos e outros. Em 2025, espera-se que o segmento de termoplásticos domine o mercado, com uma participação de mercado de 65,30%, crescendo com um CAGR de 5,12% no período previsto de 2025 a 2032, impulsionado pela crescente demanda por materiais leves e duráveis em todos os setores e pelo foco crescente em compostos plásticos recicláveis e sustentáveis.
- Tipo de enchimento
Com base no tipo de carga, o mercado é segmentado em cargas minerais, reforços, aditivos e outros. Em 2025, espera-se que o segmento de cargas minerais domine o mercado, com uma participação de mercado de 52,95%, crescendo com um CAGR de 5,87% no período previsto de 2025 a 2032, impulsionado pela crescente demanda por materiais com propriedades aprimoradas, custo-benefício e crescente adoção em diversas aplicações industriais.
- Processo de fabricação
Com base no processo de fabricação, o mercado é segmentado em extrusão, compactação/prensagem, amassadeira/mistura Banbury, compostos à base de moldagem por injeção, entre outros. Em 2025, espera-se que o segmento de extrusão domine o mercado, com uma participação de mercado de 49,59%, crescendo com o maior CAGR de 5,62% no período previsto de 2025 a 2032, impulsionado por sua ampla adoção para compostos eficientes e contínuos e pela crescente demanda por compostos plásticos de alta qualidade em diversos setores.
- Propriedades
Com base nas propriedades, o mercado é segmentado em resistência, durabilidade, flexibilidade, resistência ao impacto, rigidez, entre outras. Em 2025, espera-se que o segmento de resistência domine o mercado, com uma participação de mercado de 35,12%, crescendo com um CAGR de 5,75% no período previsto de 2025 a 2032, impulsionado pela crescente demanda por compostos plásticos de alta durabilidade e alto desempenho nos setores automotivo, de construção e de bens de consumo.
- Aplicativo
Com base na aplicação, o mercado é segmentado em aeroespacial e defesa, embalagens, elétrica e eletrônica, energia e eletricidade, construção civil, automotivo, dispositivos médicos, móveis e outros. Em 2025, espera-se que o segmento automotivo domine o mercado, com uma participação de mercado de 34,06%, crescendo com um CAGR de 4,77% no período previsto de 2025 a 2032, impulsionado pela crescente demanda por compostos plásticos leves, duráveis e recicláveis para melhorar a eficiência de combustível e atender às rigorosas regulamentações ambientais.
Análise regional do mercado de compostos plásticos da Ásia-Pacífico
- Espera-se que o mercado de compostos plásticos da Ásia-Pacífico atinja US$ 125,54 bilhões até 2032, ante US$ 82,64 bilhões em 2024, crescendo a uma taxa composta de crescimento anual (CAGR) de 5,41% no período previsto de 2025 a 2032.
- A região da Ásia-Pacífico destina uma parcela significativa de seu PIB à manufatura e ao desenvolvimento industrial, garantindo financiamento robusto para materiais avançados e tecnologias inovadoras de compostos plásticos. Em contrapartida, os mercados emergentes estão aumentando seus investimentos em compostos plásticos, impulsionados pela crescente industrialização, urbanização e demanda crescente por materiais sustentáveis e de alto desempenho. A disponibilidade de financiamento, tanto do setor público quanto do privado, desempenha um papel crucial na expansão das capacidades de produção e na adoção de compostos plásticos avançados em todo o mundo.
- Na Ásia-Pacífico, tecnologias avançadas de compostos plásticos são amplamente adotadas e integradas a diversas aplicações industriais, apoiando setores como automotivo, aeroespacial e eletrônico. Em contrapartida, mercados emergentes com infraestrutura de manufatura em desenvolvimento estão vivenciando um rápido crescimento na demanda por compostos plásticos especializados, impulsionado pela expansão das bases industriais e pelo aumento das necessidades nos setores de saúde, automotivo e embalagens. À medida que esses sistemas de saúde e industriais se tornam mais centralizados ou privatizados, isso frequentemente leva a um aumento no investimento em tecnologias de ponta em compostos plásticos, o que promove o crescimento e a acessibilidade do mercado.
Visão do mercado de compostos plásticos da China Ásia-Pacífico
Espera-se que a China registre um CAGR de 6,26% entre 2025 e 2032 na região Ásia-Pacífico, impulsionado pela crescente demanda por propriedades aprimoradas de materiais, eficiência de custos e crescente adoção em diversas aplicações industriais.
Visão do mercado de compostos plásticos Índia-Ásia-Pacífico
Espera-se que a Índia registre um CAGR de 5,73% entre 2025 e 2032, impulsionado pela crescente demanda por materiais leves e duráveis em todos os setores e pelo foco crescente em compostos plásticos recicláveis e sustentáveis.
Participação no mercado de compostos plásticos da Ásia-Pacífico
O mercado de compostos plásticos da Ásia-Pacífico é liderado principalmente por empresas bem estabelecidas, incluindo:
- LyondellBasell Industries Holdings BV (EUA)
- BASF (Alemanha)
- LG Chem (Coreia do Sul)
- Dow (EUA)
- SABIC (Arábia Saudita)
- Covestro AG (Alemanha)
- Teknor Apex (EUA)
- LANXESS (Alemanha)
- Celanese Corporation (EUA)
- Borealis GmbH (Áustria)
- Asahi Kasei Corp. (Japão)
- Mitsubishi Chemical Group Corporation (Japão)
- DuPont (EUA)
- Avient Corporation (EUA)
- CHIMEI (Taiwan)
- INEOS (Reino Unido)
- Kingfa Sci. e tecnologia. Co., Ltd (China)
- Washington Penn (EUA)
- Empresa RTP (EUA)
- Syensqo (Bélgica)
- Envalior (Alemanha)
- Arkema (França)
- Trinseo (EUA)
- Daicel Corporation (Japão)
- KANEKA CORPORATION (Japão)
- TORAY INDUSTRIES, INC. (Japão)
- Mitsui Chemicals, Inc. (Japão)
- Ensinger (Alemanha)
- SCG (Tailândia)
- CLARIANT (Suíça)
Últimos desenvolvimentos no mercado de compostos plásticos da Ásia-Pacífico
- Em junho de 2025, a Envalior, em colaboração com a SENTImotion e o Frencken Group, anunciou uma inovação de produto envolvendo um novo conceito de caixa de engrenagens para braços robóticos utilizando plástico de engenharia Stanyl PA46. Este desenvolvimento permite caixas de engrenagens 50% mais leves e 50% mais econômicas em comparação com alternativas metálicas, possibilitando a produção em larga escala de robôs leves e energeticamente eficientes. A inovação beneficia significativamente a Envalior, expandindo sua presença nos setores de robótica e mobilidade, abrindo novas oportunidades de crescimento nos setores de automação industrial e de consumo.
- Em maio de 2024, a Envalior anunciou sua participação na conferência SKZ “Plastics in E&E Applications”, onde apresentou inovações de produtos, incluindo compostos sustentáveis de poliamida 6 e um novo PBT retardante de chamas sem halogênio (por exemplo, Pocan BFN4221Z). Este desenvolvimento visa expandir o portfólio de plásticos de engenharia da Envalior com uma proporção maior de matérias-primas sustentáveis, permitindo que os clientes reduzam sua pegada de carbono e a dependência de insumos fósseis. Os materiais em destaque oferecem desempenho mecânico e retardamento de chama aprimorados, posicionando a Envalior para melhor atender à crescente demanda em setores de E&E, como eletromobilidade, 5G e sistemas autônomos, ao mesmo tempo em que reforça sua liderança em termoplásticos sustentáveis.
- Em julho de 2025, a Arkema lançou Zenimid, uma nova marca para sua linha de poliimida de ultra-alto desempenho, marcando um desenvolvimento estratégico de produto. Essa inovação aprimora o portfólio de materiais especiais da Arkema, atendendo a setores de alta demanda, como aeroespacial, eletrônico e automotivo. Com excepcional resistência térmica, mecânica e química, Zenimid impulsiona o crescimento da empresa em aplicações avançadas. O lançamento reforça a posição da Arkema no mercado de polímeros de alto desempenho.
- Em junho de 2025, a Trinseo apresentou o LIGOS A9615, um novo adesivo acrílico desenvolvido especialmente para o segmento de Etiquetas de Uso Geral (GPL), lançado em 9 de junho de 2025, voltado para etiquetas de filme no mercado do Sudeste Asiático. Este desenvolvimento representa um lançamento estratégico de produto que reforça a força da Trinseo em inovação em adesivos. Os principais benefícios do produto incluem excelente resistência ao envelhecimento, remoção limpa com capacidade de reposicionamento e resistência a plastificantes, permitindo adesão confiável mesmo em superfícies curvas de PVC comuns em aplicações de bens de consumo e embalagens.
- Em fevereiro de 2025, a Trinseo anunciou o lançamento do primeiro produto de resina de poliestireno reciclado por dissolução (rPS) transparente na Europa, aprovado especificamente para contato direto com alimentos, oficialmente em conformidade com o Regulamento (UE) 2022/1616. Este marco regulatório ocorreu após extensos testes, incluindo um "Teste de Desafio" conduzido com o Instituto Fraunhofer para validar a eficácia da descontaminação e a conformidade com a segurança alimentar da resina final. Produzida na unidade da Trinseo em Schkopau e contendo aproximadamente 30% de conteúdo reciclado, a nova resina rPS oferece uma redução de pegada de carbono de cerca de 18% em comparação com o poliestireno virgem. Para a Trinseo, este desenvolvimento representa um avanço estratégico em sustentabilidade, permitindo à empresa atender à crescente demanda por soluções de materiais circulares e apoiar as metas de conteúdo reciclado de seus clientes.
SKU-
Obtenha acesso online ao relatório sobre a primeira nuvem de inteligência de mercado do mundo

- Painel interativo de análise de dados
- Painel de análise da empresa para oportunidades de elevado potencial de crescimento
- Acesso de analista de pesquisa para personalização e customização. consultas
- Análise da concorrência com painel interativo
- Últimas notícias, atualizações e atualizações Análise de tendências
- Aproveite o poder da análise de benchmark para um rastreio abrangente da concorrência
Índice
1 INTRODUÇÃO
1.1 OBJETIVOS DO ESTUDO
1.2 DEFINIÇÃO DE MERCADO
1.3 VISÃO GERAL
1.4 LIMITAÇÕES
1,5 MERCADOS COBERTOS
2 SEGMENTAÇÃO DE MERCADO
2.1 MERCADOS COBERTOS
2.2 ÂMBITO GEOGRÁFICO
2,3 ANOS CONSIDERADOS PARA O ESTUDO
2.4 MOEDA E PREÇOS
2.5 MODELO DE VALIDAÇÃO DE DADOS TRIPÉ DBMR
2.6 MODELAGEM MULTIVARIADA
2.7 ENTREVISTAS PRINCIPAIS COM PRINCIPAIS LÍDERES DE OPINIÃO
2.8 GRADE DE POSIÇÃO DE MERCADO DBMR
2.9 GRADE DE COBERTURA DE APLICAÇÃO DE MERCADO
2.1 FONTES SECUNDÁRIAS
2.11 PREMISSAS
3 RESUMO EXECUTIVO
4 INSIGHTS PREMIUM
4.1 ANÁLISE DAS CINCO FORÇAS DE PORTER
4.1.1 AMEAÇA DE NOVOS ENTRADANTES
4.1.2 PODER DE BARGANHA DOS FORNECEDORES
4.1.3 PODER DE BARGANHA DOS COMPRADORES
4.1.4 AMEAÇA DE SUBSTITUTOS
4.1.5 CONCORRÊNCIA INTERNA
4.2 RASTREADOR DE INOVAÇÃO E ANÁLISE ESTRATÉGICA
4.2.1 ANÁLISE DE GRANDES NEGÓCIOS E ALIANÇAS ESTRATÉGICAS
4.2.1.1 JOINT VENTURES
4.2.1.2 FUSÕES E AQUISIÇÕES
4.2.1.3 LICENCIAMENTO E PARCERIA
4.2.1.4 COLABORAÇÕES DE TECNOLOGIA
4.2.1.5 DESINVESTIMENTOS ESTRATÉGICOS
4.2.2 NÚMERO DE PRODUTOS EM DESENVOLVIMENTO
4.2.3 ESTÁGIO DE DESENVOLVIMENTO
4.2.4 CRONOGRAMAS E MARCOS
4.2.5 ESTRATÉGIAS E METODOLOGIAS DE INOVAÇÃO
4.2.6 AVALIAÇÃO E MITIGAÇÃO DE RISCOS
4.2.7 PERSPECTIVAS FUTURAS
4.3 ANÁLISE DA CADEIA DE VALOR
4.4 CENÁRIO DE IMPORTAÇÃO E EXPORTAÇÃO
4.5 CAPACIDADE DE PRODUÇÃO PARA OS PRINCIPAIS FABRICANTES
4.6 PERSPECTIVA DA MARCA
4.7 COMPORTAMENTO DE COMPRA DO CONSUMIDOR
4.8 BASE DE DADOS DE COMPOSTOS E DOS EQUIPAMENTOS QUE ELES TÊM EM USO
4.9 ANÁLISE DE PATENTES
4.9.1 QUALIDADE E RESISTÊNCIA DA PATENTE
4.9.2 FAMÍLIAS DE PATENTES
4.9.3 LICENCIAMENTO E COLABORAÇÕES
4.9.4 CENÁRIO DE PATENTES DA REGIÃO
4.9.5 ESTRATÉGIA E GESTÃO DE PI
4.1 COBERTURA DE MATÉRIA-PRIMA
4.11 ANÁLISE DA CADEIA DE SUPRIMENTOS DO MERCADO DE COMPOSTOS PLÁSTICOS DA ÁSIA-PACÍFICO
4.11.1 VISÃO GERAL
4.11.2 CENÁRIOS DE CUSTOS LOGÍSTICOS
4.11.3 IMPORTÂNCIA DOS PRESTADORES DE SERVIÇOS LOGÍSTICOS (PSL)
4.12 AVANÇOS TECNOLÓGICOS NO MERCADO DE COMPOSTOS PLÁSTICOS DA ÁSIA-PACÍFICO
4.12.1 IA E OTIMIZAÇÃO DE PROCESSOS DIGITAIS
4.12.2 TECNOLOGIAS AVANÇADAS DE EXTRUSÃO E MANUSEIO DE MATERIAIS
4.12.3 COMPOSTOS POLIMÉRICOS DE BASE BIOLÓGICA E FUNCIONALIZADOS
4.12.4 SOLUÇÕES DE COMPOSIÇÃO INTELIGENTES E RESPONSIVAS
4.12.5 AUTOMAÇÃO E INDÚSTRIA 4.0 EM OPERAÇÕES DE COMPOSTOS
4.12.6 INOVAÇÕES EM SUSTENTABILIDADE E ECONOMIA CIRCULAR
4.12.7 PLATAFORMAS DIGITAIS DE ENGAJAMENTO E FORMULAÇÃO DE CLIENTES
4.13 CRITÉRIOS DE SELEÇÃO DE FORNECEDORES
4.14 QUADRANTE DE AVALIAÇÃO DE EMPRESAS
4.15 ANÁLISE DE PREÇOS
5 PAPEL DAS TARIFAS NO MERCADO DE COMPOSTOS PLÁSTICOS DA ÁSIA-PACÍFICO
5.1 CENÁRIO TARIFÁRIO: IMPOSTOS SOBRE POLÍMEROS, ADITIVOS E MÁQUINAS
5.2 IMPACTO DAS TARIFAS NAS ESTRUTURAS DE CUSTOS E NA DINÂMICA DA CADEIA DE SUPRIMENTOS
5.3 INFLUÊNCIA DE ACORDOS COMERCIAIS E POLÍTICAS REGULAMENTARES
5.4 TENDÊNCIAS DE MERCADO AMPLIFICANDO OS IMPACTOS TARIFÁRIOS
5.5 IMPLICAÇÕES COMPETITIVAS PARA OS PARTICIPANTES DA INDÚSTRIA
5.6 DESAFIOS E OPORTUNIDADES DECORRENTES DAS TARIFAS
5.7 PRINCIPAIS EMPRESAS E RESUMO DA ESTRATÉGIA TARIFÁRIA
6 COBERTURA REGULAMENTAR: MERCADO DE COMPOSTOS PLÁSTICOS DA ÁSIA-PACÍFICO
7 VISÃO GERAL DO MERCADO
7.1 MOTORISTAS
7.1.1 MUDANÇA PARA COMPOSTOS PLÁSTICOS RECICLÁVEIS E BIODEGRADÁVEIS DEVIDO ÀS REGULAMENTAÇÕES AMBIENTAIS
7.1.2 AVANÇOS NAS TECNOLOGIAS DE COMPOSTOS QUE MELHORAM O DESEMPENHO DO PRODUTO E A EFICIÊNCIA DE CUSTOS
7.1.3 DESENVOLVIMENTO DE PLÁSTICOS NANOCOMPÓSITOS QUE OFERECEM PROPRIEDADES MECÂNICAS E DE BARREIRA SUPERIORES
7.1.4 AUMENTO DO USO DE PLÁSTICOS COMPOSTOS EM DISPOSITIVOS MÉDICOS DEVIDO À BIOCOMPATIBILIDADE E À COMPATIBILIDADE COM A ESTERILIZAÇÃO
7.2 RESTRIÇÕES
7.2.1 VOLATILIDADE NOS PREÇOS DAS MATÉRIAS-PRIMAS, ESPECIALMENTE DAS MATÉRIAS-PRIMAS À BASE DE PETRÓLEO, COMO O POLIPROPILENO E O POLIETILENO
7.2.2 PROCESSOS DE RECICLAGEM COMPLEXOS E AUSÊNCIA DE INFRAESTRUTURA ADEQUADA PARA GESTÃO DE RESÍDUOS DE COMPOSTOS PLÁSTICOS
7.3 OPORTUNIDADES
7.3.1 USO CRESCENTE DE BIOPLÁSTICOS E ALTERNATIVAS DE COMPOSTOS SUSTENTÁVEIS
7.3.2 AUMENTO NA ADOÇÃO DE VEÍCULOS ELÉTRICOS EXIGINDO POLÍMEROS AVANÇADOS
7.3.3 AUMENTO DA DEMANDA POR SOLUÇÕES PLÁSTICAS RECICLÁVEIS E CIRCULARES
7.4 DESAFIOS
7.4.1 LIMITAÇÕES DE DESEMPENHO DE ALTERNATIVAS SUSTENTÁVEIS
7.4.2 FRAGMENTAÇÃO REGULAMENTAR E DE PADRÕES ENTRE REGIÕES
8 MERCADO DE COMPOSTOS PLÁSTICOS DA ÁSIA-PACÍFICO, POR TIPO DE POLÍMERO
8.1 VISÃO GERAL
8.2 TERMOPLÁSTICOS
8.2.1 TERMOPLÁSTICOS, POR TIPO
8.2.2 POLIETILENO (PE), POR TIPO
8.3 PLÁSTICOS DE ENGENHARIA
8.3.1 PLÁSTICOS DE ENGENHARIA, POR TIPO
8.4 PLÁSTICOS TERMOFIXOS
8.4.1 PLÁSTICOS TERMOFIXOS, POR TIPO
8.5 BIOPLÁSTICOS
8.5.1 BIOPLÁSTICOS, POR TIPO
8.6 OUTROS
9 MERCADO DE COMPOSTOS PLÁSTICOS DA ÁSIA-PACÍFICO, POR TIPO DE ENCHIMENTO
9.1 VISÃO GERAL
9.2 CARGAS MINERAIS
9.2.1 CARGAS MINERAIS, POR TIPO
9.3 REFORÇOS
9.3.1 REFORÇOS, POR TIPO
9.4 ADITIVOS
9.4.1 ADITIVOS, POR TIPO
9.5 OUTROS
10 MERCADO DE COMPOSTOS PLÁSTICOS DA ÁSIA-PACÍFICO, POR PROCESSO DE FABRICAÇÃO
10.1 VISÃO GERAL
10.2 EXTRUSÃO
10.2.1 EXTRUSÃO, POR TIPO
10.2.2 EXTRUSÃO, POR SISTEMA DE PELOTIZAÇÃO
10.3 COMPOSTOS À BASE DE MOLDAGEM POR INJEÇÃO
10.3.1 COMPOSTOS À BASE DE MOLDAGEM POR INJEÇÃO, POR SISTEMA DE PELOTIZAÇÃO
10.4 COMPACTAÇÃO/PRENSAGEM
10.4.1 COMPACTAÇÃO/PRENSAGEM, POR SISTEMA DE PELOTIZAÇÃO
10.5 AMASSADOR/MISTURA BANBURY
10.5.1 AMASSADOR/MISTURA BANBURY, POR SISTEMA DE PELLETIZAÇÃO
10.6 OUTROS
11 MERCADO DE COMPOSTOS PLÁSTICOS DA ÁSIA-PACÍFICO, POR PROPRIEDADES
11.1 VISÃO GERAL
11.2 RESISTÊNCIA
11.3 DURABILIDADE
11.4 FLEXIBILIDADE
11.5 RESISTÊNCIA AO IMPACTO
11.6 RIGIDEZ
11.7 OUTROS
12 MERCADO DE COMPOSTOS PLÁSTICOS DA ÁSIA-PACÍFICO, POR APLICAÇÃO
12.1 VISÃO GERAL
12.2 AUTOMOTIVO
12.2.1 AUTOMOTIVO, POR CATEGORIA
12.2.1.1 COMPONENTES INTERNOS, POR TIPO
12.2.1.2 PARTES EXTERNAS DA CARROÇARIA, POR TIPO
12.2.1.3 APLICAÇÕES SOB O CAPÔ, POR TIPO
12.3 EMBALAGEM
12.3.1 EMBALAGEM, POR CATEGORIA
12.3.1.1 EMBALAGENS PARA ALIMENTOS E BEBIDAS, POR TIPO
12.3.1.2 EMBALAGENS INDUSTRIAIS, POR TIPO
12.3.1.3 EMBALAGENS DE BENS DE CONSUMO, POR TIPO
12.4 EDIFÍCIO E CONSTRUÇÃO
12.4.1 EDIFÍCIOS E CONSTRUÇÃO, POR CATEGORIA
12.5 ELÉTRICA E ELETRÔNICA
12.5.1 ELÉTRICA E ELETRÔNICA, POR CATEGORIA
12.6 DISPOSITIVOS MÉDICOS
12.6.1 DISPOSITIVOS MÉDICOS, POR CATEGORIA
12.7 MÓVEIS
12.7.1 MÓVEIS, POR CATEGORIA
12.8 ENERGIA E POTÊNCIA
12.8.1 ENERGIA E POTÊNCIA, POR CATEGORIA
12.9 AEROESPACIAL E DEFESA
12.9.1 AEROESPACIAL E DEFESA, POR CATEGORIA
12.1 OUTROS
13 MERCADO DE COMPOSTOS PLÁSTICOS DA ÁSIA-PACÍFICO POR PAÍSES
13.1 ÁSIA-PACÍFICO
13.1.1 CHINA
13.1.2 ÍNDIA
13.1.3 JAPÃO
13.1.4 COREIA DO SUL
13.1.5 TAILÂNDIA
13.1.6 SINGAPURA
13.1.7 INDONÉSIA
13.1.8 AUSTRÁLIA
13.1.9 NOVA ZELÂNDIA
13.1.10 FILIPINAS
13.1.11 MALÁSIA
13.1.12 TAIWAN
13.1.13 HONG KONG
13.1.14 RESTO DA ÁSIA-PACÍFICO
14 MERCADO DE COMPOSTOS PLÁSTICOS DA ÁSIA-PACÍFICO: CENÁRIO DA EMPRESA
14.1 ANÁLISE DE AÇÕES DA EMPRESA: ÁSIA-PACÍFICO
15 ANÁLISE SWOT
16 PERFIS DE EMPRESAS
16.1 SABIC
16.1.1 RESUMO DA EMPRESA
16.1.2 ANÁLISE DE RECEITA
16.1.3 ANÁLISE DAS AÇÕES DA EMPRESA
16.1.4 PORTFÓLIO DE PRODUTOS
16.1.5 DESENVOLVIMENTO RECENTE
16.2 LYONDELLBASELL INDUSTRIES HOLDINGS BV
16.2.1 RESUMO DA EMPRESA
16.2.2 ANÁLISE DE RECEITA
16.2.3 ANÁLISE DAS AÇÕES DA EMPRESA
16.2.4 PORTFÓLIO DE PRODUTOS
16.2.5 DESENVOLVIMENTOS/NOTÍCIAS RECENTES
16.3 DOW
16.3.1 RESUMO DA EMPRESA
16.3.2 ANÁLISE DE RECEITA
16.3.3 ANÁLISE DE AÇÕES DA EMPRESA
16.3.4 PORTFÓLIO DE PRODUTOS
16.3.5 DESENVOLVIMENTO RECENTE
16.4 DUPONT
16.4.1 RESUMO DA EMPRESA
16.4.2 ANÁLISE DE RECEITA
16.4.3 ANÁLISE DAS AÇÕES DA EMPRESA
16.4.4 PORTFÓLIO DE PRODUTOS
16.4.5 DESENVOLVIMENTO RECENTE
16.5 ARKEMA
16.5.1 RESUMO DA EMPRESA
16.5.2 ANÁLISE DE RECEITA
16.5.3 ANÁLISE DAS AÇÕES DA EMPRESA
16.5.4 PORTFÓLIO DE PRODUTOS
16.5.5 DESENVOLVIMENTOS RECENTES
16.6 ASAHI KASEI CORP.
16.6.1 RESUMO DA EMPRESA
16.6.2 ANÁLISE DE RECEITA
16.6.3 PORTFÓLIO DE PRODUTOS
16.6.4 DESENVOLVIMENTO RECENTE
16.7 CORPORAÇÃO AVIENT
16.7.1 RESUMO DA EMPRESA
16.7.2 ANÁLISE DE RECEITA
16.7.3 PORTFÓLIO DE PRODUTOS
16.7.4 DESENVOLVIMENTO RECENTE
16.8 BOREALIS GMBH
16.8.1 RESUMO DA EMPRESA
16.8.2 PORTFÓLIO DE PRODUTOS
16.8.3 DESENVOLVIMENTO RECENTE
16.9 BASF
16.9.1 RESUMO DA EMPRESA
16.9.2 ANÁLISE DE RECEITA
16.9.3 PORTFÓLIO DE PRODUTOS
16.9.4 DESENVOLVIMENTO RECENTE
16.1 CORPORAÇÃO CLEANESA
16.10.1 RESUMO DA EMPRESA
16.10.2 ANÁLISE DE RECEITA
16.10.3 PORTFÓLIO DE PRODUTOS
16.10.4 DESENVOLVIMENTO RECENTE
16.11 CHIMEI
16.11.1 RESUMO DA EMPRESA
16.11.2 ANÁLISE DE RECEITA
16.11.3 PORTFÓLIO DE PRODUTOS
16.11.4 DESENVOLVIMENTO RECENTE
16.12 CLARIANT
16.12.1 RESUMO DA EMPRESA
16.12.2 ANÁLISE DE RECEITA
16.12.3 PORTFÓLIO DE PRODUTOS
16.12.4 DESENVOLVIMENTO RECENTE
16.13 COVESTRO AG
16.13.1 RESUMO DA EMPRESA
16.13.2 ANÁLISE DE RECEITA
16.13.3 PORTFÓLIO DE PRODUTOS
16.13.4 DESENVOLVIMENTO RECENTE
16.14 DAICEL CORPORATION
16.14.1 RESUMO DA EMPRESA
16.14.2 ANÁLISE DE RECEITA
16.14.3 PORTFÓLIO DE PRODUTOS
16.14.4 DESENVOLVIMENTOS RECENTES
16.15 ENSINGER GMBH
16.15.1 RESUMO DA EMPRESA
16.15.2 PORTFÓLIO DE PRODUTOS
16.15.3 DESENVOLVIMENTO RECENTE
16.16 ENVALIOR
16.16.1 RESUMO DA EMPRESA
16.16.2 PORTFÓLIO DE PRODUTOS
16.16.3 DESENVOLVIMENTOS RECENTES
16.17 INEOS
16.17.1 RESUMO DA EMPRESA
16.17.2 PORTFÓLIO DE PRODUTOS
16.17.3 DESENVOLVIMENTO RECENTE
16.18 CORPORAÇÃO KANEKA
16.18.1 RESUMO DA EMPRESA
16.18.2 ANÁLISE DE RECEITA
16.18.3 PORTFÓLIO DE PRODUTOS
16.18.4 DESENVOLVIMENTO RECENTE
16.19 KINGFA SCI.&TECH. CO., LTD.
16.19.1 RESUMO DA EMPRESA
16.19.2 ANÁLISE DE RECEITA
16.19.3 PORTFÓLIO DE PRODUTOS
16.19.4 DESENVOLVIMENTO RECENTE
16.2 LANXESS
16.20.1 RESUMO DA EMPRESA
16.20.2 ANÁLISE DE RECEITA
16.20.3 PORTFÓLIO DE NEGÓCIOS
16.20.4 DESENVOLVIMENTO RECENTE
16.21 LG QUÍMICA
16.21.1 RESUMO DA EMPRESA
16.21.2 ANÁLISE DE RECEITA
16.21.3 PORTFÓLIO DE PRODUTOS
16.21.4 DESENVOLVIMENTO RECENTE
16.22 MITSUBISHI CHEMICAL GROUP CORPORATION.
16.22.1 RESUMO DA EMPRESA
16.22.2 ANÁLISE DE RECEITA
16.22.3 PORTFÓLIO DE PRODUTOS
16.22.4 DESENVOLVIMENTO RECENTE
16.23 MITSUI QUÍMICOS, INC
16.23.1 RESUMO DA EMPRESA
16.23.2 ANÁLISE DE RECEITA
16.23.3 PORTFÓLIO DE PRODUTOS
16.23.4 DESENVOLVIMENTO RECENTE
16.24 RTP COMPANY
16.24.1 RESUMO DA EMPRESA
16.24.2 PORTFÓLIO DE PRODUTOS
16.24.3 DESENVOLVIMENTO RECENTE
16,25 SCG
16.25.1 RESUMO DA EMPRESA
16.25.2 ANÁLISE DE RECEITA
16.25.3 PORTFÓLIO DE PRODUTOS
16.25.4 DESENVOLVIMENTO RECENTE
16.26 SYENSQO
16.26.1 RESUMO DA EMPRESA
16.26.2 ANÁLISE DE RECEITA
16.26.3 PORTFÓLIO DE PRODUTOS
16.26.4 DESENVOLVIMENTOS RECENTES
16.27 TEKNOR APEX
16.27.1 RESUMO DA EMPRESA
16.27.2 PORTFÓLIO DE PRODUTOS
16.27.3 DESENVOLVIMENTO RECENTE
16.28 TORAY INDUSTRIES, INC.
16.28.1 RESUMO DA EMPRESA
16.28.2 ANÁLISE DE RECEITA
16.28.3 PORTFÓLIO DE PRODUTOS
16.28.4 DESENVOLVIMENTO RECENTE
16.29 TRINSEO
16.29.1 RESUMO DA EMPRESA
16.29.2 ANÁLISE DE RECEITA
16.29.3 PORTFÓLIO DE SOLUÇÕES
16.29.4 DESENVOLVIMENTOS RECENTES
16.3 WASHINGTON PENN
16.30.1 RESUMO DA EMPRESA
16.30.2 PORTFÓLIO DE PRODUTOS
16.30.3 DESENVOLVIMENTO RECENTE
17 QUESTIONÁRIO
18 RELATÓRIOS RELACIONADOS
Lista de Tabela
TABELA 1 ESTÁGIOS DA CADEIA DE VALOR
TABELA 2 PERSPECTIVAS DA MARCA: MERCADO DE COMPOSTOS PLÁSTICOS DA ÁSIA-PACÍFICO
TABELA 3 COMPORTAMENTO DE COMPRA DO CONSUMIDOR
TABELA 4 PROFISSIONAIS DA ÁSIA-PACÍFICO NA COMPOSTURA DE PLÁSTICOS
TABELA 5 NÚMERO DE PATENTES POR ANO
TABELA 6 NÚMERO DE PATENTES POR REGIÃO/PAÍS
TABELA 7 PRINCIPAIS REQUERENTES DE PATENTES
TABELA 8 EXPOSIÇÃO TARIFÁRIA E RESPOSTA ESTRATÉGICA POR TIPO DE EMPRESA
TABELA 9 EXPOSIÇÃO TARIFÁRIA E RESPOSTA ESTRATÉGICA DOS PRINCIPAIS ATORES
TABELA 10 MERCADO DE COMPOSTOS PLÁSTICOS DA ÁSIA-PACÍFICO, POR TIPO DE POLÍMERO, 2018-2032 (MIL USD)
TABELA 11 MERCADO DE COMPOSTOS PLÁSTICOS DA ÁSIA-PACÍFICO, POR TIPO DE POLÍMERO, 2018-2032 (QUILO TONELADAS)
TABELA 12 TERMOPLÁSTICOS NA ÁSIA-PACÍFICO NO MERCADO DE COMPOSTOS PLÁSTICOS, POR REGIÃO, 2018-2032 (MIL USD)
TABELA 13 TERMOPLÁSTICOS NO MERCADO DE COMPOSTOS PLÁSTICOS DA ÁSIA-PACÍFICO, POR REGIÃO, 2018-2032 (QUILO TONELADAS)
TABELA 14 TERMOPLÁSTICOS NO MERCADO DE COMPOSTOS PLÁSTICOS DA ÁSIA-PACÍFICO, POR TIPO, 2018-2032 (MIL USD)
TABELA 15 POLIETILENO (PE) NA ÁSIA-PACÍFICO NO MERCADO DE COMPOSTOS PLÁSTICOS, POR TIPO, 2018-2032 (MIL USD)
TABELA 16 PLÁSTICOS DE ENGENHARIA DA ÁSIA-PACÍFICO NO MERCADO DE COMPOSTOS PLÁSTICOS, POR REGIÃO, 2018-2032 (MIL USD)
TABELA 17 PLÁSTICOS DE ENGENHARIA DA ÁSIA-PACÍFICO NO MERCADO DE COMPOSTOS PLÁSTICOS, POR REGIÃO, 2018-2032 (QUILO TONELADAS)
TABELA 18 PLÁSTICOS DE ENGENHARIA DA ÁSIA-PACÍFICO NO MERCADO DE COMPOSTOS PLÁSTICOS, POR TIPO, 2018-2032 (MIL USD)
TABELA 19 PLÁSTICOS TERMOFIXOS DA ÁSIA-PACÍFICO NO MERCADO DE COMPOSTOS PLÁSTICOS, POR REGIÃO, 2018-2032 (MIL USD)
TABELA 20 PLÁSTICOS TERMOFIXOS NA ÁSIA-PACÍFICO NO MERCADO DE COMPOSTOS PLÁSTICOS, POR REGIÃO, 2018-2032 (QUILO TONELADAS)
TABELA 21 PLÁSTICOS TERMOFIXOS DA ÁSIA-PACÍFICO NO MERCADO DE COMPOSTOS PLÁSTICOS, POR TIPO, 2018-2032 (MIL USD)
TABELA 22 BIOPLÁSTICOS NO MERCADO DE COMPOSTOS PLÁSTICOS DA ÁSIA-PACÍFICO, POR REGIÃO, 2018-2032 (MIL USD)
TABELA 23 BIOPLÁSTICOS NO MERCADO DE COMPOSTOS PLÁSTICOS DA ÁSIA-PACÍFICO, POR REGIÃO, 2018-2032 (QUILO TONELADAS)
TABELA 24 BIOPLÁSTICOS NO MERCADO DE COMPOSTOS PLÁSTICOS DA ÁSIA-PACÍFICO, POR TIPO, 2018-2032 (MIL USD)
TABELA 25 OUTROS INDUSTRIAIS NO MERCADO DE COMPOSTOS PLÁSTICOS DA ÁSIA-PACÍFICO, POR REGIÃO, 2018-2032 (MIL USD)
TABELA 26 OUTROS INGRESSOS NO MERCADO DE COMPOSTOS PLÁSTICOS DA ÁSIA-PACÍFICO, POR REGIÃO, 2018-2032 (QUILO TONELADAS)
TABELA 27 MERCADO DE COMPOSTOS PLÁSTICOS DA ÁSIA-PACÍFICO, POR TIPO DE FILTRO, 2018-2032 (MIL USD)
TABELA 28: ENCHIMENTOS MINERAIS NO MERCADO DE COMPOSTOS PLÁSTICOS DA ÁSIA-PACÍFICO, POR REGIÃO, 2018-2032 (MIL USD)
TABELA 29: CARGAS MINERAIS NO MERCADO DE COMPOSTOS PLÁSTICOS DA ÁSIA-PACÍFICO, POR TIPO, 2018-2032 (MIL USD)
TABELA 30 REFORÇOS NA ÁSIA-PACÍFICO NO MERCADO DE COMPOSTOS PLÁSTICOS, POR REGIÃO, 2018-2032 (MIL USD)
TABELA 31 REFORÇOS NA ÁSIA-PACÍFICO NO MERCADO DE COMPOSTOS PLÁSTICOS, POR TIPO, 2018-2032 (MIL USD)
TABELA 32 ADITIVOS NO MERCADO DE COMPOSTOS PLÁSTICOS DA ÁSIA-PACÍFICO, POR REGIÃO, 2018-2032 (MIL USD)
TABELA 33 ADITIVOS NO MERCADO DE COMPOSTOS PLÁSTICOS DA ÁSIA-PACÍFICO, POR TIPO, 2018-2032 (MIL USD)
TABELA 34 OUTROS INDICADOS NO MERCADO DE COMPOSTOS PLÁSTICOS DA ÁSIA-PACÍFICO, POR REGIÃO, 2018-2032 (MIL USD)
TABELA 35 MERCADO DE COMPOSTOS PLÁSTICOS DA ÁSIA-PACÍFICO, POR PROCESSO DE FABRICAÇÃO, 2018-2032 (MIL USD)
TABELA 36 MERCADO DE COMPOSTOS PLÁSTICOS DA ÁSIA-PACÍFICO, POR PROCESSO DE FABRICAÇÃO, 2018-2032 (QUILO TONELADAS)
TABELA 37 EXTRUSÃO NA ÁSIA-PACÍFICO NO MERCADO DE COMPOSTOS PLÁSTICOS, POR REGIÃO, 2018-2032 (MIL USD)
TABELA 38 EXTRUSÃO NA ÁSIA-PACÍFICO NO MERCADO DE COMPOSTOS PLÁSTICOS, POR REGIÃO, 2018-2032 (QUILO TONELADAS)
TABELA 39 EXTRUSÃO NA ÁSIA-PACÍFICO NO MERCADO DE COMPOSTOS PLÁSTICOS, POR TIPO, 2018-2032 (MIL USD)
TABELA 40 EXTRUSÃO NA ÁSIA-PACÍFICO NO MERCADO DE COMPOSTOS PLÁSTICOS, POR SISTEMA DE PELLETIZAÇÃO, 2018-2032 (MIL USD)
TABELA 41 COMPOSTOS BASEADOS EM MOLDAGEM POR INJEÇÃO NA ÁSIA-PACÍFICO NO MERCADO DE COMPOSTOS PLÁSTICOS, POR REGIÃO, 2018-2032 (MIL USD)
TABELA 42 COMPOSTOS À BASE DE MOLDAGEM POR INJEÇÃO NA ÁSIA-PACÍFICO NO MERCADO DE COMPOSTOS PLÁSTICOS, POR REGIÃO, 2018-2032 (QUILO TONELADAS)
TABELA 43 COMPOSTOS BASEADOS EM MOLDAGEM POR INJEÇÃO NA ÁSIA-PACÍFICO NO MERCADO DE COMPOSTOS PLÁSTICOS, POR SISTEMA DE PELLETIZAÇÃO, 2018-2032 (MIL USD)
TABELA 44 COMPACTAÇÃO/PRENSAGEM NA ÁSIA-PACÍFICO NO MERCADO DE COMPOSTOS PLÁSTICOS, POR REGIÃO, 2018-2032 (MIL USD)
TABELA 45 COMPACTAÇÃO/PRENSAGEM NA ÁSIA-PACÍFICO NO MERCADO DE COMPOSTOS PLÁSTICOS, POR REGIÃO, 2018-2032 (QUILO TONELADAS)
TABELA 46 COMPACTAÇÃO/PRENSAGEM NA ÁSIA-PACÍFICO NO MERCADO DE COMPOSTOS PLÁSTICOS, POR SISTEMA DE PELLETIZAÇÃO, 2018-2032 (MIL USD)
TABELA 47 MISTURAS DE AMASSADORES/BANBURY NA ÁSIA-PACÍFICO NO MERCADO DE COMPOSTOS PLÁSTICOS, POR REGIÃO, 2018-2032 (MIL USD)
TABELA 48 MISTURAS DE AMASSADORES/BANBURY NA ÁSIA-PACÍFICO NO MERCADO DE COMPOSTOS PLÁSTICOS, POR REGIÃO, 2018-2032 (QUILO TONELADAS)
TABELA 49 MISTURA DA ÁSIA-PACÍFICO KNEADER/BANBURY NO MERCADO DE COMPOSTOS PLÁSTICOS, POR SISTEMA DE PELLETIZAÇÃO, 2018-2032 (MIL USD)
TABELA 50 OUTROS INDUSTRIAIS NO MERCADO DE COMPOSTOS PLÁSTICOS DA ÁSIA-PACÍFICO, POR REGIÃO, 2018-2032 (MIL USD)
TABELA 51 OUTROS INGRESSOS NO MERCADO DE COMPOSTOS PLÁSTICOS DA ÁSIA-PACÍFICO, POR REGIÃO, 2018-2032 (QUILO TONELADAS)
TABELA 52 MERCADO DE COMPOSTOS PLÁSTICOS DA ÁSIA-PACÍFICO, POR PROPRIEDADES, 2018-2032 (MIL USD)
TABELA 53 RESISTÊNCIA DA ÁSIA-PACÍFICO NO MERCADO DE COMPOSTOS PLÁSTICOS, POR REGIÃO, 2018-2032 (MIL USD)
TABELA 54 DURABILIDADE NO MERCADO DE COMPOSTOS PLÁSTICOS NA ÁSIA-PACÍFICO, POR REGIÃO, 2018-2032 (MIL USD)
TABELA 55 FLEXIBILIDADE DA ÁSIA-PACÍFICO NO MERCADO DE COMPOSTOS PLÁSTICOS, POR REGIÃO, 2018-2032 (MIL USD)
TABELA 56 RESISTÊNCIA AO IMPACTO NA ÁSIA-PACÍFICO NO MERCADO DE COMPOSTOS PLÁSTICOS, POR REGIÃO, 2018-2032 (MIL USD)
TABELA 57 RIGIDEZ NO MERCADO DE COMPOSTOS PLÁSTICOS DA ÁSIA-PACÍFICO, POR REGIÃO, 2018-2032 (MIL USD)
TABELA 58 OUTROS INDUSTRIAIS NO MERCADO DE COMPOSTOS PLÁSTICOS DA ÁSIA-PACÍFICO, POR REGIÃO, 2018-2032 (MIL USD)
TABELA 59 MERCADO DE COMPOSTOS PLÁSTICOS DA ÁSIA-PACÍFICO, POR APLICAÇÃO, 2018-2032 (MIL USD)
TABELA 60 MERCADO DE COMPOSTOS PLÁSTICOS DA ÁSIA-PACÍFICO, POR APLICAÇÃO, 2018-2032 (QUILO TONELADAS)
TABELA 61 MERCADO DE COMPOSTOS PLÁSTICOS AUTOMOTIVOS DA ÁSIA-PACÍFICO, POR REGIÃO, 2018-2032 (MIL USD)
TABELA 62 MERCADO DE COMPOSTOS PLÁSTICOS DA ÁSIA-PACÍFICO AUTOMOTIVO, POR REGIÃO, 2018-2032 (QUILO TONELADAS)
TABELA 63 ÁSIA-PACÍFICO AUTOMOTIVO NO MERCADO DE COMPOSTOS DE PLÁSTICO, POR CATEGORIA, 2018-2032 (MIL USD)
TABELA 64 COMPONENTES PARA INTERIORES DA ÁSIA-PACÍFICO NO MERCADO DE COMPOSTOS PLÁSTICOS, POR TIPO, 2018-2032 (MIL USD)
TABELA 65 PEÇAS EXTERNAS DA CARROCERIA NO MERCADO DE COMPOSTOS PLÁSTICOS DA ÁSIA-PACÍFICO, POR TIPO, 2018-2032 (MIL USD)
TABELA 66 APLICAÇÕES DE MERCADO DE COMPOSTOS PLÁSTICOS NA ÁSIA-PACÍFICO, POR TIPO, 2018-2032 (MIL USD)
TABELA 67 EMBALAGENS DA ÁSIA-PACÍFICO NO MERCADO DE COMPOSTOS PLÁSTICOS, POR REGIÃO, 2018-2032 (MIL USD)
TABELA 68 EMBALAGENS NA ÁSIA-PACÍFICO NO MERCADO DE COMPOSTOS PLÁSTICOS, POR REGIÃO, 2018-2032 (QUILO TONELADAS)
TABELA 69 EMBALAGENS DA ÁSIA-PACÍFICO NO MERCADO DE COMPOSTOS PLÁSTICOS, POR CATEGORIA, 2018-2032 (MIL USD)
TABELA 70 EMBALAGENS PARA ALIMENTOS E BEBIDAS NO MERCADO DE COMPOSTOS PLÁSTICOS DA ÁSIA-PACÍFICO, POR TIPO, 2018-2032 (MIL USD)
TABELA 71 EMBALAGENS INDUSTRIAIS NA ÁSIA-PACÍFICO NO MERCADO DE COMPOSTOS PLÁSTICOS, POR TIPO, 2018-2032 (MIL USD)
TABELA 72 EMBALAGENS DE BENS DE CONSUMO NA ÁSIA-PACÍFICO NO MERCADO DE COMPOSTOS PLÁSTICOS, POR TIPO, 2018-2032 (MIL USD)
TABELA 73 CONSTRUÇÃO E EDIFÍCIOS NA ÁSIA-PACÍFICO NO MERCADO DE COMPOSTOS PLÁSTICOS, POR REGIÃO, 2018-2032 (MIL USD)
TABELA 74 EDIFÍCIOS E CONSTRUÇÃO NA ÁSIA-PACÍFICO NO MERCADO DE COMPOSTOS PLÁSTICOS, POR REGIÃO, 2018-2032 (QUILO TONELADAS)
TABELA 75 CONSTRUÇÃO E EDIFÍCIOS NA ÁSIA-PACÍFICO NO MERCADO DE COMPOSTOS PLÁSTICOS, POR CATEGORIA, 2018-2032 (MIL USD)
TABELA 76 MERCADO DE COMPOSTOS PLÁSTICOS ELÉTRICOS E ELETRÔNICOS DA ÁSIA-PACÍFICO, POR REGIÃO, 2018-2032 (MIL USD)
TABELA 77 MERCADO DE COMPOSTOS PLÁSTICOS ELÉTRICOS E ELETRÔNICOS DA ÁSIA-PACÍFICO, POR REGIÃO, 2018-2032 (QUILO TONELADAS)
TABELA 78 MERCADO DE COMPOSTOS PLÁSTICOS ELÉTRICOS E ELETRÔNICOS DA ÁSIA-PACÍFICO, POR CATEGORIA, 2018-2032 (MIL USD)
TABELA 79 DISPOSITIVOS MÉDICOS DA ÁSIA-PACÍFICO NO MERCADO DE COMPOSTOS PLÁSTICOS, POR REGIÃO, 2018-2032 (MIL USD)
TABELA 80 DISPOSITIVOS MÉDICOS DA ÁSIA-PACÍFICO NO MERCADO DE COMPOSTOS PLÁSTICOS, POR REGIÃO, 2018-2032 (QUILO TONELADAS)
TABELA 81 DISPOSITIVOS MÉDICOS DA ÁSIA-PACÍFICO NO MERCADO DE COMPOSTOS PLÁSTICOS, POR CATEGORIA, 2018-2032 (MIL USD)
TABELA 82 MÓVEIS DA ÁSIA-PACÍFICO NO MERCADO DE COMPOSTOS PLÁSTICOS, POR REGIÃO, 2018-2032 (MIL USD)
TABELA 83 MÓVEIS DA ÁSIA-PACÍFICO NO MERCADO DE COMPOSTOS PLÁSTICOS, POR REGIÃO, 2018-2032 (QUILO TONELADAS)
TABELA 84 MÓVEIS DA ÁSIA-PACÍFICO NO MERCADO DE COMPOSTOS PLÁSTICOS, POR CATEGORIA, 2018-2032 (MIL USD)
TABELA 85 ENERGIA E POTÊNCIA NA ÁSIA-PACÍFICO NO MERCADO DE COMPOSTOS PLÁSTICOS, POR REGIÃO, 2018-2032 (MIL USD)
TABELA 86 ENERGIA E POTÊNCIA NO MERCADO DE COMPOSTOS PLÁSTICOS DA ÁSIA-PACÍFICO, POR REGIÃO, 2018-2032 (QUILO TONELADAS)
TABELA 87 ENERGIA E POTÊNCIA NA ÁSIA-PACÍFICO NO MERCADO DE COMPOSTOS PLÁSTICOS, POR CATEGORIA, 2018-2032 (MIL USD)
TABELA 88 ÁSIA-PACÍFICO AEROESPACIAL E DEFESA NO MERCADO DE COMPOSTOS PLÁSTICOS, POR REGIÃO, 2018-2032 (MIL USD)
TABELA 89 ÁSIA-PACÍFICO AEROESPACIAL E DEFESA NO MERCADO DE COMPOSTOS PLÁSTICOS, POR REGIÃO, 2018-2032 (QUILO TONELADAS)
TABELA 90 - MERCADO DE COMPOSTOS PLÁSTICOS DA ÁSIA-PACÍFICO AEROESPACIAL E DEFESA, POR CATEGORIA, 2018-2032 (MIL USD)
TABELA 91 OUTROS INDICADOS NO MERCADO DE COMPOSTOS PLÁSTICOS DA ÁSIA-PACÍFICO, POR REGIÃO, 2018-2032 (MIL USD)
TABELA 92 OUTROS INDICADOS NO MERCADO DE COMPOSTOS PLÁSTICOS DA ÁSIA-PACÍFICO, POR REGIÃO, 2018-2032 (QUILO TONELADAS)
TABELA 93 MERCADO DE COMPOSTOS PLÁSTICOS DA ÁSIA-PACÍFICO, POR PAÍS, 2018-2032 (MIL USD)
TABELA 94 MERCADO DE COMPOSTOS PLÁSTICOS DA ÁSIA-PACÍFICO, POR PAÍS, 2018-2032 (QUILO TONELADAS)
TABELA 95 MERCADO DE COMPOSTOS PLÁSTICOS DA ÁSIA-PACÍFICO, POR TIPO DE POLÍMERO, 2018-2032 (MIL USD)
TABELA 96 MERCADO DE COMPOSTOS PLÁSTICOS DA ÁSIA-PACÍFICO, POR TIPO DE POLÍMERO, 2018-2032 (QUILO TONELADAS)
TABELA 97 TERMOPLÁSTICOS NO MERCADO DE COMPOSTOS PLÁSTICOS DA ÁSIA-PACÍFICO, POR TIPO, 2018-2032 (MIL USD)
TABELA 98 POLIETILENO (PE) NA ÁSIA-PACÍFICO NO MERCADO DE COMPOSTOS PLÁSTICOS, POR TIPO, 2018-2032 (MIL USD)
TABELA 99 PLÁSTICOS DE ENGENHARIA DA ÁSIA-PACÍFICO NO MERCADO DE COMPOSTOS PLÁSTICOS, POR TIPO, 2018-2032 (MIL USD)
TABELA 100 PLÁSTICOS TERMOFIXOS DA ÁSIA-PACÍFICO NO MERCADO DE COMPOSTOS PLÁSTICOS, POR TIPO, 2018-2032 (MIL USD)
TABELA 101 BIOPLÁSTICOS NO MERCADO DE COMPOSTOS PLÁSTICOS DA ÁSIA-PACÍFICO, POR TIPO, 2018-2032 (MIL USD)
TABELA 102 MERCADO DE COMPOSTOS PLÁSTICOS DA ÁSIA-PACÍFICO, POR TIPO DE ENCHIMENTO, 2018-2032 (MIL USD)
TABELA 103 ENCHIMENTOS MINERAIS NO MERCADO DE COMPOSTOS PLÁSTICOS DA ÁSIA-PACÍFICO, POR TIPO, 2018-2032 (MIL USD)
TABELA 104 REFORÇOS NA ÁSIA-PACÍFICO NO MERCADO DE COMPOSTOS PLÁSTICOS, POR TIPO, 2018-2032 (MIL USD)
TABELA 105 ADITIVOS NO MERCADO DE COMPOSTOS PLÁSTICOS DA ÁSIA-PACÍFICO, POR TIPO, 2018-2032 (MIL USD)
TABELA 106 MERCADO DE COMPOSTOS PLÁSTICOS DA ÁSIA-PACÍFICO, POR PROCESSO DE FABRICAÇÃO, 2018-2032 (MIL USD)
TABELA 107 MERCADO DE COMPOSTOS PLÁSTICOS DA ÁSIA-PACÍFICO, POR PROCESSO DE FABRICAÇÃO, 2018-2032 (QUILO TONELADAS)
TABELA 108 EXTRUSÃO NA ÁSIA-PACÍFICO NO MERCADO DE COMPOSTOS PLÁSTICOS, POR TIPO, 2018-2032 (MIL USD)
TABELA 109 EXTRUSÃO NA ÁSIA-PACÍFICO NO MERCADO DE COMPOSTOS PLÁSTICOS, POR SISTEMA DE PELLETIZAÇÃO, 2018-2032 (MIL USD)
TABELA 110 COMPOSTOS BASEADOS EM MOLDAGEM POR INJEÇÃO NA ÁSIA-PACÍFICO NO MERCADO DE COMPOSTOS PLÁSTICOS, POR SISTEMA DE PELLETIZAÇÃO, 2018-2032 (MIL USD)
TABELA 111 COMPACTAÇÃO/PRENSAGEM NA ÁSIA-PACÍFICO NO MERCADO DE COMPOSTOS PLÁSTICOS, POR SISTEMA DE PELLETIZAÇÃO, 2018-2032 (MIL USD)
TABELA 112 MISTURA DE AMASSADORES/BANBURY NA ÁSIA-PACÍFICO NO MERCADO DE COMPOSTOS PLÁSTICOS, POR SISTEMA DE PELLETIZAÇÃO, 2018-2032 (MIL USD)
TABELA 113 MERCADO DE COMPOSTOS PLÁSTICOS DA ÁSIA-PACÍFICO, POR PROPRIEDADES, 2018-2032 (MIL USD)
TABELA 114 MERCADO DE COMPOSTOS PLÁSTICOS DA ÁSIA-PACÍFICO, POR APLICAÇÃO, 2018-2032 (MIL USD)
TABELA 115 MERCADO DE COMPOSTOS PLÁSTICOS DA ÁSIA-PACÍFICO, POR APLICAÇÃO, 2018-2032 (QUILO TONELADAS)
TABELA 116 ÁSIA-PACÍFICO AUTOMOTIVO NO MERCADO DE COMPOSTOS DE PLÁSTICO, POR CATEGORIA, 2018-2032 (MIL USD)
TABELA 117 COMPONENTES PARA INTERIORES DA ÁSIA-PACÍFICO NO MERCADO DE COMPOSTOS PLÁSTICOS, POR TIPO, 2018-2032 (MIL USD)
TABELA 118 PEÇAS EXTERNAS DA CARROCERIA NO MERCADO DE COMPOSTOS PLÁSTICOS DA ÁSIA-PACÍFICO, POR TIPO, 2018-2032 (MIL USD)
TABELA 119 APLICAÇÕES DE MERCADO DE COMPOSTOS PLÁSTICOS NA ÁSIA-PACÍFICO, POR TIPO, 2018-2032 (MIL USD)
TABELA 120 EMBALAGENS NA ÁSIA-PACÍFICO NO MERCADO DE COMPOSTOS PLÁSTICOS, POR CATEGORIA, 2018-2032 (MIL USD)
TABELA 121 EMBALAGENS PARA ALIMENTOS E BEBIDAS NO MERCADO DE COMPOSTOS PLÁSTICOS DA ÁSIA-PACÍFICO, POR TIPO, 2018-2032 (MIL USD)
TABELA 122 EMBALAGENS INDUSTRIAIS NA ÁSIA-PACÍFICO NO MERCADO DE COMPOSTOS PLÁSTICOS, POR TIPO, 2018-2032 (MIL USD)
TABELA 123 EMBALAGENS DE BENS DE CONSUMO NA ÁSIA-PACÍFICO NO MERCADO DE COMPOSTOS PLÁSTICOS, POR TIPO, 2018-2032 (MIL USD)
TABELA 124 CONSTRUÇÃO E EDIFÍCIOS NA ÁSIA-PACÍFICO NO MERCADO DE COMPOSTOS PLÁSTICOS, POR CATEGORIA, 2018-2032 (MIL USD)
TABELA 125 MERCADO DE COMPOSTOS PLÁSTICOS ELÉTRICOS E ELETRÔNICOS DA ÁSIA-PACÍFICO, POR CATEGORIA, 2018-2032 (MIL USD)
TABELA 126 DISPOSITIVOS MÉDICOS DA ÁSIA-PACÍFICO NO MERCADO DE COMPOSTOS PLÁSTICOS, POR CATEGORIA, 2018-2032 (MIL USD)
TABELA 127 MÓVEIS DA ÁSIA-PACÍFICO NO MERCADO DE COMPOSTOS PLÁSTICOS, POR CATEGORIA, 2018-2032 (MIL USD)
TABELA 128 ENERGIA E POTÊNCIA NO MERCADO DE COMPOSTOS PLÁSTICOS DA ÁSIA-PACÍFICO, POR CATEGORIA, 2018-2032 (MIL USD)
TABELA 129 ÁSIA-PACÍFICO AEROESPACIAL E DEFESA NO MERCADO DE COMPOSTOS PLÁSTICOS, POR CATEGORIA, 2018-2032 (MIL USD)
TABELA 130 MERCADO DE COMPOSTOS PLÁSTICOS DA CHINA, POR TIPO DE POLÍMERO, 2018-2032 (MIL USD)
TABELA 131 MERCADO DE COMPOSTOS PLÁSTICOS DA CHINA, POR TIPO DE POLÍMERO, 2018-2032 (QUILO TONELADAS)
TABELA 132 TERMOPLÁSTICOS DA CHINA NO MERCADO DE COMPOSTOS PLÁSTICOS, POR TIPO, 2018-2032 (MIL USD)
TABELA 133 POLIETILENO (PE) NO MERCADO DE COMPOSTOS PLÁSTICOS DA CHINA, POR TIPO, 2018-2032 (MIL USD)
TABELA 134 PLÁSTICOS DE ENGENHARIA DA CHINA NO MERCADO DE COMPOSTOS PLÁSTICOS, POR TIPO, 2018-2032 (MIL USD)
TABELA 135 PLÁSTICOS TERMOFIXOS DA CHINA NO MERCADO DE COMPOSTOS PLÁSTICOS, POR TIPO, 2018-2032 (MIL USD)
TABELA 136 BIOPLÁSTICOS DA CHINA NO MERCADO DE COMPOSTOS PLÁSTICOS, POR TIPO, 2018-2032 (MIL USD)
TABELA 137 MERCADO DE COMPOSTOS PLÁSTICOS DA CHINA, POR TIPO DE ENCHIMENTO, 2018-2032 (MIL USD)
TABELA 138: CARGAS MINERAIS NO MERCADO DE COMPOSTOS PLÁSTICOS DA CHINA, POR TIPO, 2018-2032 (MIL USD)
TABELA 139 MERCADO DE REFORÇOS PARA COMPOSTOS PLÁSTICOS DA CHINA, POR TIPO, 2018-2032 (MIL USD)
TABELA 140 ADITIVOS DA CHINA NO MERCADO DE COMPOSTOS PLÁSTICOS, POR TIPO, 2018-2032 (MIL USD)
TABELA 141 MERCADO DE COMPOSTOS PLÁSTICOS DA CHINA, POR PROCESSO DE FABRICAÇÃO, 2018-2032 (MIL USD)
TABELA 142 MERCADO DE COMPOSTOS PLÁSTICOS DA CHINA, POR PROCESSO DE FABRICAÇÃO, 2018-2032 (QUILO TONELADAS)
TABELA 143 EXTRUSÃO CHINA NO MERCADO DE COMPOSTOS PLÁSTICOS, POR TIPO, 2018-2032 (MIL USD)
TABELA 144 EXTRUSÃO CHINA NO MERCADO DE COMPOSTOS PLÁSTICOS, POR SISTEMA DE PELLETIZAÇÃO, 2018-2032 (MIL USD)
TABELA 145 COMPOSTOS BASEADOS EM MOLDAGEM POR INJEÇÃO NO MERCADO DE COMPOSTOS PLÁSTICOS DA CHINA, POR SISTEMA DE PELLETIZAÇÃO, 2018-2032 (MIL USD)
TABELA 146 COMPACTAÇÃO/PRENSAGEM NO MERCADO DE COMPOSTOS PLÁSTICOS DA CHINA, POR SISTEMA DE PELLETIZAÇÃO, 2018-2032 (MIL USD)
TABELA 147 CHINA KNEADER/BANBURY MIXING NO MERCADO DE COMPOSTOS PLÁSTICOS, POR SISTEMA DE PELLETIZAÇÃO, 2018-2032 (MIL USD)
TABELA 148 MERCADO DE COMPOSTOS PLÁSTICOS DA CHINA, POR PROPRIEDADES, 2018-2032 (MIL USD)
TABELA 149 MERCADO DE COMPOSTOS PLÁSTICOS DA CHINA, POR APLICAÇÃO, 2018-2032 (MIL USD)
TABELA 150 MERCADO DE COMPOSTOS PLÁSTICOS DA CHINA, POR APLICAÇÃO, 2018-2032 (QUILO TONELADAS)
TABELA 151 MERCADO DE COMPOSTOS DE PLÁSTICO AUTOMOTIVO DA CHINA, POR CATEGORIA, 2018-2032 (MIL USD)
TABELA 152 COMPONENTES PARA INTERIORES DA CHINA NO MERCADO DE COMPOSTOS PLÁSTICOS, POR TIPO, 2018-2032 (MIL USD)
TABELA 153 - PEÇAS EXTERNAS DA CARROCERIA NO MERCADO DE COMPOSTOS PLÁSTICOS DA CHINA, POR TIPO, 2018-2032 (MIL USD)
TABELA 154 APLICAÇÕES OCULTAS DA CHINA NO MERCADO DE COMPOSTOS PLÁSTICOS, POR TIPO, 2018-2032 (MIL USD)
TABELA 155 EMBALAGENS CHINESAS NO MERCADO DE COMPOSTOS PLÁSTICOS, POR CATEGORIA, 2018-2032 (MIL USD)
TABELA 156 EMBALAGENS PARA ALIMENTOS E BEBIDAS NO MERCADO DE COMPOSTOS PLÁSTICOS DA CHINA, POR TIPO, 2018-2032 (MIL USD)
TABELA 157 EMBALAGENS INDUSTRIAIS DA CHINA NO MERCADO DE COMPOSTOS PLÁSTICOS, POR TIPO, 2018-2032 (MIL USD)
TABELA 158 EMBALAGENS DE BENS DE CONSUMO DA CHINA NO MERCADO DE COMPOSTOS PLÁSTICOS, POR TIPO, 2018-2032 (MIL USD)
TABELA 159 CONSTRUÇÃO E EDIFICAÇÃO NA CHINA NO MERCADO DE COMPOSTOS DE PLÁSTICO, POR CATEGORIA, 2018-2032 (MIL USD)
TABELA 160 MERCADO DE COMPOSTOS PLÁSTICOS DA CHINA, ELÉTRICOS E ELETRÔNICOS, POR CATEGORIA, 2018-2032 (MIL USD)
TABELA 161 DISPOSITIVOS MÉDICOS DA CHINA NO MERCADO DE COMPOSTOS PLÁSTICOS, POR CATEGORIA, 2018-2032 (MIL USD)
TABELA 162 MÓVEIS DA CHINA NO MERCADO DE COMPOSTOS DE PLÁSTICO, POR CATEGORIA, 2018-2032 (MIL USD)
TABELA 163 ENERGIA E POTÊNCIA DA CHINA NO MERCADO DE COMPOSTOS DE PLÁSTICO, POR CATEGORIA, 2018-2032 (MIL USD)
TABELA 164 MERCADO DE COMPOSTOS PLÁSTICOS DA CHINA AEROESPACIAL E DEFESA, POR CATEGORIA, 2018-2032 (MIL USD)
TABELA 165 MERCADO DE COMPOSTOS PLÁSTICOS DA ÍNDIA, POR TIPO DE POLÍMERO, 2018-2032 (MIL USD)
TABELA 166 MERCADO DE COMPOSTOS PLÁSTICOS DA ÍNDIA, POR TIPO DE POLÍMERO, 2018-2032 (QUILO TONELADAS)
TABELA 167 TERMOPLÁSTICOS NA ÍNDIA NO MERCADO DE COMPOSTOS PLÁSTICOS, POR TIPO, 2018-2032 (MIL USD)
TABELA 168 POLIETILENO (PE) NO MERCADO DE COMPOSTOS PLÁSTICOS DA ÍNDIA, POR TIPO, 2018-2032 (MIL USD)
TABELA 169 PLÁSTICOS DE ENGENHARIA DA ÍNDIA NO MERCADO DE COMPOSTOS PLÁSTICOS, POR TIPO, 2018-2032 (MIL USD)
TABELA 170 PLÁSTICOS TERMOFIXOS NO MERCADO DE COMPOSTOS PLÁSTICOS DA ÍNDIA, POR TIPO, 2018-2032 (MIL USD)
TABELA 171 BIOPLÁSTICOS NA ÍNDIA NO MERCADO DE COMPOSTOS PLÁSTICOS, POR TIPO, 2018-2032 (MIL USD)
TABELA 172 MERCADO DE COMPOSTOS PLÁSTICOS DA ÍNDIA, POR TIPO DE ENCHIMENTO, 2018-2032 (MIL USD)
TABELA 173 ÍNDIA - MERCADO DE ENCHIMENTOS MINERAIS PARA COMPOSTOS PLÁSTICOS, POR TIPO, 2018-2032 (MIL USD)
TABELA 174 MERCADO DE REFORÇOS PARA COMPOSTOS PLÁSTICOS NA ÍNDIA, POR TIPO, 2018-2032 (MIL USD)
TABELA 175 ADITIVOS NA ÍNDIA NO MERCADO DE COMPOSTOS PLÁSTICOS, POR TIPO, 2018-2032 (MIL USD)
TABELA 176 MERCADO DE COMPOSTOS PLÁSTICOS DA ÍNDIA, POR PROCESSO DE FABRICAÇÃO, 2018-2032 (MIL USD)
TABELA 177 MERCADO DE COMPOSTOS PLÁSTICOS DA ÍNDIA, POR PROCESSO DE FABRICAÇÃO, 2018-2032 (QUILO TONELADAS)
TABELA 178 EXTRUSÃO NA ÍNDIA NO MERCADO DE COMPOSTOS PLÁSTICOS, POR TIPO, 2018-2032 (MIL USD)
TABELA 179 EXTRUSÃO NA ÍNDIA NO MERCADO DE COMPOSTOS PLÁSTICOS, POR SISTEMA DE PELLETIZAÇÃO, 2018-2032 (MIL USD)
TABELA 180 COMPOSTOS À BASE DE MOLDAGEM POR INJEÇÃO NO MERCADO DE COMPOSTOS PLÁSTICOS DA ÍNDIA, POR SISTEMA DE PELLETIZAÇÃO, 2018-2032 (MIL USD)
TABELA 181 COMPACTAÇÃO/PRENSAGEM NO MERCADO DE COMPOSTOS PLÁSTICOS DA ÍNDIA, POR SISTEMA DE PELLETIZAÇÃO, 2018-2032 (MIL USD)
TABELA 182 ÍNDIA KNEADER/BANBURY MISTURA NO MERCADO DE COMPOSTOS PLÁSTICOS, POR SISTEMA DE PELLETIZAÇÃO, 2018-2032 (MIL USD)
TABELA 183 MERCADO DE COMPOSTOS PLÁSTICOS DA ÍNDIA, POR PROPRIEDADES, 2018-2032 (MIL USD)
TABELA 184 MERCADO DE COMPOSTOS PLÁSTICOS DA ÍNDIA, POR APLICAÇÃO, 2018-2032 (MIL USD)
TABELA 185 MERCADO DE COMPOSTOS PLÁSTICOS DA ÍNDIA, POR APLICAÇÃO, 2018-2032 (QUILO TONELADAS)
TABELA 186 MERCADO DE COMPOSTOS DE PLÁSTICO DA ÍNDIA AUTOMOTIVO, POR CATEGORIA, 2018-2032 (MIL USD)
TABELA 187 COMPONENTES PARA INTERIORES NO MERCADO DE COMPOSTOS PLÁSTICOS DA ÍNDIA, POR TIPO, 2018-2032 (MIL USD)
TABELA 188 PEÇAS EXTERNAS DA CARROCERIA NO MERCADO DE COMPOSTOS PLÁSTICOS DA ÍNDIA, POR TIPO, 2018-2032 (MIL USD)
TABELA 189 APLICAÇÕES DESCRITAS NO MERCADO DE COMPOSTOS PLÁSTICOS DA ÍNDIA, POR TIPO, 2018-2032 (MIL USD)
TABELA 190 EMBALAGENS NA ÍNDIA NO MERCADO DE COMPOSTOS PLÁSTICOS, POR CATEGORIA, 2018-2032 (MIL USD)
TABELA 191 EMBALAGENS PARA ALIMENTOS E BEBIDAS NO MERCADO DE COMPOSTOS PLÁSTICOS DA ÍNDIA, POR TIPO, 2018-2032 (MIL USD)
TABELA 192 EMBALAGENS INDUSTRIAIS NO MERCADO DE COMPOSTOS PLÁSTICOS DA ÍNDIA, POR TIPO, 2018-2032 (MIL USD)
TABELA 193 EMBALAGENS DE BENS DE CONSUMO NO MERCADO DE COMPOSTOS PLÁSTICOS DA ÍNDIA, POR TIPO, 2018-2032 (MIL USD)
TABELA 194 INDIA CONSTRUÇÃO E EDIFÍCIOS NO MERCADO DE COMPOSTOS DE PLÁSTICO, POR CATEGORIA, 2018-2032 (MIL USD)
TABELA 195 MERCADO DE COMPOSTOS PLÁSTICOS DA ÍNDIA, ELÉTRICOS E ELETRÔNICOS, POR CATEGORIA, 2018-2032 (MIL USD)
TABELA 196 DISPOSITIVOS MÉDICOS NO MERCADO DE COMPOSTOS PLÁSTICOS DA ÍNDIA, POR CATEGORIA, 2018-2032 (MIL USD)
TABELA 197 MÓVEIS DA ÍNDIA NO MERCADO DE COMPOSTOS DE PLÁSTICO, POR CATEGORIA, 2018-2032 (MIL USD)
TABELA 198 ENERGIA E ENERGIA NO MERCADO DE COMPOSTOS PLÁSTICOS DA ÍNDIA, POR CATEGORIA, 2018-2032 (MIL USD)
TABELA 199 ÍNDIA AEROESPACIAL E DEFESA NO MERCADO DE COMPOSTOS PLÁSTICOS, POR CATEGORIA, 2018-2032 (MIL USD)
TABELA 200 MERCADO DE COMPOSTOS PLÁSTICOS DO JAPÃO, POR TIPO DE POLÍMERO, 2018-2032 (MIL USD)
TABELA 201 MERCADO DE COMPOSTOS PLÁSTICOS DO JAPÃO, POR TIPO DE POLÍMERO, 2018-2032 (QUILO TONELADAS)
TABELA 202 TERMOPLÁSTICOS NO MERCADO DE COMPOSTOS PLÁSTICOS DO JAPÃO, POR TIPO, 2018-2032 (MIL USD)
TABELA 203 POLIETILENO (PE) NO MERCADO DE COMPOSTOS PLÁSTICOS DO JAPÃO, POR TIPO, 2018-2032 (MIL USD)
TABELA 204 PLÁSTICOS DE ENGENHARIA DO JAPÃO NO MERCADO DE COMPOSTOS PLÁSTICOS, POR TIPO, 2018-2032 (MIL USD)
TABELA 205 PLÁSTICOS TERMOFIXOS NO MERCADO DE COMPOSTOS PLÁSTICOS DO JAPÃO, POR TIPO, 2018-2032 (MIL USD)
TABELA 206 BIOPLÁSTICOS NO MERCADO DE COMPOSTOS PLÁSTICOS DO JAPÃO, POR TIPO, 2018-2032 (MIL USD)
TABELA 207 MERCADO DE COMPOSTOS PLÁSTICOS DO JAPÃO, POR TIPO DE ENCHIMENTO, 2018-2032 (MIL USD)
TABELA 208: ENCHIMENTOS MINERAIS NO MERCADO DE COMPOSTOS PLÁSTICOS DO JAPÃO, POR TIPO, 2018-2032 (MIL USD)
TABELA 209 MERCADO DE REFORÇOS NO JAPÃO PARA COMPOSTOS PLÁSTICOS, POR TIPO, 2018-2032 (MIL USD)
TABELA 210 ADITIVOS NO MERCADO DE COMPOSTOS PLÁSTICOS DO JAPÃO, POR TIPO, 2018-2032 (MIL USD)
TABELA 211 MERCADO DE COMPOSTOS PLÁSTICOS DO JAPÃO, POR PROCESSO DE FABRICAÇÃO, 2018-2032 (MIL USD)
TABELA 212 MERCADO DE COMPOSTOS PLÁSTICOS DO JAPÃO, POR PROCESSO DE FABRICAÇÃO, 2018-2032 (QUILO TONELADAS)
TABELA 213 EXTRUSÃO NO MERCADO DE COMPOSTOS PLÁSTICOS DO JAPÃO, POR TIPO, 2018-2032 (MIL USD)
TABELA 214 EXTRUSÃO NO MERCADO DE COMPOSTOS PLÁSTICOS NO JAPÃO, POR SISTEMA DE PELLETIZAÇÃO, 2018-2032 (MIL USD)
TABELA 215 COMPOSTOS BASEADOS EM MOLDAGEM POR INJEÇÃO NO MERCADO DE COMPOSTOS PLÁSTICOS DO JAPÃO, POR SISTEMA DE PELLETIZAÇÃO, 2018-2032 (MIL USD)
TABELA 216 COMPACTAÇÃO/PRENSAGEM NO MERCADO DE COMPOSTOS PLÁSTICOS NO JAPÃO, POR SISTEMA DE PELLETIZAÇÃO, 2018-2032 (MIL USD)
TABELA 217 MISTURA JAPÃO KNEADER/BANBURY NO MERCADO DE COMPOSTOS PLÁSTICOS, POR SISTEMA DE PELLETIZAÇÃO, 2018-2032 (MIL USD)
TABELA 218 MERCADO DE COMPOSTOS PLÁSTICOS DO JAPÃO, POR PROPRIEDADES, 2018-2032 (MIL USD)
TABELA 219 MERCADO DE COMPOSTOS PLÁSTICOS DO JAPÃO, POR APLICAÇÃO, 2018-2032 (MIL USD)
TABELA 220 MERCADO DE COMPOSTOS PLÁSTICOS DO JAPÃO, POR APLICAÇÃO, 2018-2032 (QUILO TONELADAS)
TABELA 221 MERCADO DE COMPOSTOS DE PLÁSTICO NO JAPÃO AUTOMOTIVO, POR CATEGORIA, 2018-2032 (MIL USD)
TABELA 222 COMPONENTES PARA INTERIORES NO MERCADO DE COMPOSTOS PLÁSTICOS DO JAPÃO, POR TIPO, 2018-2032 (MIL USD)
TABELA 223 PEÇAS EXTERNAS DA CARROCERIA NO MERCADO DE COMPOSTOS PLÁSTICOS DO JAPÃO, POR TIPO, 2018-2032 (MIL USD)
TABELA 224 APLICAÇÕES DE COMPOSTOS PLÁSTICOS NO JAPÃO, POR TIPO, 2018-2032 (MIL USD)
TABELA 225 EMBALAGENS NO MERCADO DE COMPOSTOS PLÁSTICOS DO JAPÃO, POR CATEGORIA, 2018-2032 (MIL USD)
TABELA 226 EMBALAGENS PARA ALIMENTOS E BEBIDAS NO MERCADO DE COMPOSTOS PLÁSTICOS DO JAPÃO, POR TIPO, 2018-2032 (MIL USD)
TABELA 227 EMBALAGENS INDUSTRIAIS NO MERCADO DE COMPOSTOS PLÁSTICOS DO JAPÃO, POR TIPO, 2018-2032 (MIL USD)
TABELA 228 EMBALAGENS DE BENS DE CONSUMO NO MERCADO DE COMPOSTOS PLÁSTICOS DO JAPÃO, POR TIPO, 2018-2032 (MIL USD)
TABELA 229 CONSTRUÇÃO E EDIFICAÇÃO NO JAPÃO NO MERCADO DE COMPOSTOS DE PLÁSTICO, POR CATEGORIA, 2018-2032 (MIL USD)
TABELA 230 MERCADO DE COMPOSTOS PLÁSTICOS ELÉTRICOS E ELETRÔNICOS DO JAPÃO, POR CATEGORIA, 2018-2032 (MIL USD)
TABELA 231 DISPOSITIVOS MÉDICOS NO MERCADO DE COMPOSTOS PLÁSTICOS DO JAPÃO, POR CATEGORIA, 2018-2032 (MIL USD)
TABELA 232 MÓVEIS NO JAPÃO NO MERCADO DE COMPOSTOS DE PLÁSTICO, POR CATEGORIA, 2018-2032 (MIL USD)
TABELA 233 ENERGIA E ENERGIA NO MERCADO DE COMPOSTOS DE PLÁSTICO DO JAPÃO, POR CATEGORIA, 2018-2032 (MIL USD)
TABELA 234 MERCADO DE COMPOSTOS PLÁSTICOS DO JAPÃO AEROESPACIAL E DEFESA, POR CATEGORIA, 2018-2032 (MIL USD)
TABELA 235 MERCADO DE COMPOSTOS PLÁSTICOS DA COREIA DO SUL, POR TIPO DE POLÍMERO, 2018-2032 (MIL USD)
TABELA 236 MERCADO DE COMPOSTOS PLÁSTICOS DA COREIA DO SUL, POR TIPO DE POLÍMERO, 2018-2032 (QUILO TONELADAS)
TABELA 237 TERMOPLÁSTICOS NO MERCADO DE COMPOSTOS PLÁSTICOS DA COREIA DO SUL, POR TIPO, 2018-2032 (MIL USD)
TABELA 238 POLIETILENO (PE) NO MERCADO DE COMPOSTOS PLÁSTICOS DA COREIA DO SUL, POR TIPO, 2018-2032 (MIL USD)
TABELA 239 PLÁSTICOS DE ENGENHARIA DA COREIA DO SUL NO MERCADO DE COMPOSTOS PLÁSTICOS, POR TIPO, 2018-2032 (MIL USD)
TABELA 240 PLÁSTICOS TERMOFIXOS NO MERCADO DE COMPOSTOS PLÁSTICOS DA COREIA DO SUL, POR TIPO, 2018-2032 (MIL USD)
TABELA 241 BIOPLÁSTICOS NO MERCADO DE COMPOSTOS PLÁSTICOS DA COREIA DO SUL, POR TIPO, 2018-2032 (MIL USD)
TABELA 242 MERCADO DE COMPOSTOS PLÁSTICOS DA COREIA DO SUL, POR TIPO DE ENCHIMENTO, 2018-2032 (MIL USD)
TABELA 243 CARGAS MINERAIS NO MERCADO DE COMPOSTOS PLÁSTICOS DA COREIA DO SUL, POR TIPO, 2018-2032 (MIL USD)
TABELA 244 REFORÇOS NO MERCADO DE COMPOSTOS PLÁSTICOS DA COREIA DO SUL, POR TIPO, 2018-2032 (MIL USD)
TABELA 245 ADITIVOS NO MERCADO DE COMPOSTOS PLÁSTICOS DA COREIA DO SUL, POR TIPO, 2018-2032 (MIL USD)
TABELA 246 MERCADO DE COMPOSTOS PLÁSTICOS DA COREIA DO SUL, POR PROCESSO DE FABRICAÇÃO, 2018-2032 (MIL USD)
TABELA 247 MERCADO DE COMPOSTOS PLÁSTICOS DA COREIA DO SUL, POR PROCESSO DE FABRICAÇÃO, 2018-2032 (QUILO TONELADAS)
TABELA 248 EXTRUSÃO NO MERCADO DE COMPOSTOS PLÁSTICOS DA COREIA DO SUL, POR TIPO, 2018-2032 (MIL USD)
TABELA 249 EXTRUSÃO DA COREIA DO SUL NO MERCADO DE COMPOSTOS PLÁSTICOS, POR SISTEMA DE PELLETIZAÇÃO, 2018-2032 (MIL USD)
TABELA 250 COMPOSTOS À BASE DE MOLDAGEM POR INJEÇÃO NA COREIA DO SUL NO MERCADO DE COMPOSTOS PLÁSTICOS, POR SISTEMA DE PELLETIZAÇÃO, 2018-2032 (MIL USD)
TABELA 251 COMPACTAÇÃO/PRENSAGEM NA COREIA DO SUL NO MERCADO DE COMPOSTOS PLÁSTICOS, POR SISTEMA DE PELLETIZAÇÃO, 2018-2032 (MIL USD)
TABELA 252 COREIA DO SUL - MISTURA KNEADER/BANBURY NO MERCADO DE COMPOSTOS PLÁSTICOS, POR SISTEMA DE PELLETIZAÇÃO, 2018-2032 (MIL USD)
TABELA 253 MERCADO DE COMPOSTOS PLÁSTICOS DA COREIA DO SUL, POR PROPRIEDADES, 2018-2032 (MIL USD)
TABELA 254 MERCADO DE COMPOSTOS PLÁSTICOS DA COREIA DO SUL, POR APLICAÇÃO, 2018-2032 (MIL USD)
TABELA 255 MERCADO DE COMPOSTOS PLÁSTICOS DA COREIA DO SUL, POR APLICAÇÃO, 2018-2032 (QUILO TONELADAS)
TABELA 256 COREIA DO SUL - MERCADO DE COMPOSTOS DE PLÁSTICO AUTOMOTIVO, POR CATEGORIA, 2018-2032 (MIL USD)
TABELA 257 COMPONENTES PARA INTERIORES NO MERCADO DE COMPOSTOS PLÁSTICOS DA COREIA DO SUL, POR TIPO, 2018-2032 (MIL USD)
TABELA 258 - PEÇAS EXTERNAS DA CARROCERIA NO MERCADO DE COMPOSTOS PLÁSTICOS DA COREIA DO SUL, POR TIPO, 2018-2032 (MIL USD)
TABELA 259 APLICAÇÕES OCULTAS DA COREIA DO SUL NO MERCADO DE COMPOSTOS PLÁSTICOS, POR TIPO, 2018-2032 (MIL USD)
TABELA 260 EMBALAGENS DA COREIA DO SUL NO MERCADO DE COMPOSTOS PLÁSTICOS, POR CATEGORIA, 2018-2032 (MIL USD)
TABELA 261 EMBALAGENS PARA ALIMENTOS E BEBIDAS NO MERCADO DE COMPOSTOS PLÁSTICOS DA COREIA DO SUL, POR TIPO, 2018-2032 (MIL USD)
TABELA 262 EMBALAGENS INDUSTRIAIS NO MERCADO DE COMPOSTOS PLÁSTICOS DA COREIA DO SUL, POR TIPO, 2018-2032 (MIL USD)
TABELA 263 EMBALAGENS DE BENS DE CONSUMO NO MERCADO DE COMPOSTOS PLÁSTICOS DA COREIA DO SUL, POR TIPO, 2018-2032 (MIL USD)
TABELA 264 EDIFICAÇÃO E CONSTRUÇÃO NA COREIA DO SUL NO MERCADO DE COMPOSTOS PLÁSTICOS, POR CATEGORIA, 2018-2032 (MIL USD)
TABELA 265 MERCADO DE COMPOSTOS PLÁSTICOS DA COREIA DO SUL, ELÉTRICOS E ELETRÔNICOS, POR CATEGORIA, 2018-2032 (MIL USD)
TABELA 266 DISPOSITIVOS MÉDICOS NO MERCADO DE COMPOSTOS PLÁSTICOS DA COREIA DO SUL, POR CATEGORIA, 2018-2032 (MIL USD)
TABELA 267 MÓVEIS DA COREIA DO SUL NO MERCADO DE COMPOSTOS PLÁSTICOS, POR CATEGORIA, 2018-2032 (MIL USD)
TABELA 268 ENERGIA E ENERGIA DA COREIA DO SUL NO MERCADO DE COMPOSTOS PLÁSTICOS, POR CATEGORIA, 2018-2032 (MIL USD)
TABELA 269 COREIA DO SUL - AEROESPACIAL E DEFESA NO MERCADO DE COMPOSTOS PLÁSTICOS, POR CATEGORIA, 2018-2032 (MIL USD)
TABELA 270 MERCADO DE COMPOSTOS PLÁSTICOS DA TAILÂNDIA, POR TIPO DE POLÍMERO, 2018-2032 (MIL USD)
TABELA 271 MERCADO DE COMPOSTOS PLÁSTICOS DA TAILÂNDIA, POR TIPO DE POLÍMERO, 2018-2032 (QUILO TONELADAS)
TABELA 272 TERMOPLÁSTICOS DA TAILÂNDIA NO MERCADO DE COMPOSTOS PLÁSTICOS, POR TIPO, 2018-2032 (MIL USD)
TABELA 273 POLIETILENO (PE) NO MERCADO DE COMPOSTOS PLÁSTICOS DA TAILÂNDIA, POR TIPO, 2018-2032 (MIL USD)
TABELA 274 PLÁSTICOS DE ENGENHARIA DA TAILÂNDIA NO MERCADO DE COMPOSTOS PLÁSTICOS, POR TIPO, 2018-2032 (MIL USD)
TABELA 275 PLÁSTICOS TERMOFIXOS DA TAILÂNDIA NO MERCADO DE COMPOSTOS PLÁSTICOS, POR TIPO, 2018-2032 (MIL USD)
TABELA 276 BIOPLÁSTICOS DA TAILÂNDIA NO MERCADO DE COMPOSTOS PLÁSTICOS, POR TIPO, 2018-2032 (MIL USD)
TABELA 277 MERCADO DE COMPOSTOS PLÁSTICOS DA TAILÂNDIA, POR TIPO DE ENCHIMENTO, 2018-2032 (MIL USD)
TABELA 278 CARGAS MINERAIS NO MERCADO DE COMPOSTOS PLÁSTICOS DA TAILÂNDIA, POR TIPO, 2018-2032 (MIL USD)
TABELA 279 REFORÇOS DA TAILÂNDIA NO MERCADO DE COMPOSTOS PLÁSTICOS, POR TIPO, 2018-2032 (MIL USD)
TABELA 280 ADITIVOS NA TAILÂNDIA NO MERCADO DE COMPOSTOS PLÁSTICOS, POR TIPO, 2018-2032 (MIL USD)
TABELA 281 MERCADO DE COMPOSTOS PLÁSTICOS DA TAILÂNDIA, POR PROCESSO DE FABRICAÇÃO, 2018-2032 (MIL USD)
TABELA 282 MERCADO DE COMPOSTOS PLÁSTICOS DA TAILÂNDIA, POR PROCESSO DE FABRICAÇÃO, 2018-2032 (QUILO TONELADAS)
TABELA 283 EXTRUSÃO NA TAILÂNDIA NO MERCADO DE COMPOSTOS PLÁSTICOS, POR TIPO, 2018-2032 (MIL USD)
TABELA 284 EXTRUSÃO NA TAILÂNDIA NO MERCADO DE COMPOSTOS PLÁSTICOS, POR SISTEMA DE PELLETIZAÇÃO, 2018-2032 (MIL USD)
TABELA 285 COMPOSTOS BASEADOS EM MOLDAGEM POR INJEÇÃO NA TAILÂNDIA NO MERCADO DE COMPOSTOS PLÁSTICOS, POR SISTEMA DE PELLETIZAÇÃO, 2018-2032 (MIL USD)
TABELA 286 COMPACTAÇÃO/PRENSAGEM NA TAILÂNDIA NO MERCADO DE COMPOSTOS PLÁSTICOS, POR SISTEMA DE PELLETIZAÇÃO, 2018-2032 (MIL USD)
TABELA 287 TAILÂNDIA KNEADER/BANBURY MIXING NO MERCADO DE COMPOSTOS PLÁSTICOS, POR SISTEMA DE PELLETIZAÇÃO, 2018-2032 (MIL USD)
TABELA 288 MERCADO DE COMPOSTOS PLÁSTICOS DA TAILÂNDIA, POR PROPRIEDADES, 2018-2032 (MIL USD)
TABELA 289 MERCADO DE COMPOSTOS PLÁSTICOS DA TAILÂNDIA, POR APLICAÇÃO, 2018-2032 (MIL USD)
TABELA 290 MERCADO DE COMPOSTOS PLÁSTICOS DA TAILÂNDIA, POR APLICAÇÃO, 2018-2032 (QUILO TONELADAS)
TABELA 291 MERCADO DE COMPOSTOS DE PLÁSTICO DA TAILÂNDIA AUTOMOTIVO, POR CATEGORIA, 2018-2032 (MIL USD)
TABELA 292 COMPONENTES PARA INTERIORES NO MERCADO DE COMPOSTOS PLÁSTICOS DA TAILÂNDIA, POR TIPO, 2018-2032 (MIL USD)
TABELA 293 PEÇAS EXTERNAS DA CARROCERIA NO MERCADO DE COMPOSTOS PLÁSTICOS DA TAILÂNDIA, POR TIPO, 2018-2032 (MIL USD)
TABELA 294 APLICAÇÕES OCULTAS DA TAILÂNDIA NO MERCADO DE COMPOSTOS PLÁSTICOS, POR TIPO, 2018-2032 (MIL USD)
TABELA 295 EMBALAGENS NA TAILÂNDIA NO MERCADO DE COMPOSTOS PLÁSTICOS, POR CATEGORIA, 2018-2032 (MIL USD)
TABELA 296 EMBALAGENS PARA ALIMENTOS E BEBIDAS NO MERCADO DE COMPOSTOS PLÁSTICOS DA TAILÂNDIA, POR TIPO, 2018-2032 (MIL USD)
TABELA 297 EMBALAGENS INDUSTRIAIS NA TAILÂNDIA NO MERCADO DE COMPOSTOS PLÁSTICOS, POR TIPO, 2018-2032 (MIL USD)
TABELA 298 EMBALAGENS DE BENS DE CONSUMO NA TAILÂNDIA NO MERCADO DE COMPOSTOS PLÁSTICOS, POR TIPO, 2018-2032 (MIL USD)
TABELA 299 CONSTRUÇÃO E EDIFÍCIOS NA TAILÂNDIA NO MERCADO DE COMPOSTOS DE PLÁSTICO, POR CATEGORIA, 2018-2032 (MIL USD)
TABELA 300 MERCADO DE COMPOSTOS PLÁSTICOS DA TAILÂNDIA, ELÉTRICOS E ELETRÔNICOS, POR CATEGORIA, 2018-2032 (MIL USD)
TABELA 301 DISPOSITIVOS MÉDICOS DA TAILÂNDIA NO MERCADO DE COMPOSTOS PLÁSTICOS, POR CATEGORIA, 2018-2032 (MIL USD)
TABELA 302 MÓVEIS DA TAILÂNDIA NO MERCADO DE COMPOSTOS DE PLÁSTICO, POR CATEGORIA, 2018-2032 (MIL USD)
TABELA 303 ENERGIA E POTÊNCIA NO MERCADO DE COMPOSTOS PLÁSTICOS DA TAILÂNDIA, POR CATEGORIA, 2018-2032 (MIL USD)
TABELA 304 MERCADO DE COMPOSTOS PLÁSTICOS DA TAILÂNDIA AEROESPACIAL E DEFESA, POR CATEGORIA, 2018-2032 (MIL USD)
TABELA 305 MERCADO DE COMPOSTOS PLÁSTICOS DE SINGAPURA, POR TIPO DE POLÍMERO, 2018-2032 (MIL USD)
TABELA 306 MERCADO DE COMPOSTOS PLÁSTICOS DE SINGAPURA, POR TIPO DE POLÍMERO, 2018-2032 (QUILO TONELADAS)
TABELA 307 TERMOPLÁSTICOS DE SINGAPURA NO MERCADO DE COMPOSTOS PLÁSTICOS, POR TIPO, 2018-2032 (MIL USD)
TABELA 308 POLIETILENO (PE) NO MERCADO DE COMPOSTOS PLÁSTICOS DE SINGAPURA, POR TIPO, 2018-2032 (MIL USD)
TABELA 309 PLÁSTICOS DE ENGENHARIA DE SINGAPURA NO MERCADO DE COMPOSTOS PLÁSTICOS, POR TIPO, 2018-2032 (MIL USD)
TABELA 310 PLÁSTICOS TERMOFIXOS DE SINGAPURA NO MERCADO DE COMPOSTOS PLÁSTICOS, POR TIPO, 2018-2032 (MIL USD)
TABELA 311 BIOPLÁSTICOS DE SINGAPURA NO MERCADO DE COMPOSTOS PLÁSTICOS, POR TIPO, 2018-2032 (MIL USD)
TABELA 312 MERCADO DE COMPOSTOS PLÁSTICOS DE SINGAPURA, POR TIPO DE ENCHIMENTO, 2018-2032 (MIL USD)
TABELA 313: CARGAS MINERAIS NO MERCADO DE COMPOSTOS PLÁSTICOS DE SINGAPURA, POR TIPO, 2018-2032 (MIL USD)
TABELA 314 REFORÇOS DE SINGAPURA NO MERCADO DE COMPOSTOS PLÁSTICOS, POR TIPO, 2018-2032 (MIL USD)
TABELA 315 ADITIVOS DE SINGAPURA NO MERCADO DE COMPOSTOS PLÁSTICOS, POR TIPO, 2018-2032 (MIL USD)
TABELA 316 MERCADO DE COMPOSTOS PLÁSTICOS DE SINGAPURA, POR PROCESSO DE FABRICAÇÃO, 2018-2032 (MIL USD)
TABELA 317 MERCADO DE COMPOSTOS PLÁSTICOS DE SINGAPURA, POR PROCESSO DE FABRICAÇÃO, 2018-2032 (QUILO TONELADAS)
TABELA 318 EXTRUSÃO DE SINGAPURA NO MERCADO DE COMPOSTOS PLÁSTICOS, POR TIPO, 2018-2032 (MIL USD)
TABELA 319 EXTRUSÃO DE SINGAPURA NO MERCADO DE COMPOSTOS PLÁSTICOS, POR SISTEMA DE PELLETIZAÇÃO, 2018-2032 (MIL USD)
TABELA 320 COMPOSTOS BASEADOS EM MOLDAGEM POR INJEÇÃO DE SINGAPURA NO MERCADO DE COMPOSTOS PLÁSTICOS, POR SISTEMA DE PELLETIZAÇÃO, 2018-2032 (MIL USD)
TABELA 321 COMPACTAÇÃO/PRENSAGEM EM SINGAPURA NO MERCADO DE COMPOSTOS PLÁSTICOS, POR SISTEMA DE PELLETIZAÇÃO, 2018-2032 (MIL USD)
TABELA 322 SINGAPORE KNEADER/BANBURY MIXING NO MERCADO DE COMPOSTOS PLÁSTICOS, POR SISTEMA DE PELLETIZAÇÃO, 2018-2032 (MIL USD)
TABELA 323 MERCADO DE COMPOSTOS PLÁSTICOS DE SINGAPURA, POR PROPRIEDADES, 2018-2032 (MIL USD)
TABELA 324 MERCADO DE COMPOSTOS PLÁSTICOS DE SINGAPURA, POR APLICAÇÃO, 2018-2032 (MIL USD)
TABELA 325 MERCADO DE COMPOSTOS PLÁSTICOS DE SINGAPURA, POR APLICAÇÃO, 2018-2032 (QUILO TONELADAS)
TABELA 326 SINGAPURA AUTOMOTIVO NO MERCADO DE COMPOSTOS DE PLÁSTICO, POR CATEGORIA, 2018-2032 (MIL USD)
TABELA 327 COMPONENTES PARA INTERIORES DE SINGAPURA NO MERCADO DE COMPOSTOS PLÁSTICOS, POR TIPO, 2018-2032 (MIL USD)
TABELA 328 PEÇAS EXTERNAS DA CARROCERIA NO MERCADO DE COMPOSTOS PLÁSTICOS DE SINGAPURA, POR TIPO, 2018-2032 (MIL USD)
TABELA 329 APLICAÇÕES DE CINGAPURA SOB O CAPÔ NO MERCADO DE COMPOSTOS PLÁSTICOS, POR TIPO, 2018-2032 (MIL USD)
TABELA 330 EMBALAGENS DE SINGAPURA NO MERCADO DE COMPOSTOS PLÁSTICOS, POR CATEGORIA, 2018-2032 (MIL USD)
TABELA 331 EMBALAGENS PARA ALIMENTOS E BEBIDAS NO MERCADO DE COMPOSTOS PLÁSTICOS DE SINGAPURA, POR TIPO, 2018-2032 (MIL USD)
TABELA 332 EMBALAGENS INDUSTRIAIS NO MERCADO DE COMPOSTOS PLÁSTICOS DE SINGAPURA, POR TIPO, 2018-2032 (MIL USD)
TABELA 333 EMBALAGENS DE BENS DE CONSUMO DE SINGAPURA NO MERCADO DE COMPOSTOS PLÁSTICOS, POR TIPO, 2018-2032 (MIL USD)
TABELA 334 EDIFÍCIOS E CONSTRUÇÃO EM SINGAPURA NO MERCADO DE COMPOSTOS PLÁSTICOS, POR CATEGORIA, 2018-2032 (MIL USD)
TABELA 335 MERCADO DE COMPOSTOS PLÁSTICOS DE SINGAPURA, ELETRÔNICA E ELÉTRICA, POR CATEGORIA, 2018-2032 (MIL USD)
TABELA 336 DISPOSITIVOS MÉDICOS NO MERCADO DE COMPOSTOS PLÁSTICOS DE SINGAPURA, POR CATEGORIA, 2018-2032 (MIL USD)
TABELA 337 MÓVEIS DE SINGAPURA NO MERCADO DE COMPOSTOS DE PLÁSTICO, POR CATEGORIA, 2018-2032 (MIL USD)
TABELA 338 ENERGIA E ENERGIA DE SINGAPURA NO MERCADO DE COMPOSTOS PLÁSTICOS, POR CATEGORIA, 2018-2032 (MIL USD)
TABELA 339 SINGAPURA AEROESPACIAL E DEFESA NO MERCADO DE COMPOSTOS PLÁSTICOS, POR CATEGORIA, 2018-2032 (MIL USD)
TABELA 340 MERCADO DE COMPOSTOS PLÁSTICOS DA INDONÉSIA, POR TIPO DE POLÍMERO, 2018-2032 (MIL USD)
TABELA 341 MERCADO DE COMPOSTOS PLÁSTICOS DA INDONÉSIA, POR TIPO DE POLÍMERO, 2018-2032 (QUILO TONELADAS)
TABELA 342 TERMOPLÁSTICOS NA INDONÉSIA NO MERCADO DE COMPOSTOS PLÁSTICOS, POR TIPO, 2018-2032 (MIL USD)
TABELA 343 POLIETILENO (PE) NO MERCADO DE COMPOSTOS PLÁSTICOS DA INDONÉSIA, POR TIPO, 2018-2032 (MIL USD)
TABELA 344 PLÁSTICOS DE ENGENHARIA DA INDONÉSIA NO MERCADO DE COMPOSTOS PLÁSTICOS, POR TIPO, 2018-2032 (MIL USD)
TABELA 345 PLÁSTICOS TERMOFIXOS NO MERCADO DE COMPOSTOS PLÁSTICOS DA INDONÉSIA, POR TIPO, 2018-2032 (MIL USD)
TABELA 346 BIOPLÁSTICOS NA INDONÉSIA NO MERCADO DE COMPOSTOS PLÁSTICOS, POR TIPO, 2018-2032 (MIL USD)
TABELA 347 MERCADO DE COMPOSTOS PLÁSTICOS DA INDONÉSIA, POR TIPO DE ENCHIMENTO, 2018-2032 (MIL USD)
TABELA 348: CARGAS MINERAIS NO MERCADO DE COMPOSTOS PLÁSTICOS DA INDONÉSIA, POR TIPO, 2018-2032 (MIL USD)
TABELA 349 MERCADO DE REFORÇOS DE COMPOSTOS PLÁSTICOS DA INDONÉSIA, POR TIPO, 2018-2032 (MIL USD)
TABELA 350 ADITIVOS NA INDONÉSIA NO MERCADO DE COMPOSTOS PLÁSTICOS, POR TIPO, 2018-2032 (MIL USD)
TABELA 351 MERCADO DE COMPOSTOS PLÁSTICOS DA INDONÉSIA, POR PROCESSO DE FABRICAÇÃO, 2018-2032 (MIL USD)
TABELA 352 MERCADO DE COMPOSTOS PLÁSTICOS DA INDONÉSIA, POR PROCESSO DE FABRICAÇÃO, 2018-2032 (QUILO TONELADAS)
TABELA 353 EXTRUSÃO NA INDONÉSIA NO MERCADO DE COMPOSTOS PLÁSTICOS, POR TIPO, 2018-2032 (MIL USD)
TABELA 354 EXTRUSÃO NA INDONÉSIA NO MERCADO DE COMPOSTOS PLÁSTICOS, POR SISTEMA DE PELLETIZAÇÃO, 2018-2032 (MIL USD)
TABELA 355 COMPOSTOS À BASE DE MOLDAGEM POR INJEÇÃO NO MERCADO DE COMPOSTOS PLÁSTICOS DA INDONÉSIA, POR SISTEMA DE PELLETIZAÇÃO, 2018-2032 (MIL USD)
TABELA 356 COMPACTAÇÃO/PRENSAGEM NA INDONÉSIA NO MERCADO DE COMPOSTOS PLÁSTICOS, POR SISTEMA DE PELLETIZAÇÃO, 2018-2032 (MIL USD)
TABELA 357 MISTURA DE AMASSADORES/BANBURY NA INDONÉSIA NO MERCADO DE COMPOSTOS PLÁSTICOS, POR SISTEMA DE PELLETIZAÇÃO, 2018-2032 (MIL USD)
TABELA 358 MERCADO DE COMPOSTOS PLÁSTICOS DA INDONÉSIA, POR PROPRIEDADES, 2018-2032 (MIL USD)
TABELA 359 MERCADO DE COMPOSTOS PLÁSTICOS DA INDONÉSIA, POR APLICAÇÃO, 2018-2032 (MIL USD)
TABELA 360 MERCADO DE COMPOSTOS PLÁSTICOS DA INDONÉSIA, POR APLICAÇÃO, 2018-2032 (QUILO TONELADAS)
TABELA 361 MERCADO DE COMPOSTOS DE PLÁSTICO DA INDONÉSIA AUTOMOTIVO, POR CATEGORIA, 2018-2032 (MIL USD)
TABELA 362 COMPONENTES PARA INTERIORES NO MERCADO DE COMPOSTOS PLÁSTICOS DA INDONÉSIA, POR TIPO, 2018-2032 (MIL USD)
TABELA 363 PEÇAS EXTERNAS DA CARROCERIA NO MERCADO DE COMPOSTOS PLÁSTICOS DA INDONÉSIA, POR TIPO, 2018-2032 (MIL USD)
TABELA 364 APLICAÇÕES OCULTAS DA INDONÉSIA NO MERCADO DE COMPOSTOS PLÁSTICOS, POR TIPO, 2018-2032 (MIL USD)
TABELA 365 EMBALAGENS NA INDONÉSIA NO MERCADO DE COMPOSTOS PLÁSTICOS, POR CATEGORIA, 2018-2032 (MIL USD)
TABELA 366 EMBALAGENS PARA ALIMENTOS E BEBIDAS NO MERCADO DE COMPOSTOS PLÁSTICOS DA INDONÉSIA, POR TIPO, 2018-2032 (MIL USD)
TABELA 367 EMBALAGENS INDUSTRIAIS NO MERCADO DE COMPOSTOS PLÁSTICOS DA INDONÉSIA, POR TIPO, 2018-2032 (MIL USD)
TABELA 368 EMBALAGENS DE BENS DE CONSUMO NO MERCADO DE COMPOSTOS PLÁSTICOS DA INDONÉSIA, POR TIPO, 2018-2032 (MIL USD)
TABELA 369 EDIFÍCIOS E CONSTRUÇÃO NA INDONÉSIA NO MERCADO DE COMPOSTOS PLÁSTICOS, POR CATEGORIA, 2018-2032 (MIL USD)
TABELA 370 MERCADO DE COMPOSTOS PLÁSTICOS DA INDONÉSIA, ELÉTRICOS E ELETRÔNICOS, POR CATEGORIA, 2018-2032 (MIL USD)
TABELA 371 DISPOSITIVOS MÉDICOS NO MERCADO DE COMPOSTOS PLÁSTICOS DA INDONÉSIA, POR CATEGORIA, 2018-2032 (MIL USD)
TABELA 372 MÓVEIS NA INDONÉSIA NO MERCADO DE COMPOSTOS PLÁSTICOS, POR CATEGORIA, 2018-2032 (MIL USD)
TABELA 373 ENERGIA E ENERGIA NO MERCADO DE COMPOSTOS PLÁSTICOS DA INDONÉSIA, POR CATEGORIA, 2018-2032 (MIL USD)
TABELA 374 MERCADO DE COMPOSTOS PLÁSTICOS DA INDONÉSIA AEROESPACIAL E DEFESA, POR CATEGORIA, 2018-2032 (MIL USD)
TABELA 375 MERCADO DE COMPOSTOS PLÁSTICOS DA AUSTRÁLIA, POR TIPO DE POLÍMERO, 2018-2032 (MIL USD)
TABELA 376 MERCADO DE COMPOSTOS PLÁSTICOS DA AUSTRÁLIA, POR TIPO DE POLÍMERO, 2018-2032 (QUILO TONELADAS)
TABELA 377 TERMOPLÁSTICOS NA AUSTRÁLIA NO MERCADO DE COMPOSTOS PLÁSTICOS, POR TIPO, 2018-2032 (MIL USD)
TABELA 378 POLIETILENO (PE) NO MERCADO DE COMPOSTOS PLÁSTICOS DA AUSTRÁLIA, POR TIPO, 2018-2032 (MIL USD)
TABELA 379 PLÁSTICOS DE ENGENHARIA DA AUSTRÁLIA NO MERCADO DE COMPOSTOS PLÁSTICOS, POR TIPO, 2018-2032 (MIL USD)
TABELA 380 PLÁSTICOS TERMOFIXOS NO MERCADO DE COMPOSTOS PLÁSTICOS DA AUSTRÁLIA, POR TIPO, 2018-2032 (MIL USD)
TABELA 381 BIOPLÁSTICOS NA AUSTRÁLIA NO MERCADO DE COMPOSTOS PLÁSTICOS, POR TIPO, 2018-2032 (MIL USD)
TABELA 382 MERCADO DE COMPOSTOS PLÁSTICOS DA AUSTRÁLIA, POR TIPO DE ENCHIMENTO, 2018-2032 (MIL USD)
TABELA 383 CARGAS MINERAIS NO MERCADO DE COMPOSTOS PLÁSTICOS DA AUSTRÁLIA, POR TIPO, 2018-2032 (MIL USD)
TABELA 384 MERCADO DE REFORÇOS DE COMPOSTOS PLÁSTICOS DA AUSTRÁLIA, POR TIPO, 2018-2032 (MIL USD)
TABELA 385 ADITIVOS NA AUSTRÁLIA NO MERCADO DE COMPOSTOS PLÁSTICOS, POR TIPO, 2018-2032 (MIL USD)
TABELA 386 MERCADO DE COMPOSTOS PLÁSTICOS DA AUSTRÁLIA, POR PROCESSO DE FABRICAÇÃO, 2018-2032 (MIL USD)
TABELA 387 MERCADO DE COMPOSTOS PLÁSTICOS DA AUSTRÁLIA, POR PROCESSO DE FABRICAÇÃO, 2018-2032 (QUILO TONELADAS)
TABELA 388 EXTRUSÃO NA AUSTRÁLIA NO MERCADO DE COMPOSTOS PLÁSTICOS, POR TIPO, 2018-2032 (MIL USD)
TABELA 389 EXTRUSÃO NA AUSTRÁLIA NO MERCADO DE COMPOSTOS PLÁSTICOS, POR SISTEMA DE PELLETIZAÇÃO, 2018-2032 (MIL USD)
TABELA 390 AUSTRÁLIA MOLDAGEM POR INJEÇÃO NO MERCADO DE COMPOSTOS PLÁSTICOS, POR SISTEMA DE PELLETIZAÇÃO, 2018-2032 (MIL USD)
TABELA 391 COMPACTAÇÃO/PRENSAGEM NA AUSTRÁLIA NO MERCADO DE COMPOSTOS PLÁSTICOS, POR SISTEMA DE PELLETIZAÇÃO, 2018-2032 (MIL USD)
TABELA 392 AUSTRÁLIA KNEADER/BANBURY MISTURA NO MERCADO DE COMPOSTOS PLÁSTICOS, POR SISTEMA DE PELLETIZAÇÃO, 2018-2032 (MIL USD)
TABELA 393 MERCADO DE COMPOSTOS PLÁSTICOS DA AUSTRÁLIA, POR PROPRIEDADES, 2018-2032 (MIL USD)
TABELA 394 MERCADO DE COMPOSTOS PLÁSTICOS DA AUSTRÁLIA, POR APLICAÇÃO, 2018-2032 (MIL USD)
TABELA 395 MERCADO DE COMPOSTOS PLÁSTICOS DA AUSTRÁLIA, POR APLICAÇÃO, 2018-2032 (QUILO TONELADAS)
TABELA 396 AUSTRÁLIA AUTOMOTIVO NO MERCADO DE COMPOSTOS DE PLÁSTICO, POR CATEGORIA, 2018-2032 (MIL USD)
TABELA 397 COMPONENTES PARA INTERIORES NO MERCADO DE COMPOSTOS PLÁSTICOS DA AUSTRÁLIA, POR TIPO, 2018-2032 (MIL USD)
TABELA 398 - MERCADO DE COMPOSTOS PLÁSTICOS DA AUSTRÁLIA, POR TIPO, 2018-2032 (MIL USD)
TABELA 399 APLICAÇÕES OCULTAS DA AUSTRÁLIA NO MERCADO DE COMPOSTOS PLÁSTICOS, POR TIPO, 2018-2032 (MIL USD)
TABELA 400 EMBALAGENS AUSTRÁLIA NO MERCADO DE COMPOSTOS PLÁSTICOS, POR CATEGORIA, 2018-2032 (MIL USD)
TABELA 401 EMBALAGENS PARA ALIMENTOS E BEBIDAS NO MERCADO DE COMPOSTOS PLÁSTICOS DA AUSTRÁLIA, POR TIPO, 2018-2032 (MIL USD)
TABELA 402 EMBALAGENS INDUSTRIAIS NA AUSTRÁLIA NO MERCADO DE COMPOSTOS PLÁSTICOS, POR TIPO, 2018-2032 (MIL USD)
TABELA 403 EMBALAGENS DE BENS DE CONSUMO NA AUSTRÁLIA NO MERCADO DE COMPOSTOS PLÁSTICOS, POR TIPO, 2018-2032 (MIL USD)
TABELA 404 EDIFICAÇÃO E CONSTRUÇÃO NA AUSTRÁLIA NO MERCADO DE COMPOSTOS PLÁSTICOS, POR CATEGORIA, 2018-2032 (MIL USD)
TABELA 405 MERCADO DE COMPOSTOS PLÁSTICOS DA AUSTRÁLIA, ELÉTRICOS E ELETRÔNICOS, POR CATEGORIA, 2018-2032 (MIL USD)
TABELA 406 DISPOSITIVOS MÉDICOS NO MERCADO DE COMPOSTOS PLÁSTICOS DA AUSTRÁLIA, POR CATEGORIA, 2018-2032 (MIL USD)
TABELA 407 MÓVEIS DA AUSTRÁLIA NO MERCADO DE COMPOSTOS PLÁSTICOS, POR CATEGORIA, 2018-2032 (MIL USD)
TABELA 408 ENERGIA E ENERGIA NA AUSTRÁLIA NO MERCADO DE COMPOSTOS PLÁSTICOS, POR CATEGORIA, 2018-2032 (MIL USD)
TABELA 409 AUSTRÁLIA AEROESPACIAL E DEFESA NO MERCADO DE COMPOSTOS PLÁSTICOS, POR CATEGORIA, 2018-2032 (MIL USD)
TABELA 410 MERCADO DE COMPOSTOS PLÁSTICOS DA NOVA ZELÂNDIA, POR TIPO DE POLÍMERO, 2018-2032 (MIL USD)
TABELA 411 MERCADO DE COMPOSTOS PLÁSTICOS DA NOVA ZELÂNDIA, POR TIPO DE POLÍMERO, 2018-2032 (QUILO TONELADAS)
TABELA 412 TERMOPLÁSTICOS DA NOVA ZELÂNDIA NO MERCADO DE COMPOSTOS PLÁSTICOS, POR TIPO, 2018-2032 (MIL USD)
TABELA 413 POLIETILENO (PE) DA NOVA ZELÂNDIA NO MERCADO DE COMPOSTOS PLÁSTICOS, POR TIPO, 2018-2032 (MIL USD)
TABELA 414 PLÁSTICOS DE ENGENHARIA DA NOVA ZELÂNDIA NO MERCADO DE COMPOSTOS PLÁSTICOS, POR TIPO, 2018-2032 (MIL USD)
TABELA 415 PLÁSTICOS TERMOFIXOS DA NOVA ZELÂNDIA NO MERCADO DE COMPOSTOS PLÁSTICOS, POR TIPO, 2018-2032 (MIL USD)
TABELA 416 BIOPLÁSTICOS DA NOVA ZELÂNDIA NO MERCADO DE COMPOSTOS PLÁSTICOS, POR TIPO, 2018-2032 (MIL USD)
TABELA 417 MERCADO DE COMPOSTOS PLÁSTICOS DA NOVA ZELÂNDIA, POR TIPO DE ENCHIMENTO, 2018-2032 (MIL USD)
TABELA 418: CARGAS MINERAIS NO MERCADO DE COMPOSTOS PLÁSTICOS DA NOVA ZELÂNDIA, POR TIPO, 2018-2032 (MIL USD)
TABELA 419 REFORÇOS DA NOVA ZELÂNDIA NO MERCADO DE COMPOSTOS PLÁSTICOS, POR TIPO, 2018-2032 (MIL USD)
TABELA 420 ADITIVOS DA NOVA ZELÂNDIA NO MERCADO DE COMPOSTOS PLÁSTICOS, POR TIPO, 2018-2032 (MIL USD)
TABELA 421 MERCADO DE COMPOSTOS PLÁSTICOS DA NOVA ZELÂNDIA, POR PROCESSO DE FABRICAÇÃO, 2018-2032 (MIL USD)
TABELA 422 MERCADO DE COMPOSTOS PLÁSTICOS DA NOVA ZELÂNDIA, POR PROCESSO DE FABRICAÇÃO, 2018-2032 (QUILO TONELADAS)
TABELA 423 EXTRUSÃO NA NOVA ZELÂNDIA NO MERCADO DE COMPOSTOS PLÁSTICOS, POR TIPO, 2018-2032 (MIL USD)
TABELA 424 EXTRUSÃO NA NOVA ZELÂNDIA NO MERCADO DE COMPOSTOS PLÁSTICOS, POR SISTEMA DE PELLETIZAÇÃO, 2018-2032 (MIL USD)
TABELA 425 COMPOSTOS À BASE DE MOLDAGEM POR INJEÇÃO NO MERCADO DE COMPOSTOS PLÁSTICOS DA NOVA ZELÂNDIA, POR SISTEMA DE PELLETIZAÇÃO, 2018-2032 (MIL USD)
TABELA 426 COMPACTAÇÃO/PRENSAGEM NO MERCADO DE COMPOSTOS PLÁSTICOS DA NOVA ZELÂNDIA, POR SISTEMA DE PELLETIZAÇÃO, 2018-2032 (MIL USD)
TABELA 427 NOVA ZELÂNDIA KNEADER/BANBURY MISTURA NO MERCADO DE COMPOSTOS PLÁSTICOS, POR SISTEMA DE PELLETIZAÇÃO, 2018-2032 (MIL USD)
TABELA 428 MERCADO DE COMPOSTOS PLÁSTICOS DA NOVA ZELÂNDIA, POR PROPRIEDADES, 2018-2032 (MIL USD)
TABELA 429 MERCADO DE COMPOSTOS PLÁSTICOS DA NOVA ZELÂNDIA, POR APLICAÇÃO, 2018-2032 (MIL USD)
TABELA 430 MERCADO DE COMPOSTOS PLÁSTICOS DA NOVA ZELÂNDIA, POR APLICAÇÃO, 2018-2032 (QUILO TONELADAS)
TABELA 431 NOVA ZELÂNDIA AUTOMOTIVO NO MERCADO DE COMPOSTOS DE PLÁSTICO, POR CATEGORIA, 2018-2032 (MIL USD)
TABELA 432 COMPONENTES PARA INTERIORES NO MERCADO DE COMPOSTOS PLÁSTICOS DA NOVA ZELÂNDIA, POR TIPO, 2018-2032 (MIL USD)
TABELA 433 PEÇAS EXTERNAS DA CARROCERIA NO MERCADO DE COMPOSTOS PLÁSTICOS DA NOVA ZELÂNDIA, POR TIPO, 2018-2032 (MIL USD)
TABELA 434 APLICAÇÕES DESCONHECIDAS NO MERCADO DE COMPOSTOS PLÁSTICOS DA NOVA ZELÂNDIA, POR TIPO, 2018-2032 (MIL USD)
TABELA 435 EMBALAGENS DA NOVA ZELÂNDIA NO MERCADO DE COMPOSTOS PLÁSTICOS, POR CATEGORIA, 2018-2032 (MIL USD)
TABELA 436 EMBALAGENS PARA ALIMENTOS E BEBIDAS NO MERCADO DE COMPOSTOS PLÁSTICOS DA NOVA ZELÂNDIA, POR TIPO, 2018-2032 (MIL USD)
TABELA 437 EMBALAGENS INDUSTRIAIS NO MERCADO DE COMPOSTOS PLÁSTICOS DA NOVA ZELÂNDIA, POR TIPO, 2018-2032 (MIL USD)
TABELA 438 EMBALAGENS DE BENS DE CONSUMO NO MERCADO DE COMPOSTOS PLÁSTICOS DA NOVA ZELÂNDIA, POR TIPO, 2018-2032 (MIL USD)
TABELA 439 NOVA ZELÂNDIA EDIFÍCIOS E CONSTRUÇÃO NO MERCADO DE COMPOSTOS PLÁSTICOS, POR CATEGORIA, 2018-2032 (MIL USD)
TABELA 440 MERCADO DE COMPOSTOS PLÁSTICOS DA NOVA ZELÂNDIA, ELETRÔNICA E ELÉTRICA, POR CATEGORIA, 2018-2032 (MIL USD)
TABELA 441 DISPOSITIVOS MÉDICOS DA NOVA ZELÂNDIA NO MERCADO DE COMPOSTOS PLÁSTICOS, POR CATEGORIA, 2018-2032 (MIL USD)
TABELA 442 MÓVEIS DA NOVA ZELÂNDIA NO MERCADO DE COMPOSTOS PLÁSTICOS, POR CATEGORIA, 2018-2032 (MIL USD)
TABELA 443 ENERGIA E ENERGIA DA NOVA ZELÂNDIA NO MERCADO DE COMPOSTOS PLÁSTICOS, POR CATEGORIA, 2018-2032 (MIL USD)
TABELA 444 NOVA ZELÂNDIA AEROESPACIAL E DEFESA NO MERCADO DE COMPOSTOS PLÁSTICOS, POR CATEGORIA, 2018-2032 (MIL USD)
TABELA 445 MERCADO DE COMPOSTOS PLÁSTICOS NAS FILIPINAS, POR TIPO DE POLÍMERO, 2018-2032 (MIL USD)
TABELA 446 MERCADO DE COMPOSTOS PLÁSTICOS NAS FILIPINAS, POR TIPO DE POLÍMERO, 2018-2032 (QUILO TONELADAS)
TABELA 447 FILIPINAS TERMOPLÁSTICOS NO MERCADO DE COMPOSTOS PLÁSTICOS, POR TIPO, 2018-2032 (MIL USD)
TABELA 448 FILIPINAS POLIETILENO (PE) NO MERCADO DE COMPOSTOS PLÁSTICOS, POR TIPO, 2018-2032 (MIL USD)
TABELA 449 PLÁSTICOS DE ENGENHARIA NAS FILIPINAS NO MERCADO DE COMPOSTOS PLÁSTICOS, POR TIPO, 2018-2032 (MIL USD)
TABELA 450 PLÁSTICOS TERMOFIXOS NAS FILIPINAS NO MERCADO DE COMPOSTOS PLÁSTICOS, POR TIPO, 2018-2032 (MIL USD)
TABELA 451 BIOPLÁSTICOS NAS FILIPINAS NO MERCADO DE COMPOSTOS PLÁSTICOS, POR TIPO, 2018-2032 (MIL USD)
TABELA 452 MERCADO DE COMPOSTOS PLÁSTICOS NAS FILIPINAS, POR TIPO DE ENCHIMENTO, 2018-2032 (MIL USD)
TABELA 453 FILIPINAS: CARGAS MINERAIS NO MERCADO DE COMPOSTOS PLÁSTICOS, POR TIPO, 2018-2032 (MIL USD)
TABELA 454 MERCADO DE REFORÇOS PLÁSTICOS NAS FILIPINAS, POR TIPO, 2018-2032 (MIL USD)
TABELA 455 ADITIVOS NAS FILIPINAS NO MERCADO DE COMPOSTOS PLÁSTICOS, POR TIPO, 2018-2032 (MIL USD)
TABELA 456 MERCADO DE COMPOSTOS PLÁSTICOS NAS FILIPINAS, POR PROCESSO DE FABRICAÇÃO, 2018-2032 (MIL USD)
TABELA 457 MERCADO DE COMPOSTOS PLÁSTICOS NAS FILIPINAS, POR PROCESSO DE FABRICAÇÃO, 2018-2032 (QUILO TONELADAS)
TABELA 458 FILIPINAS EXTRUSÃO NO MERCADO DE COMPOSTOS PLÁSTICOS, POR TIPO, 2018-2032 (MIL USD)
TABELA 459 FILIPINAS EXTRUSÃO NO MERCADO DE COMPOSTOS PLÁSTICOS, POR SISTEMA DE PELLETIZAÇÃO, 2018-2032 (MIL USD)
TABELA 460 FILIPINAS: COMPOSTOS À BASE DE MOLDAGEM POR INJEÇÃO NO MERCADO DE COMPOSTOS PLÁSTICOS, POR SISTEMA DE PELLETIZAÇÃO, 2018-2032 (MIL USD)
TABELA 461 FILIPINAS COMPACTAÇÃO/PRENSAGEM NO MERCADO DE COMPOSTOS PLÁSTICOS, POR SISTEMA DE PELLETIZAÇÃO, 2018-2032 (MIL USD)
TABELA 462 FILIPINAS KNEADER/BANBURY MISTURA NO MERCADO DE COMPOSTOS PLÁSTICOS, POR SISTEMA DE PELLETIZAÇÃO, 2018-2032 (MIL USD)
TABELA 463 MERCADO DE COMPOSTOS PLÁSTICOS NAS FILIPINAS, POR PROPRIEDADES, 2018-2032 (MIL USD)
TABELA 464 MERCADO DE COMPOSTOS PLÁSTICOS NAS FILIPINAS, POR APLICAÇÃO, 2018-2032 (MIL USD)
TABELA 465 MERCADO DE COMPOSTOS PLÁSTICOS NAS FILIPINAS, POR APLICAÇÃO, 2018-2032 (QUILO TONELADAS)
TABELA 466 FILIPINAS AUTOMOTIVAS NO MERCADO DE COMPOSTOS DE PLÁSTICO, POR CATEGORIA, 2018-2032 (MIL USD)
TABELA 467 COMPONENTES PARA INTERIORES NAS FILIPINAS NO MERCADO DE COMPOSTOS PLÁSTICOS, POR TIPO, 2018-2032 (MIL USD)
TABELA 468 MERCADO DE COMPOSTOS PLÁSTICOS NAS FILIPINAS, POR TIPO, 2018-2032 (MIL USD)
TABELA 469 APLICAÇÕES OCULTAS NAS FILIPINAS NO MERCADO DE COMPOSTOS PLÁSTICOS, POR TIPO, 2018-2032 (MIL USD)
TABELA 470 MERCADO DE EMBALAGENS PLÁSTICAS NAS FILIPINAS, POR CATEGORIA, 2018-2032 (MIL USD)
TABELA 471 EMBALAGENS PARA ALIMENTOS E BEBIDAS NAS FILIPINAS NO MERCADO DE COMPOSTOS PLÁSTICOS, POR TIPO, 2018-2032 (MIL USD)
TABELA 472 MERCADO DE EMBALAGENS INDUSTRIAIS NAS FILIPINAS NO MERCADO DE COMPOSTOS PLÁSTICOS, POR TIPO, 2018-2032 (MIL USD)
TABELA 473 EMBALAGENS DE BENS DE CONSUMO NAS FILIPINAS NO MERCADO DE COMPOSTOS PLÁSTICOS, POR TIPO, 2018-2032 (MIL USD)
TABELA 474 FILIPINAS EDIFICAÇÃO E CONSTRUÇÃO NO MERCADO DE COMPOSTOS PLÁSTICOS, POR CATEGORIA, 2018-2032 (MIL USD)
TABELA 475 MERCADO DE COMPOSTOS PLÁSTICOS ELÉTRICOS E ELETRÔNICOS NAS FILIPINAS, POR CATEGORIA, 2018-2032 (MIL USD)
TABELA 476 DISPOSITIVOS MÉDICOS NAS FILIPINAS NO MERCADO DE COMPOSTOS PLÁSTICOS, POR CATEGORIA, 2018-2032 (MIL USD)
TABELA 477 MÓVEIS NAS FILIPINAS NO MERCADO DE COMPOSTOS DE PLÁSTICO, POR CATEGORIA, 2018-2032 (MIL USD)
TABELA 478 ENERGIA E ENERGIA NAS FILIPINAS NO MERCADO DE COMPOSTOS PLÁSTICOS, POR CATEGORIA, 2018-2032 (MIL USD)
TABELA 479 FILIPINAS AEROESPACIAL E DEFESA NO MERCADO DE COMPOSTOS PLÁSTICOS, POR CATEGORIA, 2018-2032 (MIL USD)
TABELA 480 MERCADO DE COMPOSTOS PLÁSTICOS DA MALÁSIA, POR TIPO DE POLÍMERO, 2018-2032 (MIL USD)
TABELA 481 MERCADO DE COMPOSTOS PLÁSTICOS DA MALÁSIA, POR TIPO DE POLÍMERO, 2018-2032 (QUILO TONELADAS)
TABELA 482 TERMOPLÁSTICOS DA MALÁSIA NO MERCADO DE COMPOSTOS PLÁSTICOS, POR TIPO, 2018-2032 (MIL USD)
TABELA 483 POLIETILENO (PE) DA MALÁSIA NO MERCADO DE COMPOSTOS PLÁSTICOS, POR TIPO, 2018-2032 (MIL USD)
TABELA 484 PLÁSTICOS DE ENGENHARIA DA MALÁSIA NO MERCADO DE COMPOSTOS PLÁSTICOS, POR TIPO, 2018-2032 (MIL USD)
TABELA 485 PLÁSTICOS TERMOFIXOS DA MALÁSIA NO MERCADO DE COMPOSTOS PLÁSTICOS, POR TIPO, 2018-2032 (MIL USD)
TABELA 486 BIOPLÁSTICOS DA MALÁSIA NO MERCADO DE COMPOSTOS PLÁSTICOS, POR TIPO, 2018-2032 (MIL USD)
TABELA 487 MERCADO DE COMPOSTOS PLÁSTICOS DA MALÁSIA, POR TIPO DE ENCHIMENTO, 2018-2032 (MIL USD)
TABELA 488: CARGAS MINERAIS NO MERCADO DE COMPOSTOS PLÁSTICOS DA MALÁSIA, POR TIPO, 2018-2032 (MIL USD)
TABELA 489 REFORÇOS DA MALÁSIA NO MERCADO DE COMPOSTOS PLÁSTICOS, POR TIPO, 2018-2032 (MIL USD)
TABELA 490 ADITIVOS DA MALÁSIA NO MERCADO DE COMPOSTOS PLÁSTICOS, POR TIPO, 2018-2032 (MIL USD)
TABELA 491 MERCADO DE COMPOSTOS PLÁSTICOS DA MALÁSIA, POR PROCESSO DE FABRICAÇÃO, 2018-2032 (MIL USD)
TABELA 492 MERCADO DE COMPOSTOS PLÁSTICOS DA MALÁSIA, POR PROCESSO DE FABRICAÇÃO, 2018-2032 (QUILO TONELADAS)
TABELA 493 EXTRUSÃO DA MALÁSIA NO MERCADO DE COMPOSTOS PLÁSTICOS, POR TIPO, 2018-2032 (MIL USD)
TABELA 494 EXTRUSÃO DA MALÁSIA NO MERCADO DE COMPOSTOS PLÁSTICOS, POR SISTEMA DE PELLETIZAÇÃO, 2018-2032 (MIL USD)
TABELA 495 COMPOSTOS À BASE DE MOLDAGEM POR INJEÇÃO DA MALÁSIA NO MERCADO DE COMPOSTOS PLÁSTICOS, POR SISTEMA DE PELLETIZAÇÃO, 2018-2032 (MIL USD)
TABELA 496 COMPACTAÇÃO/PRENSAGEM NA MALÁSIA NO MERCADO DE COMPOSTOS PLÁSTICOS, POR SISTEMA DE PELLETIZAÇÃO, 2018-2032 (MIL USD)
TABELA 497 MALÁSIA AMASSADORA/BANBURY MISTURA NO MERCADO DE COMPOSTOS PLÁSTICOS, POR SISTEMA DE PELLETIZAÇÃO, 2018-2032 (MIL USD)
TABELA 498 MERCADO DE COMPOSTOS PLÁSTICOS DA MALÁSIA, POR PROPRIEDADES, 2018-2032 (MIL USD)
TABELA 499 MERCADO DE COMPOSTOS PLÁSTICOS DA MALÁSIA, POR APLICAÇÃO, 2018-2032 (MIL USD)
TABELA 500 MERCADO DE COMPOSTOS PLÁSTICOS DA MALÁSIA, POR APLICAÇÃO, 2018-2032 (QUILO TONELADAS)
TABELA 501 MERCADO AUTOMOTIVO DA MALÁSIA NO MERCADO DE COMPOSTOS DE PLÁSTICO, POR CATEGORIA, 2018-2032 (MIL USD)
TABELA 502 COMPONENTES PARA INTERIORES NO MERCADO DE COMPOSTOS PLÁSTICOS DA MALÁSIA, POR TIPO, 2018-2032 (MIL USD)
TABELA 503 PEÇAS EXTERNAS DA CARROCERIA NO MERCADO DE COMPOSTOS PLÁSTICOS DA MALÁSIA, POR TIPO, 2018-2032 (MIL USD)
TABELA 504 APLICAÇÕES OCULTAS DA MALÁSIA NO MERCADO DE COMPOSTOS PLÁSTICOS, POR TIPO, 2018-2032 (MIL USD)
TABELA 505 EMBALAGENS DA MALÁSIA NO MERCADO DE COMPOSTOS PLÁSTICOS, POR CATEGORIA, 2018-2032 (MIL USD)
TABELA 506 EMBALAGENS PARA ALIMENTOS E BEBIDAS NO MERCADO DE COMPOSTOS PLÁSTICOS DA MALÁSIA, POR TIPO, 2018-2032 (MIL USD)
TABELA 507 EMBALAGENS INDUSTRIAIS DA MALÁSIA NO MERCADO DE COMPOSTOS PLÁSTICOS, POR TIPO, 2018-2032 (MIL USD)
TABELA 508 EMBALAGENS DE BENS DE CONSUMO DA MALÁSIA NO MERCADO DE COMPOSTOS PLÁSTICOS, POR TIPO, 2018-2032 (MIL USD)
TABELA 509 MALÁSIA EDIFICAÇÃO E CONSTRUÇÃO NO MERCADO DE COMPOSTOS PLÁSTICOS, POR CATEGORIA, 2018-2032 (MIL USD)
TABELA 510 MERCADO DE COMPOSTOS PLÁSTICOS DA MALÁSIA, ELÉTRICOS E ELETRÔNICOS, POR CATEGORIA, 2018-2032 (MIL USD)
TABELA 511 DISPOSITIVOS MÉDICOS DA MALÁSIA NO MERCADO DE COMPOSTOS PLÁSTICOS, POR CATEGORIA, 2018-2032 (MIL USD)
TABELA 512 MÓVEIS DA MALÁSIA NO MERCADO DE COMPOSTOS DE PLÁSTICO, POR CATEGORIA, 2018-2032 (MIL USD)
TABELA 513 ENERGIA E ENERGIA DA MALÁSIA NO MERCADO DE COMPOSTOS DE PLÁSTICO, POR CATEGORIA, 2018-2032 (MIL USD)
TABELA 514 MALÁSIA AEROESPACIAL E DEFESA NO MERCADO DE COMPOSTOS PLÁSTICOS, POR CATEGORIA, 2018-2032 (MIL USD)
TABELA 515 MERCADO DE COMPOSTOS PLÁSTICOS DE TAIWAN, POR TIPO DE POLÍMERO, 2018-2032 (MIL USD)
TABELA 516 MERCADO DE COMPOSTOS PLÁSTICOS DE TAIWAN, POR TIPO DE POLÍMERO, 2018-2032 (QUILO TONELADAS)
TABELA 517 TERMOPLÁSTICOS DE TAIWAN NO MERCADO DE COMPOSTOS PLÁSTICOS, POR TIPO, 2018-2032 (MIL USD)
TABELA 518 POLIETILENO (PE) DE TAIWAN NO MERCADO DE COMPOSTOS PLÁSTICOS, POR TIPO, 2018-2032 (MIL USD)
TABELA 519 PLÁSTICOS DE ENGENHARIA DE TAIWAN NO MERCADO DE COMPOSTOS PLÁSTICOS, POR TIPO, 2018-2032 (MIL USD)
TABELA 520 PLÁSTICOS TERMOFIXOS DE TAIWAN NO MERCADO DE COMPOSTOS PLÁSTICOS, POR TIPO, 2018-2032 (MIL USD)
TABELA 521 BIOPLÁSTICOS DE TAIWAN NO MERCADO DE COMPOSTOS PLÁSTICOS, POR TIPO, 2018-2032 (MIL USD)
TABELA 522 MERCADO DE COMPOSTOS PLÁSTICOS DE TAIWAN, POR TIPO DE ENCHIMENTO, 2018-2032 (MIL USD)
TABELA 523 ENCHIMENTOS MINERAIS DE TAIWAN NO MERCADO DE COMPOSTOS PLÁSTICOS, POR TIPO, 2018-2032 (MIL USD)
TABELA 524 MERCADO DE REFORÇOS DE TAIWAN NO MERCADO DE COMPOSTOS PLÁSTICOS, POR TIPO, 2018-2032 (MIL USD)
TABELA 525 ADITIVOS DE TAIWAN NO MERCADO DE COMPOSTOS PLÁSTICOS, POR TIPO, 2018-2032 (MIL USD)
TABELA 526 MERCADO DE COMPOSTOS PLÁSTICOS DE TAIWAN, POR PROCESSO DE FABRICAÇÃO, 2018-2032 (MIL USD)
TABELA 527 MERCADO DE COMPOSTOS PLÁSTICOS DE TAIWAN, POR PROCESSO DE FABRICAÇÃO, 2018-2032 (QUILO TONELADAS)
TABELA 528 EXTRUSÃO DE TAIWAN NO MERCADO DE COMPOSTOS PLÁSTICOS, POR TIPO, 2018-2032 (MIL USD)
TABELA 529 EXTRUSÃO DE TAIWAN NO MERCADO DE COMPOSTOS PLÁSTICOS, POR SISTEMA DE PELLETIZAÇÃO, 2018-2032 (MIL USD)
TABELA 530 COMPOSTOS BASEADOS EM MOLDAGEM POR INJEÇÃO DE TAIWAN NO MERCADO DE COMPOSTOS PLÁSTICOS, POR SISTEMA DE PELLETIZAÇÃO, 2018-2032 (MIL USD)
TABELA 531 COMPACTAÇÃO/PRENSAGEM EM TAIWAN NO MERCADO DE COMPOSTOS PLÁSTICOS, POR SISTEMA DE PELLETIZAÇÃO, 2018-2032 (MIL USD)
TABELA 532 MISTURA DE TAIWAN KNEADER/BANBURY NO MERCADO DE COMPOSTOS PLÁSTICOS, POR SISTEMA DE PELLETIZAÇÃO, 2018-2032 (MIL USD)
TABELA 533 MERCADO DE COMPOSTOS PLÁSTICOS DE TAIWAN, POR PROPRIEDADES, 2018-2032 (MIL USD)
TABELA 534 MERCADO DE COMPOSTOS PLÁSTICOS DE TAIWAN, POR APLICAÇÃO, 2018-2032 (MIL USD)
TABELA 535 MERCADO DE COMPOSTOS PLÁSTICOS DE TAIWAN, POR APLICAÇÃO, 2018-2032 (QUILO TONELADAS)
TABELA 536 TAIWAN AUTOMOTIVE NO MERCADO DE COMPOSTOS DE PLÁSTICO, POR CATEGORIA, 2018-2032 (MIL USD)
TABELA 537 COMPONENTES PARA INTERIORES DE TAIWAN NO MERCADO DE COMPOSTOS PLÁSTICOS, POR TIPO, 2018-2032 (MIL USD)
TABELA 538 PEÇAS EXTERNAS DA CARROCERIA NO MERCADO DE COMPOSTOS PLÁSTICOS DE TAIWAN, POR TIPO, 2018-2032 (MIL USD)
TABELA 539 APLICAÇÕES DE TAIWAN SOB O CAPÔ NO MERCADO DE COMPOSTOS PLÁSTICOS, POR TIPO, 2018-2032 (MIL USD)
TABELA 540 EMBALAGENS DE TAIWAN NO MERCADO DE COMPOSTOS PLÁSTICOS, POR CATEGORIA, 2018-2032 (MIL USD)
TABELA 541 EMBALAGENS PARA ALIMENTOS E BEBIDAS NO MERCADO DE COMPOSTOS PLÁSTICOS DE TAIWAN, POR TIPO, 2018-2032 (MIL USD)
TABELA 542 EMBALAGENS INDUSTRIAIS DE TAIWAN NO MERCADO DE COMPOSTOS PLÁSTICOS, POR TIPO, 2018-2032 (MIL USD)
TABELA 543 EMBALAGENS DE BENS DE CONSUMO DE TAIWAN NO MERCADO DE COMPOSTOS PLÁSTICOS, POR TIPO, 2018-2032 (MIL USD)
TABELA 544 CONSTRUÇÃO E EDIFÍCIOS DE TAIWAN NO MERCADO DE COMPOSTOS DE PLÁSTICO, POR CATEGORIA, 2018-2032 (MIL USD)
TABELA 545 MERCADO DE COMPOSTOS PLÁSTICOS DE TAIWAN, ELETRÔNICA E ELÉTRICA, POR CATEGORIA, 2018-2032 (MIL USD)
TABELA 546 DISPOSITIVOS MÉDICOS DE TAIWAN NO MERCADO DE COMPOSTOS PLÁSTICOS, POR CATEGORIA, 2018-2032 (MIL USD)
TABELA 547 MÓVEIS DE TAIWAN NO MERCADO DE COMPOSTOS DE PLÁSTICO, POR CATEGORIA, 2018-2032 (MIL USD)
TABELA 548 ENERGIA E ENERGIA DE TAIWAN NO MERCADO DE COMPOSTOS DE PLÁSTICO, POR CATEGORIA, 2018-2032 (MIL USD)
TABELA 549 - MERCADO DE COMPOSTOS PLÁSTICOS DA AEROESPACIAL E DEFESA DE TAIWAN, POR CATEGORIA, 2018-2032 (MIL USD)
TABELA 550 MERCADO DE COMPOSTOS PLÁSTICOS DE HONG KONG, POR TIPO DE POLÍMERO, 2018-2032 (MIL USD)
TABELA 551 MERCADO DE COMPOSTOS PLÁSTICOS DE HONG KONG, POR TIPO DE POLÍMERO, 2018-2032 (QUILO TONELADAS)
TABELA 552 TERMOPLÁSTICOS DE HONG KONG NO MERCADO DE COMPOSTOS PLÁSTICOS, POR TIPO, 2018-2032 (MIL USD)
TABELA 553 POLIETILENO (PE) NO MERCADO DE COMPOSTOS PLÁSTICOS DE HONG KONG, POR TIPO, 2018-2032 (MIL USD)
TABELA 554 PLÁSTICOS DE ENGENHARIA DE HONG KONG NO MERCADO DE COMPOSTOS PLÁSTICOS, POR TIPO, 2018-2032 (MIL USD)
TABELA 555 PLÁSTICOS TERMOFIXOS DE HONG KONG NO MERCADO DE COMPOSTOS PLÁSTICOS, POR TIPO, 2018-2032 (MIL USD)
TABELA 556 BIOPLÁSTICOS DE HONG KONG NO MERCADO DE COMPOSTOS PLÁSTICOS, POR TIPO, 2018-2032 (MIL USD)
TABELA 557 MERCADO DE COMPOSTOS PLÁSTICOS DE HONG KONG, POR TIPO DE ENCHIMENTO, 2018-2032 (MIL USD)
TABELA 558: CARGAS MINERAIS NO MERCADO DE COMPOSTOS PLÁSTICOS DE HONG KONG, POR TIPO, 2018-2032 (MIL USD)
TABELA 559 REFORÇOS DE HONG KONG NO MERCADO DE COMPOSTOS PLÁSTICOS, POR TIPO, 2018-2032 (MIL USD)
TABELA 560 ADITIVOS DE HONG KONG NO MERCADO DE COMPOSTOS PLÁSTICOS, POR TIPO, 2018-2032 (MIL USD)
TABELA 561 MERCADO DE COMPOSTOS PLÁSTICOS DE HONG KONG, POR PROCESSO DE FABRICAÇÃO, 2018-2032 (MIL USD)
TABELA 562 MERCADO DE COMPOSTOS PLÁSTICOS DE HONG KONG, POR PROCESSO DE FABRICAÇÃO, 2018-2032 (QUILO TONELADAS)
TABELA 563 EXTRUSÃO DE HONG KONG NO MERCADO DE COMPOSTOS PLÁSTICOS, POR TIPO, 2018-2032 (MIL USD)
TABELA 564 EXTRUSÃO DE HONG KONG NO MERCADO DE COMPOSTOS PLÁSTICOS, POR SISTEMA DE PELLETIZAÇÃO, 2018-2032 (MIL USD)
TABELA 565 COMPOSTOS À BASE DE MOLDAGEM POR INJEÇÃO DE HONG KONG NO MERCADO DE COMPOSTOS PLÁSTICOS, POR SISTEMA DE PELLETIZAÇÃO, 2018-2032 (MIL USD)
TABELA 566 COMPACTAÇÃO/PRENSAGEM EM HONG KONG NO MERCADO DE COMPOSTOS PLÁSTICOS, POR SISTEMA DE PELLETIZAÇÃO, 2018-2032 (MIL USD)
TABELA 567 HONG KONG KNEADER/BANBURY MIXING NO MERCADO DE COMPOSTOS PLÁSTICOS, POR SISTEMA DE PELLETIZAÇÃO, 2018-2032 (MIL USD)
TABELA 568 MERCADO DE COMPOSTOS PLÁSTICOS DE HONG KONG, POR PROPRIEDADES, 2018-2032 (MIL USD)
TABELA 569 MERCADO DE COMPOSTOS PLÁSTICOS DE HONG KONG, POR APLICAÇÃO, 2018-2032 (MIL USD)
TABELA 570 MERCADO DE COMPOSTOS PLÁSTICOS DE HONG KONG, POR APLICAÇÃO, 2018-2032 (QUILO TONELADAS)
TABELA 571 HONG KONG AUTOMOTIVE NO MERCADO DE COMPOSTOS DE PLÁSTICO, POR CATEGORIA, 2018-2032 (MIL USD)
TABELA 572 COMPONENTES PARA INTERIORES DE HONG KONG NO MERCADO DE COMPOSTOS PLÁSTICOS, POR TIPO, 2018-2032 (MIL USD)
TABELA 573 PEÇAS EXTERNAS DA CARROCERIA NO MERCADO DE COMPOSTOS PLÁSTICOS DE HONG KONG, POR TIPO, 2018-2032 (MIL USD)
TABELA 574 APLICAÇÕES OCULTAS DE HONG KONG NO MERCADO DE COMPOSTOS PLÁSTICOS, POR TIPO, 2018-2032 (MIL USD)
TABELA 575 EMBALAGENS DE HONG KONG NO MERCADO DE COMPOSTOS PLÁSTICOS, POR CATEGORIA, 2018-2032 (MIL USD)
TABELA 576 EMBALAGENS PARA ALIMENTOS E BEBIDAS NO MERCADO DE COMPOSTOS PLÁSTICOS DE HONG KONG, POR TIPO, 2018-2032 (MIL USD)
TABELA 577 EMBALAGENS INDUSTRIAIS DE HONG KONG NO MERCADO DE COMPOSTOS PLÁSTICOS, POR TIPO, 2018-2032 (MIL USD)
TABELA 578 EMBALAGENS DE BENS DE CONSUMO NO MERCADO DE COMPOSTOS PLÁSTICOS DE HONG KONG, POR TIPO, 2018-2032 (MIL USD)
TABELA 579 EDIFÍCIOS E CONSTRUÇÃO DE HONG KONG NO MERCADO DE COMPOSTOS DE PLÁSTICO, POR CATEGORIA, 2018-2032 (MIL USD)
TABELA 580 MERCADO DE COMPOSTOS PLÁSTICOS DE HONG KONG, ELETRÔNICA E ELÉTRICA, POR CATEGORIA, 2018-2032 (MIL USD)
TABELA 581 DISPOSITIVOS MÉDICOS NO MERCADO DE COMPOSTOS PLÁSTICOS DE HONG KONG, POR CATEGORIA, 2018-2032 (MIL USD)
TABELA 582 MÓVEIS DE HONG KONG NO MERCADO DE COMPOSTOS DE PLÁSTICO, POR CATEGORIA, 2018-2032 (MIL USD)
TABELA 583 ENERGIA E ENERGIA DE HONG KONG NO MERCADO DE COMPOSTOS PLÁSTICOS, POR CATEGORIA, 2018-2032 (MIL USD)
TABELA 584 MERCADO DE COMPOSTOS PLÁSTICOS DA AEROESPACIAL E DEFESA DE HONG KONG, POR CATEGORIA, 2018-2032 (MIL USD)
TABELA 585 RESTANTE DO MERCADO DE COMPOSTOS PLÁSTICOS DA ÁSIA-PACÍFICO, POR TIPO DE POLÍMERO, 2018-2032 (MIL USD)
TABELA 586 RESTANTE DO MERCADO DE COMPOSTOS PLÁSTICOS DA ÁSIA-PACÍFICO, POR TIPO DE POLÍMERO, 2018-2032 (QUILO TONELADAS)
Lista de Figura
FIGURA 1 MERCADO DE COMPOSTOS PLÁSTICOS DA ÁSIA-PACÍFICO
FIGURA 2 MERCADO DE COMPOSTOS PLÁSTICOS DA ÁSIA-PACÍFICO: TRIANGULAÇÃO DE DADOS
FIGURA 3 MERCADO DE COMPOSTOS PLÁSTICOS DA ÁSIA-PACÍFICO: ANÁLISE DROC
FIGURA 4 MERCADO DE COMPOSTOS PLÁSTICOS DA ÁSIA-PACÍFICO: ANÁLISE DE MERCADO DA ÁSIA-PACÍFICO VS MERCADO REGIONAL
FIGURA 5 MERCADO DE COMPOSTOS PLÁSTICOS DA ÁSIA-PACÍFICO: ANÁLISE DE PESQUISA DA EMPRESA
FIGURA 6 MERCADO DE COMPOSTOS PLÁSTICOS DA ÁSIA-PACÍFICO: MODELAGEM MULTIVARIADA
FIGURA 7 MERCADO DE COMPOSTOS PLÁSTICOS DA ÁSIA-PACÍFICO: DEMOGRAFIA DA ENTREVISTA
FIGURA 8 MERCADO DE COMPOSTOS PLÁSTICOS DA ÁSIA-PACÍFICO: GRADE DE POSIÇÃO DE MERCADO DE DBMR
FIGURA 9 MERCADO DE COMPOSTOS PLÁSTICOS DA ÁSIA-PACÍFICO: GRADE DE COBERTURA DE APLICAÇÕES DE MERCADO
FIGURA 10 RESUMO EXECUTIVO
FIGURA 11 MERCADO DE COMPOSTOS PLÁSTICOS DA ÁSIA-PACÍFICO: SEGMENTAÇÃO
FIGURA 12 CINCO SEGMENTOS COMPREENDEM O MERCADO DE COMPOSTOS PLÁSTICOS DA ÁSIA-PACÍFICO, POR TIPO DE POLÍMERO
FIGURA 13 DECISÕES ESTRATÉGICAS
FIGURA 14 A MUDANÇA PARA COMPOSTOS PLÁSTICOS RECICLÁVEIS E BIODEGRADÁVEIS DEVIDO À REGULAMENTAÇÃO AMBIENTAL DEVE IMPULSIONAR O MERCADO DE COMPOSTOS PLÁSTICOS DA ÁSIA-PACÍFICO DURANTE O PERÍODO PREVISTO DE 2025 A 2032
FIGURA 15 O SEGMENTO DE TERMOPLÁSTICOS DEVE SER REPRESENTANTE DA MAIOR PARCIALIDADE DO MERCADO DE COMPOSTOS PLÁSTICOS DA ÁSIA-PACÍFICO EM 2025 E 2032
FIGURA 16 ANÁLISE DAS CINCO FORÇAS DE PORTER
FIGURA 17 MERCADO DE COMPOSTOS PLÁSTICOS DA ÁSIA-PACÍFICO: ANÁLISE DA CADEIA DE VALOR
FIGURA 18 CENÁRIO DE IMPORTAÇÃO E EXPORTAÇÃO (MIL USD)
FIGURA 19 CAPACIDADE DE PRODUÇÃO DOS PRINCIPAIS FABRICANTES
FIGURA 20 CÓDIGO IPC V/S NÚMERO DE PATENTES
FIGURA 21 NÚMERO DE PATENTES POR ANO
FIGURA 22 NÚMERO DE PATENTES POR REGIÃO/PAÍS
FIGURA 23 PRINCIPAIS REQUERENTES DE PATENTES
FIGURA 24 MERCADO DE COMPOSTOS PLÁSTICOS DA ÁSIA-PACÍFICO, 2024-2032, PREÇO MÉDIO DE VENDA (USD/KG)
FIGURA 25 MOTIVADORES, RESTRIÇÕES, OPORTUNIDADES E DESAFIOS DO MERCADO DE COMPOSTOS PLÁSTICOS DA ÁSIA-PACÍFICO
FIGURA 26 MERCADO DE COMPOSTOS PLÁSTICOS DA ÁSIA-PACÍFICO: POR TIPO DE POLÍMERO, 2024
FIGURA 27 MERCADO DE COMPOSTOS PLÁSTICOS DA ÁSIA-PACÍFICO, POR TIPO DE FILTRO, 2024
FIGURA 28 MERCADO DE COMPOSTOS PLÁSTICOS DA ÁSIA-PACÍFICO, POR PROCESSO DE FABRICAÇÃO, 2024
FIGURA 29 MERCADO DE COMPOSTOS PLÁSTICOS DA ÁSIA-PACÍFICO, POR PROPRIEDADES, 2024
FIGURA 30 MERCADO DE COMPOSTOS PLÁSTICOS DA ÁSIA-PACÍFICO, POR APLICAÇÃO, 2024
FIGURA 31 MERCADO DE COMPOSTOS PLÁSTICOS DA ÁSIA-PACÍFICO: RESUMO (2024)
FIGURA 32 MERCADO DE COMPOSTOS PLÁSTICOS DA ÁSIA-PACÍFICO: PARTICIPAÇÃO DA EMPRESA EM 2024 (%)
Metodologia de Investigação
A recolha de dados e a análise do ano base são feitas através de módulos de recolha de dados com amostras grandes. A etapa inclui a obtenção de informações de mercado ou dados relacionados através de diversas fontes e estratégias. Inclui examinar e planear antecipadamente todos os dados adquiridos no passado. Da mesma forma, envolve o exame de inconsistências de informação observadas em diferentes fontes de informação. Os dados de mercado são analisados e estimados utilizando modelos estatísticos e coerentes de mercado. Além disso, a análise da quota de mercado e a análise das principais tendências são os principais fatores de sucesso no relatório de mercado. Para saber mais, solicite uma chamada de analista ou abra a sua consulta.
A principal metodologia de investigação utilizada pela equipa de investigação do DBMR é a triangulação de dados que envolve a mineração de dados, a análise do impacto das variáveis de dados no mercado e a validação primária (especialista do setor). Os modelos de dados incluem grelha de posicionamento de fornecedores, análise da linha de tempo do mercado, visão geral e guia de mercado, grelha de posicionamento da empresa, análise de patentes, análise de preços, análise da quota de mercado da empresa, normas de medição, análise global versus regional e de participação dos fornecedores. Para saber mais sobre a metodologia de investigação, faça uma consulta para falar com os nossos especialistas do setor.
Personalização disponível
A Data Bridge Market Research é líder em investigação formativa avançada. Orgulhamo-nos de servir os nossos clientes novos e existentes com dados e análises que correspondem e atendem aos seus objetivos. O relatório pode ser personalizado para incluir análise de tendências de preços de marcas-alvo, compreensão do mercado para países adicionais (solicite a lista de países), dados de resultados de ensaios clínicos, revisão de literatura, mercado remodelado e análise de base de produtos . A análise de mercado dos concorrentes-alvo pode ser analisada desde análises baseadas em tecnologia até estratégias de carteira de mercado. Podemos adicionar quantos concorrentes necessitar de dados no formato e estilo de dados que procura. A nossa equipa de analistas também pode fornecer dados em tabelas dinâmicas de ficheiros Excel em bruto (livro de factos) ou pode ajudá-lo a criar apresentações a partir dos conjuntos de dados disponíveis no relatório.

