Asia-Pacific Unmanned Surface Vehicle (USV) Market, By Type (Surface and Sub-Surface), Application (Defense, Commercial, Scientific Research, and Others), Endurance (100-500 Hours, 1000 Hours), Operation (Remote Operated Surface Vehicle and Autonomous Surface Vehicle), System (Propulsion, Chassis Material, Payload, Component, Software, and Communication), Hull Type (Catamaran (Twin Hulls), Kayak (Single Hull), Trimaran (Triple Hulls), and Rigid Inflatable Hull), Size (Medium (4 to 8 M), Small (Less than 4 M), Large (8 to 12 M), and Extra-Large (Above 12 M)) Industry Trends and Forecast to 2030.
Asia-Pacific Unmanned Surface Vehicle (USV) Market Analysis and Size
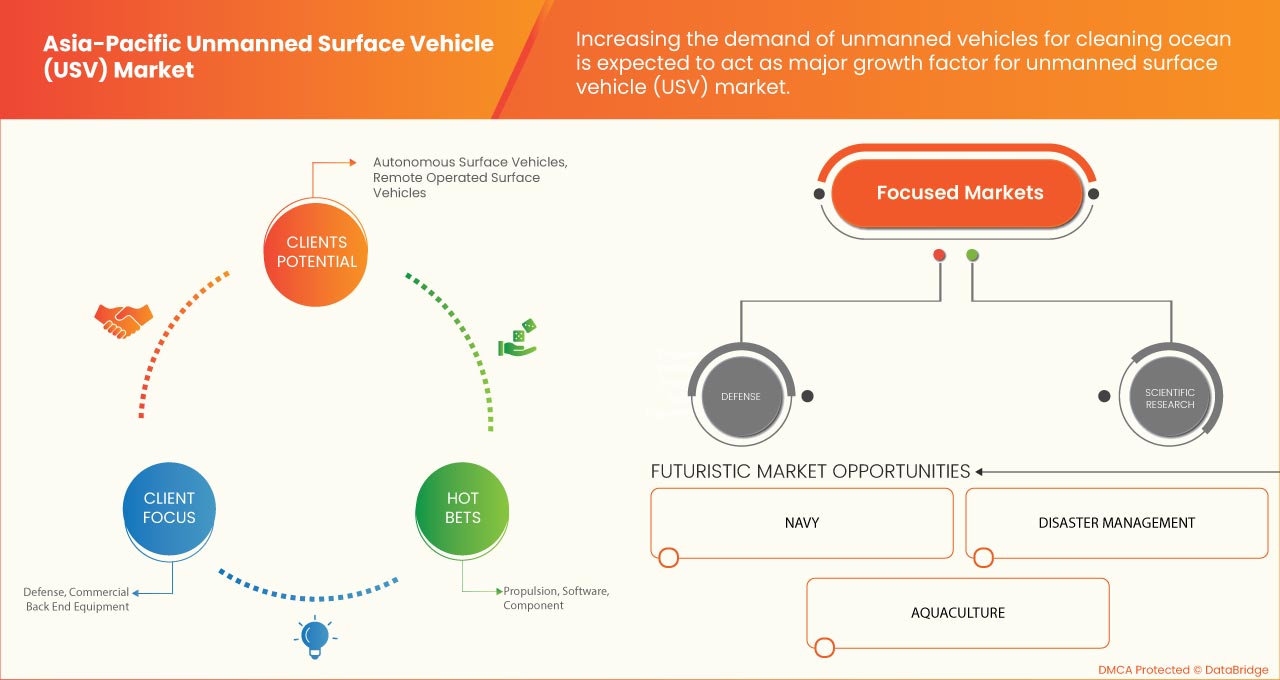
The increasing use of solar batteries to power the autonomous surface vehicle (ASV) is accelerating the growth of unmanned surface vehicles (USV). The growing demand for water quality monitoring due to increased levels of pollution and ocean data mapping, which allows scientists to study past climatic conditions, is boosting the growth of unmanned surface vehicles (USV). In addition, rising maritime security threats are prompting Asia-Pacific navies to induce autonomous surface vehicles (ASV) in their fleet, giving them an edge, and further accelerating the Asia-Pacific unmanned surface vehicle (USV) market growth. Their diversifying uses in disaster management services especially in search and rescue and preventive maintenance, for protecting the integrity of territorial and enclosed water areas. The rapid adoption in the aquaculture industry, which allows them for real-time monitoring to cater to the growing demand for worldwide fishery products, is expected to create strong opportunities for the Asia-Pacific unmanned surface vehicle (USV) market. However, nascent collision detection technologies and further technological complexities associated with making them truly autonomous pose a challenge to the growth of the Asia-Pacific unmanned surface vehicle (USV) market.
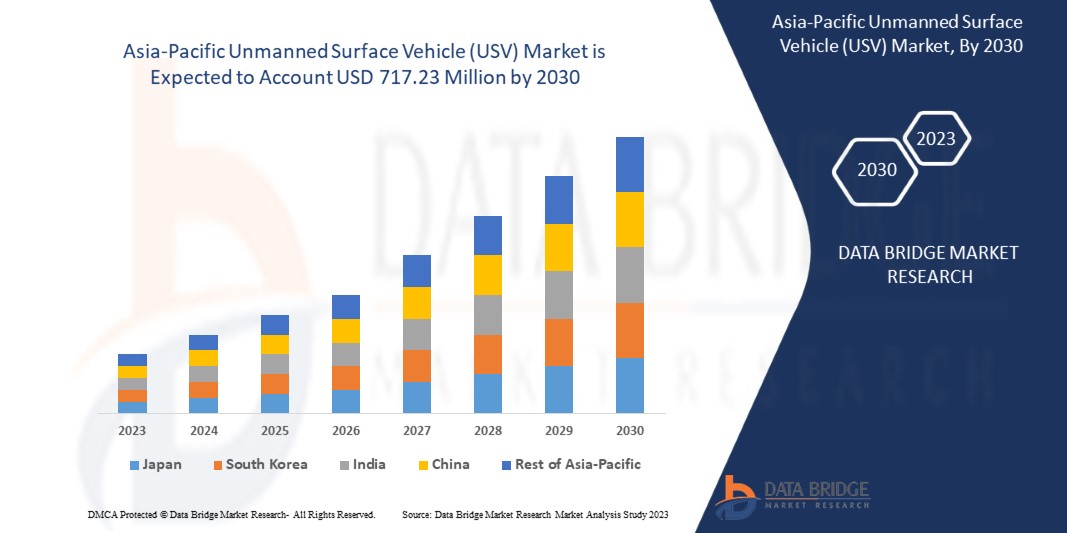
Data Bridge Market Research analyses that the Asia-Pacific unmanned surface vehicle (USV) market is expected to reach the value of USD 717.23 million by 2030, at a CAGR of 13.2% during the forecast period. The unmanned surface vehicle (USV) market report also covers pricing analysis, patent analysis, and technological advancements in depth.
|
Report Metric |
Details |
|
Forecast Period |
2023 to 2030 |
|
Base Year |
2022 |
|
Historic Years |
2021 (Customizable to 2020 - 2016) |
|
Quantitative Units |
Revenue in USD Million, Pricing in USD |
|
Segments Covered |
By Type (Surface and Sub-Surface), Application (Defense, Commercial, Scientific Research, and Others), Endurance (100-500 Hours, <100 Hours, 500-1000 Hours, and >1000 Hours), Operation (Remote Operated Surface Vehicle and Autonomous Surface Vehicle), System (Propulsion, Chassis Material, Payload, Component, Software, and Communication), Hull Type (Catamaran (Twin Hulls), Kayak (Single Hull), Trimaran (Triple Hulls), and Rigid Inflatable Hull), Size (Medium (4 to 8 M), Small (Less than 4 M), Large (8 to 12 M), and Extra-Large (Above 12 M)). |
|
Countries Covered |
China, Japan, India, South Korea, Singapore, Malaysia, Australia, Thailand, Indonesia, Philippines, Rest of Asia-Pacific (APAC). |
|
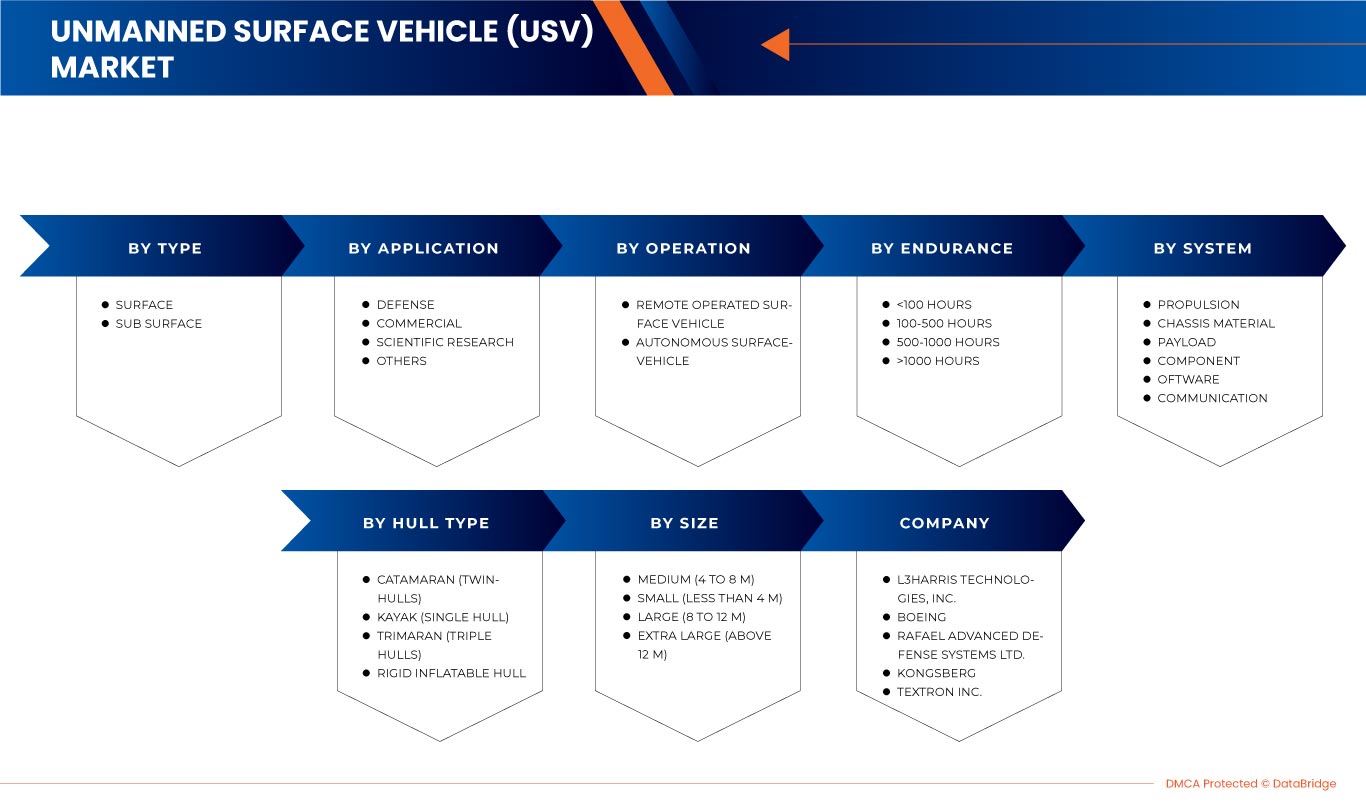
Market Players Covered |
Elbit Systems Ltd., Rafael Advanced Defense Systems Ltd., Boeing, Saildrone, Inc., Deep Ocean Engineering, Inc., Zhuhai Yunzhou Intelligent Technology Co., Ltd., KONGSBERG, L3Harris Tecnologies, Inc., OCIUS, ATLAS ELEKTRONIK GmbH, Clearpath Robotics Inc., Teledyne Technologies Incorporated, Textron Inc., ECA GROUP, and iXblue SAS among others.
|
Market Definition
The unmanned surface vehicle (USV) is a water-borne vessel that can operate without the requirement of human onboard operators. They can be either remotely operated by an operator or are pre-programmed to be able to run on their own. It is usually powered by rapidly rechargeable lithium-ion batteries or solar energy and is mainly used for ocean exploration and maritime purposes.
The unmanned surface vehicle offers various advantages, which can be used for different kinds of applications such as commercial and research, defense purposes, search and rescue, and many more. Its adoption is steadily growing across various industry verticals, such as aquaculture, and has a huge potential to be an ideal vehicle that can be used for disaster management purposes.
Asia-Pacific Unmanned Surface Vehicle (USV) Market Dynamics
This section deals with understanding the market drivers, advantages, opportunities, restraints, and challenges. All of this is discussed in detail as below:
Drivers
- Increasing demand for unmanned vehicles for cleaning oceans
Marine pollution, or the contamination of oceans, has been growing over the years. Moreover, about 75% of Earth's surface has been covered by water, of which 97.5% is occupied by the ocean and 2.5% by fresh water. The rapidly increasing population has led to a growing need for fresh water for drinking and other purposes.
Although, the growth in industrialization and Asia-Pacific has led to a surge in water pollution. A huge amount of plastic waste is being deployed in the ocean which is contaminating the water. In addition, the history of oil and gas exploration and transportation has witnessed several oil spills which have destroyed the aquatic life and quality of water. Along with this, chemical contamination is concerning for health, environmental, and economic reasons which have led to the demand for cleaning such water resources.
- Increasing asymmetric threats and use of unmanned surface vehicle (USV) in defense
Unmanned surface vehicles are being revolutionized for naval purposes for the past few years. These vehicles have been evolving from tools to carry out many tasks to systems capable of operating with a high degree of autonomy. Moreover, most countries are facing asymmetric warfare because of different strategies framed by different defense departments.
However, asymmetric warfare can describe conflicts. Such conflicts often involve strategies and tactics of unconventional warfare. The resources of asymmetric threats can be referred to as the attack by individuals, organizations, or nations to target any government, military or some valuable asset in order to acquire the asset or destroy the state. These attacks need to be continuously monitored by countries in order to protect them from any form of attack or any other type of applications such as illegal drug trafficking, air crash, maritime search investigations, payload delivery, and many others.
Opportunities
- Growing demand for USV for disaster management
Disasters, whether natural or man-made, have ruthless consequences for human lives, environments, and also artificial constructions. Man-made disasters can range from oil spills to heavy metals to forest fires, namely the deep water horizon oil spill (2010), Chernobyl disaster (1986), and the California wildfires (2018) among others.
The awareness has been growing regarding disasters over the years, and even though the ground, aerial and underwater robots have been used for disaster management (DM), surface vehicles are only starting to gain popularity. Although they are predominantly used for search and rescue purposes, they can be used for the detection of crustal deformation with the help of onboard seismometers and other seaboard pressure sensors.
Restraints/Challenges
- Lack of collision detection capability of unmanned surface vehicle (USV)
The usage of unmanned surface vehicle (USV) is increasing with its wide range of commercial, military, and research applications. These vehicles can work on their own and be fully autonomous, or an operator can control them to navigate their course and control their functioning.
Autonomous vehicles are facing the technological complexity of collision detection. As these vehicles can easily collide with any other marine vehicle, the lack of any proper collision system in the vehicle is acting as a major restraint for the market.
- Increasing investments by governments and private players
More than half a century ago, wars were fought by show of force as countries focused on full-force attacks. However, as times progressed and technologies advanced, various economies developed simultaneously, and they relied more on other factors like reconnaissance and surveillance. Thus, Asia-Pacific leaders have shifted their focus to Autonomous Surface Vehicles (ASV) to make them more efficient. They can be generally used to accompany large warships and battleships as well as detect underwater mines and traps.
It is becoming essential to increase investment in unmanned platforms with an impenetrable command network. USVs have the potential to become the centerpiece for various maritime operations. This is further propelled by rising skirmishes between various economies resulting in trade wars, illegal land captures, and surveillance. As a result, rising investments by Asia-Pacific naval forces to strengthen their capability, as well as investments by private entities is the factor that will create an opportunity for growth of the market.
Post-COVID-19 Impact on Asia-Pacific Unmanned Surface Vehicle (USV) Market
COVID-19 created a negative impact on the unmanned surface vehicle (USV) market owing to the rapid shutdown of manufacturing facilities across all industries.
The COVID-19 pandemic has impacted the unmanned surface vehicle (USV) market to an extent in a negative manner. Increasing adoption of USVs for ocean mapping has helped the market to grow after the pandemic. Also, it is expected that there will be considerable sectoral growth in the near future.
Manufacturers and solution providers are making various strategic decisions to enhance their offerings in the post-COVID-19 scenario. The players are conducting multiple research and development activities to improve the technology involved in the unmanned surface vehicle (USV). With this, the companies will bring advanced technologies to the market.
Recent Development
- In October 2022, ECA GROUP designed Critical Design Review to promote autonomous robotic systems in the 3rd generation MCM program. This product has helped the company to expand its product portfolio and enhance the offerings to the customers
- In April 2019, KONGSBERG launched a brand-new unmanned surface vehicle (USV) and sounder USV System. The sounder USV system is a multipurpose platform that was designed to work across different market segments, including surveys. This has helped the company to enhance its product offerings and to grow in the market
Asia-Pacific Unmanned Surface Vehicle (USV) Market Scope
Asia-Pacific unmanned surface vehicle (USV) market is segmented into six notable segments, which are based on type, application, endurance, operation, system, hull type, and size. The growth amongst these segments will help you analyze meager growth segments in the industries and provide the users with a valuable market overview and market insights to help them make strategic decisions for identifying core market applications.
Type
- Surface
- Sub-Surface
On the basis of type, the Asia-Pacific unmanned surface vehicle (USV) market is segmented into surface and sub-surface.
Application
- Defense
- Commercial
- Scientific Research
- Others
On the basis of application, the Asia-Pacific unmanned surface vehicle (USV) market is segmented into defense, commercial, scientific research, and others.
Endurance
- 100-500 Hours
- <100 Hours
- 500-1000 Hours
- >1000 Hours
On the basis of endurance, the Asia-Pacific unmanned surface vehicle (USV) market is segmented into 100-500 hours, <100 hours, 500-1000 hours, and >1000 hours.
Operation
- Remote Operated Surface Vehicle
- Autonomous Surface Vehicle
On the basis of operation, the Asia-Pacific unmanned surface vehicle (USV) market is segmented into remote operated surface vehicle and autonomous surface vehicle.
System
- Propulsion
- Chassis Material
- Payload
- Component
- Software
- Communication
On the basis of the system, the Asia-Pacific unmanned surface vehicle (USV) market is segmented into propulsion, chassis material, payload, component, software, and communication.
Hull Type
- Catamaran (Twin Hulls)
- Kayak (Single Hull)
- Trimaran (Triple Hulls)
- Rigid Inflatable Hull
On the basis of hull type, the Asia-Pacific unmanned surface vehicle (USV) market is segmented into catamaran (twin hulls), kayak (single hull), trimaran (triple hulls), and rigid inflatable hull.
Size
- Medium (4 to 8 M)
- Small (Less than 4 M)
- Large (8 to 12 M)
- Extra-Large (Above 12 M)
On the basis of size, the Asia-Pacific unmanned surface vehicle (USV) market is segmented into medium (4 to 8 m), small (less than 4 m), large (8 to 12 m), and extra-large (above 12 m).
Asia-Pacific Unmanned Surface Vehicle (USV) Market Regional Analysis/Insights
The Asia-Pacific unmanned surface vehicle (USV) market is analyzed, and market size insights and trends are provided by country, type, application, endurance, operation, system, hull type, and size as referenced above.
The countries covered in the unmanned surface vehicle (USV) market report are China, Japan, India, South Korea, Singapore, Malaysia, Australia, Thailand, Indonesia, Philippines, rest of Asia-Pacific.
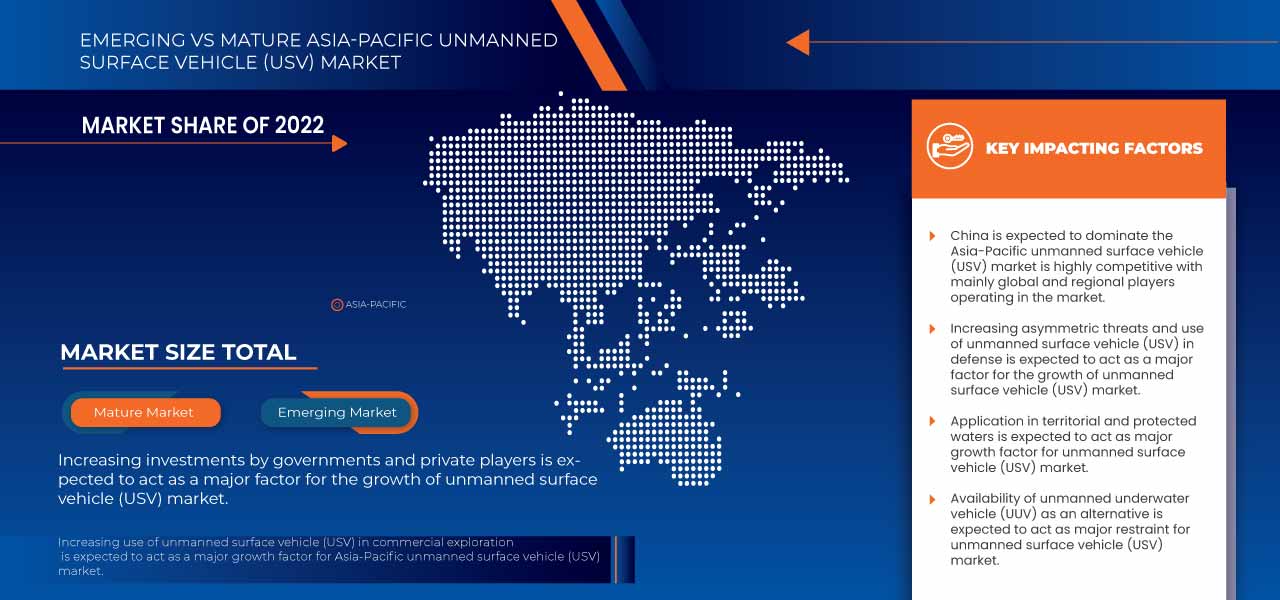
In 2023, China is expected to dominate the Asia-Pacific region due to increasing demand for large USVs for commercial and defense applications such as combat operations, cargo transportation, and others.
The country section of the report also provides individual market impacting factors and changes in market regulation that impact the current and future trends of the market. Data points like downstream and upstream value chain analysis, technical trends and porter's five forces analysis, case studies are some of the pointers used to forecast the market scenario for individual countries. Also, the presence and availability of Asia-Pacific brands and their challenges faced due to large or scarce competition from local and domestic brands, the impact of domestic tariffs and trade routes are considered while providing forecast analysis of the country data.
Competitive Landscape and Asia-Pacific Unmanned Surface Vehicle (USV) Market Share Analysis
Asia-Pacific unmanned surface vehicle (USV) market competitive landscape provides details by competitor. Details included are company overview, company financials, revenue generated, market potential, investment in research and development, new market initiatives, Asia-Pacific presence, production sites and facilities, production capacities, company strengths and weaknesses, product launch, product width and breadth, and application dominance. The above data points provided are only related to the companies' focus related to the unmanned surface vehicle (USV) market.
Some of the major players operating in the Asia-Pacific unmanned surface vehicle (USV) market are Elbit Systems Ltd., Rafael Advanced Defense Systems Ltd., Boeing, Saildrone, Inc., Deep Ocean Engineering, Inc., Zhuhai Yunzhou Intelligent Technology Co., Ltd., KONGSBERG, L3Harris Tecnologies, Inc., OCIUS, ATLAS ELEKTRONIK GmbH, Clearpath Robotics Inc., Teledyne Technologies Incorporated, Textron Inc., ECA GROUP, and iXblue SAS among others.
SKU-
Obtenha acesso online ao relatório sobre a primeira nuvem de inteligência de mercado do mundo

- Painel interativo de análise de dados
- Painel de análise da empresa para oportunidades de elevado potencial de crescimento
- Acesso de analista de pesquisa para personalização e customização. consultas
- Análise da concorrência com painel interativo
- Últimas notícias, atualizações e atualizações Análise de tendências
- Aproveite o poder da análise de benchmark para um rastreio abrangente da concorrência
Índice
1 INTRODUCTION
1.1 OBJECTIVES OF THE STUDY
1.2 MARKET DEFINITION
1.3 OVERVIEW OF ASIA PACIFIC UNMANNED SURFACE VEHICLE (USV) MARKET
1.4 CURRENCY AND PRICING
1.5 LIMITATIONS
1.6 MARKETS COVERED
2 MARKET SEGMENTATION
2.1 MARKETS COVERED
2.2 GEOGRAPHICAL SCOPE
2.3 YEARS CONSIDERED FOR THE STUDY
2.4 DBMR TRIPOD DATA VALIDATION MODEL
2.5 PRIMARY INTERVIEWS WITH KEY OPINION LEADERS
2.6 DBMR MARKET POSITION GRID
2.7 VENDOR SHARE ANALYSIS
2.8 MULTIVARIATE MODELING
2.9 MARKET APPLICATION COVERAGE GRID
2.1 TYPE TIMELINE CURVE
2.11 SECONDARY SOURCES
2.12 ASSUMPTIONS
3 EXECUTIVE SUMMARY
4 PREMIUM INSIGHTS
5 MARKET OVERVIEW
5.1 DRIVERS
5.1.1 INCREASING DEMAND FOR UNMANNED VEHICLES FOR CLEANING OCEAN
5.1.2 INCREASING ASYMMETRIC THREATS AND USE OF UNMANNED SURFACE VEHICLES (USV) IN DEFENSE
5.1.3 INCREASING USE OF UNMANNED SURFACE VEHICLES (USV) IN COMMERCIAL EXPLORATION
5.1.4 INCREASING USE OF UNMANNED SURFACE VEHICLE (USV) FOR OCEANOGRAPHY
5.2 RESTRAINTS
5.2.1 AVAILABILITY OF UNMANNED UNDERWATER VEHICLE (UUV) AS AN ALTERNATIVE
5.2.2 LACK OF COLLISION DETECTION CAPABILITY OF UNMANNED SURFACE VEHICLE (USV)
5.3 OPPORTUNITIES
5.3.1 GROWING DEMAND FOR USV FOR DISASTER MANAGEMENT
5.3.2 APPLICATION IN TERRITORIAL AND PROTECTED WATERS
5.3.3 INCREASING INVESTMENTS BY GOVERNMENTS AND PRIVATE PLAYERS
5.3.4 REAL TIME MONITORING OF AQUACULTURE ENVIRONMENTS
5.4 CHALLENGES
5.4.1 DECREASING NAVY BUDGET OF VARIOUS COUNTRIES
6 ASIA PACIFIC UNMANNED SURFACE VEHICLE (USV) MARKET, BY TYPE
6.1 OVERVIEW
6.2 SURFACE
6.3 SUB-SURFACE
7 ASIA PACIFIC UNMANNED SURFACE VEHICLE (USV) MARKET, BY APPLICATION
7.1 OVERVIEW
7.2 DEFENSE
7.2.1 TYPE
7.2.1.1 SURFACE
7.2.1.2 SUB-SURFACE
7.3 COMMERCIAL
7.3.1 BY PURPOSE
7.3.1.1 OCEANOGRAPHY AND ENVIRONMENTAL SCIENCES
7.3.1.2 PETRÓLEO E GÁS
7.3.1.3 EXPLORAÇÃO
7.3.2 POR TIPO
7.3.2.1 SUPERFÍCIE
7.3.2.2 SUBSUPERFÍCIE
7.4 PESQUISA CIENTÍFICA
7.4.1 TIPO
7.4.1.1 SUPERFÍCIE
7.4.1.2 SUBSUPERFÍCIE
7.5 OUTROS
8 MERCADO DE VEÍCULOS DE SUPERFÍCIE NÃO TRIPULADOS (USV) DA ÁSIA-PACÍFICO, POR RESISTÊNCIA
8.1 VISÃO GERAL
8.2 100-500 HORAS
8,3 <100 HORAS
8.4 500-1000 HORAS
8,5 >1000 HORAS
9 MERCADO DE VEÍCULOS DE SUPERFÍCIE NÃO TRIPULADOS (USV) DA ÁSIA-PACÍFICO, POR OPERAÇÃO
9.1 VISÃO GERAL
9.2 VEÍCULO DE SUPERFÍCIE OPERADO REMOTAMENTE
9.3 VEÍCULO DE SUPERFÍCIE AUTÔNOMO
10 MERCADO DE VEÍCULOS DE SUPERFÍCIE NÃO TRIPULADOS (USV) DA ÁSIA-PACÍFICO, POR SISTEMA
10.1 VISÃO GERAL
10.2 PROPULSÃO
10.3 MATERIAL DO CHASSI
10.4 CARGA ÚTIL
10.5 COMPONENTE
10.6 SOFTWARE
10.7 COMUNICAÇÃO
11 MERCADO DE VEÍCULOS DE SUPERFÍCIE NÃO TRIPULADOS (USV) DA ÁSIA-PACÍFICO, POR TIPO DE CASCO
11.1 VISÃO GERAL
11.2 CATAMARÃ (CASCOS DUPLOS)
11.3 CAIAQUE (CASCO SIMPLES)
11.4 TRIMARAN (CASCOS TRIPLOS)
11.5 CASCO INFLÁVEL RÍGIDO
12 MERCADO DE VEÍCULOS DE SUPERFÍCIE NÃO TRIPULADOS (USV) DA ÁSIA-PACÍFICO, POR TAMANHO
12.1 VISÃO GERAL
12.2 MÉDIO (4 A 8 M)
12.3 PEQUENO (MENOS DE 4 M)
12.4 GRANDE (8 A 12 M)
12,5 EXTRA GRANDE (ACIMA DE 12 M)
13 MERCADO DE VEÍCULOS DE SUPERFÍCIE NÃO TRIPULADOS (USV) DA ÁSIA-PACÍFICO, POR REGIÃO
13.1 ÁSIA-PACÍFICO
13.1.1 CHINA
13.1.2 JAPÃO
13.1.3 ÍNDIA
13.1.4 COREIA DO SUL
13.1.5 AUSTRÁLIA
13.1.6 SINGAPURA
13.1.7 TAILÂNDIA
13.1.8 MALÁSIA
13.1.9 INDONÉSIA
13.1.10 FILIPINAS
13.1.11 RESTANTE DA ÁSIA-PACÍFICO
14 MERCADO DE VEÍCULOS DE SUPERFÍCIE NÃO TRIPULADOS (USV) DA ÁSIA-PACÍFICO: CENÁRIO DA EMPRESA
14.1 ANÁLISE DE AÇÕES DA EMPRESA: ÁSIA-PACÍFICO
15 ANÁLISE SWOT
16 PERFIL DA EMPRESA
16.1 L3HARRIS TECHNOLOGIES, INC.
16.1.1 RESUMO DA EMPRESA
16.1.2 ANÁLISE DE RECEITA
16.1.3 ANÁLISE DAS AÇÕES DA EMPRESA
16.1.4 PORTFÓLIO DE PRODUTOS
16.1.5 DESENVOLVIMENTOS RECENTES
16.2 BOEING
16.2.1 RESUMO DA EMPRESA
16.2.2 ANÁLISE DE RECEITA
16.2.3 ANÁLISE DAS AÇÕES DA EMPRESA
16.2.4 PORTFÓLIO DE PRODUTOS
16.2.5 DESENVOLVIMENTO RECENTE
16.3 RAFAEL SISTEMAS DE DEFESA AVANÇADOS LTDA.
16.3.1 RESUMO DA EMPRESA
16.3.2 ANÁLISE DAS AÇÕES DA EMPRESA
16.3.3 PORTFÓLIO DE PRODUTOS
16.3.4 DESENVOLVIMENTOS RECENTES
16.4 KONGSBERG
16.4.1 RESUMO DA EMPRESA
16.4.2 ANÁLISE DE RECEITA
16.4.3 ANÁLISE DAS AÇÕES DA EMPRESA
16.4.4 PORTFÓLIO DE PRODUTOS
16.4.5 DESENVOLVIMENTOS RECENTES
16.5 TEXTRON, INC.
16.5.1 RESUMO DA EMPRESA
16.5.2 ANÁLISE DE RECEITA
16.5.3 ANÁLISE DAS AÇÕES DA EMPRESA
16.5.4 PORTFÓLIO DE PRODUTOS
16.5.5 DESENVOLVIMENTO RECENTE
16.6 5G MARINHO
16.6.1 RESUMO DA EMPRESA
16.6.2 PORTFÓLIO DE PRODUTOS
16.6.3 DESENVOLVIMENTO RECENTE
16.7 ATLAS ELEKTRONIK GMBH
16.7.1 RESUMO DA EMPRESA
16.7.2 PORTFÓLIO DE SOLUÇÕES
16.7.3 DESENVOLVIMENTO RECENTE
16.8 CLEARPATH ROBOTICS INC.
16.8.1 RESUMO DA EMPRESA
16.8.2 PORTFÓLIO DE PRODUTOS
16.8.3 DESENVOLVIMENTO RECENTE
16.9 ENGENHARIA DE OCEANOS PROFUNDOS, INC.
16.9.1 RESUMO DA EMPRESA
16.9.2 PORTFÓLIO DE PRODUTOS
16.9.3 DESENVOLVIMENTO RECENTE
16.1 GRUPO ECA
16.10.1 RESUMO DA EMPRESA
16.10.2 PORTFÓLIO DE PRODUTOS
16.10.3 DESENVOLVIMENTO RECENTE
16.11 ELBIT SISTEMAS LTDA.
16.11.1 RESUMO DA EMPRESA
16.11.2 ANÁLISE DE RECEITA
16.11.3 PORTFÓLIO DE PRODUTOS
16.11.4 DESENVOLVIMENTOS RECENTES
16.12 IXBLUE SAS
16.12.1 RESUMO DA EMPRESA
16.12.2 PORTFÓLIO DE PRODUTOS
16.12.3 DESENVOLVIMENTO RECENTE
16.13 ROBÓTICA MARÍTIMA AS
16.13.1 RESUMO DA EMPRESA
16.13.2 PORTFÓLIO DE PRODUTOS
16.13.3 DESENVOLVIMENTO RECENTE
16.14 OCIUS
16.14.1 RESUMO DA EMPRESA
16.14.2 PORTFÓLIO DE PRODUTOS
16.14.3 DESENVOLVIMENTO RECENTE
16.15 SAILDRONE, INC.
16.15.1 COMPANY SNAPSHOT
16.15.2 TECHNOLOGY PORTFOLIO
16.15.3 RECENT DEVELOPMENTS
16.16 SEAFLOOR SYSTEMS, INC.
16.16.1 COMPANY SNAPSHOT
16.16.2 PRODUCT PORTFOLIO
16.16.3 RECENT DEVELOPMENTS
16.17 SEAROBOTICS CORPORATION
16.17.1 COMPANY SNAPSHOT
16.17.2 PRODUCT PORTFOLIO
16.17.3 RECENT DEVELOPMENTS
16.18 TELEDYNE TECHNOLOGIES INCORPORATED
16.18.1 COMPANY SNAPSHOT
16.18.2 REVENUE ANALYSIS
16.18.3 PRODUCT PORTFOLIO
16.18.4 RECENT DEVELOPMENTS
16.19 ZHUHAI YUNZHOU INTELLIGENT TECHNOLOGY CO., LTD.
16.19.1 COMPANY SNAPSHOT
16.19.2 PRODUCT PORTFOLIO
16.19.3 RECENT DEVELOPMENT
17 QUESTIONNAIRE
18 RELATED REPORTS
Lista de Tabela
TABELA 1 MERCADO DE VEÍCULOS DE SUPERFÍCIE NÃO TRIPULADOS (USV) DA ÁSIA-PACÍFICO, POR TIPO, 2021-2030 (US$ MILHÕES)
TABELA 2 SUPERFÍCIE ÁSIA-PACÍFICO NO MERCADO DE VEÍCULOS DE SUPERFÍCIE NÃO TRIPULADOS (USV), POR REGIÃO, 2021-2030 (US$ MILHÕES)
TABELA 3 MERCADO DE VEÍCULOS DE SUPERFÍCIE NÃO TRIPULADOS (USV) NA ÁSIA-PACÍFICO, POR REGIÃO, 2021-2030 (US$ MILHÕES)
TABELA 4 MERCADO DE VEÍCULOS DE SUPERFÍCIE NÃO TRIPULADOS (USV) DA ÁSIA-PACÍFICO, POR APLICAÇÃO, 2021-2030 (US$ MILHÕES)
TABELA 5 DEFESA DA ÁSIA-PACÍFICO NO MERCADO DE VEÍCULOS DE SUPERFÍCIE NÃO TRIPULADOS (USV), POR REGIÃO, 2021-2030 (US$ MILHÕES)
TABELA 6 DEFESA DA ÁSIA-PACÍFICO NO MERCADO DE VEÍCULOS DE SUPERFÍCIE NÃO TRIPULADOS (USV), POR TIPO, 2021-2030 (US$ MILHÕES)
TABELA 7 MERCADO DE VEÍCULOS DE SUPERFÍCIE NÃO TRIPULADOS (USV) DA ÁSIA-PACÍFICO, POR REGIÃO, 2021-2030 (US$ MILHÕES)
TABELA 8: MERCADO DE VEÍCULOS DE SUPERFÍCIE NÃO TRIPULADOS (USV) DA ÁSIA-PACÍFICO, POR FINALIDADE, 2021-2030 (US$ MILHÕES)
TABELA 9: MERCADO DE VEÍCULOS DE SUPERFÍCIE NÃO TRIPULADOS (USV) DA ÁSIA-PACÍFICO, POR TIPO, 2021-2030 (US$ MILHÕES)
TABELA 10 PESQUISA CIENTÍFICA DA ÁSIA-PACÍFICO NO MERCADO DE VEÍCULOS DE SUPERFÍCIE NÃO TRIPULADOS (USV), POR REGIÃO, 2021-2030 (US$ MILHÕES)
TABELA 11 PESQUISA CIENTÍFICA DA ÁSIA-PACÍFICO NO MERCADO DE VEÍCULOS DE SUPERFÍCIE NÃO TRIPULADOS (USV), POR TIPO, 2021-2030 (US$ MILHÕES)
TABELA 12 ÁSIA-PACÍFICO OUTROS NO MERCADO DE VEÍCULOS DE SUPERFÍCIE NÃO TRIPULADOS (USV), POR REGIÃO, 2021-2030 (US$ MILHÕES)
TABELA 13 MERCADO DE VEÍCULOS DE SUPERFÍCIE NÃO TRIPULADOS (USV) DA ÁSIA-PACÍFICO, POR RESISTÊNCIA, 2021-2030 (US$ MILHÕES)
TABELA 14 ÁSIA-PACÍFICO 100-500 HORAS NO MERCADO DE VEÍCULOS DE SUPERFÍCIE NÃO TRIPULADOS (USV), POR REGIÃO, 2021-2030 (US$ MILHÕES)
TABELA 15 ÁSIA-PACÍFICO <100 HORAS NO MERCADO DE VEÍCULOS DE SUPERFÍCIE NÃO TRIPULADOS (USV), POR REGIÃO, 2021-2030 (US$ MILHÕES)
TABELA 16 ÁSIA-PACÍFICO 500-1000 HORAS NO MERCADO DE VEÍCULOS DE SUPERFÍCIE NÃO TRIPULADOS (USV), POR REGIÃO, 2021-2030 (US$ MILHÕES)
TABELA 17 ÁSIA-PACÍFICO >1000 HORAS NO MERCADO DE VEÍCULOS DE SUPERFÍCIE NÃO TRIPULADOS (USV), POR REGIÃO, 2021-2030 (US$ MILHÕES)
TABELA 18 MERCADO DE VEÍCULOS DE SUPERFÍCIE NÃO TRIPULADOS (USV) DA ÁSIA-PACÍFICO, POR OPERAÇÃO, 2021-2030 (US$ MILHÕES)
TABELA 19 VEÍCULOS DE SUPERFÍCIE OPERADOS REMOTAMENTE NA ÁSIA-PACÍFICO NO MERCADO DE VEÍCULOS DE SUPERFÍCIE NÃO TRIPULADOS (USV), POR REGIÃO, 2021-2030 (US$ MILHÕES)
TABELA 20 VEÍCULOS DE SUPERFÍCIE AUTÔNOMOS DA ÁSIA-PACÍFICO NO MERCADO DE VEÍCULOS DE SUPERFÍCIE NÃO TRIPULADOS (USV), POR REGIÃO, 2021-2030 (US$ MILHÕES)
TABELA 21 MERCADO DE VEÍCULOS DE SUPERFÍCIE NÃO TRIPULADOS (USV) DA ÁSIA-PACÍFICO, POR SISTEMA, 2021-2030 (US$ MILHÕES)
TABELA 22 PROPULSÃO DA ÁSIA-PACÍFICO NO MERCADO DE VEÍCULOS DE SUPERFÍCIE NÃO TRIPULADOS (USV), POR REGIÃO, 2021-2030 (US$ MILHÕES)
TABELA 23 MATERIAL DE CHASSI DA ÁSIA-PACÍFICO NO MERCADO DE VEÍCULOS DE SUPERFÍCIE NÃO TRIPULADOS (USV), POR REGIÃO, 2021-2030 (US$ MILHÕES)
TABELA 24 CARGA ÚTIL DA ÁSIA-PACÍFICO NO MERCADO DE VEÍCULOS DE SUPERFÍCIE NÃO TRIPULADOS (USV), POR REGIÃO, 2021-2030 (US$ MILHÕES)
TABELA 25 COMPONENTES DA ÁSIA-PACÍFICO NO MERCADO DE VEÍCULOS DE SUPERFÍCIE NÃO TRIPULADOS (USV), POR REGIÃO, 2021-2030 (US$ MILHÕES)
TABELA 26 SOFTWARE DA ÁSIA-PACÍFICO NO MERCADO DE VEÍCULOS DE SUPERFÍCIE NÃO TRIPULADOS (USV), POR REGIÃO, 2021-2030 (US$ MILHÕES)
TABELA 27 COMUNICAÇÃO NA ÁSIA-PACÍFICO NO MERCADO DE VEÍCULOS DE SUPERFÍCIE NÃO TRIPULADOS (USV), POR REGIÃO, 2021-2030 (US$ MILHÕES)
TABELA 28 MERCADO DE VEÍCULOS DE SUPERFÍCIE NÃO TRIPULADOS (USV) DA ÁSIA-PACÍFICO, POR TIPO DE CASCO, 2021-2030 (US$ MILHÕES)
TABELA 29 CATAMARÃS DA ÁSIA-PACÍFICO (CASCOS DUPLOS) NO MERCADO DE VEÍCULOS DE SUPERFÍCIE NÃO TRIPULADOS (USV), POR REGIÃO, 2021-2030 (US$ MILHÕES)
TABELA 30 CAIAQUES DA ÁSIA-PACÍFICO (CASCO SIMPLES) NO MERCADO DE VEÍCULOS DE SUPERFÍCIE NÃO TRIPULADOS (USV), POR REGIÃO, 2021-2030 (US$ MILHÕES)
TABELA 31 TRIMARAN DA ÁSIA-PACÍFICO (CASCOS TRIPLOS) NO MERCADO DE VEÍCULOS DE SUPERFÍCIE NÃO TRIPULADOS (USV), POR REGIÃO, 2021-2030 (US$ MILHÕES)
TABELA 32 CASCO RÍGIDO INFLÁVEL DA ÁSIA-PACÍFICO NO MERCADO DE VEÍCULOS DE SUPERFÍCIE NÃO TRIPULADOS (USV), POR REGIÃO, 2021-2030 (US$ MILHÕES)
TABELA 33 MERCADO DE VEÍCULOS DE SUPERFÍCIE NÃO TRIPULADOS (USV) DA ÁSIA-PACÍFICO, POR TAMANHO, 2021-2030 (US$ MILHÕES)
TABELA 34 SEGMENTO MÉDIO DA ÁSIA-PACÍFICO (4 A 8 M) NO MERCADO DE VEÍCULOS DE SUPERFÍCIE NÃO TRIPULADOS (USV), POR REGIÃO, 2021-2030 (US$ MILHÕES)
TABELA 35 MERCADO DE VEÍCULOS DE SUPERFÍCIE NÃO TRIPULADOS (USV) DA ÁSIA-PACÍFICO, PEQUENOS (MENOS DE 4 M), POR REGIÃO, 2021-2030 (US$ MILHÕES)
TABELA 36 ÁSIA-PACÍFICO GRANDE (8 A 12 M) NO MERCADO DE VEÍCULOS DE SUPERFÍCIE NÃO TRIPULADOS (USV), POR REGIÃO, 2021-2030 (US$ MILHÕES)
TABELA 37 ÁSIA-PACÍFICO EXTRA GRANDE (ACIMA DE 12 M) NO MERCADO DE VEÍCULOS DE SUPERFÍCIE NÃO TRIPULADOS (USV), POR REGIÃO, 2021-2030 (US$ MILHÕES)
TABELA 38 MERCADO DE VEÍCULOS SUBAQUÁTICOS NÃO TRIPULADOS DA ÁSIA-PACÍFICO, POR PAÍS, 2021-2030 (US$ MILHÕES)
TABELA 39 MERCADO DE VEÍCULOS DE SUPERFÍCIE NÃO TRIPULADOS (USV) DA ÁSIA-PACÍFICO, POR TIPO, 2021-2030 (US$ MILHÕES)
TABELA 40 MERCADO DE VEÍCULOS DE SUPERFÍCIE NÃO TRIPULADOS (USV) DA ÁSIA-PACÍFICO, POR APLICAÇÃO, 2021-2030 (US$ MILHÕES)
TABELA 41 DEFESA DA ÁSIA-PACÍFICO NO MERCADO DE VEÍCULOS DE SUPERFÍCIE NÃO TRIPULADOS (USV), POR TIPO, 2021-2030 (US$ MILHÕES)
TABELA 42 MERCADO DE VEÍCULOS DE SUPERFÍCIE NÃO TRIPULADOS (USV) DA ÁSIA-PACÍFICO, POR FINALIDADE, 2021-2030 (US$ MILHÕES)
TABELA 43 MERCADO DE VEÍCULOS DE SUPERFÍCIE NÃO TRIPULADOS (USV) DA ÁSIA-PACÍFICO, POR TIPO, 2021-2030 (US$ MILHÕES)
TABELA 44 PESQUISA CIENTÍFICA DA ÁSIA-PACÍFICO NO MERCADO DE VEÍCULOS DE SUPERFÍCIE NÃO TRIPULADOS (USV), POR TIPO, 2021-2030 (US$ MILHÕES)
TABELA 45 MERCADO DE VEÍCULOS DE SUPERFÍCIE NÃO TRIPULADOS (USV) DA ÁSIA-PACÍFICO, POR RESISTÊNCIA, 2021-2030 (US$ MILHÕES)
TABELA 46 MERCADO DE VEÍCULOS DE SUPERFÍCIE NÃO TRIPULADOS (USV) DA ÁSIA-PACÍFICO, POR OPERAÇÃO, 2021-2030 (US$ MILHÕES)
TABELA 47 MERCADO DE VEÍCULOS DE SUPERFÍCIE NÃO TRIPULADOS (USV) DA ÁSIA-PACÍFICO, POR SISTEMA, 2021-2030 (US$ MILHÕES)
TABELA 48 MERCADO DE VEÍCULOS DE SUPERFÍCIE NÃO TRIPULADOS (USV) DA ÁSIA-PACÍFICO, POR TIPO DE CASCO, 2021-2030 (US$ MILHÕES)
TABELA 49 MERCADO DE VEÍCULOS DE SUPERFÍCIE NÃO TRIPULADOS (USV) DA ÁSIA-PACÍFICO, POR TAMANHO (COMPRIMENTO EM METROS), 2021-2030 (US$ MILHÕES)
TABELA 50 MERCADO DE VEÍCULOS DE SUPERFÍCIE NÃO TRIPULADOS (USV) DA CHINA, POR TIPO, 2021-2030 (US$ MILHÕES)
TABELA 51 MERCADO DE VEÍCULOS DE SUPERFÍCIE NÃO TRIPULADOS (USV) DA CHINA, POR APLICAÇÃO, 2021-2030 (US$ MILHÕES)
TABELA 52 DEFESA DA CHINA NO MERCADO DE VEÍCULOS DE SUPERFÍCIE NÃO TRIPULADOS (USV), POR TIPO, 2021-2030 (US$ MILHÕES)
TABELA 53 MERCADO DE VEÍCULOS DE SUPERFÍCIE NÃO TRIPULADOS (USV) DA CHINA, POR FINALIDADE, 2021-2030 (US$ MILHÕES)
TABELA 54 MERCADO DE VEÍCULOS DE SUPERFÍCIE NÃO TRIPULADOS (USV) DA CHINA, POR TIPO, 2021-2030 (US$ MILHÕES)
TABELA 55 PESQUISA CIENTÍFICA DA CHINA NO MERCADO DE VEÍCULOS DE SUPERFÍCIE NÃO TRIPULADOS (USV), POR TIPO, 2021-2030 (US$ MILHÕES)
TABELA 56 MERCADO DE VEÍCULOS DE SUPERFÍCIE NÃO TRIPULADOS (USV) DA CHINA, POR RESISTÊNCIA, 2021-2030 (US$ MILHÕES)
TABELA 57 MERCADO DE VEÍCULOS DE SUPERFÍCIE NÃO TRIPULADOS (USV) DA CHINA, POR OPERAÇÃO, 2021-2030 (US$ MILHÕES)
TABELA 58 MERCADO DE VEÍCULOS DE SUPERFÍCIE NÃO TRIPULADOS (USV) DA CHINA, POR SISTEMA, 2021-2030 (US$ MILHÕES)
TABELA 59 MERCADO DE VEÍCULOS DE SUPERFÍCIE NÃO TRIPULADOS (USV) DA CHINA, POR TIPO DE CASCO, 2021-2030 (US$ MILHÕES)
TABELA 60 MERCADO DE VEÍCULOS DE SUPERFÍCIE NÃO TRIPULADOS (USV) DA CHINA, POR TAMANHO (COMPRIMENTO EM METROS), 2021-2030 (US$ MILHÕES)
TABELA 61 MERCADO DE VEÍCULOS DE SUPERFÍCIE NÃO TRIPULADOS (USV) DO JAPÃO, POR TIPO, 2021-2030 (US$ MILHÕES)
TABELA 62 MERCADO DE VEÍCULOS DE SUPERFÍCIE NÃO TRIPULADOS (USV) DO JAPÃO, POR APLICAÇÃO, 2021-2030 (US$ MILHÕES)
TABELA 63 DEFESA DO JAPÃO NO MERCADO DE VEÍCULOS DE SUPERFÍCIE NÃO TRIPULADOS (USV), POR TIPO, 2021-2030 (US$ MILHÕES)
TABELA 64 MERCADO DE VEÍCULOS DE SUPERFÍCIE NÃO TRIPULADOS (USV) DO JAPÃO, POR FINALIDADE, 2021-2030 (US$ MILHÕES)
TABELA 65 MERCADO DE VEÍCULOS DE SUPERFÍCIE NÃO TRIPULADOS (USV) DO JAPÃO, POR TIPO, 2021-2030 (US$ MILHÕES)
TABELA 66 PESQUISA CIENTÍFICA DO JAPÃO NO MERCADO DE VEÍCULOS DE SUPERFÍCIE NÃO TRIPULADOS (USV), POR TIPO, 2021-2030 (US$ MILHÕES)
TABELA 67 MERCADO DE VEÍCULOS DE SUPERFÍCIE NÃO TRIPULADOS (USV) DO JAPÃO, POR RESISTÊNCIA, 2021-2030 (US$ MILHÕES)
TABELA 68 MERCADO DE VEÍCULOS DE SUPERFÍCIE NÃO TRIPULADOS (USV) DO JAPÃO, POR OPERAÇÃO, 2021-2030 (US$ MILHÕES)
TABELA 69 MERCADO DE VEÍCULOS DE SUPERFÍCIE NÃO TRIPULADOS (USV) DO JAPÃO, POR SISTEMA, 2021-2030 (US$ MILHÕES)
TABELA 70 MERCADO DE VEÍCULOS DE SUPERFÍCIE NÃO TRIPULADOS (USV) DO JAPÃO, POR TIPO DE CASCO, 2021-2030 (US$ MILHÕES)
TABELA 71 MERCADO DE VEÍCULOS DE SUPERFÍCIE NÃO TRIPULADOS (USV) DO JAPÃO, POR TAMANHO (COMPRIMENTO EM METROS), 2021-2030 (US$ MILHÕES)
TABELA 72 MERCADO DE VEÍCULOS DE SUPERFÍCIE NÃO TRIPULADOS (USV) DA ÍNDIA, POR TIPO, 2021-2030 (US$ MILHÕES)
TABELA 73 MERCADO DE VEÍCULOS DE SUPERFÍCIE NÃO TRIPULADOS (USV) DA ÍNDIA, POR APLICAÇÃO, 2021-2030 (US$ MILHÕES)
TABELA 74 MERCADO DE DEFESA DA ÍNDIA NO MERCADO DE VEÍCULOS DE SUPERFÍCIE NÃO TRIPULADOS (USV), POR TIPO, 2021-2030 (US$ MILHÕES)
TABELA 75 INDIA COMERCIAL NO MERCADO DE VEÍCULOS DE SUPERFÍCIE NÃO TRIPULADOS (USV), POR FINALIDADE, 2021-2030 (US$ MILHÕES)
TABELA 76 INDIA COMERCIAL NO MERCADO DE VEÍCULOS DE SUPERFÍCIE NÃO TRIPULADOS (USV), POR TIPO, 2021-2030 (US$ MILHÕES)
TABELA 77 PESQUISA CIENTÍFICA DA ÍNDIA NO MERCADO DE VEÍCULOS DE SUPERFÍCIE NÃO TRIPULADOS (USV), POR TIPO, 2021-2030 (US$ MILHÕES)
TABELA 78 MERCADO DE VEÍCULOS DE SUPERFÍCIE NÃO TRIPULADOS (USV) DA ÍNDIA, POR RESISTÊNCIA, 2021-2030 (US$ MILHÕES)
TABELA 79 MERCADO DE VEÍCULOS DE SUPERFÍCIE NÃO TRIPULADOS (USV) DA ÍNDIA, POR OPERAÇÃO, 2021-2030 (US$ MILHÕES)
TABELA 80 MERCADO DE VEÍCULOS DE SUPERFÍCIE NÃO TRIPULADOS (USV) DA ÍNDIA, POR SISTEMA, 2021-2030 (US$ MILHÕES)
TABELA 81 MERCADO DE VEÍCULOS DE SUPERFÍCIE NÃO TRIPULADOS (USV) DA ÍNDIA, POR TIPO DE CASCO, 2021-2030 (US$ MILHÕES)
TABELA 82 MERCADO DE VEÍCULOS DE SUPERFÍCIE NÃO TRIPULADOS (USV) DA ÍNDIA, POR TAMANHO (COMPRIMENTO EM METROS), 2021-2030 (US$ MILHÕES)
TABELA 83 MERCADO DE VEÍCULOS DE SUPERFÍCIE NÃO TRIPULADOS (USV) DA COREIA DO SUL, POR TIPO, 2021-2030 (US$ MILHÕES)
TABELA 84 MERCADO DE VEÍCULOS DE SUPERFÍCIE NÃO TRIPULADOS (USV) DA COREIA DO SUL, POR APLICAÇÃO, 2021-2030 (US$ MILHÕES)
TABELA 85 DEFESA DA COREIA DO SUL NO MERCADO DE VEÍCULOS DE SUPERFÍCIE NÃO TRIPULADOS (USV), POR TIPO, 2021-2030 (US$ MILHÕES)
TABELA 86 COREIA DO SUL COMERCIAL NO MERCADO DE VEÍCULOS DE SUPERFÍCIE NÃO TRIPULADOS (USV), POR FINALIDADE, 2021-2030 (US$ MILHÕES)
TABLE 87 SOUTH KOREA COMMERCIAL IN UNMANNED SURFACE VEHICLE (USV) MARKET, BY TYPE, 2021-2030 (USD MILLION)
TABLE 88 SOUTH KOREA SCIENTIFIC RESEARCH IN UNMANNED SURFACE VEHICLE (USV) MARKET, BY TYPE, 2021-2030 (USD MILLION)
TABLE 89 SOUTH KOREA UNMANNED SURFACE VEHICLE (USV) MARKET, BY ENDURANCE, 2021-2030 (USD MILLION)
TABLE 90 SOUTH KOREA UNMANNED SURFACE VEHICLE (USV) MARKET, BY OPERATION, 2021-2030 (USD MILLION)
TABLE 91 SOUTH KOREA UNMANNED SURFACE VEHICLE (USV) MARKET, BY SYSTEM, 2021-2030 (USD MILLION)
TABLE 92 SOUTH KOREA UNMANNED SURFACE VEHICLE (USV) MARKET, BY HULL TYPE, 2021-2030 (USD MILLION)
TABLE 93 SOUTH KOREA UNMANNED SURFACE VEHICLE (USV) MARKET, BY SIZE (LENGTH IN METERS), 2021-2030 (USD MILLION)
TABLE 94 AUSTRALIA UNMANNED SURFACE VEHICLE (USV) MARKET, BY TYPE, 2021-2030 (USD MILLION)
TABLE 95 AUSTRALIA UNMANNED SURFACE VEHICLE (USV) MARKET, BY APPLICATION, 2021-2030 (USD MILLION)
TABLE 96 AUSTRALIA DEFENSE IN UNMANNED SURFACE VEHICLE (USV) MARKET, BY TYPE, 2021-2030 (USD MILLION)
TABLE 97 AUSTRALIA COMMERCIAL IN UNMANNED SURFACE VEHICLE (USV) MARKET, BY PURPOSE, 2021-2030 (USD MILLION)
TABLE 98 AUSTRALIA COMMERCIAL IN UNMANNED SURFACE VEHICLE (USV) MARKET, BY TYPE, 2021-2030 (USD MILLION)
TABLE 99 AUSTRALIA SCIENTIFIC RESEARCH IN UNMANNED SURFACE VEHICLE (USV) MARKET, BY TYPE, 2021-2030 (USD MILLION)
TABLE 100 AUSTRALIA UNMANNED SURFACE VEHICLE (USV) MARKET, BY ENDURANCE, 2021-2030 (USD MILLION)
TABLE 101 AUSTRALIA UNMANNED SURFACE VEHICLE (USV) MARKET, BY OPERATION, 2021-2030 (USD MILLION)
TABLE 102 AUSTRALIA UNMANNED SURFACE VEHICLE (USV) MARKET, BY SYSTEM, 2021-2030 (USD MILLION)
TABLE 103 AUSTRALIA UNMANNED SURFACE VEHICLE (USV) MARKET, BY HULL TYPE, 2021-2030 (USD MILLION)
TABLE 104 AUSTRALIA UNMANNED SURFACE VEHICLE (USV) MARKET, BY SIZE (LENGTH IN METERS), 2021-2030 (USD MILLION)
TABLE 105 SINGAPORE UNMANNED SURFACE VEHICLE (USV) MARKET, BY TYPE, 2021-2030 (USD MILLION)
TABLE 106 SINGAPORE UNMANNED SURFACE VEHICLE (USV) MARKET, BY APPLICATION, 2021-2030 (USD MILLION)
TABLE 107 SINGAPORE DEFENSE IN UNMANNED SURFACE VEHICLE (USV) MARKET, BY TYPE, 2021-2030 (USD MILLION)
TABLE 108 SINGAPORE COMMERCIAL IN UNMANNED SURFACE VEHICLE (USV) MARKET, BY PURPOSE, 2021-2030 (USD MILLION)
TABLE 109 SINGAPORE COMMERCIAL IN UNMANNED SURFACE VEHICLE (USV) MARKET, BY TYPE, 2021-2030 (USD MILLION)
TABLE 110 SINGAPORE SCIENTIFIC RESEARCH IN UNMANNED SURFACE VEHICLE (USV) MARKET, BY TYPE, 2021-2030 (USD MILLION)
TABLE 111 SINGAPORE UNMANNED SURFACE VEHICLE (USV) MARKET, BY ENDURANCE, 2021-2030 (USD MILLION)
TABLE 112 SINGAPORE UNMANNED SURFACE VEHICLE (USV) MARKET, BY OPERATION, 2021-2030 (USD MILLION)
TABLE 113 SINGAPORE UNMANNED SURFACE VEHICLE (USV) MARKET, BY SYSTEM, 2021-2030 (USD MILLION)
TABLE 114 SINGAPORE UNMANNED SURFACE VEHICLE (USV) MARKET, BY HULL TYPE, 2021-2030 (USD MILLION)
TABLE 115 SINGAPORE UNMANNED SURFACE VEHICLE (USV) MARKET, BY SIZE (LENGTH IN METERS), 2021-2030 (USD MILLION)
TABELA 116 MERCADO DE VEÍCULOS DE SUPERFÍCIE NÃO TRIPULADOS (USV) DA TAILÂNDIA, POR TIPO, 2021-2030 (US$ MILHÕES)
TABELA 117 MERCADO DE VEÍCULOS DE SUPERFÍCIE NÃO TRIPULADOS (USV) DA TAILÂNDIA, POR APLICAÇÃO, 2021-2030 (US$ MILHÕES)
TABELA 118 DEFESA DA TAILÂNDIA NO MERCADO DE VEÍCULOS DE SUPERFÍCIE NÃO TRIPULADOS (USV), POR TIPO, 2021-2030 (US$ MILHÕES)
TABELA 119 TAILÂNDIA COMERCIAL NO MERCADO DE VEÍCULOS DE SUPERFÍCIE NÃO TRIPULADOS (USV), POR FINALIDADE, 2021-2030 (US$ MILHÕES)
TABELA 120 MERCADO DE VEÍCULOS DE SUPERFÍCIE NÃO TRIPULADOS (USV) DA TAILÂNDIA, POR TIPO, 2021-2030 (US$ MILHÕES)
TABELA 121 PESQUISA CIENTÍFICA DA TAILÂNDIA NO MERCADO DE VEÍCULOS DE SUPERFÍCIE NÃO TRIPULADOS (USV), POR TIPO, 2021-2030 (US$ MILHÕES)
TABELA 122 MERCADO DE VEÍCULOS DE SUPERFÍCIE NÃO TRIPULADOS (USV) DA TAILÂNDIA, POR RESISTÊNCIA, 2021-2030 (US$ MILHÕES)
TABELA 123 MERCADO DE VEÍCULOS DE SUPERFÍCIE NÃO TRIPULADOS (USV) DA TAILÂNDIA, POR OPERAÇÃO, 2021-2030 (US$ MILHÕES)
TABELA 124 MERCADO DE VEÍCULOS DE SUPERFÍCIE NÃO TRIPULADOS (USV) DA TAILÂNDIA, POR SISTEMA, 2021-2030 (US$ MILHÕES)
TABELA 125 MERCADO DE VEÍCULOS DE SUPERFÍCIE NÃO TRIPULADOS (USV) DA TAILÂNDIA, POR TIPO DE CASCO, 2021-2030 (US$ MILHÕES)
TABELA 126 MERCADO DE VEÍCULOS DE SUPERFÍCIE NÃO TRIPULADOS (USV) DA TAILÂNDIA, POR TAMANHO (COMPRIMENTO EM METROS), 2021-2030 (US$ MILHÕES)
TABELA 127 MERCADO DE VEÍCULOS DE SUPERFÍCIE NÃO TRIPULADOS (USV) DA MALÁSIA, POR TIPO, 2021-2030 (US$ MILHÕES)
TABELA 128 MERCADO DE VEÍCULOS DE SUPERFÍCIE NÃO TRIPULADOS (USV) DA MALÁSIA, POR APLICAÇÃO, 2021-2030 (US$ MILHÕES)
TABELA 129 MERCADO DE DEFESA DA MALÁSIA NO MERCADO DE VEÍCULOS DE SUPERFÍCIE NÃO TRIPULADOS (USV), POR TIPO, 2021-2030 (US$ MILHÕES)
TABELA 130 MERCADO DE VEÍCULOS DE SUPERFÍCIE NÃO TRIPULADOS (USV) DA MALÁSIA, POR FINALIDADE, 2021-2030 (US$ MILHÕES)
TABELA 131 MERCADO DE VEÍCULOS DE SUPERFÍCIE NÃO TRIPULADOS (USV) DA MALÁSIA, POR TIPO, 2021-2030 (US$ MILHÕES)
TABELA 132 PESQUISA CIENTÍFICA DA MALÁSIA NO MERCADO DE VEÍCULOS DE SUPERFÍCIE NÃO TRIPULADOS (USV), POR TIPO, 2021-2030 (US$ MILHÕES)
TABELA 133 MERCADO DE VEÍCULOS DE SUPERFÍCIE NÃO TRIPULADOS (USV) DA MALÁSIA, POR RESISTÊNCIA, 2021-2030 (US$ MILHÕES)
TABELA 134 MERCADO DE VEÍCULOS DE SUPERFÍCIE NÃO TRIPULADOS (USV) DA MALÁSIA, POR OPERAÇÃO, 2021-2030 (US$ MILHÕES)
TABELA 135 MERCADO DE VEÍCULOS DE SUPERFÍCIE NÃO TRIPULADOS (USV) DA MALÁSIA, POR SISTEMA, 2021-2030 (US$ MILHÕES)
TABELA 136 MERCADO DE VEÍCULOS DE SUPERFÍCIE NÃO TRIPULADOS (USV) DA MALÁSIA, POR TIPO DE CASCO, 2021-2030 (US$ MILHÕES)
TABELA 137 MERCADO DE VEÍCULOS DE SUPERFÍCIE NÃO TRIPULADOS (USV) DA MALÁSIA, POR TAMANHO (COMPRIMENTO EM METROS), 2021-2030 (US$ MILHÕES)
TABELA 138 MERCADO DE VEÍCULOS DE SUPERFÍCIE NÃO TRIPULADOS (USV) DA INDONÉSIA, POR TIPO, 2021-2030 (US$ MILHÕES)
TABELA 139 MERCADO DE VEÍCULOS DE SUPERFÍCIE NÃO TRIPULADOS (USV) DA INDONÉSIA, POR APLICAÇÃO, 2021-2030 (US$ MILHÕES)
TABELA 140 DEFESA DA INDONÉSIA NO MERCADO DE VEÍCULOS DE SUPERFÍCIE NÃO TRIPULADOS (USV), POR TIPO, 2021-2030 (US$ MILHÕES)
TABELA 141 INDONÉSIA COMERCIAL NO MERCADO DE VEÍCULOS DE SUPERFÍCIE NÃO TRIPULADOS (USV), POR FINALIDADE, 2021-2030 (US$ MILHÕES)
TABELA 142 MERCADO DE VEÍCULOS DE SUPERFÍCIE NÃO TRIPULADOS (USV) DA INDONÉSIA, POR TIPO, 2021-2030 (US$ MILHÕES)
TABELA 143 PESQUISA CIENTÍFICA NA INDONÉSIA NO MERCADO DE VEÍCULOS DE SUPERFÍCIE NÃO TRIPULADOS (USV), POR TIPO, 2021-2030 (US$ MILHÕES)
TABELA 144 MERCADO DE VEÍCULOS DE SUPERFÍCIE NÃO TRIPULADOS (USV) DA INDONÉSIA, POR RESISTÊNCIA, 2021-2030 (US$ MILHÕES)
TABELA 145 MERCADO DE VEÍCULOS DE SUPERFÍCIE NÃO TRIPULADOS (USV) DA INDONÉSIA, POR OPERAÇÃO, 2021-2030 (US$ MILHÕES)
TABELA 146 MERCADO DE VEÍCULOS DE SUPERFÍCIE NÃO TRIPULADOS (USV) DA INDONÉSIA, POR SISTEMA, 2021-2030 (US$ MILHÕES)
TABELA 147 MERCADO DE VEÍCULOS DE SUPERFÍCIE NÃO TRIPULADOS (USV) DA INDONÉSIA, POR TIPO DE CASCO, 2021-2030 (US$ MILHÕES)
TABELA 148 MERCADO DE VEÍCULOS DE SUPERFÍCIE NÃO TRIPULADOS (USV) DA INDONÉSIA, POR TAMANHO (COMPRIMENTO EM METROS), 2021-2030 (US$ MILHÕES)
TABELA 149 MERCADO DE VEÍCULOS DE SUPERFÍCIE NÃO TRIPULADOS (USV) DAS FILIPINAS, POR TIPO, 2021-2030 (US$ MILHÕES)
TABELA 150 MERCADO DE VEÍCULOS DE SUPERFÍCIE NÃO TRIPULADOS (USV) DAS FILIPINAS, POR APLICAÇÃO, 2021-2030 (US$ MILHÕES)
TABELA 151 DEFESA DAS FILIPINAS NO MERCADO DE VEÍCULOS DE SUPERFÍCIE NÃO TRIPULADOS (USV), POR TIPO, 2021-2030 (US$ MILHÕES)
TABELA 152 FILIPINAS COMERCIAIS NO MERCADO DE VEÍCULOS DE SUPERFÍCIE NÃO TRIPULADOS (USV), POR FINALIDADE, 2021-2030 (US$ MILHÕES)
TABELA 153 FILIPINAS COMERCIAIS NO MERCADO DE VEÍCULOS DE SUPERFÍCIE NÃO TRIPULADOS (USV), POR TIPO, 2021-2030 (US$ MILHÕES)
TABELA 154 PESQUISA CIENTÍFICA NAS FILIPINAS NO MERCADO DE VEÍCULOS DE SUPERFÍCIE NÃO TRIPULADOS (USV), POR TIPO, 2021-2030 (US$ MILHÕES)
TABELA 155 MERCADO DE VEÍCULOS DE SUPERFÍCIE NÃO TRIPULADOS (USV) DAS FILIPINAS, POR RESISTÊNCIA, 2021-2030 (US$ MILHÕES)
TABELA 156 MERCADO DE VEÍCULOS DE SUPERFÍCIE NÃO TRIPULADOS (USV) DAS FILIPINAS, POR OPERAÇÃO, 2021-2030 (US$ MILHÕES)
TABELA 157 MERCADO DE VEÍCULOS DE SUPERFÍCIE NÃO TRIPULADOS (USV) DAS FILIPINAS, POR SISTEMA, 2021-2030 (US$ MILHÕES)
TABELA 158 MERCADO DE VEÍCULOS DE SUPERFÍCIE NÃO TRIPULADOS (USV) DAS FILIPINAS, POR TIPO DE CASCO, 2021-2030 (US$ MILHÕES)
TABELA 159 MERCADO DE VEÍCULOS DE SUPERFÍCIE NÃO TRIPULADOS (USV) DAS FILIPINAS, POR TAMANHO (COMPRIMENTO EM METROS), 2021-2030 (US$ MILHÕES)
TABELA 160 MERCADO DE VEÍCULOS DE SUPERFÍCIE NÃO TRIPULADOS (USV) DO RESTO DA ÁSIA-PACÍFICO, POR TIPO, 2021-2030 (US$ MILHÕES)
Lista de Figura
FIGURA 1 MERCADO DE VEÍCULOS DE SUPERFÍCIE NÃO TRIPULADOS (USV) DA ÁSIA-PACÍFICO: SEGMENTAÇÃO
FIGURA 2 MERCADO DE VEÍCULOS DE SUPERFÍCIE NÃO TRIPULADOS (USV) DA ÁSIA-PACÍFICO: TRIANGULAÇÃO DE DADOS
FIGURA 3 MERCADO DE VEÍCULOS DE SUPERFÍCIE NÃO TRIPULADOS (USV) DA ÁSIA-PACÍFICO: ANÁLISE DROC
FIGURA 4 MERCADO DE VEÍCULOS DE SUPERFÍCIE NÃO TRIPULADOS (USV) DA ÁSIA-PACÍFICO: ANÁLISE DE MERCADO DA ÁSIA-PACÍFICO VS MERCADO REGIONAL
FIGURA 5 MERCADO DE VEÍCULOS DE SUPERFÍCIE NÃO TRIPULADOS (USV) DA ÁSIA-PACÍFICO: ANÁLISE DE PESQUISA DA EMPRESA
FIGURA 6 MERCADO DE VEÍCULOS DE SUPERFÍCIE NÃO TRIPULADOS (USV) DA ÁSIA-PACÍFICO: DEMOGRAFIA DA ENTREVISTA
FIGURA 7 MERCADO DE VEÍCULOS DE SUPERFÍCIE NÃO TRIPULADOS (USV) DA ÁSIA-PACÍFICO: GRADE DE POSIÇÃO DE MERCADO DBMR
FIGURA 8 MERCADO DE VEÍCULOS DE SUPERFÍCIE NÃO TRIPULADOS (USV) DA ÁSIA-PACÍFICO: ANÁLISE DA PARTICIPAÇÃO DE FORNECEDORES
FIGURA 9 MERCADO DE VEÍCULOS DE SUPERFÍCIE NÃO TRIPULADOS (USV) DA ÁSIA-PACÍFICO: MODELAGEM MULTIVARIADA
FIGURA 10 MERCADO DE VEÍCULOS DE SUPERFÍCIE NÃO TRIPULADOS (USV) DA ÁSIA-PACÍFICO: GRADE DE COBERTURA DE APLICAÇÕES DE MERCADO
FIGURA 11 MERCADO DE VEÍCULOS DE SUPERFÍCIE NÃO TRIPULADOS (USV) DA ÁSIA-PACÍFICO: TIPO LINHA DO TEMPO CURVA
FIGURA 12 MERCADO DE VEÍCULOS DE SUPERFÍCIE NÃO TRIPULADOS (USV) DA ÁSIA-PACÍFICO: SEGMENTAÇÃO
FIGURA 13 O AUMENTO DO USO DE VEÍCULOS DE SUPERFÍCIE NÃO TRIPULADOS (USV) NA EXPLORAÇÃO COMERCIAL DEVE IMPULSIONAR O MERCADO DE VEÍCULOS DE SUPERFÍCIE NÃO TRIPULADOS (USV) DA ÁSIA-PACÍFICO NO PERÍODO PREVISTO
FIGURA 14 O SEGMENTO DE SUPERFÍCIE DEVE SER REPRESENTANTE DA MAIOR PARCIALIDADE DO MERCADO DE VEÍCULOS DE SUPERFÍCIE NÃO TRIPULADOS (USV) DA ÁSIA-PACÍFICO EM 2023 E 2030
FIGURE 15 DRIVERS, RESTRAINTS, OPPORTUNITIES, AND CHALLENGES OF THE ASIA PACIFIC UNMANNED SURFACE VEHICLE (USV) MARKET
FIGURE 16 PLASTICS PRODUCTION ACROSS GLOBE
FIGURE 17 CRUDE OIL PRODUCTION DATA, BY REGION
FIGURE 18 DEFENCE EXPENDITURE ACROSS THE GLOBE
FIGURE 19 ASIA PACIFIC UNMANNED SURFACE VEHICLE (USV) MARKET: BY TYPE, 2022
FIGURE 20 ASIA PACIFIC UNMANNED SURFACE VEHICLE (USV) MARKET: BY APPLICATION, 2022
FIGURE 21 ASIA PACIFIC UNMANNED SURFACE VEHICLE (USV) MARKET: BY ENDURANCE, 2022
FIGURE 22 ASIA PACIFIC UNMANNED SURFACE VEHICLE (USV) MARKET: BY OPERATION, 2022
FIGURE 23 ASIA PACIFIC UNMANNED SURFACE VEHICLE (USV) MARKET: BY SYSTEM, 2022
FIGURE 24 ASIA PACIFIC UNMANNED SURFACE VEHICLE (USV) MARKET: BY HULL TYPE, 2022
FIGURE 25 ASIA PACIFIC UNMANNED SURFACE VEHICLE (USV) MARKET: BY SIZE, 2022
FIGURE 26 ASIA-PACIFIC UNMANNED SURFACE VEHICLE (USV) MARKET: SNAPSHOT (2022)
FIGURE 27 ASIA-PACIFIC UNMANNED SURFACE VEHICLE (USV) MARKET: BY COUNTRY (2022)
FIGURE 28 ASIA-PACIFIC UNMANNED SURFACE VEHICLE (USV) MARKET: BY COUNTRY (2023 & 2030)
FIGURE 29 ASIA-PACIFIC UNMANNED SURFACE VEHICLE (USV) MARKET: BY COUNTRY (2022 & 2030)
FIGURE 30 ASIA-PACIFIC UNMANNED SURFACE VEHICLE (USV) MARKET: BY TYPE (2023-2030)
FIGURE 31 ASIA PACIFIC UNMANNED SURFACE VEHICLE (USV) MARKET: COMPANY SHARE 2022 (%)
Metodologia de Investigação
A recolha de dados e a análise do ano base são feitas através de módulos de recolha de dados com amostras grandes. A etapa inclui a obtenção de informações de mercado ou dados relacionados através de diversas fontes e estratégias. Inclui examinar e planear antecipadamente todos os dados adquiridos no passado. Da mesma forma, envolve o exame de inconsistências de informação observadas em diferentes fontes de informação. Os dados de mercado são analisados e estimados utilizando modelos estatísticos e coerentes de mercado. Além disso, a análise da quota de mercado e a análise das principais tendências são os principais fatores de sucesso no relatório de mercado. Para saber mais, solicite uma chamada de analista ou abra a sua consulta.
A principal metodologia de investigação utilizada pela equipa de investigação do DBMR é a triangulação de dados que envolve a mineração de dados, a análise do impacto das variáveis de dados no mercado e a validação primária (especialista do setor). Os modelos de dados incluem grelha de posicionamento de fornecedores, análise da linha de tempo do mercado, visão geral e guia de mercado, grelha de posicionamento da empresa, análise de patentes, análise de preços, análise da quota de mercado da empresa, normas de medição, análise global versus regional e de participação dos fornecedores. Para saber mais sobre a metodologia de investigação, faça uma consulta para falar com os nossos especialistas do setor.
Personalização disponível
A Data Bridge Market Research é líder em investigação formativa avançada. Orgulhamo-nos de servir os nossos clientes novos e existentes com dados e análises que correspondem e atendem aos seus objetivos. O relatório pode ser personalizado para incluir análise de tendências de preços de marcas-alvo, compreensão do mercado para países adicionais (solicite a lista de países), dados de resultados de ensaios clínicos, revisão de literatura, mercado remodelado e análise de base de produtos . A análise de mercado dos concorrentes-alvo pode ser analisada desde análises baseadas em tecnologia até estratégias de carteira de mercado. Podemos adicionar quantos concorrentes necessitar de dados no formato e estilo de dados que procura. A nossa equipa de analistas também pode fornecer dados em tabelas dinâmicas de ficheiros Excel em bruto (livro de factos) ou pode ajudá-lo a criar apresentações a partir dos conjuntos de dados disponíveis no relatório.

