Europe Food Micronized Salt Market
Tamanho do mercado em biliões de dólares
CAGR :
% 
 USD
701.69 Million
USD
909.81 Million
2025
2033
USD
701.69 Million
USD
909.81 Million
2025
2033
| 2026 –2033 | |
| USD 701.69 Million | |
| USD 909.81 Million | |
| % | |
|
Segmentação do mercado europeu de sal micronizado para alimentos, por grau de pureza (98% - 99,5% e pureza acima de 99,5%), aplicação (chocolate e confeitaria, panificação, alimentos funcionais, laticínios, alternativas lácteas, carnes processadas, aves e frutos do mar, frutas e vegetais enlatados/em conserva, refeições prontas, bebidas e outros) - Tendências e previsões do setor até 2033.
Tamanho do mercado europeu de sal micronizado para alimentos
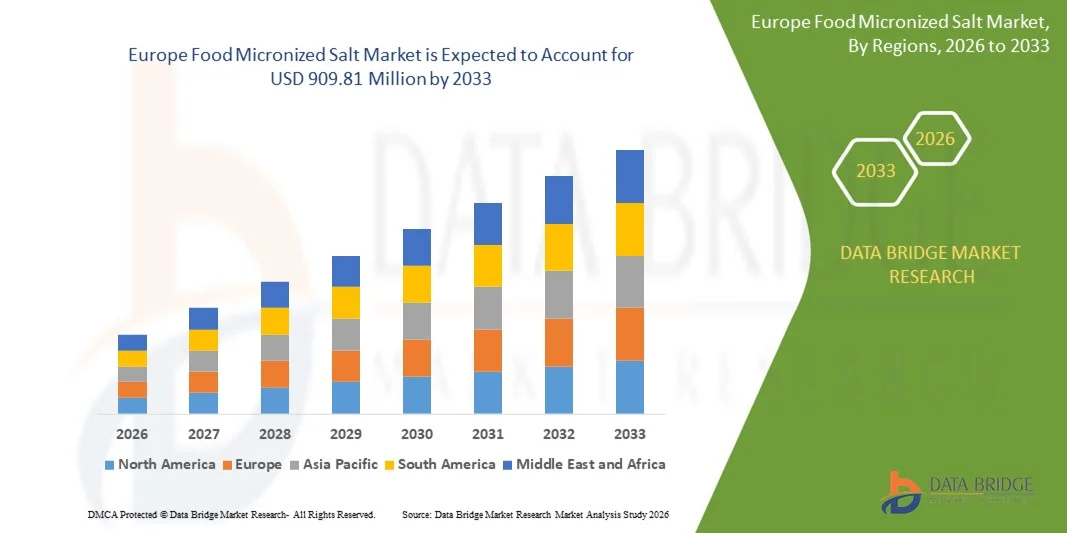
- O mercado europeu de sal micronizado para uso alimentar foi avaliado em US$ 701,69 milhões em 2025 e deverá atingir US$ 909,81 milhões em 2033 , com uma taxa de crescimento anual composta (CAGR) de 3,3% durante o período de previsão.
- O crescimento do mercado é impulsionado principalmente pela crescente demanda por alimentos processados e embalados, nos quais o sal micronizado é amplamente utilizado para garantir dispersão uniforme, teor de sal controlado e perfis de sabor consistentes em produções em larga escala. Além disso, o foco crescente na qualidade do produto, aprimoramento da textura e tempero eficiente no processamento industrial de alimentos está acelerando a adoção do sal micronizado em diversas aplicações alimentícias.
- Além disso, a crescente preferência do consumidor por alimentos práticos, formulações com rótulos limpos e temperos com porções controladas está incentivando os fabricantes de alimentos a adotarem soluções de sal finamente moído. Esses fatores convergentes estão impulsionando uma maior utilização de sal micronizado em panificação, confeitaria, laticínios e refeições prontas, aumentando significativamente o crescimento geral do mercado.
Análise do mercado europeu de sal micronizado para alimentos
- O sal micronizado para uso alimentar, caracterizado pelo seu tamanho de partícula fino e rápida solubilidade, desempenha um papel crucial no processamento moderno de alimentos, melhorando a consistência do sabor, a eficiência do processamento e a uniformidade do produto em formulações sólidas e líquidas. Sua aplicação abrange uma ampla gama de categorias de alimentos, auxiliando os fabricantes a atender aos padrões de qualidade e às exigências de produção em larga escala.
- A crescente demanda por sal micronizado para uso alimentar é impulsionada principalmente pela expansão da indústria global de processamento de alimentos, pelo aumento do consumo de alimentos prontos para consumo e de conveniência, e pela necessidade de uma distribuição precisa de sal para atender às diretrizes regulatórias e de controle de sódio relacionadas à saúde.
- A Alemanha dominou o mercado de sal micronizado para alimentos em 2025, devido à sua forte indústria de processamento de alimentos, à alta demanda por qualidade e consistência em alimentos embalados e às avançadas capacidades de fabricação nos segmentos de panificação, confeitaria e alimentos processados.
- Prevê-se que o Reino Unido seja o país com o crescimento mais rápido no mercado de sal micronizado para alimentos durante o período de previsão, devido ao aumento do consumo de alimentos processados e de conveniência e à crescente ênfase na consistência do sabor e da qualidade.
- O segmento de pureza entre 98% e 99,5% dominou o mercado com uma participação de 58,3% em 2025, devido ao seu uso generalizado em uma ampla gama de aplicações de processamento de alimentos e à sua relação custo-benefício. Este grau de pureza é o preferido pelos fabricantes por sua qualidade consistente, facilidade de manuseio e adequação a formulações alimentícias padrão. O domínio do segmento também é sustentado por sua compatibilidade com diversas técnicas de micronização que melhoram a solubilidade e a textura dos produtos finais. Os produtores de alimentos frequentemente optam por este grau de pureza para manter um equilíbrio entre desempenho e eficiência operacional. Sua ampla adoção em alimentos processados, produtos de panificação e bebidas reforça ainda mais sua posição de liderança.
Escopo do relatório e segmentação do mercado de sal micronizado para alimentos
|
Atributos |
Principais informações de mercado sobre o sal micronizado para alimentos |
|
Segmentos abrangidos |
|
|
Países abrangidos |
Europa
|
|
Principais participantes do mercado |
|
|
Oportunidades de mercado |
|
|
Conjuntos de informações de dados de valor agregado |
Além das informações sobre cenários de mercado, como valor de mercado, taxa de crescimento, segmentação, cobertura geográfica e principais participantes, os relatórios de mercado elaborados pela Data Bridge Market Research também incluem análises aprofundadas de especialistas, análises de preços, análises de participação de marcas, pesquisas com consumidores, análises demográficas, análises da cadeia de suprimentos, análises da cadeia de valor, visão geral de matérias-primas/insumos, critérios de seleção de fornecedores, análise PESTLE, análise de Porter e estrutura regulatória. |
Tendências do mercado europeu de sal micronizado para alimentos
Adoção crescente de ingredientes micronizados para sabor e textura consistentes.
- Uma das principais tendências no mercado de sal micronizado para alimentos é a crescente adoção do sal finamente moído para alcançar uma distribuição uniforme de sabor e consistência de textura na produção industrial de alimentos. Os fabricantes de alimentos estão priorizando cada vez mais o sal micronizado, pois ele se dissolve rapidamente e se mistura de maneira homogênea, permitindo um controle preciso da formulação em ambientes de processamento em larga escala.
- Por exemplo, empresas como a Cargill Incorporated fornecem soluções de sal micronizado para processadores de alimentos que buscam melhor solubilidade e tempero consistente em aplicações de panificação, confeitaria e refeições prontas. Esses produtos ajudam os fabricantes a manter perfis de sabor padronizados, otimizando a eficiência do processamento.
- A demanda por sal micronizado está crescendo na produção de panificação e confeitaria, onde a dispersão controlada do sal é essencial para o desempenho da massa, a estabilidade do produto e o equilíbrio do sabor. Essa tendência apoia a produção de grandes volumes de produtos de panificação, garantindo ao mesmo tempo a consistência da qualidade entre os lotes.
- Em formulações lácteas e alternativas ao leite, o sal micronizado é cada vez mais utilizado para aumentar a solubilidade e evitar a formação de granulosidade em produtos líquidos e semissólidos. Isso atende ao crescente consumo de produtos lácteos processados e alternativas vegetais que exigem textura suave e sabor estável.
- As indústrias de processamento de alimentos, com foco no controle de porções e em formulações com baixo teor de sódio, também estão adotando o sal micronizado para obter uma melhor percepção do sal com quantidades menores. Essa tendência está alinhada aos esforços da indústria para atender às diretrizes regulatórias e às preferências em constante evolução dos consumidores.
- De modo geral, o aumento do uso de ingredientes micronizados reflete uma tendência mais ampla em direção ao processamento de alimentos de precisão, onde consistência, eficiência e controle da liberação de sabor estão se tornando diferenciais críticos em mercados alimentícios competitivos.
Dinâmica do mercado europeu de sal micronizado para alimentos
Motorista
Crescente demanda por produtos alimentícios processados, embalados e de conveniência.
- O crescente consumo de alimentos processados, embalados e de conveniência é um fator-chave para o mercado de sal micronizado para uso alimentar, visto que os fabricantes necessitam de ingredientes confiáveis que garantam tempero uniforme e produção eficiente. O sal micronizado é ideal para linhas de processamento de alta velocidade, dissolvendo-se rapidamente e distribuindo-se uniformemente em formulações complexas.
- Por exemplo, a ADM fornece ingredientes de sal de qualidade alimentar para fabricantes de refeições, salgadinhos e produtos de panificação embalados, onde o sabor e a qualidade consistentes são essenciais. O uso de sal micronizado ajuda esses produtores a manter a padronização em grandes volumes de produção.
- O crescimento das populações urbanas e a mudança nos estilos de vida aumentaram a dependência de alimentos prontos para consumo e preparo, impulsionando diretamente a demanda por soluções avançadas de tempero. O sal micronizado permite que os fabricantes realcem o sabor, mantendo a eficiência operacional na produção em massa.
- As indústrias de processamento de alimentos estão cada vez mais expandindo suas operações para atender à demanda global, o que exige ingredientes com desempenho consistente em diversas condições de processamento. O sal micronizado contribui para essa escalabilidade, melhorando a precisão da mistura e reduzindo a variabilidade da formulação.
- A crescente penetração de marcas próprias e de alimentos embalados de marcas conhecidas está fortalecendo ainda mais esse fator, à medida que as empresas competem com base na consistência do sabor e na confiabilidade do produto. Essa demanda sustentada reforça o papel do sal micronizado como ingrediente fundamental no processamento moderno de alimentos.
Restrição/Desafio
Volatilidade nos preços das matérias-primas e nos custos de energia
- O mercado de sal micronizado para uso alimentar enfrenta desafios devido às flutuações nos preços do sal bruto e ao aumento dos custos de energia associados aos processos de moagem e micronização. Essas variações de custos podem impactar as margens de produção e pressionar os fabricantes a reduzirem seus preços.
- Por exemplo, empresas como a Tata Chemicals operam instalações de processamento de sal em larga escala, onde são necessários processos de moagem e purificação com alto consumo de energia para produzir sal micronizado. O aumento dos custos de energia e transporte afeta diretamente a economia geral da produção.
- Manter níveis consistentes de tamanho e pureza de partículas exige equipamentos de processamento avançados e um rigoroso controle de qualidade, o que eleva ainda mais os custos operacionais. Esses fatores dificultam a absorção de aumentos de custos pelos fabricantes sem afetar o preço do produto.
- Interrupções na cadeia de suprimentos e a variabilidade na disponibilidade de sal bruto também podem afetar a continuidade da produção, principalmente para os graus micronizados de alta pureza usados em aplicações alimentares sensíveis. Isso adiciona complexidade ao planejamento de estoque e à gestão de custos.
- Com a intensificação da concorrência, os fabricantes precisam equilibrar a eficiência de custos com as expectativas de qualidade, o que continua sendo um desafio crucial para os participantes do mercado. Essas restrições podem limitar a expansão a curto prazo para empresas menores.
Escopo do mercado europeu de sal micronizado para alimentos
O mercado está segmentado com base na qualidade e na aplicação.
- Por série
Com base no grau de pureza, o mercado de sal micronizado para uso alimentar é segmentado em Pureza de 98% a 99,5% e Pureza acima de 99,5%. O segmento de Pureza de 98% a 99,5% dominou o mercado com a maior participação na receita, de 58,3% em 2025, impulsionado por seu uso generalizado em uma ampla gama de aplicações no processamento de alimentos e por sua relação custo-benefício. Esse grau de pureza é o preferido pelos fabricantes devido à sua qualidade consistente, facilidade de manuseio e adequação a formulações alimentares padrão. O domínio do segmento também é sustentado por sua compatibilidade com diversas técnicas de micronização que melhoram a solubilidade e a textura dos produtos finais. Os produtores de alimentos frequentemente optam por esse grau de pureza para manter um equilíbrio entre desempenho e eficiência operacional. Sua ampla adoção em alimentos processados, produtos de panificação e bebidas reforça ainda mais sua posição de liderança.
Prevê-se que o segmento de pureza acima de 99,5% apresente a taxa de crescimento mais rápida de 2026 a 2033, impulsionado pela crescente demanda em aplicações de alimentos premium e funcionais, onde uma pureza mais elevada é fundamental. Por exemplo, empresas como a Morton Salt estão fornecendo cada vez mais sal micronizado de alta pureza para aplicações especializadas em confeitaria e laticínios. Este grau de pureza oferece solubilidade superior, impurezas mínimas e consistência de sabor aprimorada, o que é essencial para produtos alimentícios sofisticados e focados na saúde. A crescente preferência do consumidor por alimentos com rótulos limpos e minimamente processados também impulsiona a adoção deste grau de pureza. Sua aplicação em formulações sensíveis, como chocolates, bebidas funcionais e suplementos alimentares, contribui ainda mais para sua rápida expansão de mercado.
- Por meio de aplicação
Com base na aplicação, o mercado de sal micronizado para alimentos é segmentado em Chocolate e Confeitaria, Panificação, Alimentos Funcionais, Laticínios, Alternativas Lácteas, Carnes Processadas, Aves e Frutos do Mar, Frutas e Vegetais Enlatados/Conservados, Refeições Prontas, Bebidas e Outros. O segmento de Panificação dominou o mercado com a maior participação na receita em 2025, impulsionado pelo alto volume de produção de panificação e pela necessidade de dispersão uniforme do sal para manter a textura e o sabor do produto. O sal micronizado permite um controle preciso dos níveis de sal em massas e misturas, melhorando a consistência da qualidade. Seu uso generalizado em padarias comerciais e instalações de produção em larga escala consolida ainda mais sua dominância. Os fabricantes priorizam o sal micronizado em aplicações de panificação devido à sua rápida solubilidade e facilidade de integração em linhas de processamento automatizadas. O segmento também se beneficia das inovações contínuas em produtos de panificação e do crescente consumo de produtos de panificação em áreas urbanas.
O segmento de Chocolates e Confeitaria deverá apresentar o crescimento mais rápido entre 2026 e 2033, impulsionado pela crescente demanda por chocolates e produtos de confeitaria de alta qualidade com perfis de sabor precisos. Por exemplo, a Barry Callebaut está adotando sal micronizado em aplicações de chocolate premium para aprimorar o sabor e a sensação na boca sem afetar a textura. O sal micronizado garante distribuição uniforme, melhor solubilidade e salinidade controlada em confeitos delicados. A crescente popularidade de chocolates gourmet e artesanais, bem como de produtos de confeitaria funcionais com benefícios adicionais para a saúde, contribui para a rápida adoção dessa tecnologia. O crescimento do segmento é ainda sustentado pela expansão do consumo global de chocolate e pela crescente conscientização do consumidor em relação à qualidade do produto e ao aprimoramento do sabor.
Análise Regional do Mercado Europeu de Sal Micronizado para Alimentos
- A Alemanha dominou o mercado de sal micronizado para uso alimentar, com a maior participação de mercado em 2025, impulsionada por sua forte indústria de processamento de alimentos, alta demanda por qualidade e consistência em alimentos embalados e capacidades avançadas de fabricação nos segmentos de panificação, confeitaria e alimentos processados.
- A infraestrutura bem desenvolvida da cadeia de suprimentos do país, a ampla adoção de ingredientes alimentares padronizados e o rigoroso cumprimento das normas da UE em matéria de segurança e qualidade alimentar continuam a apoiar o uso extensivo de sal micronizado na produção industrial de alimentos.
- O crescente foco na uniformidade do produto, no controle de sódio e em formulações alimentares premium, juntamente com o aumento dos investimentos por parte dos principais fabricantes de alimentos e fornecedores de ingredientes, reforçam a posição de liderança da Alemanha. As constantes atualizações tecnológicas no processamento de alimentos, o alinhamento com as normas de rotulagem e segurança da UE e a forte colaboração entre produtores de ingredientes e marcas de alimentos garantem a dominância da Alemanha no mercado europeu de sal micronizado para alimentos.
Análise do Mercado de Sal Micronizado para Alimentos no Reino Unido
Prevê-se que o Reino Unido registará o crescimento anual composto (CAGR) mais rápido no mercado europeu de sal micronizado para alimentação entre 2026 e 2033, impulsionado pelo aumento do consumo de alimentos processados e de conveniência e pela crescente ênfase na consistência do sabor e da qualidade. Por exemplo, fabricantes de alimentos sediados no Reino Unido, como a Tate & Lyle, fornecem ingredientes e soluções de sal de grau alimentício que permitem a formulação precisa e o controle do sabor em produtos de panificação, snacks e refeições prontas. O crescente foco em formulações com rótulos limpos, controle de porções e iniciativas de reformulação com o objetivo de reduzir o sódio está acelerando a adoção. Uma forte supervisão regulatória, investimentos em tecnologias avançadas de processamento de alimentos e o alinhamento com as normas alimentares da UE e nacionais reforçam ainda mais a posição do Reino Unido como o mercado de crescimento mais rápido da região.
Análise do mercado de sal micronizado para alimentos na França
A França deverá apresentar um crescimento constante entre 2026 e 2033, impulsionado pela crescente demanda do consumidor por alimentos processados de alta qualidade e pela adoção cada vez maior de ingredientes padronizados na indústria alimentícia. A ênfase no refinamento do sabor, na consistência da textura e em produtos alimentícios premium sustenta o uso do sal micronizado em aplicações de panificação, laticínios e refeições prontas. A colaboração entre produtores de alimentos franceses e fornecedores globais de ingredientes, juntamente com a preferência por insumos alimentares de alta qualidade e regulamentados, incentiva a adoção contínua. O foco do país na qualidade culinária, na modernização das práticas de processamento de alimentos e na adesão às normas de segurança alimentar da UE reforça o crescimento estável da França no mercado europeu de sal micronizado para alimentos.
Participação de mercado do sal micronizado na Europa
A indústria de sal micronizado para uso alimentar é liderada principalmente por empresas consolidadas, incluindo:
- DuPont (EUA)
- Almirante (EUA)
- Tate & Lyle (Reino Unido)
- Ingredion Incorporated (EUA)
- Cargill Incorporated (EUA)
- Roquette Frères (França)
- PureCircle Ltd (EUA)
- MacAndrews & Forbes Holdings Inc. (EUA)
- JK Sucralose Inc. (China)
- Ajinomoto Co. (Japão)
- Südzucker AG (Alemanha)
- Guilin Layn Natural Ingredients Corp. (China)
- Zhucheng Haotian Pharm Co., Ltd. (China)
- HSWT France SAS (França)
Novidades no mercado europeu de sal micronizado para alimentos
- Em fevereiro de 2025, a Cargill anunciou um investimento significativo de US$ 30 milhões para expandir sua capacidade de produção de sal micronizado em sua unidade de Michigan, permitindo que a empresa aumente a produção para atender à crescente demanda dos setores de processamento de alimentos e farmacêutico. Essa expansão reflete a forte confiança do mercado e destaca a crescente dependência do sal micronizado em diversas aplicações, onde o aumento da capacidade de fornecimento pode reduzir os prazos de entrega e apoiar os fabricantes de alimentos em larga escala. Espera-se que o investimento melhore o posicionamento competitivo da Cargill e ajude a estabilizar os preços, solucionando as restrições de capacidade. Também pode incentivar outros participantes do mercado a fortalecerem sua infraestrutura de produção, acelerando o crescimento geral do setor e garantindo uma distribuição geográfica mais ampla dos produtos de sal micronizado.
- Em janeiro de 2025, a Tata Chemicals obteve aprovação regulatória para exportar seus produtos de sal micronizado para o Japão, abrindo a região da Ásia-Pacífico para formulações de sal micronizado de maior pureza. Essa conquista estratégica permite que a Tata Chemicals acesse um dos mercados de alimentos mais exigentes do mundo em termos de qualidade e diversifique suas fontes de receita. A aprovação aumenta a atratividade do sal micronizado em aplicações de processamento de alimentos premium, onde padrões rigorosos de segurança e qualidade são obrigatórios. Também posiciona a empresa para parcerias internacionais mais fortes e contribui para a expansão do mercado, aumentando os fluxos comerciais globais de sal micronizado.
- Em 2024, a K+S AG anunciou uma parceria estratégica com um dos principais fabricantes de alimentos da Europa para o fornecimento de sal micronizado, fortalecendo sua presença no segmento de sal de valor agregado. Essa colaboração comercial visa garantir a demanda a longo prazo e otimizar as cadeias de suprimentos, aumentando a disponibilidade do produto para grandes processadores de alimentos. O acordo reforça a confiança da indústria no papel do sal micronizado como ingrediente essencial para temperos consistentes, realce de sabor e qualidade do produto. Ele também destaca uma tendência em direção a acordos de fornecimento integrados, que podem reduzir a volatilidade e apoiar a inovação em formulações de alimentos que dependem de sal em toda a Europa.
- Em outubro de 2020, a Cargill, Incorporated expandiu seu portfólio com o lançamento de uma nova embalagem de 737 gramas (26 onças) do sal kosher Diamond Crystal, ideal para o consumidor. Com um portfólio de produtos diversificado, o lançamento ajudou a atrair clientes, melhorar a visibilidade da marca e atender às crescentes preferências de conveniência dos consumidores. Essa expansão permite que a Cargill atenda a um público mais amplo, impulsionando o crescimento nas aplicações de varejo e culinária doméstica.
- Em setembro de 2020, a ZOUTMAN lançou sal marinho, pimenta e flor de sal em sachês individuais para o setor de serviços de alimentação. A crescente demanda por embalagens individuais incentivou a empresa a introduzir novos produtos, acelerando o crescimento do mercado. Com o lançamento, a empresa atraiu mais consumidores, o que impulsionou as vendas e a receita, além de reforçar a importância de formatos práticos para o preparo de temperos em serviços de alimentação.
SKU-
Obtenha acesso online ao relatório sobre a primeira nuvem de inteligência de mercado do mundo

- Painel interativo de análise de dados
- Painel de análise da empresa para oportunidades de elevado potencial de crescimento
- Acesso de analista de pesquisa para personalização e customização. consultas
- Análise da concorrência com painel interativo
- Últimas notícias, atualizações e atualizações Análise de tendências
- Aproveite o poder da análise de benchmark para um rastreio abrangente da concorrência
Metodologia de Investigação
A recolha de dados e a análise do ano base são feitas através de módulos de recolha de dados com amostras grandes. A etapa inclui a obtenção de informações de mercado ou dados relacionados através de diversas fontes e estratégias. Inclui examinar e planear antecipadamente todos os dados adquiridos no passado. Da mesma forma, envolve o exame de inconsistências de informação observadas em diferentes fontes de informação. Os dados de mercado são analisados e estimados utilizando modelos estatísticos e coerentes de mercado. Além disso, a análise da quota de mercado e a análise das principais tendências são os principais fatores de sucesso no relatório de mercado. Para saber mais, solicite uma chamada de analista ou abra a sua consulta.
A principal metodologia de investigação utilizada pela equipa de investigação do DBMR é a triangulação de dados que envolve a mineração de dados, a análise do impacto das variáveis de dados no mercado e a validação primária (especialista do setor). Os modelos de dados incluem grelha de posicionamento de fornecedores, análise da linha de tempo do mercado, visão geral e guia de mercado, grelha de posicionamento da empresa, análise de patentes, análise de preços, análise da quota de mercado da empresa, normas de medição, análise global versus regional e de participação dos fornecedores. Para saber mais sobre a metodologia de investigação, faça uma consulta para falar com os nossos especialistas do setor.
Personalização disponível
A Data Bridge Market Research é líder em investigação formativa avançada. Orgulhamo-nos de servir os nossos clientes novos e existentes com dados e análises que correspondem e atendem aos seus objetivos. O relatório pode ser personalizado para incluir análise de tendências de preços de marcas-alvo, compreensão do mercado para países adicionais (solicite a lista de países), dados de resultados de ensaios clínicos, revisão de literatura, mercado remodelado e análise de base de produtos . A análise de mercado dos concorrentes-alvo pode ser analisada desde análises baseadas em tecnologia até estratégias de carteira de mercado. Podemos adicionar quantos concorrentes necessitar de dados no formato e estilo de dados que procura. A nossa equipa de analistas também pode fornecer dados em tabelas dinâmicas de ficheiros Excel em bruto (livro de factos) ou pode ajudá-lo a criar apresentações a partir dos conjuntos de dados disponíveis no relatório.

