Europe Submarine Cable System Market, By Product (Wet Plant Products and Dry Plant Products), Voltage (Medium Voltage and High Voltage, Extra High Voltage), Offering (Installation And Commissioning, Repair And Maintenance And Upgrades), Fiber Class (Unrepeatered and Repeatered), Cables Type (Loose Tube Cables, Ribbon Cables and Others), Armor Type (Light Weight Armor, Single Armor, Double Armor and Rock Armor), Depth (0 to 500M, 500M to 1000M, 1000M to 5000M and Others), Application (Power Cables and Communication Cables) - Industry Trends and Forecast to 2029.
Europe Submarine Cable System Market Analysis and Size
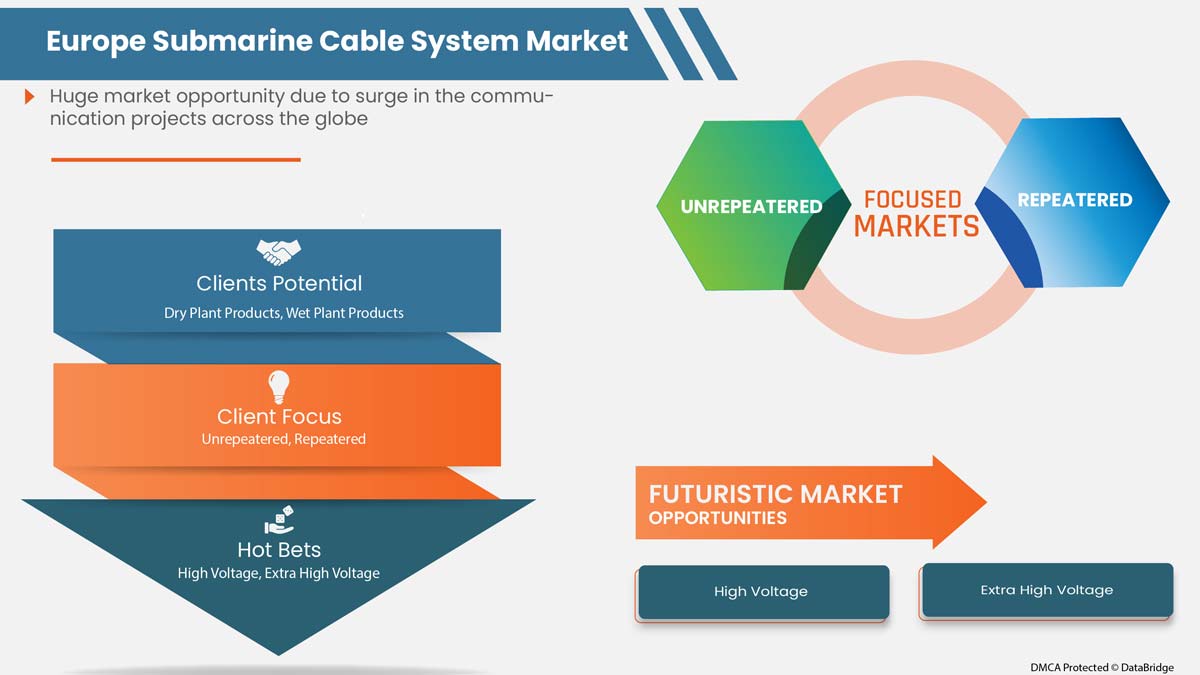
A submarine cable is a cable laid on the sea bed between land-based stations to carry telecommunication signals across stretches of sea and ocean. The rising telecom subscriptions and high investments in offshore wind farms have directly influenced the submarine cable market growth. Also, the growing investments of content and cloud service providers are flourishing the growth of the submarine cable market. Also, the increasing internet traffic in emerging regions positively impacts the market's growth. Furthermore, the growing demand for bandwidth is also acting as an active growth driver for the growth of the submarine cable market. Moreover, the increasing number of offshore wind farms and rising demand for inter-country and island power connections are creating a huge demand for submarine cable and lifting the growth of the submarine cable market.
However, regulatory, environmental, and intricate authorization procedures leading to delays as well as the complex repairing procedure for deep water power cable links are acting as the major restrictions for the growth of submarine cable in the above-mentioned forecasted period, whereas the growing buzz around space-based internet communications constellations can challenge the submarine cable market growth.
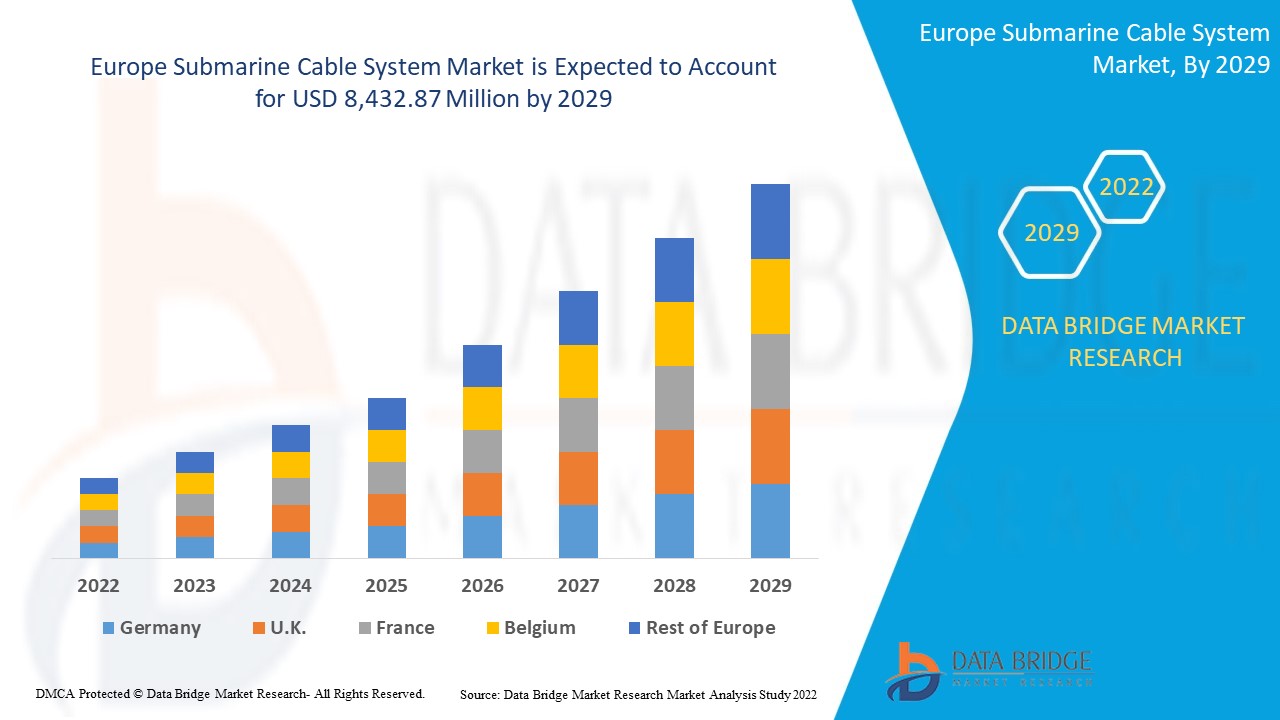
Data Bridge Market Research analyses that the Europe submarine cable system market is expected to reach USD 8,432.87 million by 2029, at a CAGR of 7.5% during the forecast period. "Dry Plants products" accounts for the most prominent technology segment. This type of technology is in demand as it offers maximum work efficiency by avoiding the installation of cables in critical areas. The submarine cable system market report also comprehensively covers pricing, patent, and technological advancements.
|
Report Metric |
Details |
|
Forecast Period |
2022 to 2029 |
|
Base Year |
2021 |
|
Historic Years |
2020 (Customizable to 2019-2014) |
|
Segments Covered |
By Product (Wet Plant Products and Dry Plant Products), Voltage (Medium Voltage and High Voltage, Extra High Voltage), Offering (Installation And Commissioning, Repair And Maintenance And Upgrades), Fiber Class (Unrepeatered and Repeatered), Cables Type (Loose Tube Cables, Ribbon Cables and Others), Armor Type (Light Weight Armor, Single Armor, Double Armor and Rock Armor), Depth (0 to 500M, 500M to 1000M, 1000M to 5000M and Others), Application (Power Cables and Communication Cables) |
|
Countries Covered |
Germany, France, U.K., Netherlands, Switzerland, Belgium, Russia, Italy, Spain, Turkey and Rest of Europe |
|
Market Players Covered |
HENGTONG GROUP CO., LTD, TE Connectivity, Saudi Ericsson, APAR, NEC Corporation, NXT A/S, Norddeutsche Seekabelwerke GmbH (A Subsidiary of Prysmian Group), JDR Cable Systems Ltd, ZTT, Hexatronic Group, Alcatel Submarine Networks, Corning Incorporated, The Okonite Company, AFL (a subsidiary of Fujikura Ltd.), LEONI, NEXANS, Ocean Specialists, Inc. (a subsidiary of Continental Shelf Associates, Inc.), TFKable, Sumitomo Electric Industries, Ltd., Tratos, Hellenic Cables S.A. and HESFIBEL SUBSEA CABLES among others. |
Market Definition
A submarine cable system refers to the cable frameworks connected to a land-based station that helps to transmit the signals over the ocean and marine water bodies. The connectivity combination over long distances combines communication and electricity transmission through the cable systems underwater.
The demand and the deployment of the submarine cable system are completely dependent on the Europe increase in telecom and internet subscriptions. They are expected to put effort into expanding the submarine systems in unexplored areas. Moreover, sea freight and GPS play a major role in developing submarine cables across all countries and regions in the modern world. This needs the application of proper and unique government regulations to develop a standard procedure and connectivity. Hence it includes several set of rules and regulations which helps to boost the market.
Submarine Cable System Market Dynamics
This section deals with understanding the market drivers, advantages, opportunities, restraints, and challenges. All of this is discussed in detail below:
Drivers/Opportunities
- Rise in the trend of offshore wind power generation
Submarine cables have been around since the mid-1800s. But, for a large portion of their set of experiences, such cables were utilized fundamentally to send power from conventional sources, for example, coal plants, either between nations or out to islands or oil stages. The submarine cable industry faced a decline during the 19th century. That changed during the 2000s, as rising energy costs and worries about environmental change animated interest in growing offshore wind and more effective transnational power grids.
Wind power generation is a clean energy source that does not require fuel and power generation offshore has strong winds, attracting offshore wind power generation development projects across the globe.
- Rise in the adoption of cloud-based services
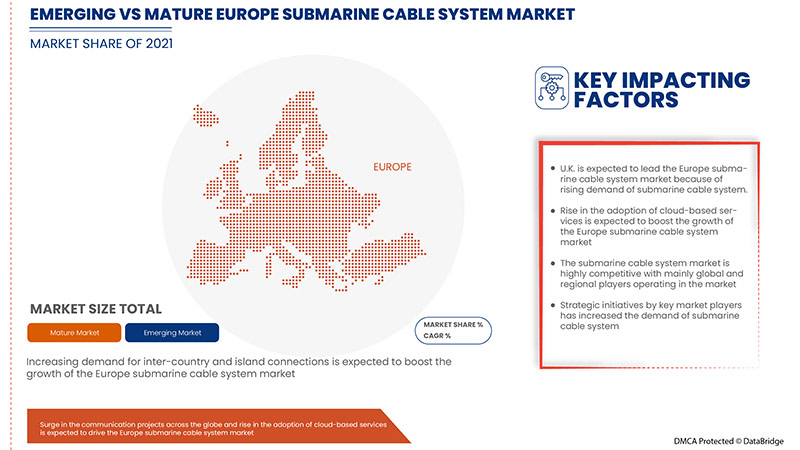
The development over the air using various new satellite groups of stars being sent off and the rising fondness for getting to content through portable organizations over remote wireless transmissions. These remote transmissions are connected through data center infrastructures. They are interconnected through cables laid in a submarine to develop connections among different data centers in different countries and regions. This implies a need for submarine cables that helps to connect data centers and directly improve cloud-based connectivity for all types of organizations. Thus, the adoption of cloud-based services and solutions is expected to be a major driver of the growth of the submarine cable system market.
- Deployment of various technologies in submarine cable systems
Power feeding to submarine cable systems is a long-established practice, from coaxial submarine systems to present-day optical amplifier systems. The main principles of electrical powering to the submarine cable systems, as discussed in this chapter, are power feeding equipment (PFE) installed in the terminal stations, return path through earth and sea, and the PFE feeding a constant current to stabilize the repeater characteristics and transmission performance.
Restraint/Challenges
- High initial investments act as an entry barrier for SMEs
The connection through subsea cable is lengthy and thus the cost is directly dependent on the length of the cable systems used which directly Thus, it has been observed that usually, the major players in the market involves in the submarine cable service business as it involves huge investments which the SMEs cannot offer. This will restrict more players from entering the market and promote dominance, which is expected to restrict market growth.
- Complex repairing procedures
Cable ships are loaded with enough cable for repairs, maybe 5-10 km, which can be loaded in a few hours. Cable has to be added to make the repair, since there is not enough slack to bring the cable up and cut a piece out. After the cable is retrieved and on board, in a repair room that looks like a laboratory, engineers repair the cable.
Post COVID-19 Impact on Submarine Cable System Market
COVID-19 significantly impacted the submarine cable system market as almost every country has opted for the shutdown for every production facility except those producing essential goods. The government has taken strict actions, such as shutting down production and sale of non-essential goods, blocking international trade, and many more, to prevent the spread of COVID-19. The only business dealing in this pandemic situation is the essential services allowed to open and run the processes.
The growth of the submarine cable system market is rising due to the digitalization in the production process and supply chains across electrical utilities, mining, oil and gas, and transportation. Moreover, cable faults occur frequently worldwide, and a fleet of dedicated vessels repair them as quickly as possible. Repairing a cable requires receiving government permits to access ports and for ships to perform repairs in territorial waters. Delays in permits were already an issue facing the industry in some countries before COVID-19. With the importance of connectivity at its pinnacle, it's more vital than ever for governments to expedite permits to ensure swift repairs.
Manufacturers are making various strategic decisions to bounce back post-COVID-19. The players are conducting multiple research and development activities to improve the technology in the submarine cable system market. The companies will bring advanced and accurate solutions to the market.
Recent Developments
- In November 2021, LEONI announced the partnership in the ADOPD project developing ultrafast fiber-optical computational units based on Adaptive Optical Dendrites. This project will help the company to understand the various processes and interactions and result in developing better product technologies in various segments, especially in cable systems
- In July 2022, NEXANS announced winning a new project by EuroAsia interconnector Limited to develop European electricity interconnection linking the national grids of Israel, Cyprus, and Greece (Crete). This project will help the company provide technology for deep water subsea power cables utilizing NEXANS long term developments for 3,000m ultradeep waters and the installation capabilities that will be recognized in the market.
Europe Submarine Cable System Market Scope
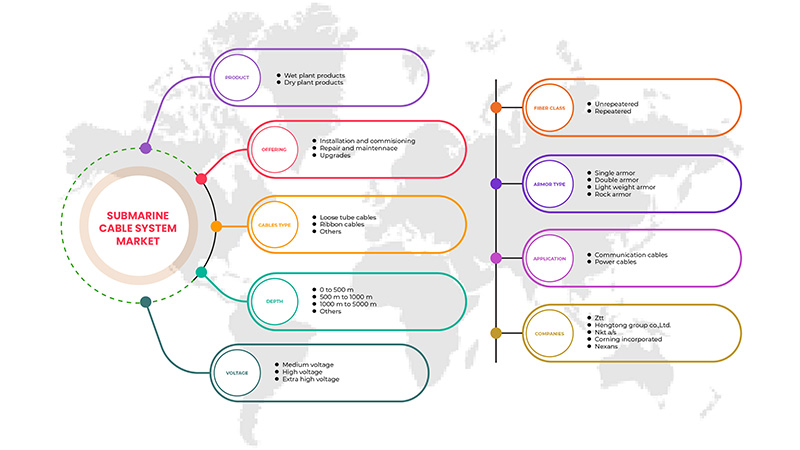
The submarine cable system market is segmented on product, voltage, offering, fiber glass, cables type, armor type, depth, and application. The growth amongst these segments will help you analyze meager growth segments in the industries and provide the users with a valuable market overview and market insights to help them make strategic decisions for identifying core market applications.
By Product
- Wet plant Products
- Dry Plant Products
On the basis of product, the Europe submarine cable system market is segmented into wet plant products and dry plant products.
By Voltage
- Medium Voltage
- High Voltage
- Extra High Voltage
On the basis of voltage, the Europe submarine cable system market is segmented into medium voltage, high voltage, and extra high voltage.
By Offering
- Maintenance
- Upgrades
- Installation and Commissioning
On the basis of offering, the Europe submarine cable system market is segmented into maintenance, upgrades, and installation and commissioning.
By Fiber Glass
- Unrepeatered
- Repeatered
On the basis of fiber glass, the Europe submarine cable system market is segmented into unrepeatered and repeatered.
By Cables Type
- Loose Tube Cables
- Ribbon Cables
- Others
On the basis of cables type, the Europe submarine cable system market is segmented into loose tube cables, ribbon cables and others.
By Armor Type
- Light Weight Armor
- Single Armor
- Double Armor
- Rock Armor
On the basis of armor type, the Europe submarine cable system market is segmented into light weight armor, single armor, double armor and rock armor.
By Depth
- 0 To 500 M
- 500 M-1000 M
- 1000 M-5000 M
- Others
On the basis of depth, the Europe submarine cable system market is segmented into 0 to 500m, 500m to 1000m, 1000m to 5000m, and others.
By Application
- Power Cables
- Communication Cables
On the basis of application, the Europe submarine cable system market is segmented into power cables and communication cables.
Submarine Cable System Market Regional Analysis/Insights
The submarine cable system market is analyzed, and market size insights and trends are provided by product, voltage, offering, fiber glass, cables type, armor type, depth, and application, as referenced above.
The countries covered in the submarine cable system market report are Germany, France, U.K., Netherlands, Switzerland, Belgium, Russia, Italy, Spain, Turkey and Rest of Europe.
U.K. dominates the Europe submarine cable system market. U.K. develops cloud-based solutions and services to improve security and contribute new levels of operational intelligence for governments, enterprises, transport, and communities. This will boost the demand for submarine cable system products in the Europe region.
The country section of the report also provides individual market-impacting factors and market regulation changes that impact the market's current and future trends. Data points like downstream and upstream value chain analysis, technical trends, porter's five forces analysis, and case studies are some of the pointers used to forecast the market scenario for individual countries. Also, the presence and availability of Europe brands and their challenges faced due to large or scarce competition from local and domestic brands, the impact of domestic tariffs, and trade routes are considered while providing a forecast analysis of the country data.
Competitive Landscape and Submarine Cable System Market Share Analysis
The submarine cable system market competitive landscape provides details of competitors. Details include company overview, company financials, revenue generated, market potential, investment in research and development, new market initiatives, Europe presence, production sites and facilities, production capacities, company strengths and weaknesses, product launch, product width and breadth, and application dominance. The above data points are only related to the companies focusing on the submarine cable system market.
Some of the major players operating in the submarine cable system market are HENGTONG GROUP CO., LTD, TE Connectivity, Saudi Ericsson, APAR, NEC Corporation, NXT A/S, Norddeutsche Seekabelwerke GmbH (A Subsidiary of Prysmian Group), JDR Cable Systems Ltd, ZTT, Hexatronic Group, Alcatel Submarine Networks, Corning Incorporated, The Okonite Company, AFL (a subsidiary of Fujikura Ltd.), LEONI, NEXANS, Ocean Specialists, Inc. (a subsidiary of Continental Shelf Associates, Inc.), TFKable, Sumitomo Electric Industries, Ltd., Tratos, Hellenic Cables S.A. and HESFIBEL SUBSEA CABLES among others.
SKU-
Obtenha acesso online ao relatório sobre a primeira nuvem de inteligência de mercado do mundo

- Painel interativo de análise de dados
- Painel de análise da empresa para oportunidades de elevado potencial de crescimento
- Acesso de analista de pesquisa para personalização e customização. consultas
- Análise da concorrência com painel interativo
- Últimas notícias, atualizações e atualizações Análise de tendências
- Aproveite o poder da análise de benchmark para um rastreio abrangente da concorrência
Índice
1 INTRODUÇÃO
1.1 OBJETIVOS DO ESTUDO
1.2 DEFINIÇÃO DE MERCADO
1.3 VISÃO GERAL DO MERCADO EUROPEU DE SISTEMAS DE CABOS SUBMARINOS
1.4 MOEDA E PREÇOS
1.5 LIMITAÇÕES
1.6 MERCADOS COBERTOS
2 SEGMENTAÇÃO DE MERCADO
2.1 MERCADOS COBERTOS
2,2 ANOS CONSIDERADOS PARA O ESTUDO
2.3 ÂMBITO GEOGRÁFICO
2.4 MODELO DE VALIDAÇÃO DE DADOS TRIPÉ DBMR
2.5 ENTREVISTAS PRINCIPAIS COM PRINCIPAIS LÍDERES DE OPINIÃO
2.6 GRADE DE POSIÇÃO DE MERCADO DBMR
2.7 ANÁLISE DA PARTICIPAÇÃO DO FORNECEDOR
2.8 GRADE DE COBERTURA DE APLICAÇÃO DE MERCADO
2.9 MODELAGEM MULTIVARIADA
2.1 CURVA DO PRODUTO
2.11 MATRIZ DE DESAFIOS
2.12 FONTES SECUNDÁRIAS
2.13 PREMISSAS
3 RESUMO EXECUTIVO
4 INSIGHTS PREMIUM
5 VISÃO GERAL DO MERCADO
5.1 MOTORISTAS
5.1.1 SURTO NOS PROJETOS DE COMUNICAÇÃO SUBMARINOS ATRAVÉS DO GLOBO
5.1.2 AUMENTO DA TENDÊNCIA DE GERAÇÃO DE ENERGIA EÓLICA OFFSHORE
5.1.3 CRESCENTE DEMANDA POR ALTA LARGURA DE BANDA, BAIXA LATÊNCIA E ALTA REDUNDÂNCIA DEVIDO AO SURGIMENTO DO 5G
5.1.4 AUMENTO NA ADOÇÃO DE SERVIÇOS BASEADOS EM NUVEM
5.2 RESTRIÇÕES
5.2.1 ALTOS INVESTIMENTOS INICIAIS FUNCIONAM COMO BARREIRA DE ENTRADA PARA PMEs
5.2.2 ALTA PROBABILIDADE DE DANOS DEVIDO A CONDIÇÕES VULNERÁVEIS
5.3 OPORTUNIDADES
5.3.1 PENETRAÇÃO DO CABO SUBMARINO DEVIDO AO AUMENTO DO TRÁFEGO DE INTERNET NA REGIÃO
5.3.2 AUMENTO DA PARCERIA ESTRATÉGICA ENTRE OS PRINCIPAIS PARTICIPANTES DO MERCADO DE SISTEMAS DE CABO
5.3.3 AUMENTO DOS INVESTIMENTOS DOS PROVEDORES DE OTT PARA CRIAR ABUNDANTES OPORTUNIDADES DE VENDAS DE CABOS SUBMARINOS
5.3.4 IMPLANTAÇÃO DE TECNOLOGIAS DIVERSAS EM SISTEMAS DE CABOS SUBMARINOS
5.4 DESAFIOS
5.4.1 MODOS ALTERNATIVOS DE PROVISÃO DE SERVIÇOS DE INTERNET
5.4.2 PROCEDIMENTOS DE REPARO COMPLEXOS
6 MERCADO EUROPEU DE SISTEMAS DE CABOS SUBMARINOS, POR PRODUTO
6.1 VISÃO GERAL
6.2 PRODUTOS VEGETAIS SECOS
6.2.1 EQUIPAMENTO DE ALIMENTAÇÃO ELÉTRICA (PFE)
6.2.2 EQUIPAMENTO TERMINAL DE LINHA SUBMARINA (SLTE)
6.2.3 MONITOR DE LINHA SUBMARINA (SLM)
6.2.4 OUTROS
6.3 PRODUTOS PARA PLANTAS ÚMIDAS
6.3.1 CABOS
6.3.2 REPETIDOR
6.3.3 UNIDADE DE RAMIFICAÇÃO (BU)
6.3.4 OUTROS
7 MERCADO EUROPEU DE SISTEMAS DE CABOS SUBMARINOS, POR TENSÃO
7.1 VISÃO GERAL
7.2 ALTA TENSÃO
7.3 TENSÃO EXTRA ALTA
7.4 MÉDIA TENSÃO
8 MERCADO EUROPEU DE SISTEMAS DE CABOS SUBMARINOS, OFERECENDO
8.1 VISÃO GERAL
8.2 INSTALAÇÃO E COMISSIONAMENTO
8.3 REPARO E MANUTENÇÃO
8.4 ATUALIZAÇÕES
9 MERCADO EUROPEU DE SISTEMAS DE CABOS SUBMARINOS, POR CLASSE DE FIBRA
9.1 VISÃO GERAL
9.2 NÃO REPETIDO
9.3 REPETIDO
10 MERCADO DE SISTEMAS DE CABOS SUBMARINOS DA EUROPA, POR TIPO DE CABOS
10.1 VISÃO GERAL
10.2 CABOS DE TUBOS FOLGADOS
10.3 CABOS DE FITA
10.4 OUTROS
11 MERCADO EUROPEU DE SISTEMAS DE CABOS SUBMARINOS, POR TIPO DE ARMADURA
11.1 VISÃO GERAL
11.2 ARMADURA ÚNICA
11.3 ARMADURA DUPLA
11.4 ARMADURA LEVE
11.5 ARMADURA DE ROCHA
12 MERCADO DE SISTEMAS DE CABOS SUBMARINOS DA EUROPA, POR PROFUNDIDADE
12.1 VISÃO GERAL
12,2 1000M-5000M
12,3 5000M-1000M
12,4 0M-500M
12,5 0 OUTROS
13 MERCADO EUROPEU DE SISTEMAS DE CABOS SUBMARINOS, POR APLICAÇÃO
13.1 VISÃO GERAL
13.2 CABOS DE COMUNICAÇÃO
13.2.1 PRODUTOS VEGETAIS SECOS
13.2.1.1 EQUIPAMENTO DE ALIMENTAÇÃO ELÉTRICA (PFE)
13.2.1.2 EQUIPAMENTO TERMINAL DE LINHA SUBMARINA (SLTE)
13.2.1.3 MONITOR DE LINHA SUBMARINA (SLM)
13.2.1.4 OUTROS
13.2.2 PRODUTOS VEGETAIS ÚMIDOS
13.2.2.1 CABOS
13.2.2.2 REPETIDOR
13.2.2.3 UNIDADE DE RAMIFICAÇÃO (BU)
13.2.2.4 OUTROS
13.3 CABOS DE ALIMENTAÇÃO
13.3.1 PRODUTOS VEGETAIS SECOS
13.3.1.1 EQUIPAMENTO DE ALIMENTAÇÃO ELÉTRICA (PFE)
13.3.1.2 EQUIPAMENTO TERMINAL DE LINHA SUBMARINA (SLTE)
13.3.1.3 MONITOR DE LINHA SUBMARINA (SLM)
13.3.1.4 OUTROS
13.3.2 PRODUTOS VEGETAIS ÚMIDOS
13.3.2.1 CABOS
13.3.2.2 REPETIDOR
13.3.2.3 UNIDADE DE RAMIFICAÇÃO (BU)
13.3.2.4 OUTROS
14 MERCADO EUROPEU DE SISTEMAS DE CABOS SUBMARINOS, POR REGIÃO
14.1 EUROPA
14.1.1 Reino Unido
14.1.2 ALEMANHA
14.1.3 ITÁLIA
14.1.4 FRANÇA
14.1.5 ESPANHA
14.1.6 TURQUIA
14.1.7 RÚSSIA
14.1.8 HOLANDA
14.1.9 BÉLGICA
14.1.10 SUÍÇA
14.1.11 RESTO DA EUROPA
15 MERCADO DE SISTEMAS DE CABOS SUBMARINOS DA EUROPA: PANORAMA DA EMPRESA
15.1 ANÁLISE DE AÇÕES DA EMPRESA: EUROPA
16 ANÁLISE SWOT
17 PERFIL DA EMPRESA
17,1 ZTT
17.1.1 RESUMO DA EMPRESA
17.1.2 ANÁLISE DAS AÇÕES DA EMPRESA
17.1.3 PORTFÓLIO DE PRODUTOS
17.1.4 DESENVOLVIMENTO RECENTE
17.2 GRUPO HENGTONG CO., LTDA.
17.2.1 RESUMO DA EMPRESA
17.2.2 ANÁLISE DAS AÇÕES DA EMPRESA
17.2.3 CATEGORIAS DE PRODUTOS
17.2.4 DESENVOLVIMENTO RECENTE
17.3 NKT A/S
17.3.1 RESUMO DA EMPRESA
17.3.2 ANÁLISE DE RECEITA
17.3.3 PORTFÓLIO DE PRODUTOS
17.3.4 DESENVOLVIMENTO RECENTE
17.4 CORNING INCORPORATED
17.4.1 RESUMO DA EMPRESA
17.4.2 ANÁLISE DE RECEITA
17.4.3 ANÁLISE DAS AÇÕES DA EMPRESA
17.4.4 PORTFÓLIO DE PRODUTOS
17.4.5 DESENVOLVIMENTO RECENTE
17,5 NEXANS
17.5.1 RESUMO DA EMPRESA
17.5.2 ANÁLISE DE RECEITA
17.5.3 ANÁLISE DE AÇÕES DA EMPRESA
17.5.4 PORTFÓLIO DE PRODUTOS
17.5.5 DESENVOLVIMENTOS RECENTES
17.6 HELLENIC CABLES SA
17.6.1 RESUMO DA EMPRESA
17.6.2 ANÁLISE DE RECEITA
17.6.3 PORTFÓLIO DE PRODUTOS
17.6.4 DESENVOLVIMENTOS RECENTES
17.7 REDES SUBMARINAS ALCATEL
17.7.1 RESUMO DA EMPRESA
17.7.2 PORTFÓLIO DE PRODUTOS
17.7.3 DESENVOLVIMENTOS RECENTES
17.8 AFL (UMA SUBSIDIÁRIA DA FUJIKURA LTD.)
17.8.1 RESUMO DA EMPRESA
17.8.2 ANÁLISE DE RECEITA
17.8.3 PORTFÓLIO DE PRODUTOS
17.8.4 DESENVOLVIMENTOS RECENTES
17,9 APAR
17.9.1 RESUMO DA EMPRESA
17.9.2 ANÁLISE DE RECEITA
17.9.3 PORTFÓLIO DE PRODUTOS
17.9.4 DESENVOLVIMENTO RECENTE
17.1 CABOS SUBMARINOS HESFIBEL
17.10.1 RESUMO DA EMPRESA
17.10.2 PORTFÓLIO DE PRODUTOS
17.10.3 DESENVOLVIMENTO RECENTE
17.11 GRUPO HEXATÔNICO
17.11.1 RESUMO DA EMPRESA
17.11.2 ANÁLISE DE RECEITA
17.11.3 PORTFÓLIO DE PRODUTOS
17.11.4 DESENVOLVIMENTO RECENTE
17.12 JDR CABLE SYSTEMS LTD.
17.12.1 RESUMO DA EMPRESA
17.12.2 PORTFÓLIO DE PRODUTOS
17.12.3 DESENVOLVIMENTO RECENTE
17.13 LEONI
17.13.1 RESUMO DA EMPRESA
17.13.2 ANÁLISE DE RECEITA
17.13.3 PORTFÓLIO DE PRODUTOS
17.13.4 DESENVOLVIMENTO RECENTE
17.14 CORPORAÇÃO NEC
17.14.1 RESUMO DA EMPRESA
17.14.2 ANÁLISE DE RECEITA
17.14.3 PORTFÓLIO DE PRODUTOS
17.14.4 DESENVOLVIMENTOS RECENTES
17.15 NORDEUTSCHE SEEKABELWERKE GMBH
17.15.1 RESUMO DA EMPRESA
17.15.2 PORTFÓLIO DE PRODUTOS
17.15.3 DESENVOLVIMENTO RECENTE
17.16 OCEAN SPECIALISTS, INC. (UMA SUBSIDIÁRIA DA CONTINENTAL SHELF ASSOCIATES, INC.)
17.16.1 RESUMO DA EMPRESA
17.16.2 PORTFÓLIO DE PRODUTOS
17.16.3 DESENVOLVIMENTOS RECENTES
17.17 SAUDITA ERICSSON
17.17.1 RESUMO DA EMPRESA
17.17.2 PORTFÓLIO DE SOLUÇÕES
17.17.3 DESENVOLVIMENTO RECENTE
17.18 SUMITOMO ELECTRIC INDUSTRIES, LTD.
17.18.1 RESUMO DA EMPRESA
17.18.2 ANÁLISE DE RECEITA
17.18.3 PORTFÓLIO DE PRODUTOS
17.18.4 DESENVOLVIMENTOS RECENTES
17.19 TE CONECTIVIDADE
17.19.1 RESUMO DA EMPRESA
17.19.2 ANÁLISE DE RECEITA
17.19.3 PORTFÓLIO DE SOLUÇÕES
17.19.4 DESENVOLVIMENTO RECENTE
17.2 TFKÁVEL
17.20.1 RESUMO DA EMPRESA
17.20.2 PORTFÓLIO DE PRODUTOS
17.20.3 DESENVOLVIMENTO RECENTE
17.21 A EMPRESA OKONITE
17.21.1 RESUMO DA EMPRESA
17.21.2 PORTFÓLIO DE PRODUTOS
17.21.3 DESENVOLVIMENTOS RECENTES
17.22 TRATOS
17.22.1 RESUMO DA EMPRESA
17.22.2 PORTFÓLIO DE PRODUTOS
17.22.3 DESENVOLVIMENTOS RECENTES
18 QUESTIONÁRIO
19 RELATÓRIOS RELACIONADOS
Lista de Tabela
TABELA 1 MERCADO EUROPEU DE SISTEMAS DE CABOS SUBMARINOS, POR PRODUTO, 2020-2029 (US$ MILHÕES)
TABELA 2 PRODUTOS DE PLANTAS SECAS DA EUROPA NO MERCADO DE SISTEMAS DE CABOS SUBMARINOS, POR REGIÃO, 2020-2029 (US$ MILHÕES)
TABELA 3 PRODUTOS DE PLANTAS SECAS NA EUROPA NO MERCADO DE SISTEMAS DE CABOS SUBMARINOS, POR TIPO, 2020-2029 (US$ MILHÕES)
TABELA 4 PRODUTOS DE PLANTAS ÚMIDAS DA EUROPA NO MERCADO DE SISTEMAS DE CABOS SUBMARINOS, POR REGIÃO, 2020-2029 (US$ MILHÕES)
TABELA 5 PRODUTOS DE PLANTAS ÚMIDAS NA EUROPA NO MERCADO DE SISTEMAS DE CABOS SUBMARINOS, POR TIPO, 2020-2029 (US$ MILHÕES)
TABELA 6 MERCADO EUROPEU DE SISTEMAS DE CABOS SUBMARINOS, POR TENSÃO, 2020-2029 (US$ MILHÕES)
TABELA 7 MERCADO EUROPEU DE ALTA TENSÃO EM SISTEMAS DE CABOS SUBMARINOS, POR REGIÃO, 2020-2029 (US$ MILHÕES)
TABELA 8 MERCADO EUROPEU DE SISTEMAS DE CABOS SUBMARINOS DE EXTRA ALTA TENSÃO, POR REGIÃO, 2020-2029 (US$ MILHÕES)
TABELA 9 MERCADO DE SISTEMAS DE CABOS SUBMARINOS DE MÉDIA TENSÃO NA EUROPA, POR REGIÃO, 2020-2029 (US$ MILHÕES)
TABELA 10 MERCADO EUROPEU DE SISTEMAS DE CABOS SUBMARINOS, POR OFERTA, 2020-2029 (US$ MILHÕES)
TABELA 11 INSTALAÇÃO E COMISSIONAMENTO NO MERCADO DE SISTEMAS DE CABOS SUBMARINOS NA EUROPA, POR REGIÃO, 2020-2029 (US$ MILHÕES)
TABELA 12 REPARO E MANUTENÇÃO NO MERCADO DE SISTEMAS DE CABOS SUBMARINOS NA EUROPA, POR REGIÃO, 2020-2029 (US$ MILHÕES)
TABELA 13 ATUALIZAÇÕES NO MERCADO DE SISTEMAS DE CABOS SUBMARINOS NA EUROPA, POR REGIÃO, 2020-2029 (US$ MILHÕES)
TABELA 14 MERCADO DE SISTEMAS DE CABOS SUBMARINOS NA EUROPA, POR CLASSE DE FIBRA, 2020-2029 (US$ MILHÕES)
TABELA 15 EUROPA NÃO REPETIDA NO MERCADO DE SISTEMAS DE CABOS SUBMARINOS, POR REGIÃO, 2020-2029 (US$ MILHÕES)
TABELA 16 EUROPA REPETIDA NO MERCADO DE SISTEMAS DE CABOS SUBMARINOS, POR REGIÃO, 2020-2029 (US$ MILHÕES)
TABELA 17 MERCADO DE SISTEMAS DE CABOS SUBMARINOS NA EUROPA, POR TIPO DE CABOS, 2020-2029 (US$ MILHÕES)
TABELA 18 CABOS LOOSE TUBE NA EUROPA NO MERCADO DE SISTEMAS DE CABOS SUBMARINOS, POR REGIÃO, 2020-2029 (US$ MILHÕES)
TABELA 19 CABOS DE FITA NA EUROPA NO MERCADO DE SISTEMAS DE CABOS SUBMARINOS, POR REGIÃO, 2020-2029 (US$ MILHÕES)
TABELA 20 OUTROS INDICADORES DA EUROPA NO MERCADO DE SISTEMAS DE CABOS SUBMARINOS, POR REGIÃO, 2020-2029 (US$ MILHÕES)
TABELA 21 MERCADO DE SISTEMAS DE CABOS SUBMARINOS NA EUROPA, POR TIPO DE ARMADURA, 2020-2029 (US$ MILHÕES)
TABELA 22 MERCADO EUROPEU DE SISTEMAS DE CABOS SUBMARINOS DE ARMADURA ÚNICA, POR REGIÃO, 2020-2029 (US$ MILHÕES)
TABELA 23 MERCADO EUROPEU DE SISTEMAS DE CABOS SUBMARINOS COM ARMADURA DUPLA, POR REGIÃO, 2020-2029 (US$ MILHÕES)
TABELA 24 MERCADO EUROPEU DE BLINDAGEM LEVE PARA SISTEMAS DE CABOS SUBMARINOS, POR REGIÃO, 2020-2029 (US$ MILHÕES)
TABELA 25 MERCADO DE SISTEMAS DE CABOS SUBMARINOS DE BLINDAGEM DE ROCHAS NA EUROPA, POR REGIÃO, 2020-2029 (US$ MILHÕES)
TABELA 26 MERCADO DE SISTEMAS DE CABOS SUBMARINOS NA EUROPA, POR PROFUNDIDADE, 2020-2029 (US$ MILHÕES)
TABELA 27 EUROPA 1000M-5000M NO MERCADO DE SISTEMAS DE CABOS SUBMARINOS, POR REGIÃO, 2020-2029 (US$ MILHÕES)
TABELA 28 MERCADO DE SISTEMAS DE CABOS SUBMARINOS NA EUROPA, 500 M-1000 M, POR REGIÃO, 2020-2029 (US$ MILHÕES)
TABELA 29 MERCADO DE SISTEMAS DE CABOS SUBMARINOS DE 0 M A 500 M NA EUROPA, POR REGIÃO, 2020-2029 (US$ MILHÕES)
TABELA 30 OUTROS INDICADORES DA EUROPA NO MERCADO DE SISTEMAS DE CABOS SUBMARINOS, POR REGIÃO, 2020-2029 (US$ MILHÕES)
TABELA 31 MERCADO EUROPEU DE SISTEMAS DE CABOS SUBMARINOS, POR APLICAÇÃO, 2020-2029 (US$ MILHÕES)
TABELA 32 CABOS DE COMUNICAÇÃO NA EUROPA NO MERCADO DE SISTEMAS DE CABOS SUBMARINOS, POR REGIÃO, 2020-2029 (US$ MILHÕES)
TABELA 33 MERCADO DE CABOS DE COMUNICAÇÃO NA EUROPA NO MERCADO DE SISTEMAS DE CABOS SUBMARINOS, POR TIPO, 2020-2029 (US$ MILHÕES)
TABELA 34 PRODUTOS DE PLANTAS SECAS DA EUROPA NO MERCADO DE CABOS DE COMUNICAÇÃO NO SISTEMA DE CABOS SUBMARINOS, POR TIPO, 2020-2029 (US$ MILHÕES)
TABELA 35 PRODUTOS DE PLANTAS ÚMIDAS DA EUROPA NO MERCADO DE CABOS DE COMUNICAÇÃO NO SISTEMA DE CABOS SUBMARINOS, POR TIPO, 2020-2029 (US$ MILHÕES)
TABELA 36 CABOS DE ENERGIA NO MERCADO DE SISTEMAS DE CABOS SUBMARINOS DA EUROPA, POR TIPO, 2020-2029 (US$ MILHÕES)
TABELA 37 MERCADO DE CABOS DE ENERGIA NA EUROPA NO SISTEMA DE CABOS SUBMARINOS, POR TIPO, 2020-2029 (US$ MILHÕES)
TABELA 38 PRODUTOS DE PLANTAS SECAS NA EUROPA NO MERCADO DE CABOS DE ENERGIA EM SISTEMAS DE CABOS SUBMARINOS, POR TIPO, 2020-2029 (US$ MILHÕES)
TABELA 39 PRODUTOS DE PLANTAS ÚMIDAS NA EUROPA NO MERCADO DE CABOS DE ENERGIA EM SISTEMAS DE CABOS SUBMARINOS, POR TIPO, 2020-2029 (US$ MILHÕES)
TABELA 40 MERCADO DE SISTEMAS DE CABOS SUBMARINOS NA EUROPA, POR PAÍS, 2020-2029 (US$ MILHÕES)
TABELA 41 MERCADO EUROPEU DE SISTEMAS DE CABOS SUBMARINOS, POR PRODUTO, 2020-2029 (US$ MILHÕES)
TABELA 42 PRODUTOS DE PLANTAS SECAS NA EUROPA NO MERCADO DE SISTEMAS DE CABOS SUBMARINOS, POR TIPO, 2020-2029 (US$ MILHÕES)
TABELA 43 PRODUTOS DE PLANTAS ÚMIDAS DA EUROPA NO MERCADO DE SISTEMAS DE CABOS SUBMARINOS, POR TIPO, 2020-2029 (US$ MILHÕES)
TABELA 44 MERCADO DE SISTEMAS DE CABOS SUBMARINOS NA EUROPA, POR TENSÃO, 2020-2029 (US$ MILHÕES)
TABELA 45 MERCADO EUROPEU DE SISTEMAS DE CABOS SUBMARINOS, POR OFERTA, 2020-2029 (US$ MILHÕES)
TABELA 46 MERCADO DE SISTEMAS DE CABOS SUBMARINOS NA EUROPA, POR CLASSE DE FIBRA, 2020-2029 (US$ MILHÕES)
TABELA 47 MERCADO DE SISTEMAS DE CABOS SUBMARINOS NA EUROPA, POR TIPO DE CABOS, 2020-2029 (US$ MILHÕES)
TABELA 48 MERCADO DE SISTEMAS DE CABOS SUBMARINOS NA EUROPA, POR TIPO DE ARMADURA, 2020-2029 (US$ MILHÕES)
TABELA 49 MERCADO DE SISTEMAS DE CABOS SUBMARINOS NA EUROPA, POR PROFUNDIDADE, 2020-2029 (US$ MILHÕES)
TABELA 50 MERCADO EUROPEU DE SISTEMAS DE CABOS SUBMARINOS, POR APLICAÇÃO, 2020-2029 (US$ MILHÕES)
TABELA 51 MERCADO DE CABOS DE COMUNICAÇÃO NA EUROPA NO MERCADO DE SISTEMAS DE CABOS SUBMARINOS, POR TIPO, 2020-2029 (US$ MILHÕES)
TABELA 52 PRODUTOS DE PLANTAS SECAS DA EUROPA NO MERCADO DE CABOS DE COMUNICAÇÃO NO SISTEMA DE CABOS SUBMARINOS, POR TIPO, 2020-2029 (US$ MILHÕES)
TABELA 53 PRODUTOS DE PLANTAS ÚMIDAS DA EUROPA NO MERCADO DE CABOS DE COMUNICAÇÃO NO SISTEMA DE CABOS SUBMARINOS, POR TIPO, 2020-2029 (US$ MILHÕES)
TABELA 54 MERCADO DE CABOS DE ENERGIA NA EUROPA NO MERCADO DE SISTEMAS DE CABOS SUBMARINOS, POR TIPO, 2020-2029 (US$ MILHÕES)
TABELA 55 PRODUTOS DE PLANTAS SECAS DA EUROPA NO MERCADO DE CABOS DE ENERGIA EM SISTEMAS DE CABOS SUBMARINOS, POR TIPO, 2020-2029 (US$ MILHÕES)
TABELA 56 PRODUTOS DE PLANTAS ÚMIDAS NA EUROPA NO MERCADO DE CABOS DE ENERGIA EM SISTEMAS DE CABOS SUBMARINOS, POR TIPO, 2020-2029 (US$ MILHÕES)
TABELA 57 MERCADO DE SISTEMAS DE CABOS SUBMARINOS DO REINO UNIDO, POR PRODUTO, 2020-2029 (US$ MILHÕES)
TABELA 58 PRODUTOS DE PLANTAS SECAS NO MERCADO DE SISTEMAS DE CABOS SUBMARINOS DO REINO UNIDO, POR TIPO, 2020-2029 (US$ MILHÕES)
TABELA 59 PRODUTOS DE PLANTAS ÚMIDAS DO REINO UNIDO NO MERCADO DE SISTEMAS DE CABOS SUBMARINOS, POR TIPO, 2020-2029 (US$ MILHÕES)
TABELA 60 MERCADO DE SISTEMAS DE CABOS SUBMARINOS DO REINO UNIDO, POR TENSÃO, 2020-2029 (US$ MILHÕES)
TABELA 61 MERCADO DE SISTEMAS DE CABOS SUBMARINOS DO REINO UNIDO, POR OFERTA, 2020-2029 (US$ MILHÕES)
TABELA 62 MERCADO DE SISTEMAS DE CABOS SUBMARINOS DO REINO UNIDO, POR CLASSE DE FIBRA, 2020-2029 (US$ MILHÕES)
TABELA 63 MERCADO DE SISTEMAS DE CABOS SUBMARINOS DO REINO UNIDO, POR TIPO DE CABOS, 2020-2029 (US$ MILHÕES)
TABELA 64 MERCADO DE SISTEMAS DE CABOS SUBMARINOS DO REINO UNIDO, POR TIPO DE ARMADURA, 2020-2029 (US$ MILHÕES)
TABELA 65 MERCADO DE SISTEMAS DE CABOS SUBMARINOS DO REINO UNIDO, POR PROFUNDIDADE, 2020-2029 (US$ MILHÕES)
TABELA 66 MERCADO DE SISTEMAS DE CABOS SUBMARINOS DO REINO UNIDO, POR APLICAÇÃO, 2020-2029 (US$ MILHÕES)
TABELA 67 CABOS DE COMUNICAÇÃO NO MERCADO DE SISTEMAS DE CABOS SUBMARINOS DO REINO UNIDO, POR TIPO, 2020-2029 (US$ MILHÕES)
TABELA 68 PRODUTOS DE PLANTAS SECAS DO REINO UNIDO NO MERCADO DE CABOS DE COMUNICAÇÃO EM SISTEMAS DE CABOS SUBMARINOS, POR TIPO, 2020-2029 (US$ MILHÕES)
TABELA 69 PRODUTOS DE PLANTAS ÚMIDAS DO REINO UNIDO NO MERCADO DE CABOS DE COMUNICAÇÃO EM SISTEMAS DE CABOS SUBMARINOS, POR TIPO, 2020-2029 (US$ MILHÕES)
TABELA 70: MERCADO DE CABOS DE ENERGIA NO REINO UNIDO PARA SISTEMAS DE CABOS SUBMARINOS, POR TIPO, 2020-2029 (US$ MILHÕES)
TABELA 71 PRODUTOS DE PLANTAS SECAS DO REINO UNIDO NO MERCADO DE CABOS DE ENERGIA EM SISTEMAS DE CABOS SUBMARINOS, POR TIPO, 2020-2029 (US$ MILHÕES)
TABELA 72 PRODUTOS DE PLANTAS ÚMIDAS DO REINO UNIDO NO MERCADO DE CABOS DE ENERGIA EM SISTEMAS DE CABOS SUBMARINOS, POR TIPO, 2020-2029 (US$ MILHÕES)
TABELA 73 MERCADO DE SISTEMAS DE CABOS SUBMARINOS DA ALEMANHA, POR PRODUTO, 2020-2029 (US$ MILHÕES)
TABELA 74 PRODUTOS DE PLANTAS SECAS DA ALEMANHA NO MERCADO DE SISTEMAS DE CABOS SUBMARINOS, POR TIPO, 2020-2029 (US$ MILHÕES)
TABELA 75 PRODUTOS DE PLANTAS ÚMIDAS DA ALEMANHA NO MERCADO DE SISTEMAS DE CABOS SUBMARINOS, POR TIPO, 2020-2029 (US$ MILHÕES)
TABELA 76 MERCADO DE SISTEMAS DE CABOS SUBMARINOS DA ALEMANHA, POR TENSÃO, 2020-2029 (US$ MILHÕES)
TABELA 77 MERCADO DE SISTEMAS DE CABOS SUBMARINOS DA ALEMANHA, POR OFERTA, 2020-2029 (US$ MILHÕES)
TABELA 78 MERCADO DE SISTEMAS DE CABOS SUBMARINOS DA ALEMANHA, POR CLASSE DE FIBRA, 2020-2029 (US$ MILHÕES)
TABELA 79 MERCADO DE SISTEMAS DE CABOS SUBMARINOS DA ALEMANHA, POR TIPO DE CABOS, 2020-2029 (US$ MILHÕES)
TABELA 80 MERCADO DE SISTEMAS DE CABOS SUBMARINOS DA ALEMANHA, POR TIPO DE ARMADURA, 2020-2029 (US$ MILHÕES)
TABELA 81 MERCADO DE SISTEMAS DE CABOS SUBMARINOS DA ALEMANHA, POR PROFUNDIDADE, 2020-2029 (US$ MILHÕES)
TABELA 82 MERCADO DE SISTEMAS DE CABOS SUBMARINOS DA ALEMANHA, POR APLICAÇÃO, 2020-2029 (US$ MILHÕES)
TABELA 83 CABOS DE COMUNICAÇÃO DA ALEMANHA NO MERCADO DE SISTEMAS DE CABOS SUBMARINOS, POR TIPO, 2020-2029 (US$ MILHÕES)
TABELA 84 PRODUTOS DE PLANTAS SECAS DA ALEMANHA NO MERCADO DE CABOS DE COMUNICAÇÃO NO SISTEMA DE CABOS SUBMARINOS, POR TIPO, 2020-2029 (US$ MILHÕES)
TABELA 85 PRODUTOS DE PLANTAS ÚMIDAS DA ALEMANHA NO MERCADO DE CABOS DE COMUNICAÇÃO NO SISTEMA DE CABOS SUBMARINOS, POR TIPO, 2020-2029 (US$ MILHÕES)
TABELA 86 CABOS DE ENERGIA NO MERCADO DE SISTEMAS DE CABOS SUBMARINOS DA ALEMANHA, POR TIPO, 2020-2029 (US$ MILHÕES)
TABELA 87 PRODUTOS DE PLANTAS SECAS DA ALEMANHA NO MERCADO DE CABOS DE ENERGIA EM SISTEMAS DE CABOS SUBMARINOS, POR TIPO, 2020-2029 (US$ MILHÕES)
TABELA 88 PRODUTOS DE PLANTAS ÚMIDAS DA ALEMANHA NO MERCADO DE CABOS DE ENERGIA NO SISTEMA DE CABOS SUBMARINOS, POR TIPO, 2020-2029 (US$ MILHÕES)
TABELA 89 MERCADO DE SISTEMAS DE CABOS SUBMARINOS DA ITÁLIA, POR PRODUTO, 2020-2029 (US$ MILHÕES)
TABELA 90 PRODUTOS DE PLANTAS SECAS DA ITÁLIA NO MERCADO DE SISTEMAS DE CABOS SUBMARINOS, POR TIPO, 2020-2029 (US$ MILHÕES)
TABELA 91 PRODUTOS DE PLANTAS ÚMIDAS DA ITÁLIA NO MERCADO DE SISTEMAS DE CABOS SUBMARINOS, POR TIPO, 2020-2029 (US$ MILHÕES)
TABELA 92 MERCADO DE SISTEMAS DE CABOS SUBMARINOS DA ITÁLIA, POR TENSÃO, 2020-2029 (US$ MILHÕES)
TABELA 93 MERCADO DE SISTEMAS DE CABOS SUBMARINOS DA ITÁLIA, POR OFERTA, 2020-2029 (US$ MILHÕES)
TABELA 94 MERCADO DE SISTEMAS DE CABOS SUBMARINOS DA ITÁLIA, POR CLASSE DE FIBRA, 2020-2029 (US$ MILHÕES)
TABELA 95 MERCADO DE SISTEMAS DE CABOS SUBMARINOS DA ITÁLIA, POR TIPO DE CABOS, 2020-2029 (US$ MILHÕES)
TABELA 96 MERCADO DE SISTEMAS DE CABOS SUBMARINOS DA ITÁLIA, POR TIPO DE ARMADURA, 2020-2029 (US$ MILHÕES)
TABELA 97 MERCADO DE SISTEMAS DE CABOS SUBMARINOS DA ITÁLIA, POR PROFUNDIDADE, 2020-2029 (US$ MILHÕES)
TABELA 98 MERCADO DE SISTEMAS DE CABOS SUBMARINOS DA ITÁLIA, POR APLICAÇÃO, 2020-2029 (US$ MILHÕES)
TABELA 99 CABOS DE COMUNICAÇÃO DA ITÁLIA NO MERCADO DE SISTEMAS DE CABOS SUBMARINOS, POR TIPO, 2020-2029 (US$ MILHÕES)
TABELA 100 PRODUTOS DE PLANTAS SECAS DA ITÁLIA NO MERCADO DE CABOS DE COMUNICAÇÃO NO SISTEMA DE CABOS SUBMARINOS, POR TIPO, 2020-2029 (US$ MILHÕES)
TABELA 101 ITÁLIA PRODUTOS DE PLANTAS ÚMIDAS NO MERCADO DE CABOS DE COMUNICAÇÃO NO SISTEMA DE CABOS SUBMARINOS, POR TIPO, 2020-2029 (US$ MILHÕES)
TABELA 102 MERCADO DE CABOS DE ENERGIA NA ITÁLIA NO SISTEMA DE CABOS SUBMARINOS, POR TIPO, 2020-2029 (US$ MILHÕES)
TABELA 103 ITÁLIA PRODUTOS DE PLANTAS SECAS NO MERCADO DE CABOS DE ENERGIA EM SISTEMAS DE CABOS SUBMARINOS, POR TIPO, 2020-2029 (US$ MILHÕES)
TABELA 104 ITÁLIA PRODUTOS DE PLANTAS ÚMIDAS NO MERCADO DE CABOS DE ENERGIA EM SISTEMAS DE CABOS SUBMARINOS, POR TIPO, 2020-2029 (US$ MILHÕES)
TABELA 105 MERCADO DE SISTEMAS DE CABOS SUBMARINOS DA FRANÇA, POR PRODUTO, 2020-2029 (US$ MILHÕES)
TABELA 106 PRODUTOS DE PLANTAS SECAS DA FRANÇA NO MERCADO DE SISTEMAS DE CABOS SUBMARINOS, POR TIPO, 2020-2029 (US$ MILHÕES)
TABELA 107 PRODUTOS DE PLANTAS ÚMIDAS DA FRANÇA NO MERCADO DE SISTEMAS DE CABOS SUBMARINOS, POR TIPO, 2020-2029 (US$ MILHÕES)
TABELA 108 MERCADO DE SISTEMAS DE CABOS SUBMARINOS DA FRANÇA, POR TENSÃO, 2020-2029 (US$ MILHÕES)
TABELA 109 MERCADO DE SISTEMAS DE CABOS SUBMARINOS DA FRANÇA, POR OFERTA, 2020-2029 (US$ MILHÕES)
TABELA 110 MERCADO DE SISTEMAS DE CABOS SUBMARINOS DA FRANÇA, POR CLASSE DE FIBRA, 2020-2029 (US$ MILHÕES)
TABELA 111 MERCADO DE SISTEMAS DE CABOS SUBMARINOS DA FRANÇA, POR TIPO DE CABOS, 2020-2029 (US$ MILHÕES)
TABELA 112 MERCADO DE SISTEMAS DE CABOS SUBMARINOS DA FRANÇA, POR TIPO DE ARMADURA, 2020-2029 (US$ MILHÕES)
TABELA 113 MERCADO DE SISTEMAS DE CABOS SUBMARINOS DA FRANÇA, POR PROFUNDIDADE, 2020-2029 (US$ MILHÕES)
TABELA 114 MERCADO DE SISTEMAS DE CABOS SUBMARINOS DA FRANÇA, POR APLICAÇÃO, 2020-2029 (US$ MILHÕES)
TABELA 115 CABOS DE COMUNICAÇÃO NA FRANÇA NO MERCADO DE SISTEMAS DE CABOS SUBMARINOS, POR TIPO, 2020-2029 (US$ MILHÕES)
TABELA 116 PRODUTOS DA FRANÇA DRY PLANT NO MERCADO DE CABOS DE COMUNICAÇÃO NO SISTEMA DE CABOS SUBMARINOS, POR TIPO, 2020-2029 (US$ MILHÕES)
TABELA 117 PRODUTOS DA FRANÇA WET PLANT NO MERCADO DE CABOS DE COMUNICAÇÃO NO SISTEMA DE CABOS SUBMARINOS, POR TIPO, 2020-2029 (US$ MILHÕES)
TABELA 118 FRANÇA CABO DE ENERGIA NO MERCADO DE SISTEMAS DE CABO SUBMARINO, POR TIPO, 2020-2029 (US$ MILHÕES)
TABELA 119 FRANÇA PRODUTOS DE PLANTAS SECAS NO MERCADO DE CABOS DE ENERGIA EM SISTEMAS DE CABOS SUBMARINOS, POR TIPO, 2020-2029 (US$ MILHÕES)
TABELA 120 PRODUTOS DE PLANTAS ÚMIDAS DA FRANÇA NO MERCADO DE CABOS DE ENERGIA EM SISTEMAS DE CABOS SUBMARINOS, POR TIPO, 2020-2029 (US$ MILHÕES)
TABELA 121 MERCADO ESPANHA DE SISTEMAS DE CABOS SUBMARINOS, POR PRODUTO, 2020-2029 (US$ MILHÕES)
TABELA 122 PRODUTOS DE PLANTAS SECAS NA ESPANHA NO MERCADO DE SISTEMAS DE CABOS SUBMARINOS, POR TIPO, 2020-2029 (US$ MILHÕES)
TABELA 123 PRODUTOS DE PLANTAS ÚMIDAS DA ESPANHA NO MERCADO DE SISTEMAS DE CABOS SUBMARINOS, POR TIPO, 2020-2029 (US$ MILHÕES)
TABELA 124 MERCADO DE SISTEMAS DE CABOS SUBMARINOS DA ESPANHA, POR TENSÃO, 2020-2029 (US$ MILHÕES)
TABELA 125 MERCADO ESPANHA DE SISTEMAS DE CABOS SUBMARINOS, POR OFERTA, 2020-2029 (US$ MILHÕES)
TABELA 126 MERCADO DE SISTEMAS DE CABOS SUBMARINOS DA ESPANHA, POR CLASSE DE FIBRA, 2020-2029 (US$ MILHÕES)
TABELA 127 MERCADO DE SISTEMAS DE CABOS SUBMARINOS DA ESPANHA, POR TIPO DE CABOS, 2020-2029 (US$ MILHÕES)
TABELA 128 MERCADO ESPANHA DE SISTEMAS DE CABOS SUBMARINOS, POR TIPO DE ARMADURA, 2020-2029 (US$ MILHÕES)
TABELA 129 MERCADO DE SISTEMAS DE CABOS SUBMARINOS DA ESPANHA, POR PROFUNDIDADE, 2020-2029 (US$ MILHÕES)
TABELA 130 MERCADO ESPANHA DE SISTEMAS DE CABOS SUBMARINOS, POR APLICAÇÃO, 2020-2029 (US$ MILHÕES)
TABELA 131 CABOS DE COMUNICAÇÃO NA ESPANHA NO MERCADO DE SISTEMAS DE CABOS SUBMARINOS, POR TIPO, 2020-2029 (US$ MILHÕES)
TABELA 132 ESPANHA PRODUTOS DE PLANTAS SECAS NO MERCADO DE CABOS DE COMUNICAÇÃO NO SISTEMA DE CABOS SUBMARINOS, POR TIPO, 2020-2029 (US$ MILHÕES)
TABELA 133 PRODUTOS DE PLANTAS ÚMIDAS DA ESPANHA NO MERCADO DE CABOS DE COMUNICAÇÃO NO SISTEMA DE CABOS SUBMARINOS, POR TIPO, 2020-2029 (US$ MILHÕES)
TABELA 134 CABOS DE ENERGIA NA ESPANHA NO MERCADO DE SISTEMAS DE CABOS SUBMARINOS, POR TIPO, 2020-2029 (US$ MILHÕES)
TABELA 135 PRODUTOS DE PLANTAS SECAS DA ESPANHA NO MERCADO DE CABOS DE ENERGIA EM SISTEMAS DE CABOS SUBMARINOS, POR TIPO, 2020-2029 (US$ MILHÕES)
TABELA 136 PRODUTOS DE PLANTAS ÚMIDAS DA ESPANHA NO MERCADO DE CABOS DE ENERGIA EM SISTEMAS DE CABOS SUBMARINOS, POR TIPO, 2020-2029 (US$ MILHÕES)
TABELA 137 MERCADO DE SISTEMAS DE CABOS SUBMARINOS DA TURQUIA, POR PRODUTO, 2020-2029 (US$ MILHÕES)
TABELA 138 PRODUTOS DE PLANTAS SECAS DA TURQUIA NO MERCADO DE SISTEMAS DE CABOS SUBMARINOS, POR TIPO, 2020-2029 (US$ MILHÕES)
TABELA 139 PRODUTOS DE PLANTAS ÚMIDAS DA TURQUIA NO MERCADO DE SISTEMAS DE CABOS SUBMARINOS, POR TIPO, 2020-2029 (US$ MILHÕES)
TABELA 140 MERCADO DE SISTEMAS DE CABOS SUBMARINOS DA TURQUIA, POR TENSÃO, 2020-2029 (US$ MILHÕES)
TABELA 141 MERCADO DE SISTEMAS DE CABOS SUBMARINOS DA TURQUIA, POR OFERTA, 2020-2029 (US$ MILHÕES)
TABELA 142 MERCADO DE SISTEMAS DE CABOS SUBMARINOS DA TURQUIA, POR CLASSE DE FIBRA, 2020-2029 (US$ MILHÕES)
TABELA 143 MERCADO DE SISTEMAS DE CABOS SUBMARINOS DA TURQUIA, POR TIPO DE CABOS, 2020-2029 (US$ MILHÕES)
TABELA 144 MERCADO DE SISTEMAS DE CABOS SUBMARINOS DA TURQUIA, POR TIPO DE BLINDAGEM, 2020-2029 (US$ MILHÕES)
TABELA 145 MERCADO DE SISTEMAS DE CABOS SUBMARINOS DA TURQUIA, POR PROFUNDIDADE, 2020-2029 (US$ MILHÕES)
TABELA 146 MERCADO DE SISTEMAS DE CABOS SUBMARINOS DA TURQUIA, POR APLICAÇÃO, 2020-2029 (US$ MILHÕES)
TABELA 147 CABO DE COMUNICAÇÃO DA TURQUIA NO MERCADO DE SISTEMAS DE CABO SUBMARINO, POR TIPO, 2020-2029 (US$ MILHÕES)
TABELA 148 PRODUTOS DA PLANTA SECA DA TURQUIA NO MERCADO DE CABOS DE COMUNICAÇÃO NO SISTEMA DE CABOS SUBMARINOS, POR TIPO, 2020-2029 (US$ MILHÕES)
TABELA 149 PRODUTOS DA TURQUIA WET PLANT NO MERCADO DE CABOS DE COMUNICAÇÃO NO SISTEMA DE CABOS SUBMARINOS, POR TIPO, 2020-2029 (US$ MILHÕES)
TABELA 150 CABOS DE ENERGIA DA TURQUIA NO MERCADO DE SISTEMAS DE CABOS SUBMARINOS, POR TIPO, 2020-2029 (US$ MILHÕES)
TABELA 151 PRODUTOS DE PLANTAS SECAS DA TURQUIA NO MERCADO DE CABOS DE ENERGIA NO SISTEMA DE CABOS SUBMARINOS, POR TIPO, 2020-2029 (US$ MILHÕES)
TABELA 152 PRODUTOS DE PLANTAS ÚMIDAS DA TURQUIA NO MERCADO DE CABOS DE ENERGIA NO SISTEMA DE CABOS SUBMARINOS, POR TIPO, 2020-2029 (US$ MILHÕES)
TABELA 153 MERCADO DE SISTEMAS DE CABOS SUBMARINOS DA RÚSSIA, POR PRODUTO, 2020-2029 (US$ MILHÕES)
TABELA 154 PRODUTOS DE PLANTAS SECAS DA RÚSSIA NO MERCADO DE SISTEMAS DE CABOS SUBMARINOS, POR TIPO, 2020-2029 (US$ MILHÕES)
TABELA 155 PRODUTOS DE PLANTAS ÚMIDAS DA RÚSSIA NO MERCADO DE SISTEMAS DE CABOS SUBMARINOS, POR TIPO, 2020-2029 (US$ MILHÕES)
TABELA 156 MERCADO DE SISTEMAS DE CABOS SUBMARINOS DA RÚSSIA, POR TENSÃO, 2020-2029 (US$ MILHÕES)
TABELA 157 MERCADO DE SISTEMAS DE CABOS SUBMARINOS DA RÚSSIA, POR OFERTA, 2020-2029 (US$ MILHÕES)
TABELA 158 MERCADO DE SISTEMAS DE CABOS SUBMARINOS DA RÚSSIA, POR CLASSE DE FIBRA, 2020-2029 (US$ MILHÕES)
TABELA 159 MERCADO DE SISTEMAS DE CABOS SUBMARINOS DA RÚSSIA, POR TIPO DE CABOS, 2020-2029 (US$ MILHÕES)
TABELA 160 MERCADO DE SISTEMAS DE CABOS SUBMARINOS DA RÚSSIA, POR TIPO DE ARMADURA, 2020-2029 (US$ MILHÕES)
TABELA 161 MERCADO DE SISTEMAS DE CABOS SUBMARINOS DA RÚSSIA, POR PROFUNDIDADE, 2020-2029 (US$ MILHÕES)
TABELA 162 MERCADO DE SISTEMAS DE CABOS SUBMARINOS DA RÚSSIA, POR APLICAÇÃO, 2020-2029 (US$ MILHÕES)
TABELA 163 CABOS DE COMUNICAÇÃO DA RÚSSIA NO MERCADO DE SISTEMAS DE CABOS SUBMARINOS, POR TIPO, 2020-2029 (US$ MILHÕES)
TABELA 164 PRODUTOS DE PLANTAS SECAS DA RÚSSIA NO MERCADO DE CABOS DE COMUNICAÇÃO NO SISTEMA DE CABOS SUBMARINOS, POR TIPO, 2020-2029 (US$ MILHÕES)
TABELA 165 PRODUTOS DE PLANTAS ÚMIDAS DA RÚSSIA NO MERCADO DE CABOS DE COMUNICAÇÃO NO SISTEMA DE CABOS SUBMARINOS, POR TIPO, 2020-2029 (US$ MILHÕES)
TABELA 166 CABOS DE ENERGIA NA RÚSSIA NO MERCADO DE SISTEMAS DE CABOS SUBMARINOS, POR TIPO, 2020-2029 (US$ MILHÕES)
TABELA 167 PRODUTOS DE PLANTAS SECAS DA RÚSSIA NO MERCADO DE CABOS DE ENERGIA EM SISTEMAS DE CABOS SUBMARINOS, POR TIPO, 2020-2029 (US$ MILHÕES)
TABELA 168 PRODUTOS DE PLANTAS ÚMIDAS DA RÚSSIA NO MERCADO DE CABOS DE ENERGIA EM SISTEMAS DE CABOS SUBMARINOS, POR TIPO, 2020-2029 (US$ MILHÕES)
TABELA 169 MERCADO HOLANDÊS DE SISTEMAS DE CABOS SUBMARINOS, POR PRODUTO, 2020-2029 (US$ MILHÕES)
TABELA 170 PRODUTOS DE PLANTAS SECAS DA HOLANDA NO MERCADO DE SISTEMAS DE CABOS SUBMARINOS, POR TIPO, 2020-2029 (US$ MILHÕES)
TABELA 171 PRODUTOS PARA PLANTAS ÚMIDAS NA HOLANDA NO MERCADO DE SISTEMAS DE CABOS SUBMARINOS, POR TIPO, 2020-2029 (US$ MILHÕES)
TABELA 172 MERCADO HOLANDÊS DE SISTEMAS DE CABOS SUBMARINOS, POR TENSÃO, 2020-2029 (US$ MILHÕES)
TABELA 173 MERCADO HOLANDÊS DE SISTEMAS DE CABOS SUBMARINOS, POR OFERTA, 2020-2029 (US$ MILHÕES)
TABELA 174 MERCADO HOLANDÊS DE SISTEMAS DE CABOS SUBMARINOS, POR CLASSE DE FIBRA, 2020-2029 (US$ MILHÕES)
TABELA 175 MERCADO HOLANDÊS DE SISTEMAS DE CABOS SUBMARINOS, POR TIPO DE CABOS, 2020-2029 (US$ MILHÕES)
TABELA 176 MERCADO HOLANDÊS DE SISTEMAS DE CABOS SUBMARINOS, POR TIPO DE ARMADURA, 2020-2029 (US$ MILHÕES)
TABELA 177 MERCADO HOLANDÊS DE SISTEMAS DE CABOS SUBMARINOS, POR PROFUNDIDADE, 2020-2029 (US$ MILHÕES)
TABELA 178 MERCADO HOLANDÊS DE SISTEMAS DE CABOS SUBMARINOS, POR APLICAÇÃO, 2020-2029 (US$ MILHÕES)
TABELA 179 CABOS DE COMUNICAÇÃO HOLANDESES NO MERCADO DE SISTEMAS DE CABOS SUBMARINOS, POR TIPO, 2020-2029 (US$ MILHÕES)
TABELA 180 PRODUTOS DE PLANTAS SECAS DA HOLANDA NO MERCADO DE CABOS DE COMUNICAÇÃO NO SISTEMA DE CABOS SUBMARINOS, POR TIPO, 2020-2029 (US$ MILHÕES)
TABELA 181 PRODUTOS DE PLANTAS ÚMIDAS DA HOLANDA NO MERCADO DE CABOS DE COMUNICAÇÃO NO SISTEMA DE CABOS SUBMARINOS, POR TIPO, 2020-2029 (US$ MILHÕES)
TABELA 182 MERCADO HOLANDÊS DE CABOS DE ENERGIA NO SISTEMA DE CABOS SUBMARINOS, POR TIPO, 2020-2029 (US$ MILHÕES)
TABELA 183 PRODUTOS DE PLANTAS SECAS DA HOLANDA NO MERCADO DE CABOS DE ENERGIA EM SISTEMAS DE CABOS SUBMARINOS, POR TIPO, 2020-2029 (US$ MILHÕES)
TABELA 184 PRODUTOS DE PLANTAS ÚMIDAS DA HOLANDA NO MERCADO DE CABOS DE ENERGIA EM SISTEMAS DE CABOS SUBMARINOS, POR TIPO, 2020-2029 (US$ MILHÕES)
TABELA 185 MERCADO BÉLGICO DE SISTEMAS DE CABOS SUBMARINOS, POR PRODUTO, 2020-2029 (US$ MILHÕES)
TABELA 186 PRODUTOS DE PLANTAS SECAS DA BÉLGICA NO MERCADO DE SISTEMAS DE CABOS SUBMARINOS, POR TIPO, 2020-2029 (US$ MILHÕES)
TABELA 187 PRODUTOS PARA PLANTAS ÚMIDAS DA BÉLGICA NO MERCADO DE SISTEMAS DE CABOS SUBMARINOS, POR TIPO, 2020-2029 (US$ MILHÕES)
TABELA 188 MERCADO BÉLGICO DE SISTEMAS DE CABOS SUBMARINOS, POR TENSÃO, 2020-2029 (US$ MILHÕES)
TABELA 189 MERCADO BÉLGICO DE SISTEMAS DE CABOS SUBMARINOS, POR OFERTA, 2020-2029 (US$ MILHÕES)
TABELA 190 MERCADO BÉLGICO DE SISTEMAS DE CABOS SUBMARINOS, POR CLASSE DE FIBRA, 2020-2029 (US$ MILHÕES)
TABELA 191 MERCADO BÉLGICO DE SISTEMAS DE CABOS SUBMARINOS, POR TIPO DE CABOS, 2020-2029 (US$ MILHÕES)
TABELA 192 MERCADO BÉLGICO DE SISTEMAS DE CABOS SUBMARINOS, POR TIPO DE ARMADURA, 2020-2029 (US$ MILHÕES)
TABELA 193 MERCADO BÉLGICO DE SISTEMAS DE CABOS SUBMARINOS, POR PROFUNDIDADE, 2020-2029 (US$ MILHÕES)
TABELA 194 MERCADO BÉLGICO DE SISTEMAS DE CABOS SUBMARINOS, POR APLICAÇÃO, 2020-2029 (US$ MILHÕES)
TABELA 195 CABOS DE COMUNICAÇÃO DA BÉLGICA NO MERCADO DE SISTEMAS DE CABOS SUBMARINOS, POR TIPO, 2020-2029 (US$ MILHÕES)
TABELA 196 PRODUTOS DE PLANTAS SECAS DA BÉLGICA NO MERCADO DE CABOS DE COMUNICAÇÃO NO SISTEMA DE CABOS SUBMARINOS, POR TIPO, 2020-2029 (US$ MILHÕES)
TABELA 197 BÉLGICA PRODUTOS DE PLANTAS ÚMIDAS NO MERCADO DE CABOS DE COMUNICAÇÃO EM SISTEMAS DE CABOS SUBMARINOS, POR TIPO, 2020-2029 (US$ MILHÕES)
TABELA 198 CABOS DE ENERGIA DA BÉLGICA NO MERCADO DE SISTEMAS DE CABOS SUBMARINOS, POR TIPO, 2020-2029 (US$ MILHÕES)
TABELA 199 BÉLGICA PRODUTOS DE PLANTAS SECAS NO MERCADO DE CABOS DE ENERGIA EM SISTEMAS DE CABOS SUBMARINOS, POR TIPO, 2020-2029 (US$ MILHÕES)
TABELA 200 PRODUTOS DE PLANTAS ÚMIDAS DA BÉLGICA NO MERCADO DE CABOS DE ENERGIA EM SISTEMAS DE CABOS SUBMARINOS, POR TIPO, 2020-2029 (US$ MILHÕES)
TABELA 201 MERCADO DE SISTEMAS DE CABOS SUBMARINOS DA SUÍÇA, POR PRODUTO, 2020-2029 (US$ MILHÕES)
TABELA 202 PRODUTOS DE USINAS SECAS DA SUÍÇA NO MERCADO DE SISTEMAS DE CABOS SUBMARINOS, POR TIPO, 2020-2029 (US$ MILHÕES)
TABELA 203 PRODUTOS DE PLANTAS ÚMIDAS DA SUÍÇA NO MERCADO DE SISTEMAS DE CABOS SUBMARINOS, POR TIPO, 2020-2029 (US$ MILHÕES)
TABELA 204 MERCADO DE SISTEMAS DE CABOS SUBMARINOS DA SUÍÇA, POR TENSÃO, 2020-2029 (US$ MILHÕES)
TABELA 205 MERCADO DE SISTEMAS DE CABOS SUBMARINOS DA SUÍÇA, POR OFERTA, 2020-2029 (US$ MILHÕES)
TABELA 206 MERCADO DE SISTEMAS DE CABOS SUBMARINOS DA SUÍÇA, POR CLASSE DE FIBRA, 2020-2029 (US$ MILHÕES)
TABELA 207 MERCADO DE SISTEMAS DE CABOS SUBMARINOS DA SUÍÇA, POR TIPO DE CABOS, 2020-2029 (US$ MILHÕES)
TABELA 208 MERCADO DE SISTEMAS DE CABOS SUBMARINOS DA SUÍÇA, POR TIPO DE ARMADURA, 2020-2029 (US$ MILHÕES)
TABELA 209 MERCADO DE SISTEMAS DE CABOS SUBMARINOS DA SUÍÇA, POR PROFUNDIDADE, 2020-2029 (US$ MILHÕES)
TABELA 210 MERCADO DE SISTEMAS DE CABOS SUBMARINOS DA SUÍÇA, POR APLICAÇÃO, 2020-2029 (US$ MILHÕES)
TABELA 211 CABO DE COMUNICAÇÃO DA SUÍÇA NO MERCADO DE SISTEMAS DE CABO SUBMARINO, POR TIPO, 2020-2029 (US$ MILHÕES)
TABELA 212 PRODUTOS DE USINAS SECAS DA SUÍÇA NO MERCADO DE CABOS DE COMUNICAÇÃO NO SISTEMA DE CABOS SUBMARINOS, POR TIPO, 2020-2029 (US$ MILHÕES)
TABELA 213 PRODUTOS DE PLANTAS ÚMIDAS DA SUÍÇA NO MERCADO DE CABOS DE COMUNICAÇÃO NO SISTEMA DE CABOS SUBMARINOS, POR TIPO, 2020-2029 (US$ MILHÕES)
TABELA 214 MERCADO DE CABOS DE ENERGIA DA SUÍÇA NO SISTEMA DE CABOS SUBMARINOS, POR TIPO, 2020-2029 (US$ MILHÕES)
TABELA 215 PRODUTOS DE PLANTAS SECAS DA SUÍÇA NO MERCADO DE CABOS DE ENERGIA NO SISTEMA DE CABOS SUBMARINOS, POR TIPO, 2020-2029 (US$ MILHÕES)
TABELA 216 PRODUTOS DE PLANTAS ÚMIDAS DA SUÍÇA NO MERCADO DE CABOS DE ENERGIA NO SISTEMA DE CABOS SUBMARINOS, POR TIPO, 2020-2029 (US$ MILHÕES)
TABELA 217 MERCADO DE SISTEMAS DE CABOS SUBMARINOS NO RESTO DA EUROPA, POR PRODUTO, 2020-2029 (US$ MILHÕES)
Lista de Figura
FIGURA 1 MERCADO EUROPEU DE SISTEMAS DE CABOS SUBMARINOS: SEGMENTAÇÃO
FIGURA 2 MERCADO EUROPEU DE SISTEMAS DE CABOS SUBMARINOS: TRIANGULAÇÃO DE DADOS
FIGURA 3 MERCADO EUROPEU DE SISTEMAS DE CABOS SUBMARINOS: ANÁLISE DROC
FIGURA 4 MERCADO EUROPEU DE SISTEMAS DE CABOS SUBMARINOS: ANÁLISE DE MERCADO EUROPEU VS. REGIONAL
FIGURA 5 MERCADO EUROPEU DE SISTEMAS DE CABOS SUBMARINOS: ANÁLISE DE PESQUISA DA EMPRESA
FIGURA 6 MERCADO EUROPEU DE SISTEMAS DE CABOS SUBMARINOS: DEMOGRAFIA DA ENTREVISTA
FIGURA 7 MERCADO EUROPEU DE SISTEMAS DE CABOS SUBMARINOS: GRADE DE POSIÇÃO DE MERCADO DBMR
FIGURA 8 MERCADO EUROPEU DE SISTEMAS DE CABOS SUBMARINOS: ANÁLISE DA PARTICIPAÇÃO DE FORNECEDORES
FIGURA 9 MERCADO EUROPEU DE SISTEMAS DE CABOS SUBMARINOS: APLICAÇÃO DE MERCADO COBERTURA GRADE
FIGURA 10 MERCADO EUROPEU DE SISTEMAS DE CABOS SUBMARINOS: SEGMENTAÇÃO
FIGURA 11 O AUMENTO NOS PROJETOS DE COMUNICAÇÃO SUBMARINOS ATRAVÉS DO MUNDO DEVE IMPULSIONAR O MERCADO EUROPEU DE SISTEMAS DE CABOS SUBMARINOS NO PERÍODO PREVISTO
FIGURA 12 O SEGMENTO DE PRODUTOS DE PLANTAS SECAS DEVE SER RESPONSÁVEL PELA MAIOR PARCIALIDADE DO MERCADO EUROPEU DE SISTEMAS DE CABOS SUBMARINOS DE 2022 A 2029
FIGURA 13 MOTIVADORES, RESTRIÇÕES, OPORTUNIDADES E DESAFIOS DO MERCADO EUROPEU DE SISTEMAS DE CABOS SUBMARINOS
FIGURA 14 PROJETOS DE IDE PARA COMUNICAÇÕES E MÍDIA (2019-2020)
FIGURA 15 GERAÇÃO DE ENERGIA ELÉTRICA EÓLICA OFFSHORE
FIGURA 16 EXPANSÕES LÍQUIDAS ANUAIS DA CAPACIDADE EÓLICA, 2018-2020
FIGURA 17 MERCADO EUROPEU DE SISTEMAS DE CABOS SUBMARINOS, POR PRODUTO, 2021
FIGURA 18 MERCADO EUROPEU DE SISTEMAS DE CABOS SUBMARINOS, POR TENSÃO, 2021
FIGURA 19 MERCADO EUROPEU DE SISTEMAS DE CABOS SUBMARINOS, POR OFERTA, 2021
FIGURA 20 MERCADO EUROPEU DE SISTEMAS DE CABOS SUBMARINOS, POR CLASSE DE FIBRA, 2021
FIGURA 21 MERCADO EUROPEU DE SISTEMAS DE CABOS SUBMARINOS, POR TIPO DE CABOS, 2021
FIGURA 22 MERCADO EUROPEU DE SISTEMAS DE CABOS SUBMARINOS, POR TIPO DE ARMADURA, 2021
FIGURA 23 MERCADO EUROPEU DE SISTEMAS DE CABOS SUBMARINOS, POR PROFUNDIDADE, 2021
FIGURA 24 MERCADO EUROPEU DE SISTEMAS DE CABOS SUBMARINOS: POR APLICAÇÃO, 2021
FIGURA 25 MERCADO EUROPEU DE SISTEMAS DE CABOS SUBMARINOS: RESUMO (2021)
FIGURA 26 MERCADO DE SISTEMAS DE CABOS SUBMARINOS DA EUROPA: POR PAÍS (2021)
FIGURA 27 MERCADO EUROPEU DE SISTEMAS DE CABOS SUBMARINOS: POR PAÍS (2022 E 2029)
FIGURA 28 MERCADO EUROPEU DE SISTEMAS DE CABOS SUBMARINOS: POR PAÍS (2021 E 2029)
FIGURA 29 MERCADO EUROPEU DE SISTEMAS DE CABOS SUBMARINOS: POR PRODUTO (2022-2029)
FIGURA 30 MERCADO DE SISTEMAS DE CABOS SUBMARINOS NA EUROPA: PARTICIPAÇÃO DA EMPRESA EM 2021 (%)
Metodologia de Investigação
A recolha de dados e a análise do ano base são feitas através de módulos de recolha de dados com amostras grandes. A etapa inclui a obtenção de informações de mercado ou dados relacionados através de diversas fontes e estratégias. Inclui examinar e planear antecipadamente todos os dados adquiridos no passado. Da mesma forma, envolve o exame de inconsistências de informação observadas em diferentes fontes de informação. Os dados de mercado são analisados e estimados utilizando modelos estatísticos e coerentes de mercado. Além disso, a análise da quota de mercado e a análise das principais tendências são os principais fatores de sucesso no relatório de mercado. Para saber mais, solicite uma chamada de analista ou abra a sua consulta.
A principal metodologia de investigação utilizada pela equipa de investigação do DBMR é a triangulação de dados que envolve a mineração de dados, a análise do impacto das variáveis de dados no mercado e a validação primária (especialista do setor). Os modelos de dados incluem grelha de posicionamento de fornecedores, análise da linha de tempo do mercado, visão geral e guia de mercado, grelha de posicionamento da empresa, análise de patentes, análise de preços, análise da quota de mercado da empresa, normas de medição, análise global versus regional e de participação dos fornecedores. Para saber mais sobre a metodologia de investigação, faça uma consulta para falar com os nossos especialistas do setor.
Personalização disponível
A Data Bridge Market Research é líder em investigação formativa avançada. Orgulhamo-nos de servir os nossos clientes novos e existentes com dados e análises que correspondem e atendem aos seus objetivos. O relatório pode ser personalizado para incluir análise de tendências de preços de marcas-alvo, compreensão do mercado para países adicionais (solicite a lista de países), dados de resultados de ensaios clínicos, revisão de literatura, mercado remodelado e análise de base de produtos . A análise de mercado dos concorrentes-alvo pode ser analisada desde análises baseadas em tecnologia até estratégias de carteira de mercado. Podemos adicionar quantos concorrentes necessitar de dados no formato e estilo de dados que procura. A nossa equipa de analistas também pode fornecer dados em tabelas dinâmicas de ficheiros Excel em bruto (livro de factos) ou pode ajudá-lo a criar apresentações a partir dos conjuntos de dados disponíveis no relatório.

