Europe Sugar Substitutes Market
Tamanho do mercado em biliões de dólares
CAGR :
% 
 USD
9.10 Billion
USD
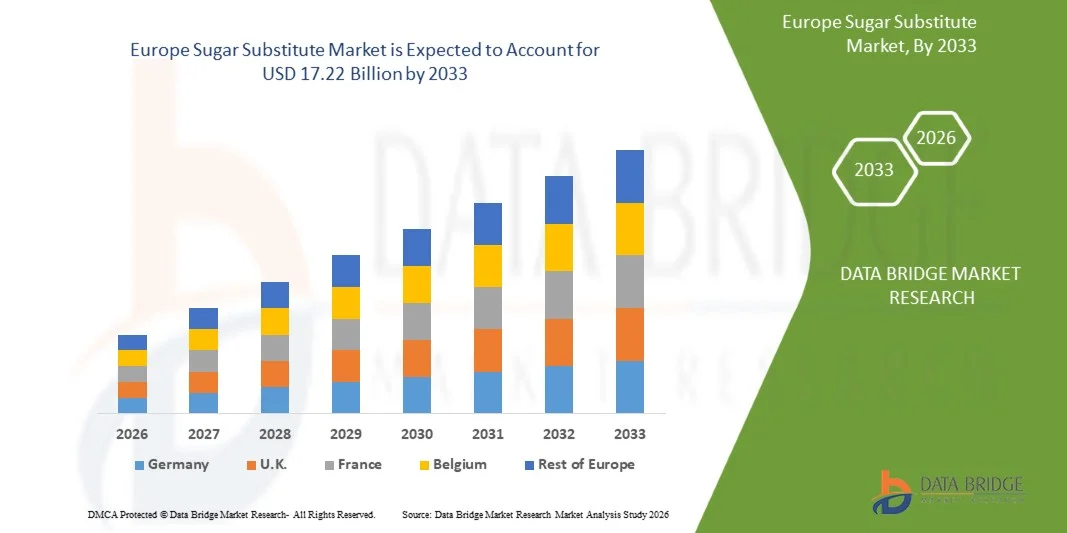
17.22 Billion
2025
2033
USD
9.10 Billion
USD
17.22 Billion
2025
2033
| 2026 –2033 | |
| USD 9.10 Billion | |
| USD 17.22 Billion | |
| % | |
|
Europa Mercado substituto de açúcar, por tipo (Sarups de alta fruta, Adoçantes de alta intensidade, e Adoçantes de baixa intensidade), Forma (Cristalizado, Líquido e Pó), Categoria (Natural e Sintético), Aplicação (Beberagens, Alimentos, Cuidados Orais, Farmacêutica e Outros) - Tendências e Previsão da Indústria para 2033
Europa Substituto de AçúcarVisão geral do mercado
O mercado europeu do açúcar substituto foi avaliado emUSD 9.10 Bilhões em 2025e é projetado para alcançarUSD 17,22 Milhões por 2033, crescendo emCAGR de 8,3% de 2026 a 2033O mercado vive um crescimento consistente, impulsionado pelo aumento da sensibilização dos consumidores em relação às preocupações de saúde relacionadas com o açúcar, pelo aumento da procura de produtos alimentares de baixa calorias e diabéticos, e pela adopção crescente de ingredientes de adoçante de rótulo limpo em toda a indústria alimentar e de bebidas. A expansão da utilização de adoçantes naturais em alimentos funcionais, bebidas e produtos nutracêuticos, juntamente com a inovação contínua em tecnologias de redução de açúcar, está apoiando ainda mais a expansão do mercado em economias desenvolvidas e emergentes.
O crescente foco global em hábitos alimentares mais saudáveis e iniciativas de redução de açúcar, aliadas ao aumento da prevalência de obesidade e diabetes, está incentivando os fabricantes de alimentos a incorporar soluções alternativas de adoçante em formulações de produtos. Os substitutos de açúcar estão sendo cada vez mais utilizados em bebidas, produtos de padaria, confeitaria, produtos lácteos, produtos farmacêuticos e aplicações de cuidados orais para manter a doçura, reduzindo o conteúdo calórico. O aumento do apoio regulamentar para produtos alimentares com açúcar reduzido e o aumento da preferência dos consumidores por ingredientes de origem vegetal e natural estão a acelerar ainda mais a adopção nas indústrias mundiais de transformação de alimentos.
Principais tendências do mercado e perspectivas
- A Alemanha dominou o mercado europeu de substitutos de açúcar com a maior parte de receita de 19,5% em 2025, apoiado pela forte demanda do consumidor por produtos alimentares de baixo açúcar e saúde orientada para a saúde, alta consciência dos riscos de diabetes e obesidade, e indústrias bem estabelecidas de processamento de alimentos e bebidas
- O segmento de pó liderou o mercado com uma participação de 72,12% em 2025, impulsionado pelo seu uso extensivo em padarias, confeitarias, laticínios e aplicações de adoçantes de mesa
- K. é esperado para ser o país de crescimento mais rápido em um CAGR de 5,8% de 2026 a 2033, alimentado pelo aumento da preferência do consumidor por rótulo limpo e adoçantes à base de plantas, aumento da demanda por bebidas funcionais, e crescente consciência de saúde sobre o consumo de açúcar
- Natural é o tipo de categoria de crescimento mais rápido, projetado para registrar um CAGR de 9,28% de 2026 a 2033, apoiado pelo aumento da inclinação do consumidor para ingredientes de marca limpa e de origem natural
- O segmento de adoçantes de alta intensidade dominou a categoria tipo com uma participação de 61,34% de receita em 2025, liderado pelo aumento da demanda do consumidor por produtos alimentares de baixa calorias e sem açúcar entre as categorias de bebidas, padaria e alimentos processados
- O segmento sintético representou 56,90% do mercado em 2025, preferencial pela sua relação custo-efetividade, alta intensidade de doçura e ampla disponibilidade comercial.
- O segmento farmacêutico é a categoria de aplicação de crescimento mais rápido, com um CAGR de 9,13% de 2026 a 2033, impulsionado pelo aumento do uso de substitutos de açúcar em xaropes, comprimidos mastigáveis, nutracêuticos e formulações medicinais amigas do diabético
Tamanho e previsão do mercado
- Valor de mercado (2025): USD 9.10 Bilhões
- Valor de mercado esperado (2033): USD 17.22 Bilhões
- Previsões CAGR (2026-2033): 8,3%
- País líder em 2025: Alemanha
- País de crescimento mais rápido: Reino Unido
Âmbito do relatório e Europa substituto do açúcarSegmentação do mercado
|
Atributos |
Chave de Substituição de AçúcarPerspectivas de mercado |
|
Segmentos Cobertos |
|
|
Países abrangidos |
Europa · Alemanha · França · U.K. · Países Baixos · Suíça · Bélgica · Rússia · Itália · Espanha · Turquia · Resto da Europa |
|
Jogadores do mercado chave |
|
|
Oportunidades de Mercado |
· Expansão de Substitutos de Açúcar em Bebidas Funcionais e Fortificadas · Cultivar a utilização de adoçantes à base de plantas em aplicações de padaria e confeitaria · Aumento da adoção de alternativas de açúcar em formulações farmacêuticas e nutracêutico |
|
Informações sobre o Valor Adicionado |
Além dos insights sobre cenários de mercado, como valor de mercado, taxa de crescimento, segmentação, cobertura geográfica e principais atores, os relatórios de mercado curados pela Data Bridge Market Research também incluem análise de especialistas em profundidade, análise de preços, análise de compartilhamento de marca, inquérito ao consumidor, análise demografia, análise da cadeia de suprimentos, análise da cadeia de valor, visão geral da matéria-prima/consumíveis, critérios de seleção de fornecedores, Análise de PESTLE, Análise de Porter e marco regulatório. |
Europa Açúcar substituto mercado tendências
Tendência: Crescimento de Adoçantes Natural Clean-Label
O mercado de substitutos de açúcar está testemunhando forte adoção de adoçantes naturais e de rótulo limpo impulsionados pelo aumento da preferência do consumidor por alternativas de açúcar à base de plantas, não sintético em alimentos e bebidas. A crescente demanda por stevia, frutos monges e outros adoçantes botânicos está remodelando formulações de produtos em bebidas, padarias e aplicações de laticínios. Os fabricantes de alimentos estão reformulando os produtos para reduzir aditivos artificiais e alinhar com preferências alimentares mais saudáveis, especialmente em mercados desenvolvidos.
Empresas como Cargill, Incorporated e Ingredion estão expandindo ativamente seus portfólios baseados em stevia através de inovações na otimização de gostos e soluções de mistura para melhorar a aceitação do consumidor de adoçantes naturais.
Europa Açúcar substituto mercado dinâmica
Motorista do mercado chave: aumento da demanda por produtos de baixo teor de cálcio
A crescente prevalência de obesidade e diabetes está a conduzir significativamente a procura de produtos alimentares com baixas calorias e sem açúcar nos mercados mundiais. Os fabricantes de alimentos e bebidas estão adotando amplamente substitutos de açúcar para manter a doçura, reduzindo o impacto glicêmico em bebidas, doces e alimentos processados. Iniciativas de redução de açúcar lideradas pelo governo e regulamentos de rotulagem nutricional estão apoiando a penetração no mercado de edulcorantes alternativos.
Empresas como Tate & Lyle e Ajinomoto Health & Nutrition North America, Inc. estão expandindo seus portfólios de adoçantes de baixas calorias, incluindo adoçantes à base de stevia e aminoácidos, para atender à crescente demanda por formulações amigas do diabetes.
Restrição/Desafio de Chave: Limitações de Sabor e Formulação de Substitutos
Apesar do forte crescimento da demanda, substitutos de açúcar enfrentam desafios relacionados ao sabor, solubilidade e estabilidade em formulações alimentares complexas. Adoçantes de alta intensidade muitas vezes requerem sistemas de mistura para replicar perfis de sabor tipo açúcar, aumentando a complexidade da formulação para os fabricantes. Essas limitações podem restringir a adoção em produtos de padaria e confeitaria premium onde a experiência sensorial é crítica.
Empresas como Roquette Frères e BENEO estão investindo em tecnologias avançadas de formulação e soluções baseadas em poliol para melhorar o mascaramento de gosto e o desempenho funcional em aplicações de redução de açúcar.
Oportunidade de Mercado Chave: Expansão em Bebidas Funcionais
A crescente demanda por bebidas funcionais, incluindo bebidas esportivas, bebidas energéticas e águas fortificadas, está criando fortes oportunidades de adoção de substitutos de açúcar. Os fabricantes estão cada vez mais incorporando adoçantes de baixa caloria para aumentar o apelo do produto, ao mesmo tempo que atendem as expectativas dos consumidores focadas na saúde. O aumento do consumo de bebidas prontas para beber e de bebidas nutracêuticos está a acelerar ainda mais a expansão do mercado.
Empresas como Cargill, Incorporated e JK Sucralose Inc. estão fornecendo ativamente adoçantes de alto desempenho adaptados para aplicações de bebidas, apoiando esforços de reformulação em larga escala em marcas globais de bebidas.
Europa Açúcar substituto âmbito de mercado
O mercado substituto do açúcar é segmentado com base no tipo, forma, categoria e aplicação.
- Por Tipo
Com base no tipo, o mercado de substitutos de açúcar é segmentado em xaropes de alta frutose, adoçantes de alta intensidade e adoçantes de baixa intensidade. O segmento de Adoçantes de Alta Intensidade dominou o mercado com a maior participação de 61,34% em 2025, impulsionado pelo aumento da demanda do consumidor por produtos alimentares de baixa caloria e sem açúcar entre as categorias de bebidas, padaria e alimentos processados. Aumentar a conscientização sobre obesidade, diabetes e consumo excessivo de açúcar está incentivando os fabricantes a adotar adoçantes de alta intensidade, como stevia, sucralose e aspartamo em formulações alimentares de grande escala. O segmento se beneficia da forte utilização em bebidas gaseificadas e bebidas funcionais, onde a doçura com impacto calórico mínimo é altamente preferida. A inovação contínua em tecnologias de mascar e formulações de produtos melhoradas estão a apoiar ainda mais a aceitação dos consumidores. O alargamento das aprovações das autoridades de segurança alimentar nas principais economias continua a reforçar a posição de liderança do segmento.
O segmento de xaropes de alta frutose é projetado para registrar o crescimento mais rápido em um CAGR de 8,12% de 2026 para 2033, impulsionado pelo aumento da demanda da indústria de alimentos e bebidas processados para soluções de adoçamento de alta estabilidade e custo-efetividade. Xaropes de alta frutose são amplamente utilizados em bebidas carbonatadas, sucos embalados, produtos de padaria e aplicações de confeitaria devido à sua retenção de doçura superior e vida útil prolongada. O aumento do consumo de alimentos de conveniência e bebidas prontas para beber nas economias emergentes está a acelerar ainda mais a adopção dos produtos. Os fabricantes estão cada vez mais preferindo xaropes de alta frutose por causa de suas facilidades de mistura e eficiente compatibilidade de produção em larga escala.
- Pelo Formulário
Com base na forma, o mercado de substitutos de açúcar é segmentado em cristalizado, líquido e pó. O segmento Powder dominou o mercado com uma parcela de 72,12% em 2025, apoiada pelo seu uso extensivo em padarias, confeitarias, laticínios e aplicações de adoçantes de mesa. Os substitutos de açúcar em pó fornecem excelentes propriedades de mistura, maior prazo de validade e facilidade de transporte, tornando-os altamente adequados para operações de fabricação de alimentos em grande escala. O segmento também se beneficia com a crescente demanda de adoçantes à base de saqueta usados em cafés, restaurantes e consumo doméstico. Forte compatibilidade com sistemas de processamento de alimentos secos e formulações de alimentos embalados continua a melhorar a adoção industrial. A crescente utilização de adoçantes naturais em pó em produtos centrados na saúde reforça ainda mais a dominância do mercado.
O segmento Líquido é projetado para registrar o crescimento mais rápido em um CAGR de 7,95% de 2026 a 2033, impulsionado pela crescente demanda por bebidas prontas para beber, xaropes aromatizados e produtos nutricionais líquidos. Os substitutos de açúcar líquido são cada vez mais preferidos na fabricação de bebidas devido à sua solubilidade superior e facilidade de formulação em bebidas frias e quentes. O crescente consumo de refrigerantes de baixa caloria, bebidas energéticas e produtos de água aromatizada está acelerando a demanda nas indústrias globais de bebidas. Os avanços nas tecnologias de estabilização e preservação do adoçante líquido estão melhorando a qualidade do produto e o desempenho da prateleira. Expandir o uso em xaropes farmacêuticos e formulações de saúde bucal também está contribuindo significativamente para o crescimento do segmento.
- Por Categoria
Com base na categoria, o mercado de substitutos de açúcar é segmentado em natural e sintético. O segmento sintético dominou o mercado com a maior parcela de 56,90% em 2025, impulsionada pela sua relação custo-efetividade, alta intensidade de doçura e ampla disponibilidade comercial. Adoçantes sintéticos como aspartame, sacarina e sucralose são amplamente utilizados em bebidas carbonatadas, alimentos embalados e produtos farmacêuticos devido à sua estabilidade e escalabilidade na produção industrial. O segmento beneficia de uma forte penetração na produção de alimentos e bebidas no mercado de massa, onde a eficiência de preços continua a ser um fator de compra fundamental. A demanda contínua das indústrias de alimentos processados e a expansão de portfólios de produtos de baixo teor de açúcar estão apoiando o consumo global em larga escala. Fortes aprovações regulatórias em vários países reforçam ainda mais a liderança do segmento no mercado.
O segmento Natural é projetado para registrar o crescimento mais rápido em um CAGR de 9,28% de 2026 para 2033, impulsionado pelo aumento da inclinação do consumidor para ingredientes de marca limpa e de origem natural. Preocupações crescentes com os efeitos a longo prazo sobre a saúde dos aditivos artificiais estão incentivando os fabricantes de alimentos a mudar para alternativas naturais, como stevia, frutos monges e taumatina. A crescente demanda por bebidas orgânicas, lanches saudáveis e produtos de nutrição funcional está acelerando significativamente a adoção em categorias de produtos premium. Avanços tecnológicos na extração de adoçantes naturais e aprimoramento do sabor estão melhorando a aceitação do sabor entre os consumidores. O aumento dos investimentos das empresas de alimentos em fornecimento sustentável de ingredientes à base de plantas está a reforçar a expansão futura do mercado.
- Por Aplicação
Com base na aplicação, o mercado de substitutos de açúcar é segmentado em bebidas, produtos alimentares, cuidados orais, farmacêuticos, entre outros. O segmento Bebidas dominou o mercado com uma participação de 44,70% em 2025, impulsionada pela crescente demanda global por refrigerantes de baixa calorias, água aromatizada, bebidas esportivas e bebidas energéticas sem açúcar. Os fabricantes de bebidas estão cada vez mais incorporando substitutos de açúcar para reduzir o teor de calorias, mantendo a doçura e consistência de sabor em produtos. O segmento beneficia da crescente conscientização do consumidor sobre as condições de saúde relacionadas ao açúcar, incluindo obesidade e diabetes. Forte inovação em bebidas funcionais e bebidas fortificadas está aumentando ainda mais o uso de soluções alternativas de adoçante. Expandir iniciativas regulatórias promovendo a redução de açúcar em todas as indústrias de bebidas continuam a apoiar o domínio do segmento.
O segmento Farmacêutico é projetado para registrar o crescimento mais rápido em um CAGR de 9,13% de 2026 a 2033, impulsionado pelo aumento do uso de substitutos de açúcar em xaropes, comprimidos para mastigar, nutracêuticos e formulações medicinais para diabéticos. Os fabricantes farmacêuticos estão focados em melhorar a conformidade do paciente, melhorando os perfis de paladar sem aumentar o teor de açúcar em medicamentos. O aumento da prevalência de doenças crónicas e diabetes está a incentivar o desenvolvimento de produtos terapêuticos de baixa açúcar em aplicações de cuidados de saúde pediátricos e adultos. Avanços em tecnologias excipientes e estabilidade da formulação estão melhorando a compatibilidade de substitutos de açúcar na produção farmacêutica. A expansão crescente das indústrias nutracêuticos e de bem-estar está a acelerar ainda mais a adopção nos mercados globais de saúde.
Europa açúcar substituto mercado análise regional
A Alemanha dominou o mercado substituto do açúcar e representou a maior parcela de receita de 19,5% em 2025, impulsionada pela forte demanda do consumidor por produtos alimentares de baixo açúcar e saúde orientada, alta consciência dos riscos de diabetes e obesidade e indústrias bem estabelecidas de processamento de alimentos e bebidas. O país tem um ecossistema alimentar funcional maduro onde a redução de açúcar é uma prioridade de formulação fundamental em aplicações de padaria, laticínios, confeitaria e bebidas. A forte presença dos principais fabricantes de ingredientes e a adoção generalizada de stevia, polióis e adoçantes de alta intensidade reforçam ainda mais a liderança da Alemanha no mercado regional. O aumento da penetração a retalho de produtos sem açúcar e de calorias reduzidas, juntamente com políticas rigorosas de redução do açúcar da UE, continua a reforçar a expansão do mercado em todo o país.
U.K. Sugar Substitute Market Insight
O mercado do Reino Unido está previsto para crescer constantemente e é projetado para registrar o CAGR mais rápido de 5,8% durante 2026-2033, impulsionado pelo aumento da preferência do consumidor por rótulo limpo e adoçantes à base de plantas, aumento da demanda por bebidas funcionais, e crescente consciência de saúde sobre o consumo de açúcar. Os fabricantes de alimentos e bebidas no país estão ativamente reformulando os produtos para reduzir o teor de açúcar em resposta às políticas governamentais de imposto de açúcar e regulamentos de rotulagem nutricional. Forte crescimento em bebidas premium, nutrição esportiva e produtos de confeitaria de baixa caloria está acelerando ainda mais a adoção de substitutos de açúcar. A expansão da inovação em adoçantes naturais, como misturas baseadas em stevia e formulações de frutos monges, apoiadas por empresas como Tate & Lyle, continua a melhorar o desenvolvimento de produtos e o crescimento do mercado em todo o Reino Unido.
França açúcar substituto mercado por dentro
Prevê-se que o mercado francês cresça de forma constante de 2026 para 2033, apoiado pela crescente procura dos consumidores por alternativas alimentares mais saudáveis, pelo aumento da penetração de bebidas com baixo teor de açúcar e pela forte adopção de ingredientes com rótulo limpo em toda a indústria de transformação de alimentos. Os consumidores franceses são altamente responsivos aos adoçantes naturais e à base de plantas, levando ao uso mais amplo de stevia, polióis e outras soluções de redução de açúcar em produtos de padaria, laticínios e confeitaria. A ênfase regulamentar na redução do açúcar e na transparência nutricional encoraja ainda mais os fabricantes a reformular os produtos com sistemas alternativos de adoçante. Forte presença de fornecedores globais de ingredientes e inovação em formulações alimentares funcionais continuam a apoiar a expansão do mercado a longo prazo em todo o país.
Europa Açúcar substituto Market Share
A indústria de substitutos de açúcar é liderada principalmente por empresas bem estabelecidas, incluindo:
- zuchem Inc. (EUA)
- Ingredion (EUA)
- BENEO (Bélgica)
- Cargill, Incorporated (EUA)
- DuPont (EUA)
- Foodchem International Corporation (China)
- JK Sucralose Inc. (China)
- HYET Sweet (EUA)
- Roquette Frères (França)
- Mitsui Sugar Co., Ltd.
- ADM (EUA)
- Tate & Lyle (U.K.)
- Marcas Pyure LLC (EUA)
- PureCircle (Japão)
- Ajinomoto Health & Nutrition North America, Inc. (EUA)
- NutraSweet Co. (EUA)
- MAFCO Worldwide LLC (EUA)
- Matsutani Chemical Industry Co., Ltd. (Japão)
Últimos desenvolvimentos na Europa açúcar substituto Mercado
- Em novembro de 2025, a Cargill expandiu seu portfólio de adoçantes de última geração com novas soluções de redução de açúcar à base de plantas projetadas para bebidas e alimentos funcionais. O desenvolvimento reforçou a posição da empresa no mercado de ingredientes com rótulo limpo, apoiando a crescente demanda do fabricante por sistemas de baixo teor calórico e de adoçante de origem natural. Espera-se que o lançamento acelere a inovação em formulações de redução de açúcar e melhore a adoção em aplicações de alimentos e bebidas voltadas para a saúde
- Em novembro de 2024, Tate & Lyle completaram a aquisição da CP Kelco por 1,8 bilhão de dólares para fortalecer seu portfólio global de ingredientes alimentares especializados. A aquisição melhorou significativamente as capacidades da empresa em tecnologias de edulcoração, sensação bucal e fortificação, possibilitando uma inovação mais ampla dos produtos em aplicações de baixo teor de açúcar e alimentos com baixas calorias. Espera-se que esta expansão estratégica intensifique a concorrência e apoie a crescente procura global de soluções de ingredientes mais saudáveis
- Em julho de 2024, Roquette fez parceria com Bonumose para melhorar a escalabilidade comercial da produção de tagatose para aplicações alternativas de açúcar. A colaboração combinou tecnologia avançada de processamento enzimático com a experiência em adoçante à base de amido para fortalecer a eficiência de produção e expandir a disponibilidade de adoçantes de baixa glicemia. Prevê-se que este desenvolvimento apoie a procura crescente de produtos de confeitaria e produtos alimentares funcionais amigos do diabético a nível mundial
- Em junho de 2024, o Fooditive Group introduziu Keto-Fructose, um adoçante sustentável produzido a partir de fluxos de resíduos de maçã e pera para apoiar iniciativas econômicas circulares na indústria de ingredientes alimentares. A inovação destacou o crescente foco da indústria em substitutos de açúcar ambientalmente sustentáveis, ao mesmo tempo que aborda a demanda do consumidor por alternativas naturais e de baixa calorias. Espera-se que a avaliação FDA GRAS aumente ainda mais as oportunidades de adoção comercial em mercados de bebidas e alimentos processados
- Em julho de 2023, Tate & Lyle lançaram a TASTEVA SOL Stevia Sweetener para expandir seu portfólio avançado de adoçantes à base de stevia para fabricantes de alimentos e bebidas. A tecnologia patenteada abordou os desafios de solubilidade associados às formulações de stevia, possibilitando melhor desempenho gustativo e flexibilidade de formulação em produtos reduzidos a açúcar. Esta inovação reforçou a capacidade da empresa de apoiar a crescente demanda do consumidor por produtos alimentares mais saudáveis, de baixa calorias e naturalmente adoçados
SKU-
Obtenha acesso online ao relatório sobre a primeira nuvem de inteligência de mercado do mundo

- Painel interativo de análise de dados
- Painel de análise da empresa para oportunidades de elevado potencial de crescimento
- Acesso de analista de pesquisa para personalização e customização. consultas
- Análise da concorrência com painel interativo
- Últimas notícias, atualizações e atualizações Análise de tendências
- Aproveite o poder da análise de benchmark para um rastreio abrangente da concorrência
Índice
1 INTRODUÇÃO
1.1 OBJETIVOS DO ESTUDO
1.2 DEFINIÇÃO DE MERCADO
1.3 VISÃO GERAL DO MERCADO EUROPEU DE SUBSTITUTOS DO AÇÚCAR
1.4 MOEDA E PREÇOS
1.5 LIMITAÇÕES
1.6 MERCADOS COBERTOS
2 SEGMENTAÇÃO DE MERCADO
2.1 MERCADOS COBERTOS
2.2 ÂMBITO GEOGRÁFICO
2,3 ANOS CONSIDERADOS PARA O ESTUDO
2.4 MODELO DE VALIDAÇÃO DE DADOS TRIPÉ DBMR
2.5 ENTREVISTAS PRINCIPAIS COM PRINCIPAIS LÍDERES DE OPINIÃO
2.6 GRADE DE POSIÇÃO DE MERCADO DBMR
2.7 ANÁLISE DA PARTICIPAÇÃO DO FORNECEDOR
2.8 MODELAGEM MULTIVARIADA
2.9 CURVA DO CRONOGRAMA DO PRODUTO
2.1 GRADE DE COBERTURA DE APLICAÇÃO DE MERCADO
2.11 FONTES SECUNDÁRIAS
2.12 PREMISSAS
3 VISÃO GERAL DO MERCADO
3.1 MOTORISTAS
3.1.1 CRESCENTE NÚMERO DE POPULAÇÃO OBESIVA E DIABÉTICA
3.1.2 TENDÊNCIA CRESCENTE DE ESTILO DE VIDA SAUDÁVEL E PRODUTOS SAUDÁVEIS
3.1.3 AUMENTO DO USO DE SUBSTITUTOS DO AÇÚCAR EM ALIMENTOS E PRODUTOS DE PADARIA
3.1.4 AUMENTO DA DEMANDA POR ADOÇANTES NATURAIS/DE ORIGEM VEGETAL
3.1.5 FLUTUAÇÃO DOS PREÇOS DO AÇÚCAR E AUMENTO DA TRIBUTAÇÃO SOBRE OS PRODUTOS AÇÚCARES
3.2 RESTRIÇÕES
3.2.1 REGULAMENTOS E POLÍTICAS RIGOROSAS PARA SUBSTITUTOS DE AÇÚCAR
3.2.2 EFEITOS COLATERAIS DO SUBSTITUTO DO AÇÚCAR
3.3 OPORTUNIDADES
3.3.1 CONSUMO CRESCENTE DE BEBIDAS SAUDÁVEIS E NUTRICIONAIS COM SUBSTITUTOS DE AÇÚCAR
3.3.2 AUMENTANDO A CONSCIENTIZAÇÃO SOBRE SUBSTITUTOS DO AÇÚCAR NOS PAÍSES EM DESENVOLVIMENTO
3.3.3 FORTES INICIATIVAS E ESTUDOS PARA O DESENVOLVIMENTO DO PRODUTO
3.3.4 NOVAS REGRAS DE ROTULAGEM DE AÇÚCAR
3.4 DESAFIOS
3.4.1 MAIS ESFORÇOS PARA MELHORAR O SABOR
3.4.2 DIVERSIDADE SOBRE OS BENEFÍCIOS DOS SUBSTITUTOS DO AÇÚCAR
4 RESUMO EXECUTIVO
5 INSIGHTS PREMIUM
5.1 ANÁLISE DO MERCADO-MÃE
5.2 CRESCIMENTO ESPERADO DO USO DE ADOÇANTES NOS PRÓXIMOS 3 ANOS
6 MERCADOS DE SUBSTITUTOS DO AÇÚCAR NA EUROPA, POR TIPO
6.1 VISÃO GERAL
6.2 XAROPE RICOS EM FRUTOSE
6.3 ADOÇANTES DE ALTA INTENSIDADE
6.3.1 ASPARTAME
6.3.2 CICLAMATO
6.3.3 ACE-K
6.3.4 SACARINA
6.3.5 ESTÉVIA
6.3.6 SACROLOSE
6.3.7 MEL
6.3.8 GLICIRRIZINA
6.3.9 ALITAME
6.3.10 NEOTAME
6.3.11 OUTROS
6.4 ADOÇANTES DE BAIXA INTENSIDADE
6.4.1 ERITRITOL
6.4.2 MALTITOL
6.4.3 SORBITOL
6.4.4 XILITOL
6.4.5 ISOMALTE
6.4.6 HIDROISTOS DE AMIDO HIDROGENADOS
6.4.7 MANITOL
6.4.8 LACITOL
6.4.9 D-TAGATOSE
6.4.10 TREALOSE
6.4.11 OUTROS
7 MERCADO EUROPEU DE SUBSTITUTOS DO AÇÚCAR, POR FORMA
7.1 VISÃO GERAL
7.2 CRISTALIZADO
7.3 LÍQUIDO
7.4 PÓ
8 MERCADO EUROPEU DE SUBSTITUTOS DO AÇÚCAR, POR APLICAÇÃO
8.1 VISÃO GERAL
8.2 BEBIDAS
8.2.1 REFRIGERANTES GASEIFICADOS
8.2.2 BEBIDAS SABORIZADAS
8.2.3 BEBIDAS EM PÓ
8.2.3.1 CAFÉ RTD
8.2.3.2 CHÁ RTD
8.2.3.3 SMOOTHIES
8.2.3.4 OUTROS
8.2.4 SUCOS
8.2.5 BEBIDAS ALTERNATIVAS AO LEITE
8.2.6 BEBIDAS FUNCIONAIS
8.2.7 OUTROS
8.3 PRODUTOS ALIMENTARES
8.3.1 PRODUTOS LÁCTEOS
8.3.1.1 SORVETE
8.3.1.2 COBERTURAS
8.3.1.3 Iogurtes
8.3.1.4 PUDIM
8.3.1.5 OUTROS
8.3.2 PRODUTOS DE PADARIA
8.3.2.1 COOKIES E BISCOITOS
8.3.2.2 BOLOS E PASTÉIS
8.3.2.3 MUFFINS E DONUTS
8.3.2.4 PÃES E PÃES
8.3.2.5 OUTROS
8.3.3 CONFEITARIA
8.3.3.1 CHOCOLATE
8.3.3.2 GOMAS E MARSHMALLOWS
8.3.3.3 BALAS DURAS
8.3.3.4 OUTROS
8.3.4 ADOÇANTE DE MESA
8.3.5 BARRAS NUTRICIONAIS
8.3.6 CEREAIS MATINAIS
8.3.7 OUTROS
8.4 CUIDADOS BUCAIS
8.4.1.1 PASTA DE DENTES
8.4.1.2 ENXAGUANTES ORAIS
8.4.1.3 OUTROS
8.5 PRODUTOS FARMACÊUTICOS
8.5.1.1 Xaropes
8.5.1.2 PÓS GRANULADOS
8.5.1.3 COMPRIMIDOS
8.5.1.4 OUTROS
8.6 OUTROS
9 MERCADOS DE SUBSTITUTOS DO AÇÚCAR NA EUROPA, POR CATEGORIA
9.1 VISÃO GERAL
9.2 NATURAL
9.3 SINTÉTICO
10 MERCADOS DE SUBSTITUTOS DO AÇÚCAR NA EUROPA, POR GEOGRAFIA
10.1 EUROPA
10.1.1 ALEMANHA
10.1.2 Reino Unido
10.1.3 FRANÇA
10.1.4 ESPANHA
10.1.5 ITÁLIA
10.1.6 DINAMARCA
10.1.7 HOLANDA
10.1.8 SUÍÇA
10.1.9 POLÔNIA
10.1.10 RÚSSIA
10.1.11 SUÉCIA
10.1.12 BÉLGICA
10.1.13 TURQUIA
10.1.14 RESTO DA EUROPA
11 MERCADO DE SUBSTITUTOS DO AÇÚCAR NA EUROPA, CENÁRIO DA EMPRESA
11.1 ANÁLISE DE AÇÕES DA EMPRESA: EUROPA
12 ANÁLISE SWOT E DBMR
12.1 ANÁLISE DE PESQUISA DE MERCADO DE PONTE DE DADOS
13 PERFIS DE EMPRESAS
13.1 ADM
13.1.1 RESUMO DA EMPRESA
13.1.2 ANÁLISE DE RECEITA
13.1.3 ANÁLISE DAS AÇÕES DA EMPRESA
13.1.4 PORTFÓLIO DE PRODUTOS
13.1.5 DESENVOLVIMENTOS RECENTES
13.2 CARGILL, INCORPORATED.
13.2.1 RESUMO DA EMPRESA
13.2.2 ANÁLISE DE RECEITA
13.2.3 ANÁLISE DAS AÇÕES DA EMPRESA
13.2.4 PORTFÓLIO DE PRODUTOS
13.2.5 DESENVOLVIMENTOS RECENTES
13.3 INGREDIENTES INCORPORADOS
13.3.1 RESUMO DA EMPRESA
13.3.2 ANÁLISE DE RECEITA
13.3.3 ANÁLISE DE AÇÕES DA EMPRESA
13.3.4 PORTFÓLIO DE PRODUTOS
13.3.5 DESENVOLVIMENTOS RECENTES
13.4 TATE & LYLE
13.4.1 RESUMO DA EMPRESA
13.4.2 ANÁLISE DE RECEITA
13.4.3 ANÁLISE DAS AÇÕES DA EMPRESA
13.4.4 PORTFÓLIO DE PRODUTOS
13.4.5 DESENVOLVIMENTOS RECENTES
13.5 AJINOMOTO SAÚDE E NUTRIÇÃO AMÉRICA DO NORTE, INC.
13.5.1 RESUMO DA EMPRESA
13.5.2 ANÁLISE DE RECEITA
13.5.3 PORTFÓLIO DE PRODUTOS
13.5.4 DESENVOLVIMENTOS RECENTES
13.6 ALSIANO
13.6.1 RESUMO DA EMPRESA
13.6.2 PORTFÓLIO DE PRODUTOS
13.6.3 DESENVOLVIMENTOS RECENTES
13.7 BENEO (UMA SUBSIDIÁRIA DA SÜDZUCKER AG)
13.7.1 RESUMO DA EMPRESA
13.7.2 ANÁLISE DE RECEITA
13.7.3 PORTFÓLIO DE PRODUTOS
13.7.4 DESENVOLVIMENTOS RECENTES
13.8 DUPONT.
13.8.1 RESUMO DA EMPRESA
13.8.2 ANÁLISE DE RECEITA
13.8.3 PORTFÓLIO DE PRODUTOS
13.8.4 DESENVOLVIMENTOS RECENTES
13.9 CORPORAÇÃO INTERNACIONAL FOODCHEM
13.9.1 RESUMO DA EMPRESA
13.9.2 PORTFÓLIO DE PRODUTOS
13.9.3 DESENVOLVIMENTOS RECENTES
13.1 HYET DOCE
13.10.1 RESUMO DA EMPRESA
13.10.2 PORTFÓLIO DE PRODUTOS
13.10.3 DESENVOLVIMENTOS RECENTES
13.11 JK SUCRALOSE INC.
13.11.1 RESUMO DA EMPRESA
13.11.2 PORTFÓLIO DE PRODUTOS
13.11.3 DESENVOLVIMENTO RECENTE
13.12 MAFCO WORLDWIDE LLC
13.12.1 RESUMO DA EMPRESA
13.12.2 PORTFÓLIO DE PRODUTOS
13.12.3 DESENVOLVIMENTO RECENTE
13.13 INDÚSTRIA QUÍMICA MATSUTANI CO., LTD.
13.13.1 RESUMO DA EMPRESA
13.13.2 PORTFÓLIO DE PRODUTOS
13.13.3 DESENVOLVIMENTO RECENTE
13.14 MITSUI SUGAR CO.,LTD.
13.14.1 RESUMO DA EMPRESA
13.14.2 ANÁLISE DE RECEITA
13.14.3 PORTFÓLIO DE PRODUTOS
13.14.4 DESENVOLVIMENTO RECENTE
13.15 NUTRASWEET CO.
13.15.1 RESUMO DA EMPRESA
13.15.2 PORTFÓLIO DE PRODUTOS
13.15.3 DESENVOLVIMENTO RECENTE
13.16 CÍRCULO PURO
13.16.1 RESUMO DA EMPRESA
13.16.2 ANÁLISE DE RECEITA
13.16.3 PORTFÓLIO DE PRODUTOS
13.16.4 DESENVOLVIMENTOS RECENTES
13.17 PYURE BRANDS LLC
13.17.1 RESUMO DA EMPRESA
13.17.2 PORTFÓLIO DE PRODUTOS
13.17.3 DESENVOLVIMENTOS RECENTES
13.18 ROQUETTE FRÈRES
13.18.1 RESUMO DA EMPRESA
13.18.2 PORTFÓLIO DE PRODUTOS
13.18.3 DESENVOLVIMENTOS RECENTES
13.19 LINHA DE PARTIDA SPA
13.19.1 RESUMO DA EMPRESA
13.19.2 PORTFÓLIO DE PRODUTOS
13.19.3 DESENVOLVIMENTO RECENTE
13.2 ZUCHEM INC.
13.20.1 RESUMO DA EMPRESA
13.20.2 PORTFÓLIO DE PRODUTOS
13.20.3 DESENVOLVIMENTO RECENTE
14 CONCLUSÃO
15 QUESTIONÁRIO
16 RELATÓRIOS RELACIONADOS
Lista de Tabela
TABELA 1 MERCADO EUROPEU DE SUBSTITUTOS DO AÇÚCAR, POR TIPO, 2018-2027 (US$ MILHÕES)
TABELA 2 MERCADO EUROPEU DE XAROPS RICO EM FRUTOSE COMO SUBSTITUTOS DO AÇÚCAR, POR REGIÃO, 2018-2027 (US$ MILHÕES)
TABELA 3 ADOÇANTES DE ALTA INTENSIDADE NO MERCADO DE SUBSTITUTOS DO AÇÚCAR NA EUROPA, POR REGIÃO, 2018-2027 (US$ MILHÕES)
TABELA 4 ADOÇANTES DE ALTA INTENSIDADE NO MERCADO DE SUBSTITUTOS DO AÇÚCAR NA EUROPA, POR COMPOSIÇÃO, 2018-2027 (US$ MILHÕES)
TABELA 5 ADOÇANTES DE BAIXA INTENSIDADE NO MERCADO DE SUBSTITUTOS DO AÇÚCAR NA EUROPA, POR REGIÃO, 2018-2027 (US$ MILHÕES)
TABELA 6 ADOÇANTES DE BAIXA INTENSIDADE NO MERCADO DE SUBSTITUTOS DO AÇÚCAR NA EUROPA, POR COMPOSIÇÃO, 2018-2027 (US$ MILHÕES)
TABELA 7 MERCADO EUROPEU DE SUBSTITUTOS DO AÇÚCAR, POR FORMA, 2018-2027 (US$ MILHÕES)
TABELA 8 MERCADO EUROPEU DE SUBSTITUTOS DE AÇÚCAR EM FORMA CRISTALIZADA, POR REGIÃO, 2018-2027 (US$ MILHÕES)
TABELA 9 MERCADO EUROPEU DE SUBSTITUTOS DE AÇÚCAR NA FORMA LÍQUIDA, POR REGIÃO, 2018-2027 (US$ MILHÕES)
TABELA 10 MERCADO EUROPEU DE SUBSTITUTOS DE AÇÚCAR EM FORMA DE PÓ, POR REGIÃO, 2018-2027 (US$ MILHÕES)
TABELA 11 MERCADO EUROPEU DE SUBSTITUTOS DO AÇÚCAR, POR APLICAÇÃO, 2018-2027 (MILHÕES DE USD)
TABELA 12 APLICAÇÃO DE BEBIDAS NO MERCADO EUROPEU DE SUBSTITUTOS DO AÇÚCAR, POR REGIÃO, 2018-2027 (US$ MILHÕES)
TABELA 13 MERCADO EUROPEU DE BEBIDAS EM SUBSTITUTOS DO AÇÚCAR, POR APLICAÇÃO, 2018-2027 (US$ MILHÕES)
TABELA 14 MERCADO EUROPEU DE BEBIDAS EM PÓ COMO SUBSTITUTOS DO AÇÚCAR, POR APLICAÇÃO, 2018-2027 (US$ MILHÕES)
TABELA 15 APLICAÇÃO DE PRODUTOS ALIMENTARES NA EUROPA NO MERCADO DE SUBSTITUTOS DO AÇÚCAR, POR REGIÃO, 2018-2027 (US$ MILHÕES)
TABELA 16 PRODUTOS ALIMENTARES NA EUROPA NO MERCADO DE SUBSTITUTOS DO AÇÚCAR, POR APLICAÇÃO, 2018-2027 (MILHÕES DE USD)
TABELA 17 MERCADO EUROPEU DE PRODUTOS LÁCTEOS COMO SUBSTITUTOS DO AÇÚCAR, POR APLICAÇÃO, 2018-2027 (MILHÕES DE USD)
TABELA 18 PRODUTOS DE PADARIA DA EUROPA NO MERCADO DE SUBSTITUTOS DO AÇÚCAR, POR APLICAÇÃO, 2018-2027 (MILHÕES DE USD)
TABELA 19 MERCADO EUROPEU DE CONFEITARIA EM SUBSTITUTOS DO AÇÚCAR, POR APLICAÇÃO, 2018-2027 (US$ MILHÕES)
TABELA 20 APLICAÇÃO DE SUBSTITUTOS DE AÇÚCAR EM CUIDADOS BUCAIS NA EUROPA, POR REGIÃO, 2018-2027 (MILHÕES DE DÓLARES)
TABELA 21 MERCADO EUROPEU DE SUBSTITUTOS DE AÇÚCAR PARA CUIDADOS BUCAIS, POR APLICAÇÃO, 2018-2027 (MILHÕES DE DÓLARES)
TABELA 22 APLICAÇÃO DE PRODUTOS FARMACÊUTICOS NA EUROPA NO MERCADO DE SUBSTITUTOS DO AÇÚCAR, POR REGIÃO, 2018-2027 (US$ MILHÕES)
TABELA 23 MERCADO EUROPEU DE SUBSTITUTOS DO AÇÚCAR EM PRODUTOS FARMACÊUTICOS, POR APLICAÇÃO, 2018-2027 (MILHÕES DE USD)
TABELA 24 APLICAÇÃO DE OUTROS NO MERCADO DE SUBSTITUTOS DO AÇÚCAR NA EUROPA, POR REGIÃO, 2018-2027 (US$ MILHÕES)
TABELA 25 MERCADO EUROPEU DE SUBSTITUTOS DO AÇÚCAR, POR CATEGORIA, 2018-2027 (US$ MILHÕES)
TABELA 26 CATEGORIA NATURAL EUROPA NO MERCADO DE SUBSTITUTOS DO AÇÚCAR, POR REGIÃO, 2018-2027 (US$ MILHÕES)
TABELA 27 CATEGORIA SINTÉTICA NA EUROPA NO MERCADO DE SUBSTITUTOS DO AÇÚCAR, POR REGIÃO, 2018-2027 (US$ MILHÕES)
TABELA 28 MERCADO DE SUBSTITUTOS DO AÇÚCAR NA EUROPA, POR PAÍS, 2018-2027 (US$ MILHÕES)
TABELA 29 MERCADO EUROPEU DE SUBSTITUTOS DO AÇÚCAR, POR TIPO, 2018-2027 (US$ MILHÕES)
TABELA 30 ADOÇANTES DE ALTA INTENSIDADE NO MERCADO DE SUBSTITUTOS DO AÇÚCAR NA EUROPA, POR COMPOSIÇÃO, 2018-2027 (US$ MILHÕES)
TABELA 31 MERCADO EUROPEU DE ADOÇANTES DE BAIXA INTENSIDADE EM SUBSTITUTOS DO AÇÚCAR, POR COMPOSIÇÃO, 2018-2027 (US$ MILHÕES)
TABELA 32 MERCADO EUROPEU DE SUBSTITUTOS DO AÇÚCAR, POR FORMA, 2018-2027 (US$ MILHÕES)
TABELA 33 MERCADO EUROPEU DE SUBSTITUTOS DO AÇÚCAR, POR CATEGORIA, 2018-2027 (US$ MILHÕES)
TABELA 34 MERCADO EUROPEU DE SUBSTITUTOS DO AÇÚCAR, POR APLICAÇÃO, 2018-2027 (US$ MILHÕES)
TABELA 35 MERCADO EUROPEU DE BEBIDAS EM SUBSTITUTOS DO AÇÚCAR, POR APLICAÇÃO, 2018-2027 (US$ MILHÕES)
TABELA 36 MERCADO EUROPEU DE BEBIDAS EM PÓ COMO SUBSTITUTOS DO AÇÚCAR, POR APLICAÇÃO, 2018-2027 (US$ MILHÕES)
TABELA 37 MERCADO DE PRODUTOS ALIMENTARES DA EUROPA NO MERCADO DE SUBSTITUTOS DO AÇÚCAR, POR APLICAÇÃO, 2018-2027 (MILHÕES DE USD)
TABELA 38 PRODUTOS DE PADARIA NA EUROPA NO MERCADO DE SUBSTITUTOS DO AÇÚCAR, POR APLICAÇÃO, 2018-2027 (MILHÕES DE USD)
TABELA 39 MERCADO EUROPEU DE CONFEITARIA NO MERCADO DE SUBSTITUTOS DO AÇÚCAR, POR APLICAÇÃO, 2018-2027 (US$ MILHÕES)
TABELA 40 MERCADO EUROPEU DE PRODUTOS LÁCTEOS COMO SUBSTITUTOS DO AÇÚCAR, POR APLICAÇÃO, 2018-2027 (MILHÕES DE USD)
TABELA 41 MERCADO EUROPEU DE SUBSTITUTOS DE AÇÚCAR PARA CUIDADOS BUCAIS, POR APLICAÇÃO, 2018-2027 (MILHÕES DE DÓLARES)
TABELA 42 MERCADO EUROPEU DE SUBSTITUTOS DO AÇÚCAR EM PRODUTOS FARMACÊUTICOS, POR APLICAÇÃO, 2018-2027 (MILHÕES DE USD)
TABELA 43 MERCADO DE SUBSTITUTOS DO AÇÚCAR NA ALEMANHA, POR TIPO, 2018-2027 (US$ MILHÕES)
TABELA 44 ADOÇANTES DE ALTA INTENSIDADE NO MERCADO DE SUBSTITUTOS DO AÇÚCAR DA ALEMANHA, POR COMPOSIÇÃO, 2018-2027 (US$ MILHÕES)
TABELA 45 ADOÇANTES DE BAIXA INTENSIDADE NO MERCADO DE SUBSTITUTOS DO AÇÚCAR DA ALEMANHA, POR COMPOSIÇÃO, 2018-2027 (US$ MILHÕES)
TABELA 46 MERCADO DE SUBSTITUTOS DO AÇÚCAR NA ALEMANHA, POR FORMA, 2018-2027 (US$ MILHÕES)
TABELA 47 MERCADO DE SUBSTITUTOS DO AÇÚCAR NA ALEMANHA, POR CATEGORIA, 2018-2027 (US$ MILHÕES)
TABELA 48 MERCADO DE SUBSTITUTOS DO AÇÚCAR NA ALEMANHA, POR APLICAÇÃO, 2018-2027 (US$ MILHÕES)
TABELA 49 MERCADO DE BEBIDAS NA ALEMANHA COMO SUBSTITUTOS DO AÇÚCAR, POR APLICAÇÃO, 2018-2027 (US$ MILHÕES)
TABELA 50 MERCADO DE BEBIDAS EM PÓ NA ALEMANHA COMO SUBSTITUTOS DO AÇÚCAR, POR APLICAÇÃO, 2018-2027 (US$ MILHÕES)
TABELA 51 PRODUTOS ALIMENTARES NA ALEMANHA NO MERCADO DE SUBSTITUTOS DO AÇÚCAR, POR APLICAÇÃO, 2018-2027 (US$ MILHÕES)
TABELA 52 PRODUTOS DE PADARIA DA ALEMANHA NO MERCADO DE SUBSTITUTOS DO AÇÚCAR, POR APLICAÇÃO, 2018-2027 (US$ MILHÕES)
TABELA 53 MERCADO DE CONFEITARIA NA ALEMANHA NO MERCADO DE SUBSTITUTOS DO AÇÚCAR, POR APLICAÇÃO, 2018-2027 (US$ MILHÕES)
TABELA 54 PRODUTOS LÁCTEOS NA ALEMANHA NO MERCADO DE SUBSTITUTOS DO AÇÚCAR, POR APLICAÇÃO, 2018-2027 (US$ MILHÕES)
TABELA 55 MERCADO DE SUBSTITUTOS DE AÇÚCAR NA ALEMANHA PARA CUIDADOS BUCAIS, POR APLICAÇÃO, 2018-2027 (US$ MILHÕES)
TABELA 56 MERCADO DE SUBSTITUTOS DO AÇÚCAR NA ALEMANHA, POR APLICAÇÃO, 2018-2027 (US$ MILHÕES)
TABELA 57 MERCADO DE SUBSTITUTOS DO AÇÚCAR NO REINO UNIDO, POR TIPO, 2018-2027 (US$ MILHÕES)
TABELA 58 ADOÇANTES DE ALTA INTENSIDADE NO MERCADO DE SUBSTITUTOS DO AÇÚCAR DO REINO UNIDO, POR COMPOSIÇÃO, 2018-2027 (US$ MILHÕES)
TABELA 59 ADOÇANTES DE BAIXA INTENSIDADE NO MERCADO DE SUBSTITUTOS DO AÇÚCAR DO REINO UNIDO, POR COMPOSIÇÃO, 2018-2027 (US$ MILHÕES)
TABELA 60 MERCADO DE SUBSTITUTOS DO AÇÚCAR NO REINO UNIDO, POR FORMA, 2018-2027 (US$ MILHÕES)
TABELA 61 MERCADO DE SUBSTITUTOS DO AÇÚCAR NO REINO UNIDO, POR CATEGORIA, 2018-2027 (MILHÕES DE DÓLARES)
TABELA 62 MERCADO DE SUBSTITUTOS DO AÇÚCAR NO REINO UNIDO, POR APLICAÇÃO, 2018-2027 (MILHÕES DE DÓLARES)
TABELA 63 MERCADO DE BEBIDAS NO REINO UNIDO COMO SUBSTITUTOS DO AÇÚCAR, POR APLICAÇÃO, 2018-2027 (US$ MILHÕES)
TABELA 64 MERCADO DE BEBIDAS EM PÓ NO REINO UNIDO COMO SUBSTITUTOS DO AÇÚCAR, POR APLICAÇÃO, 2018-2027 (US$ MILHÕES)
TABELA 65 PRODUTOS ALIMENTARES DO REINO UNIDO NO MERCADO DE SUBSTITUTOS DO AÇÚCAR, POR APLICAÇÃO, 2018-2027 (MILHÕES DE DÓLARES)
TABELA 66 PRODUTOS DE PADARIA DO REINO UNIDO NO MERCADO DE SUBSTITUTOS DO AÇÚCAR, POR APLICAÇÃO, 2018-2027 (MILHÕES DE DÓLARES)
TABELA 67 MERCADO DE SUBSTITUTOS DE AÇÚCAR NO REINO UNIDO, POR APLICAÇÃO, 2018-2027 (US$ MILHÕES)
TABELA 68 PRODUTOS LÁCTEOS NO MERCADO DE SUBSTITUTOS DO AÇÚCAR NO REINO UNIDO, POR APLICAÇÃO, 2018-2027 (MILHÕES DE DÓLARES)
TABELA 69 MERCADO DE SUBSTITUTOS DE AÇÚCAR PARA CUIDADOS BUCAIS NO REINO UNIDO, POR APLICAÇÃO, 2018-2027 (MILHÕES DE DÓLARES)
TABELA 70 MERCADO DE SUBSTITUTOS DO AÇÚCAR NO REINO UNIDO, POR APLICAÇÃO, 2018-2027 (MILHÕES DE DÓLARES)
TABELA 71 MERCADO DE SUBSTITUTOS DO AÇÚCAR NA FRANÇA, POR TIPO, 2018-2027 (US$ MILHÕES)
TABELA 72 ADOÇANTES DE ALTA INTENSIDADE NO MERCADO DE SUBSTITUTOS DO AÇÚCAR DA FRANÇA, POR COMPOSIÇÃO, 2018-2027 (US$ MILHÕES)
TABELA 73 ADOÇANTES DE BAIXA INTENSIDADE NO MERCADO DE SUBSTITUTOS DO AÇÚCAR DA FRANÇA, POR COMPOSIÇÃO, 2018-2027 (US$ MILHÕES)
TABELA 74 MERCADO DE SUBSTITUTOS DO AÇÚCAR NA FRANÇA, POR FORMA, 2018-2027 (US$ MILHÕES)
TABELA 75 MERCADO DE SUBSTITUTOS DO AÇÚCAR NA FRANÇA, POR CATEGORIA, 2018-2027 (US$ MILHÕES)
TABELA 76 MERCADO DE SUBSTITUTOS DO AÇÚCAR NA FRANÇA, POR APLICAÇÃO, 2018-2027 (US$ MILHÕES)
TABELA 77 MERCADO DE BEBIDAS NA FRANÇA COMO SUBSTITUTOS DO AÇÚCAR, POR APLICAÇÃO, 2018-2027 (US$ MILHÕES)
TABELA 78 MERCADO DE BEBIDAS EM PÓ NA FRANÇA COMO SUBSTITUTOS DO AÇÚCAR, POR APLICAÇÃO, 2018-2027 (US$ MILHÕES)
TABELA 79 PRODUTOS ALIMENTARES DA FRANÇA NO MERCADO DE SUBSTITUTOS DO AÇÚCAR, POR APLICAÇÃO, 2018-2027 (US$ MILHÕES)
TABELA 80 PRODUTOS DE PADARIA DA FRANÇA NO MERCADO DE SUBSTITUTOS DO AÇÚCAR, POR APLICAÇÃO, 2018-2027 (US$ MILHÕES)
TABELA 81 MERCADO DE CONFEITARIA NA FRANÇA NO MERCADO DE SUBSTITUTOS DO AÇÚCAR, POR APLICAÇÃO, 2018-2027 (US$ MILHÕES)
TABELA 82 MERCADO DE SUBSTITUTOS DO AÇÚCAR NA FRANÇA, POR APLICAÇÃO, 2018-2027 (US$ MILHÕES)
TABELA 83 MERCADO DE SUBSTITUTOS DE AÇÚCAR PARA CUIDADOS BUCAIS NA FRANÇA, POR APLICAÇÃO, 2018-2027 (US$ MILHÕES)
TABELA 84 MERCADO DE SUBSTITUTOS DO AÇÚCAR NA FRANÇA, POR APLICAÇÃO, 2018-2027 (US$ MILHÕES)
TABELA 85 MERCADO ESPANHA DE SUBSTITUTOS DO AÇÚCAR, POR TIPO, 2018-2027 (US$ MILHÕES)
TABELA 86 ADOÇANTES DE ALTA INTENSIDADE NO MERCADO DE SUBSTITUTOS DO AÇÚCAR DA ESPANHA, POR COMPOSIÇÃO, 2018-2027 (US$ MILHÕES)
TABELA 87 ADOÇANTES DE BAIXA INTENSIDADE NO MERCADO DE SUBSTITUTOS DO AÇÚCAR DA ESPANHA, POR COMPOSIÇÃO, 2018-2027 (US$ MILHÕES)
TABELA 88 MERCADO ESPANHA DE SUBSTITUTOS DO AÇÚCAR, POR FORMA, 2018-2027 (US$ MILHÕES)
TABELA 89 MERCADO DE SUBSTITUTOS DO AÇÚCAR NA ESPANHA, POR CATEGORIA, 2018-2027 (US$ MILHÕES)
TABELA 90 MERCADO ESPANHA DE SUBSTITUTOS DO AÇÚCAR, POR APLICAÇÃO, 2018-2027 (US$ MILHÕES)
TABELA 91 MERCADO DE BEBIDAS EM SUBSTITUTOS DO AÇÚCAR NA ESPANHA, POR APLICAÇÃO, 2018-2027 (US$ MILHÕES)
TABELA 92 MERCADO ESPANHA DE BEBIDAS EM PÓ COMO SUBSTITUTOS DO AÇÚCAR, POR APLICAÇÃO, 2018-2027 (US$ MILHÕES)
TABELA 93 PRODUTOS ALIMENTARES NO MERCADO DE SUBSTITUTOS DO AÇÚCAR DA ESPANHA, POR APLICAÇÃO, 2018-2027 (US$ MILHÕES)
TABELA 94 PRODUTOS DE PADARIA NA ESPANHA NO MERCADO DE SUBSTITUTOS DO AÇÚCAR, POR APLICAÇÃO, 2018-2027 (US$ MILHÕES)
TABELA 95 MERCADO DE CONFEITARIA NA ESPANHA NO MERCADO DE SUBSTITUTOS DO AÇÚCAR, POR APLICAÇÃO, 2018-2027 (US$ MILHÕES)
TABELA 96 MERCADO DE PRODUTOS LÁCTEOS NA ESPANHA NO MERCADO DE SUBSTITUTOS DO AÇÚCAR, POR APLICAÇÃO, 2018-2027 (US$ MILHÕES)
TABELA 97 MERCADO DE SUBSTITUTOS DE AÇÚCAR PARA CUIDADOS BUCAIS NA ESPANHA, POR APLICAÇÃO, 2018-2027 (US$ MILHÕES)
TABELA 98 MERCADO DE SUBSTITUTOS DO AÇÚCAR NA ESPANHA, POR APLICAÇÃO, 2018-2027 (US$ MILHÕES)
TABELA 99 MERCADO DE SUBSTITUTOS DO AÇÚCAR NA ITÁLIA, POR TIPO, 2018-2027 (US$ MILHÕES)
TABELA 100 ADOÇANTES DE ALTA INTENSIDADE NO MERCADO DE SUBSTITUTOS DO AÇÚCAR DA ITÁLIA, POR COMPOSIÇÃO, 2018-2027 (US$ MILHÕES)
TABELA 101 ADOÇANTES DE BAIXA INTENSIDADE NO MERCADO DE SUBSTITUTOS DO AÇÚCAR DA ITÁLIA, POR COMPOSIÇÃO, 2018-2027 (US$ MILHÕES)
TABELA 102 MERCADO DE SUBSTITUTOS DO AÇÚCAR NA ITÁLIA, POR FORMA, 2018-2027 (US$ MILHÕES)
TABELA 103 MERCADO DE SUBSTITUTOS DO AÇÚCAR NA ITÁLIA, POR CATEGORIA, 2018-2027 (US$ MILHÕES)
TABELA 104 MERCADO DE SUBSTITUTOS DO AÇÚCAR NA ITÁLIA, POR APLICAÇÃO, 2018-2027 (US$ MILHÕES)
TABELA 105 MERCADO DE BEBIDAS NA ITÁLIA COMO SUBSTITUTOS DO AÇÚCAR, POR APLICAÇÃO, 2018-2027 (US$ MILHÕES)
TABELA 106 MERCADO DE BEBIDAS EM PÓ NA ITÁLIA COMO SUBSTITUTOS DO AÇÚCAR, POR APLICAÇÃO, 2018-2027 (US$ MILHÕES)
TABELA 107 PRODUTOS ALIMENTARES DA ITÁLIA NO MERCADO DE SUBSTITUTOS DO AÇÚCAR, POR APLICAÇÃO, 2018-2027 (US$ MILHÕES)
TABELA 108 PRODUTOS DE PADARIA DA ITÁLIA NO MERCADO DE SUBSTITUTOS DO AÇÚCAR, POR APLICAÇÃO, 2018-2027 (US$ MILHÕES)
TABELA 109 MERCADO DE CONFEITARIA NA ITÁLIA NO MERCADO DE SUBSTITUTOS DO AÇÚCAR, POR APLICAÇÃO, 2018-2027 (US$ MILHÕES)
TABELA 110 MERCADO DE SUBSTITUTOS DO AÇÚCAR NA ITÁLIA, POR APLICAÇÃO, 2018-2027 (US$ MILHÕES)
TABELA 111 MERCADO DE SUBSTITUTOS DE AÇÚCAR PARA CUIDADOS BUCAIS NA ITÁLIA, POR APLICAÇÃO, 2018-2027 (US$ MILHÕES)
TABELA 112 MERCADO DE SUBSTITUTOS DO AÇÚCAR NA ITÁLIA, POR APLICAÇÃO, 2018-2027 (US$ MILHÕES)
TABELA 113 MERCADO DE SUBSTITUTOS DO AÇÚCAR NA DINAMARCA, POR TIPO, 2018-2027 (US$ MILHÕES)
TABELA 114 ADOÇANTES DE ALTA INTENSIDADE NO MERCADO DE SUBSTITUTOS DO AÇÚCAR DA DINAMARCA, POR COMPOSIÇÃO, 2018-2027 (US$ MILHÕES)
TABELA 115 ADOÇANTES DE BAIXA INTENSIDADE NO MERCADO DE SUBSTITUTOS DO AÇÚCAR DA DINAMARCA, POR COMPOSIÇÃO, 2018-2027 (US$ MILHÕES)
TABELA 116 MERCADO DE SUBSTITUTOS DO AÇÚCAR NA DINAMARCA, POR FORMA, 2018-2027 (US$ MILHÕES)
TABELA 117 MERCADO DE SUBSTITUTOS DO AÇÚCAR NA DINAMARCA, POR CATEGORIA, 2018-2027 (US$ MILHÕES)
TABELA 118 MERCADO DE SUBSTITUTOS DO AÇÚCAR NA DINAMARCA, POR APLICAÇÃO, 2018-2027 (US$ MILHÕES)
TABELA 119 MERCADO DE BEBIDAS NA DINAMARCA COMO SUBSTITUTOS DO AÇÚCAR, POR APLICAÇÃO, 2018-2027 (US$ MILHÕES)
TABELA 120 MERCADO DE BEBIDAS EM PÓ NA DINAMARCA COMO SUBSTITUTOS DO AÇÚCAR, POR APLICAÇÃO, 2018-2027 (US$ MILHÕES)
TABELA 121 PRODUTOS ALIMENTARES DA DINAMARCA NO MERCADO DE SUBSTITUTOS DO AÇÚCAR, POR APLICAÇÃO, 2018-2027 (US$ MILHÕES)
TABELA 122 PRODUTOS DE PADARIA DA DINAMARCA NO MERCADO DE SUBSTITUTOS DO AÇÚCAR, POR APLICAÇÃO, 2018-2027 (US$ MILHÕES)
TABELA 123 CONFEITARIA DA DINAMARCA NO MERCADO DE SUBSTITUTOS DO AÇÚCAR, POR APLICAÇÃO, 2018-2027 (US$ MILHÕES)
TABELA 124 PRODUTOS LÁCTEOS NA DINAMARCA NO MERCADO DE SUBSTITUTOS DO AÇÚCAR, POR APLICAÇÃO, 2018-2027 (US$ MILHÕES)
TABELA 125 MERCADO DE SUBSTITUTOS DE AÇÚCAR PARA CUIDADOS BUCAIS NA DINAMARCA, POR APLICAÇÃO, 2018-2027 (US$ MILHÕES)
TABELA 126 MERCADO DE SUBSTITUTOS DO AÇÚCAR NA DINAMARCA, POR APLICAÇÃO, 2018-2027 (US$ MILHÕES)
TABLE 127 NETHERLANDS SUGAR SUBSTITUTES MARKET, BY TYPE, 2018-2027 (USD MILLION)
TABLE 128 NETHERLANDS HIGH-INTENSITY SWEETENERS IN SUGAR SUBSTITUTES MARKET, BY COMPOSITION, 2018-2027 (USD MILLION)
TABLE 129 NETHERLANDS LOW-INTENSITY SWEETENERS IN SUGAR SUBSTITUTES MARKET, BY COMPOSITION, 2018-2027 (USD MILLION)
TABLE 130 NETHERLANDS SUGAR SUBSTITUTES MARKET, BY FORM, 2018-2027 (USD MILLION)
TABLE 131 NETHERLANDS SUGAR SUBSTITUTES MARKET, BY CATEGORY, 2018-2027 (USD MILLION)
TABLE 132 NETHERLANDS SUGAR SUBSTITUTES MARKET, BY APPLICATION, 2018-2027 (USD MILLION)
TABLE 133 NETHERLANDS BEVERAGES IN SUGAR SUBSTITUTES MARKET, BY APPLICATION, 2018-2027 (USD MILLION)
TABLE 134 NETHERLANDS POWDERED BEVERAGES IN SUGAR SUBSTITUTES MARKET, BY APPLICATION, 2018-2027 (USD MILLION)
TABLE 135 NETHERLANDS FOOD PRODUCTS IN SUGAR SUBSTITUTES MARKET, BY APPLICATION, 2018-2027 (USD MILLION)
TABLE 136 NETHERLANDS BAKERY PRODUCTS IN SUGAR SUBSTITUTES MARKET, BY APPLICATION, 2018-2027 (USD MILLION)
TABLE 137 NETHERLANDS CONFECTIONERY IN SUGAR SUBSTITUTES MARKET, BY APPLICATION, 2018-2027 (USD MILLION)
TABLE 138 NETHERLANDS DAIRY PRODUCTS IN SUGAR SUBSTITUTES MARKET, BY APPLICATION, 2018-2027 (USD MILLION)
TABLE 139 NETHERLANDS ORAL CARE IN SUGAR SUBSTITUTES MARKET, BY APPLICATION, 2018-2027 (USD MILLION)
TABLE 140 NETHERLANDS PHARMACEUTICALS IN SUGAR SUBSTITUTES MARKET, BY APPLICATION, 2018-2027 (USD MILLION)
TABLE 141 SWITZERLAND SUGAR SUBSTITUTES MARKET, BY TYPE, 2018-2027 (USD MILLION)
TABLE 142 SWITZERLAND HIGH-INTENSITY SWEETENERS IN SUGAR SUBSTITUTES MARKET, BY COMPOSITION, 2018-2027 (USD MILLION)
TABLE 143 SWITZERLAND LOW-INTENSITY SWEETENERS IN SUGAR SUBSTITUTES MARKET, BY COMPOSITION, 2018-2027 (USD MILLION)
TABLE 144 SWITZERLAND SUGAR SUBSTITUTES MARKET, BY FORM, 2018-2027 (USD MILLION)
TABLE 145 SWITZERLAND SUGAR SUBSTITUTES MARKET, BY CATEGORY, 2018-2027 (USD MILLION)
TABLE 146 SWITZERLAND SUGAR SUBSTITUTES MARKET, BY APPLICATION, 2018-2027 (USD MILLION)
TABLE 147 SWITZERLAND BEVERAGES IN SUGAR SUBSTITUTES MARKET, BY APPLICATION, 2018-2027 (USD MILLION)
TABLE 148 SWITZERLAND POWDERED BEVERAGES IN SUGAR SUBSTITUTES MARKET, BY APPLICATION, 2018-2027 (USD MILLION)
TABLE 149 SWITZERLAND FOOD PRODUCTS IN SUGAR SUBSTITUTES MARKET, BY APPLICATION, 2018-2027 (USD MILLION)
TABLE 150 SWITZERLAND BAKERY PRODUCTS IN SUGAR SUBSTITUTES MARKET, BY APPLICATION, 2018-2027 (USD MILLION)
TABLE 151 SWITZERLAND CONFECTIONERY IN SUGAR SUBSTITUTES MARKET, BY APPLICATION, 2018-2027 (USD MILLION)
TABLE 152 SWITZERLAND DAIRY PRODUCTS IN SUGAR SUBSTITUTES MARKET, BY APPLICATION, 2018-2027 (USD MILLION)
TABLE 153 SWITZERLAND ORAL CARE IN SUGAR SUBSTITUTES MARKET, BY APPLICATION, 2018-2027 (USD MILLION)
TABLE 154 SWITZERLAND PHARMACEUTICALS IN SUGAR SUBSTITUTES MARKET, BY APPLICATION, 2018-2027 (USD MILLION)
TABLE 155 POLAND SUGAR SUBSTITUTES MARKET, BY TYPE, 2018-2027 (USD MILLION)
TABLE 156 POLAND HIGH-INTENSITY SWEETENERS IN SUGAR SUBSTITUTES MARKET, BY COMPOSITION, 2018-2027 (USD MILLION)
TABLE 157 POLAND LOW-INTENSITY SWEETENERS IN SUGAR SUBSTITUTES MARKET, BY COMPOSITION, 2018-2027 (USD MILLION)
TABLE 158 POLAND SUGAR SUBSTITUTES MARKET, BY FORM, 2018-2027 (USD MILLION)
TABLE 159 POLAND SUGAR SUBSTITUTES MARKET, BY CATEGORY, 2018-2027 (USD MILLION)
TABLE 160 POLAND SUGAR SUBSTITUTES MARKET, BY APPLICATION, 2018-2027 (USD MILLION)
TABLE 161 POLAND BEVERAGES IN SUGAR SUBSTITUTES MARKET, BY APPLICATION, 2018-2027 (USD MILLION)
TABLE 162 POLAND POWDERED BEVERAGES IN SUGAR SUBSTITUTES MARKET, BY APPLICATION, 2018-2027 (USD MILLION)
TABLE 163 POLAND FOOD PRODUCTS IN SUGAR SUBSTITUTES MARKET, BY APPLICATION, 2018-2027 (USD MILLION)
TABLE 164 POLAND BAKERY PRODUCTS IN SUGAR SUBSTITUTES MARKET, BY APPLICATION, 2018-2027 (USD MILLION)
TABLE 165 POLAND CONFECTIONERY IN SUGAR SUBSTITUTES MARKET, BY APPLICATION, 2018-2027 (USD MILLION)
TABLE 166 POLAND DAIRY PRODUCTS IN SUGAR SUBSTITUTES MARKET, BY APPLICATION, 2018-2027 (USD MILLION)
TABLE 167 POLAND ORAL CARE IN SUGAR SUBSTITUTES MARKET, BY APPLICATION, 2018-2027 (USD MILLION)
TABLE 168 POLAND PHARMACEUTICALS IN SUGAR SUBSTITUTES MARKET, BY APPLICATION, 2018-2027 (USD MILLION)
TABLE 169 RUSSIA SUGAR SUBSTITUTES MARKET, BY TYPE, 2018-2027 (USD MILLION)
TABLE 170 RUSSIA HIGH-INTENSITY SWEETENERS IN SUGAR SUBSTITUTES MARKET, BY COMPOSITION, 2018-2027 (USD MILLION)
TABLE 171 RUSSIA LOW-INTENSITY SWEETENERS IN SUGAR SUBSTITUTES MARKET, BY COMPOSITION, 2018-2027 (USD MILLION)
TABLE 172 RUSSIA SUGAR SUBSTITUTES MARKET, BY FORM, 2018-2027 (USD MILLION)
TABLE 173 RUSSIA SUGAR SUBSTITUTES MARKET, BY CATEGORY, 2018-2027 (USD MILLION)
TABLE 174 RUSSIA SUGAR SUBSTITUTES MARKET, BY APPLICATION, 2018-2027 (USD MILLION)
TABLE 175 RUSSIA BEVERAGES IN SUGAR SUBSTITUTES MARKET, BY APPLICATION, 2018-2027 (USD MILLION)
TABLE 176 RUSSIA POWDERED BEVERAGES IN SUGAR SUBSTITUTES MARKET, BY APPLICATION, 2018-2027 (USD MILLION)
TABLE 177 RUSSIA FOOD PRODUCTS IN SUGAR SUBSTITUTES MARKET, BY APPLICATION, 2018-2027 (USD MILLION)
TABLE 178 RUSSIA BAKERY PRODUCTS IN SUGAR SUBSTITUTES MARKET, BY APPLICATION, 2018-2027 (USD MILLION)
TABLE 179 RUSSIA CONFECTIONERY IN SUGAR SUBSTITUTES MARKET, BY APPLICATION, 2018-2027 (USD MILLION)
TABLE 180 RUSSIA DAIRY PRODUCTS IN SUGAR SUBSTITUTES MARKET, BY APPLICATION, 2018-2027 (USD MILLION)
TABLE 181 RUSSIA ORAL CARE IN SUGAR SUBSTITUTES MARKET, BY APPLICATION, 2018-2027 (USD MILLION)
TABLE 182 RUSSIA PHARMACEUTICALS IN SUGAR SUBSTITUTES MARKET, BY APPLICATION, 2018-2027 (USD MILLION)
TABLE 183 SWEDEN SUGAR SUBSTITUTES MARKET, BY TYPE, 2018-2027 (USD MILLION)
TABLE 184 SWEDEN HIGH-INTENSITY SWEETENERS IN SUGAR SUBSTITUTES MARKET, BY COMPOSITION, 2018-2027 (USD MILLION)
TABLE 185 SWEDEN LOW-INTENSITY SWEETENERS IN SUGAR SUBSTITUTES MARKET, BY COMPOSITION, 2018-2027 (USD MILLION)
TABLE 186 SWEDEN SUGAR SUBSTITUTES MARKET, BY FORM, 2018-2027 (USD MILLION)
TABLE 187 SWEDEN SUGAR SUBSTITUTES MARKET, BY CATEGORY, 2018-2027 (USD MILLION)
TABLE 188 SWEDEN SUGAR SUBSTITUTES MARKET, BY APPLICATION, 2018-2027 (USD MILLION)
TABLE 189 SWEDEN BEVERAGES IN SUGAR SUBSTITUTES MARKET, BY APPLICATION, 2018-2027 (USD MILLION)
TABLE 190 SWEDEN POWDERED BEVERAGES IN SUGAR SUBSTITUTES MARKET, BY APPLICATION, 2018-2027 (USD MILLION)
TABLE 191 SWEDEN FOOD PRODUCTS IN SUGAR SUBSTITUTES MARKET, BY APPLICATION, 2018-2027 (USD MILLION)
TABLE 192 SWEDEN BAKERY PRODUCTS IN SUGAR SUBSTITUTES MARKET, BY APPLICATION, 2018-2027 (USD MILLION)
TABLE 193 SWEDEN CONFECTIONERY IN SUGAR SUBSTITUTES MARKET, BY APPLICATION, 2018-2027 (USD MILLION)
TABLE 194 SWEDEN DAIRY PRODUCTS IN SUGAR SUBSTITUTES MARKET, BY APPLICATION, 2018-2027 (USD MILLION)
TABLE 195 SWEDEN ORAL CARE IN SUGAR SUBSTITUTES MARKET, BY APPLICATION, 2018-2027 (USD MILLION)
TABLE 196 SWEDEN PHARMACEUTICALS IN SUGAR SUBSTITUTES MARKET, BY APPLICATION, 2018-2027 (USD MILLION)
TABLE 197 BELGIUM SUGAR SUBSTITUTES MARKET, BY TYPE, 2018-2027 (USD MILLION)
TABLE 198 BELGIUM HIGH-INTENSITY SWEETENERS IN SUGAR SUBSTITUTES MARKET, BY COMPOSITION, 2018-2027 (USD MILLION)
TABLE 199 BELGIUM LOW-INTENSITY SWEETENERS IN SUGAR SUBSTITUTES MARKET, BY COMPOSITION, 2018-2027 (USD MILLION)
TABLE 200 BELGIUM SUGAR SUBSTITUTES MARKET, BY FORM, 2018-2027 (USD MILLION)
TABLE 201 BELGIUM SUGAR SUBSTITUTES MARKET, BY CATEGORY, 2018-2027 (USD MILLION)
TABLE 202 BELGIUM SUGAR SUBSTITUTES MARKET, BY APPLICATION, 2018-2027 (USD MILLION)
TABLE 203 BELGIUM BEVERAGES IN SUGAR SUBSTITUTES MARKET, BY APPLICATION, 2018-2027 (USD MILLION)
TABLE 204 BELGIUM POWDERED BEVERAGES IN SUGAR SUBSTITUTES MARKET, BY APPLICATION, 2018-2027 (USD MILLION)
TABLE 205 BELGIUM FOOD PRODUCTS IN SUGAR SUBSTITUTES MARKET, BY APPLICATION, 2018-2027 (USD MILLION)
TABLE 206 BELGIUM BAKERY PRODUCTS IN SUGAR SUBSTITUTES MARKET, BY APPLICATION, 2018-2027 (USD MILLION)
TABLE 207 BELGIUM CONFECTIONERY IN SUGAR SUBSTITUTES MARKET, BY APPLICATION, 2018-2027 (USD MILLION)
TABLE 208 BELGIUM DAIRY PRODUCTS IN SUGAR SUBSTITUTES MARKET, BY APPLICATION, 2018-2027 (USD MILLION)
TABLE 209 BELGIUM ORAL CARE IN SUGAR SUBSTITUTES MARKET, BY APPLICATION, 2018-2027 (USD MILLION)
TABLE 210 BELGIUM PHARMACEUTICALS IN SUGAR SUBSTITUTES MARKET, BY APPLICATION, 2018-2027 (USD MILLION)
TABLE 211 TURKEY SUGAR SUBSTITUTES MARKET, BY TYPE, 2018-2027 (USD MILLION)
TABLE 212 TURKEY HIGH-INTENSITY SWEETENERS IN SUGAR SUBSTITUTES MARKET, BY COMPOSITION, 2018-2027 (USD MILLION)
TABLE 213 TURKEY LOW-INTENSITY SWEETENERS IN SUGAR SUBSTITUTES MARKET, BY COMPOSITION, 2018-2027 (USD MILLION)
TABLE 214 TURKEY SUGAR SUBSTITUTES MARKET, BY FORM, 2018-2027 (USD MILLION)
TABLE 215 TURKEY SUGAR SUBSTITUTES MARKET, BY CATEGORY, 2018-2027 (USD MILLION)
TABLE 216 TURKEY SUGAR SUBSTITUTES MARKET, BY APPLICATION, 2018-2027 (USD MILLION)
TABLE 217 TURKEY BEVERAGES IN SUGAR SUBSTITUTES MARKET, BY APPLICATION, 2018-2027 (USD MILLION)
TABLE 218 TURKEY POWDERED BEVERAGES IN SUGAR SUBSTITUTES MARKET, BY APPLICATION, 2018-2027 (USD MILLION)
TABLE 219 TURKEY FOOD PRODUCTS IN SUGAR SUBSTITUTES MARKET, BY APPLICATION, 2018-2027 (USD MILLION)
TABELA 220 PRODUTOS DE PADARIA DE PERU NO MERCADO DE SUBSTITUTOS DO AÇÚCAR, POR APLICAÇÃO, 2018-2027 (US$ MILHÕES)
TABELA 221 CONFEITARIA DE PERU NO MERCADO DE SUBSTITUTOS DO AÇÚCAR, POR APLICAÇÃO, 2018-2027 (US$ MILHÕES)
TABELA 222 MERCADO DE PRODUTOS LÁCTEOS DE PERU NO MERCADO DE SUBSTITUTOS DO AÇÚCAR, POR APLICAÇÃO, 2018-2027 (US$ MILHÕES)
TABELA 223 CUIDADOS BUCAIS NA TURQUIA NO MERCADO DE SUBSTITUTOS DO AÇÚCAR, POR APLICAÇÃO, 2018-2027 (US$ MILHÕES)
TABELA 224 MERCADO DE SUBSTITUTOS DO AÇÚCAR NA TURQUIA, POR APLICAÇÃO, 2018-2027 (US$ MILHÕES)
TABELA 225 MERCADO DE SUBSTITUTOS DO AÇÚCAR NO RESTO DA EUROPA, POR TIPO, 2018-2027 (US$ MILHÕES)
Lista de Figura
FIGURA 1 MERCADO EUROPEU DE SUBSTITUTOS DO AÇÚCAR: SEGMENTAÇÃO
FIGURA 2 MERCADO EUROPEU DE SUBSTITUTOS DO AÇÚCAR: TRIANGULAÇÃO DE DADOS
FIGURA 3 MERCADO EUROPEU DE SUBSTITUTOS DO AÇÚCAR: ANÁLISE DROC
FIGURA 4 MERCADO EUROPEU DE SUBSTITUTOS DO AÇÚCAR: ANÁLISE DE MERCADO EUROPEU VS MERCADO REGIONAL
FIGURA 5 MERCADO EUROPEU DE SUBSTITUTOS DO AÇÚCAR: ANÁLISE DE PESQUISA DA EMPRESA
FIGURA 6 MERCADO EUROPEU DE SUBSTITUTOS DO AÇÚCAR: DEMOGRAFIA DA ENTREVISTA
FIGURA 7 MERCADO EUROPEU DE SUBSTITUTOS DO AÇÚCAR: GRADE DE POSIÇÃO DE MERCADO DBMR
FIGURA 8 MERCADO EUROPEU DE SUBSTITUTOS DO AÇÚCAR: ANÁLISE DA PARTICIPAÇÃO DOS FORNECEDORES
FIGURA 9 MERCADO EUROPEU DE SUBSTITUTOS DO AÇÚCAR: GRADE DE COBERTURA DE APLICAÇÃO DE MERCADO
FIGURA 10 MOTIVADORES, RESTRIÇÕES, OPORTUNIDADES E DESAFIOS DO MERCADO EUROPEU DE SUBSTITUTOS DO AÇÚCAR
FIGURA 11 MERCADO EUROPEU DE SUBSTITUTOS DO AÇÚCAR: SEGMENTAÇÃO
FIGURA 12 O CRESCIMENTO DO NÚMERO DA POPULAÇÃO OBESIVA E DIABÉTICA E A CRESCENTE TENDÊNCIA DE ESTILO DE VIDA SAUDÁVEL E PRODUTOS SAUDÁVEIS DEVEM IMPULSIONAR O MERCADO EUROPEU DE SUBSTITUTOS DO AÇÚCAR NO PERÍODO PREVISTO DE 2020 A 2027
FIGURA 13 XAROPE COM ALTO TEOR DE FRUTOSE DEVE SER RESPONSÁVEL PELA MAIOR PARCIALIDADE DO MERCADO EUROPEU DE SUBSTITUTOS DO AÇÚCAR EM 2020 E 2027
FIGURA 14 MERCADO EUROPEU DE SUBSTITUTOS DO AÇÚCAR: POR TIPO, 2019
FIGURA 15 MERCADO EUROPEU DE SUBSTITUTOS DO AÇÚCAR: POR FORMA, 2019
FIGURA 16 MERCADO EUROPEU DE SUBSTITUTOS DO AÇÚCAR: POR APLICAÇÃO, 2019
FIGURA 17 MERCADO EUROPEU DE SUBSTITUTOS DO AÇÚCAR: POR CATEGORIA, 2019
FIGURA 18 MERCADO EUROPEU DE SUBSTITUTOS DO AÇÚCAR: INSTANTÂNEO (2019)
FIGURA 19 MERCADO EUROPEU DE SUBSTITUTOS DO AÇÚCAR: POR PAÍS (2019)
FIGURA 20 MERCADO EUROPEU DE SUBSTITUTOS DO AÇÚCAR: POR PAÍS (2020 E 2027)
FIGURA 21 MERCADO EUROPEU DE SUBSTITUTOS DO AÇÚCAR: POR PAÍS (2019 E 2027)
FIGURA 22 MERCADO EUROPEU DE SUBSTITUTOS DO AÇÚCAR: POR TIPO (2020-2027)
FIGURA 23 MERCADO EUROPEU DE SUBSTITUTOS DO AÇÚCAR: PARTICIPAÇÃO DA EMPRESA EM 2019 (%)
Metodologia de Investigação
A recolha de dados e a análise do ano base são feitas através de módulos de recolha de dados com amostras grandes. A etapa inclui a obtenção de informações de mercado ou dados relacionados através de diversas fontes e estratégias. Inclui examinar e planear antecipadamente todos os dados adquiridos no passado. Da mesma forma, envolve o exame de inconsistências de informação observadas em diferentes fontes de informação. Os dados de mercado são analisados e estimados utilizando modelos estatísticos e coerentes de mercado. Além disso, a análise da quota de mercado e a análise das principais tendências são os principais fatores de sucesso no relatório de mercado. Para saber mais, solicite uma chamada de analista ou abra a sua consulta.
A principal metodologia de investigação utilizada pela equipa de investigação do DBMR é a triangulação de dados que envolve a mineração de dados, a análise do impacto das variáveis de dados no mercado e a validação primária (especialista do setor). Os modelos de dados incluem grelha de posicionamento de fornecedores, análise da linha de tempo do mercado, visão geral e guia de mercado, grelha de posicionamento da empresa, análise de patentes, análise de preços, análise da quota de mercado da empresa, normas de medição, análise global versus regional e de participação dos fornecedores. Para saber mais sobre a metodologia de investigação, faça uma consulta para falar com os nossos especialistas do setor.
Personalização disponível
A Data Bridge Market Research é líder em investigação formativa avançada. Orgulhamo-nos de servir os nossos clientes novos e existentes com dados e análises que correspondem e atendem aos seus objetivos. O relatório pode ser personalizado para incluir análise de tendências de preços de marcas-alvo, compreensão do mercado para países adicionais (solicite a lista de países), dados de resultados de ensaios clínicos, revisão de literatura, mercado remodelado e análise de base de produtos . A análise de mercado dos concorrentes-alvo pode ser analisada desde análises baseadas em tecnologia até estratégias de carteira de mercado. Podemos adicionar quantos concorrentes necessitar de dados no formato e estilo de dados que procura. A nossa equipa de analistas também pode fornecer dados em tabelas dinâmicas de ficheiros Excel em bruto (livro de factos) ou pode ajudá-lo a criar apresentações a partir dos conjuntos de dados disponíveis no relatório.

