Global Kaolin Market
Tamanho do mercado em biliões de dólares
CAGR :
% 
 USD
6.20 Billion
USD
9.02 Billion
2025
2033
USD
6.20 Billion
USD
9.02 Billion
2025
2033
| 2026 –2033 | |
| USD 6.20 Billion | |
| USD 9.02 Billion | |
| % | |
Global Kaolin Market, By Grade (Calcined, Hydrous, Delaminated, Surface Treated, and Structured), Process (Water-Washed, Airfloat, Calcined, Delaminated, and Surface-Modified & Unprocessed), Application (Paper, Ceramics, Paint & Coatings, Fiberglass, Plastic, Rubber, Pharmaceuticals & Medical, Cosmetics, and Others) Industry Trends and Forecast to 2029
Kaolin Market Analysis and Insights
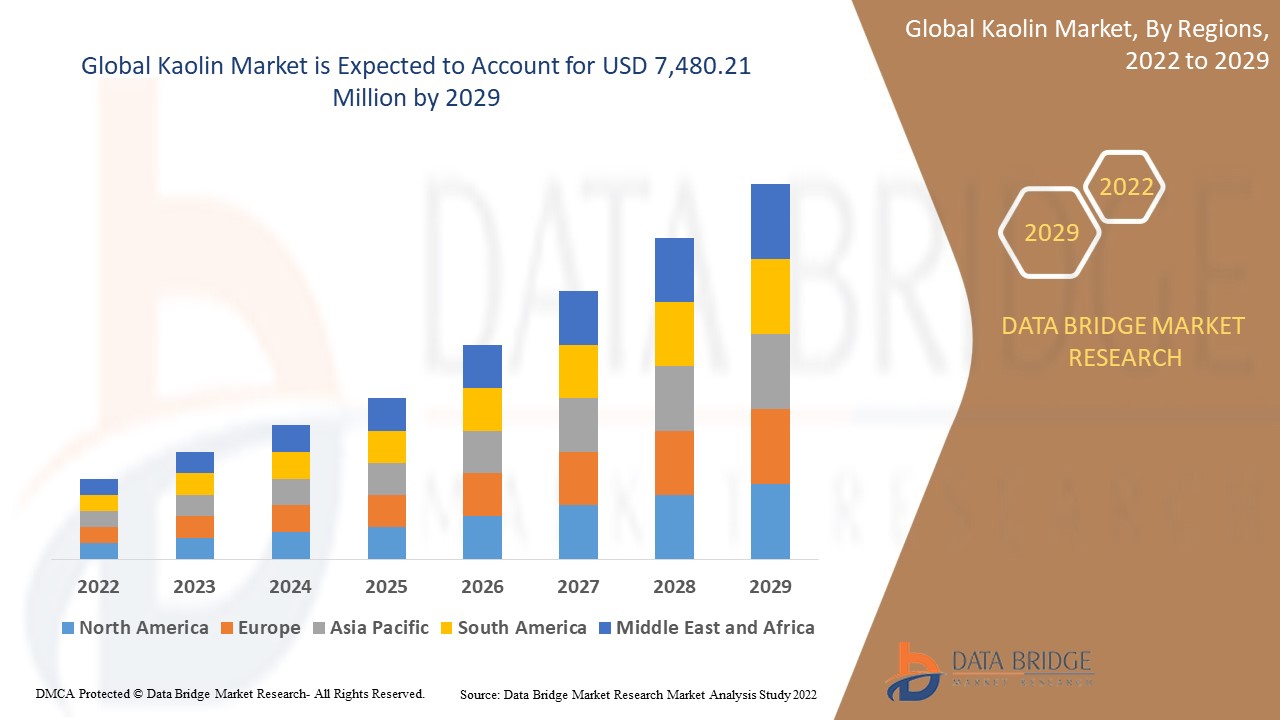
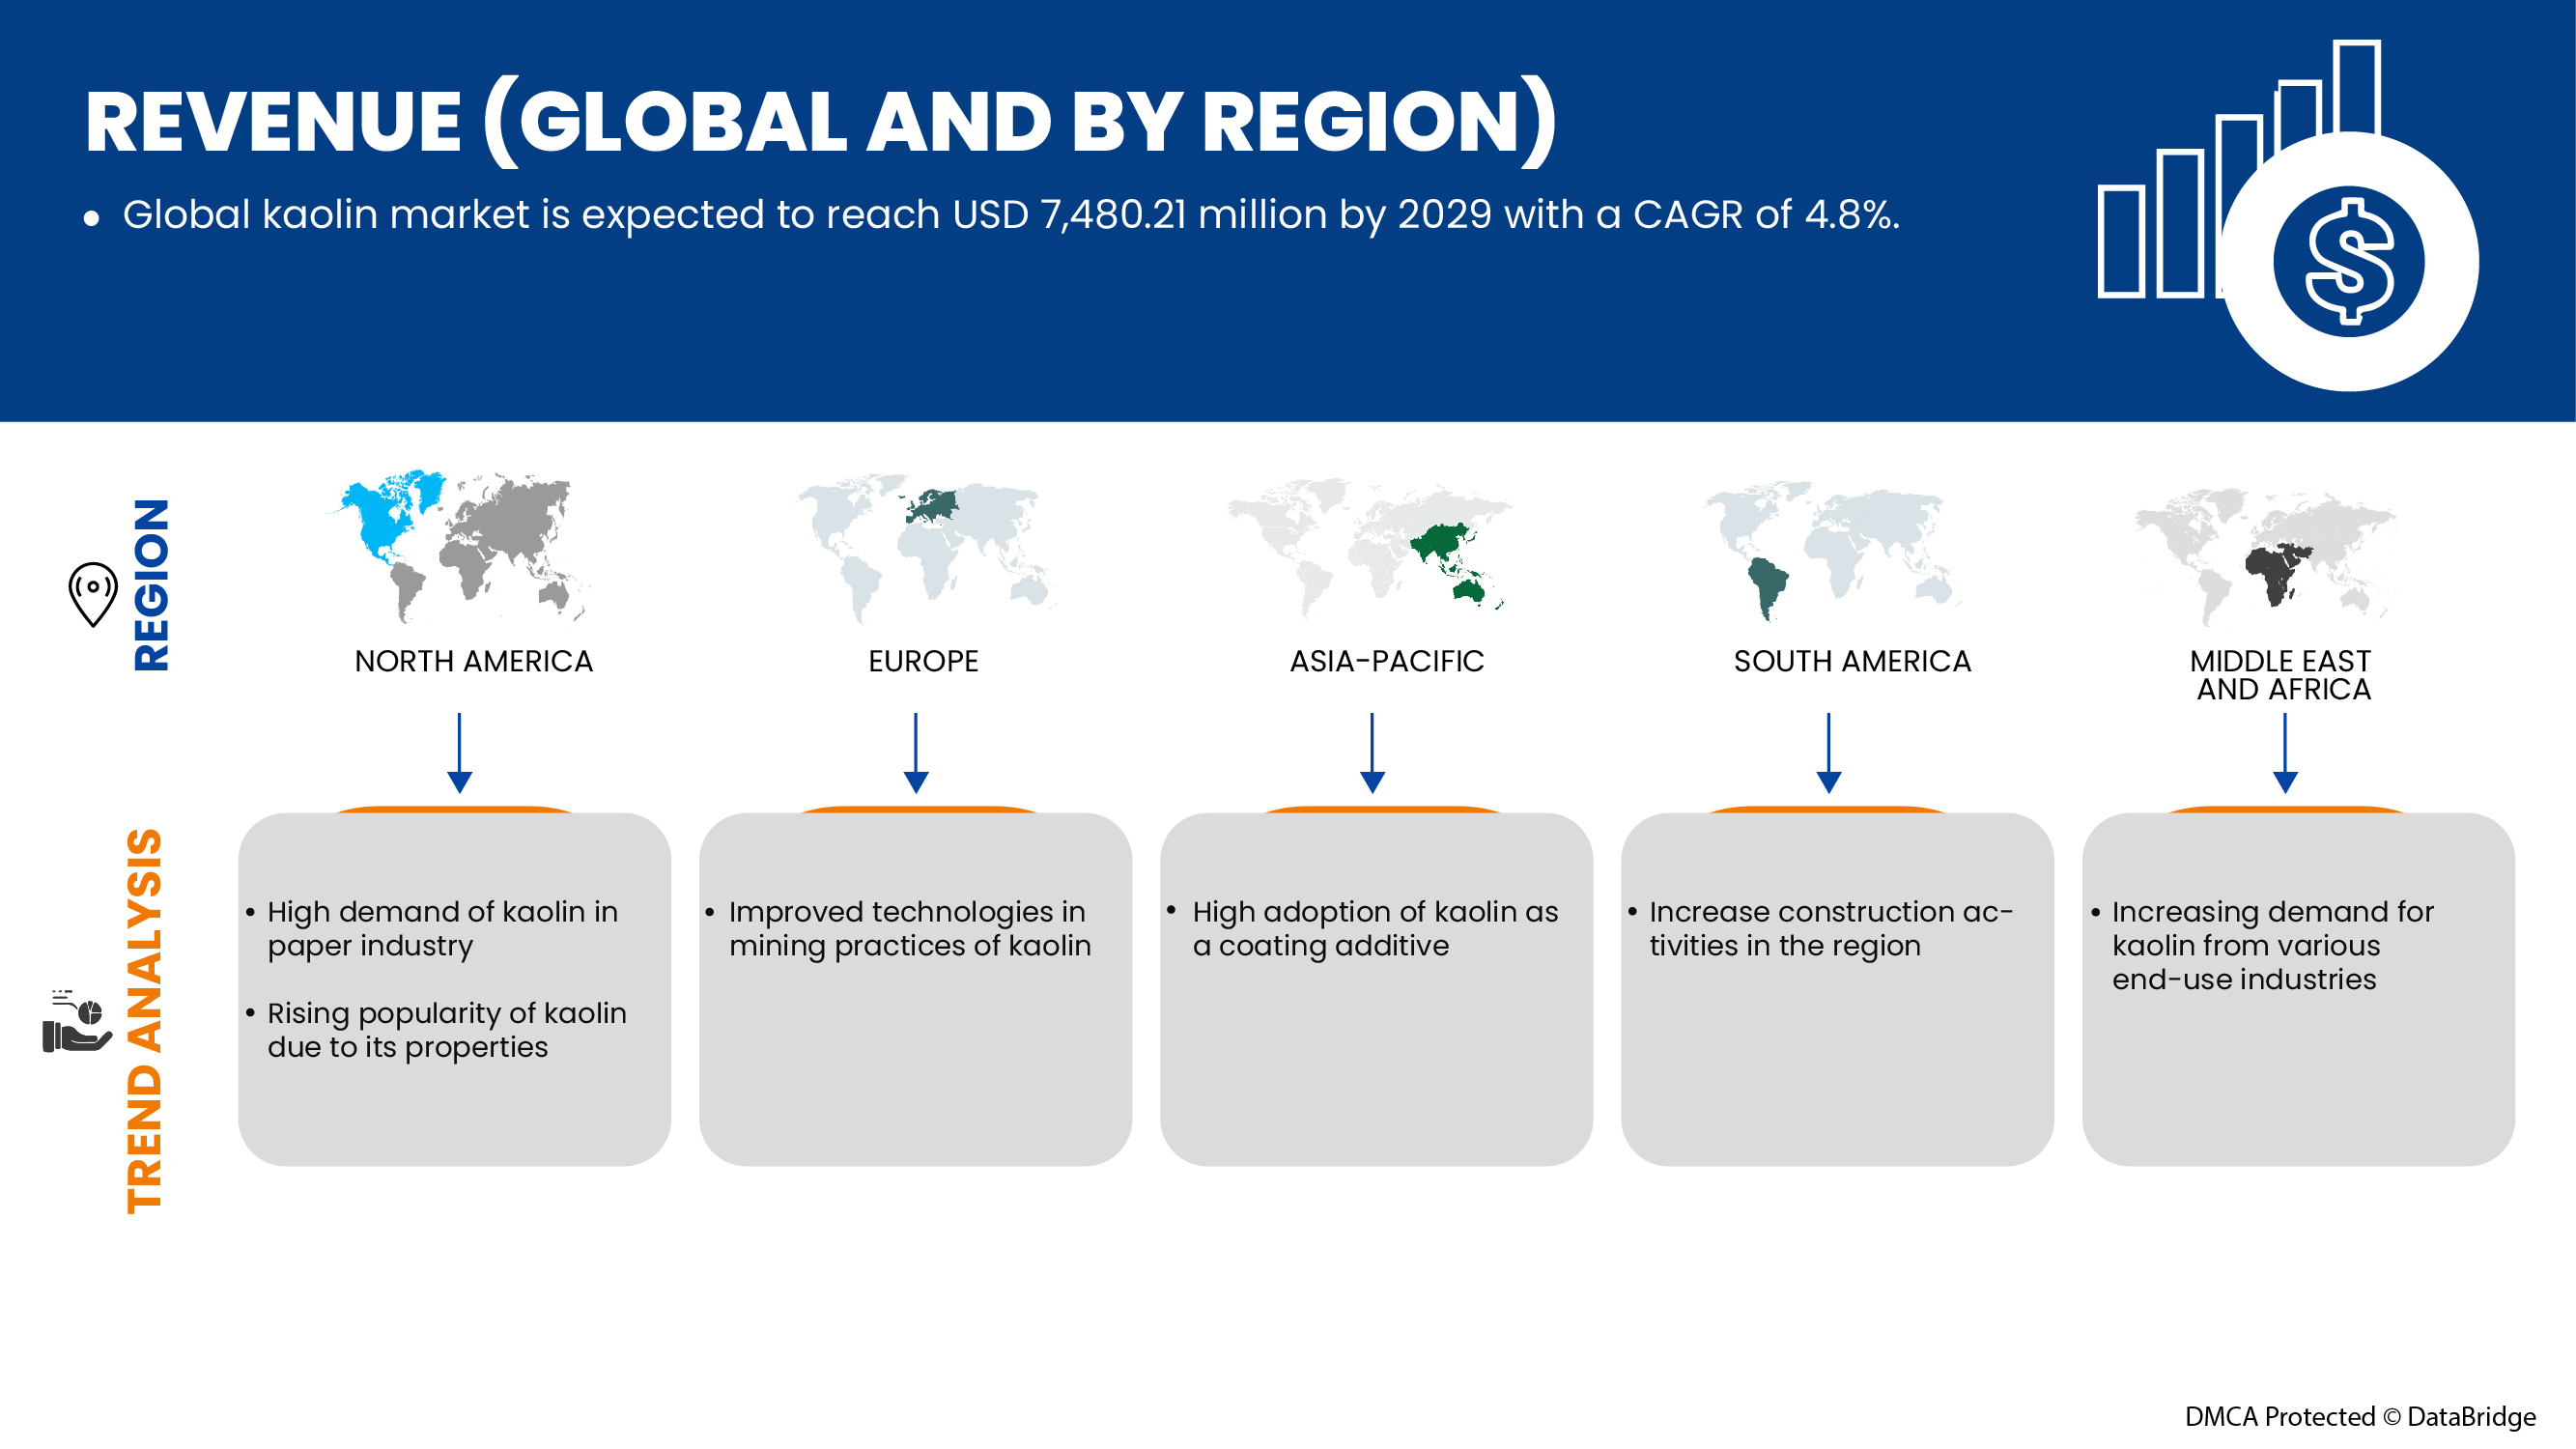
The global kaolin market is expected to grow significantly in the forecast period of 2022 to 2029. Data Bridge Market Research analyses that the market is growing with a CAGR of 4.8% in the forecast period of 2022 to 2029 and is expected to reach USD 7,480.21 million by 2029. The major factor driving the growth of the Kaolin market is the rise in construction activities across the globe, favorable chemical and physical properties of kaolin, increase in demand for kaolin from various end-use industries, and high adoption of kaolin as a coating additive.
Industries are increasingly adopting kaolin as a raw material for the production of commercially important medicinal and cosmetic products. In addition, chemical property such as adsorbing proteins, lipids, and oils has increased the use of kaolin to produce face washes, facial masks, mud packs, body scrubs, and other cosmetic products. Medicinal products, such as mouthwashes, surgical pads, drying agents, and temporary protectants against diaper rash, use kaolin as a key ingredient due to its favorable chemical properties. Therefore, extensive use of kaolin in varied applications and industries may drive the growth of the global kaolin market.
The global kaolin market report provides details of market share, new developments, and the impact of domestic and localized market players, analyses opportunities in terms of emerging revenue pockets, changes in market regulations, products approvals, strategic decisions, product launches, geographic expansions, and technological innovations in the market. To understand the analysis and the market scenario, contact us for an analyst brief. Our team will help you create a revenue impact solution to achieve your desired goal.
|
Report Metric |
Details |
|
Forecast Period |
2022 to 2029 |
|
Base Year |
2021 |
|
Historic Years |
2020 (Customizable to 2019 - 2014) |
|
Quantitative Units |
Revenue in USD Million |
|
Segments Covered |
By Grade (Calcined, Hydrous, Delaminated, Surface Treated, and Structured), Process (Water-Washed, Airfloat, Calcined, Delaminated, and Surface-Modified & Unprocessed), Application (Paper, Ceramics, Paint & Coatings, Fiberglass, Plastic, Rubber, Pharmaceuticals & Medical, Cosmetics, and Others) |
|
Countries Covered |
U.S., Canada, Mexico, U.K., Russia, France, Spain, Italy, Germany, Turkey, Netherlands, Switzerland, Belgium, Rest of Europe, Japan, China, South Korea, India, Singapore, Thailand, Indonesia, Malaysia, Philippines, Australia & New Zealand, and the Rest of Asia-Pacific, Brazil, Argentina, Rest of South America, Egypt, Saudi Arabia, United Arab Emirates, South Africa, Israel and Rest of the Middle East and Africa |
|
Market Players Covered |
BASF SE, LB MINERALS, Ltd., Thiele Kaolin Company, Quartz Works GmbH, KaMin LLC. / CADAM, Ashapura Group, Imerys S.A., SIBELCO, I-Minerals Inc., EICL |
Market Definition
Kaolin, also called china clay, is a soft white clay used as a necessary ingredient in manufacturing paper, rubber, cosmetics, and others. Kaolin is used as a filler agent in the paper industry with adhesive, which improves the paper's appearance, giving it varied gloss, smoothness, brightness, opacity, and printability. In addition, the product enhances paper's printability by providing added ink absorption, ink pigment holdout, and increased roughness. It is highly used in the ceramic industry for manufacturing porcelain and refractory. Kaolin improves mechanical strength and abrasion resistance in the rubber industry.
Global Kaolin Market Dynamics
This section deals with understanding the market drivers, restraints, opportunities, and challenges. All of this is discussed in detail below:
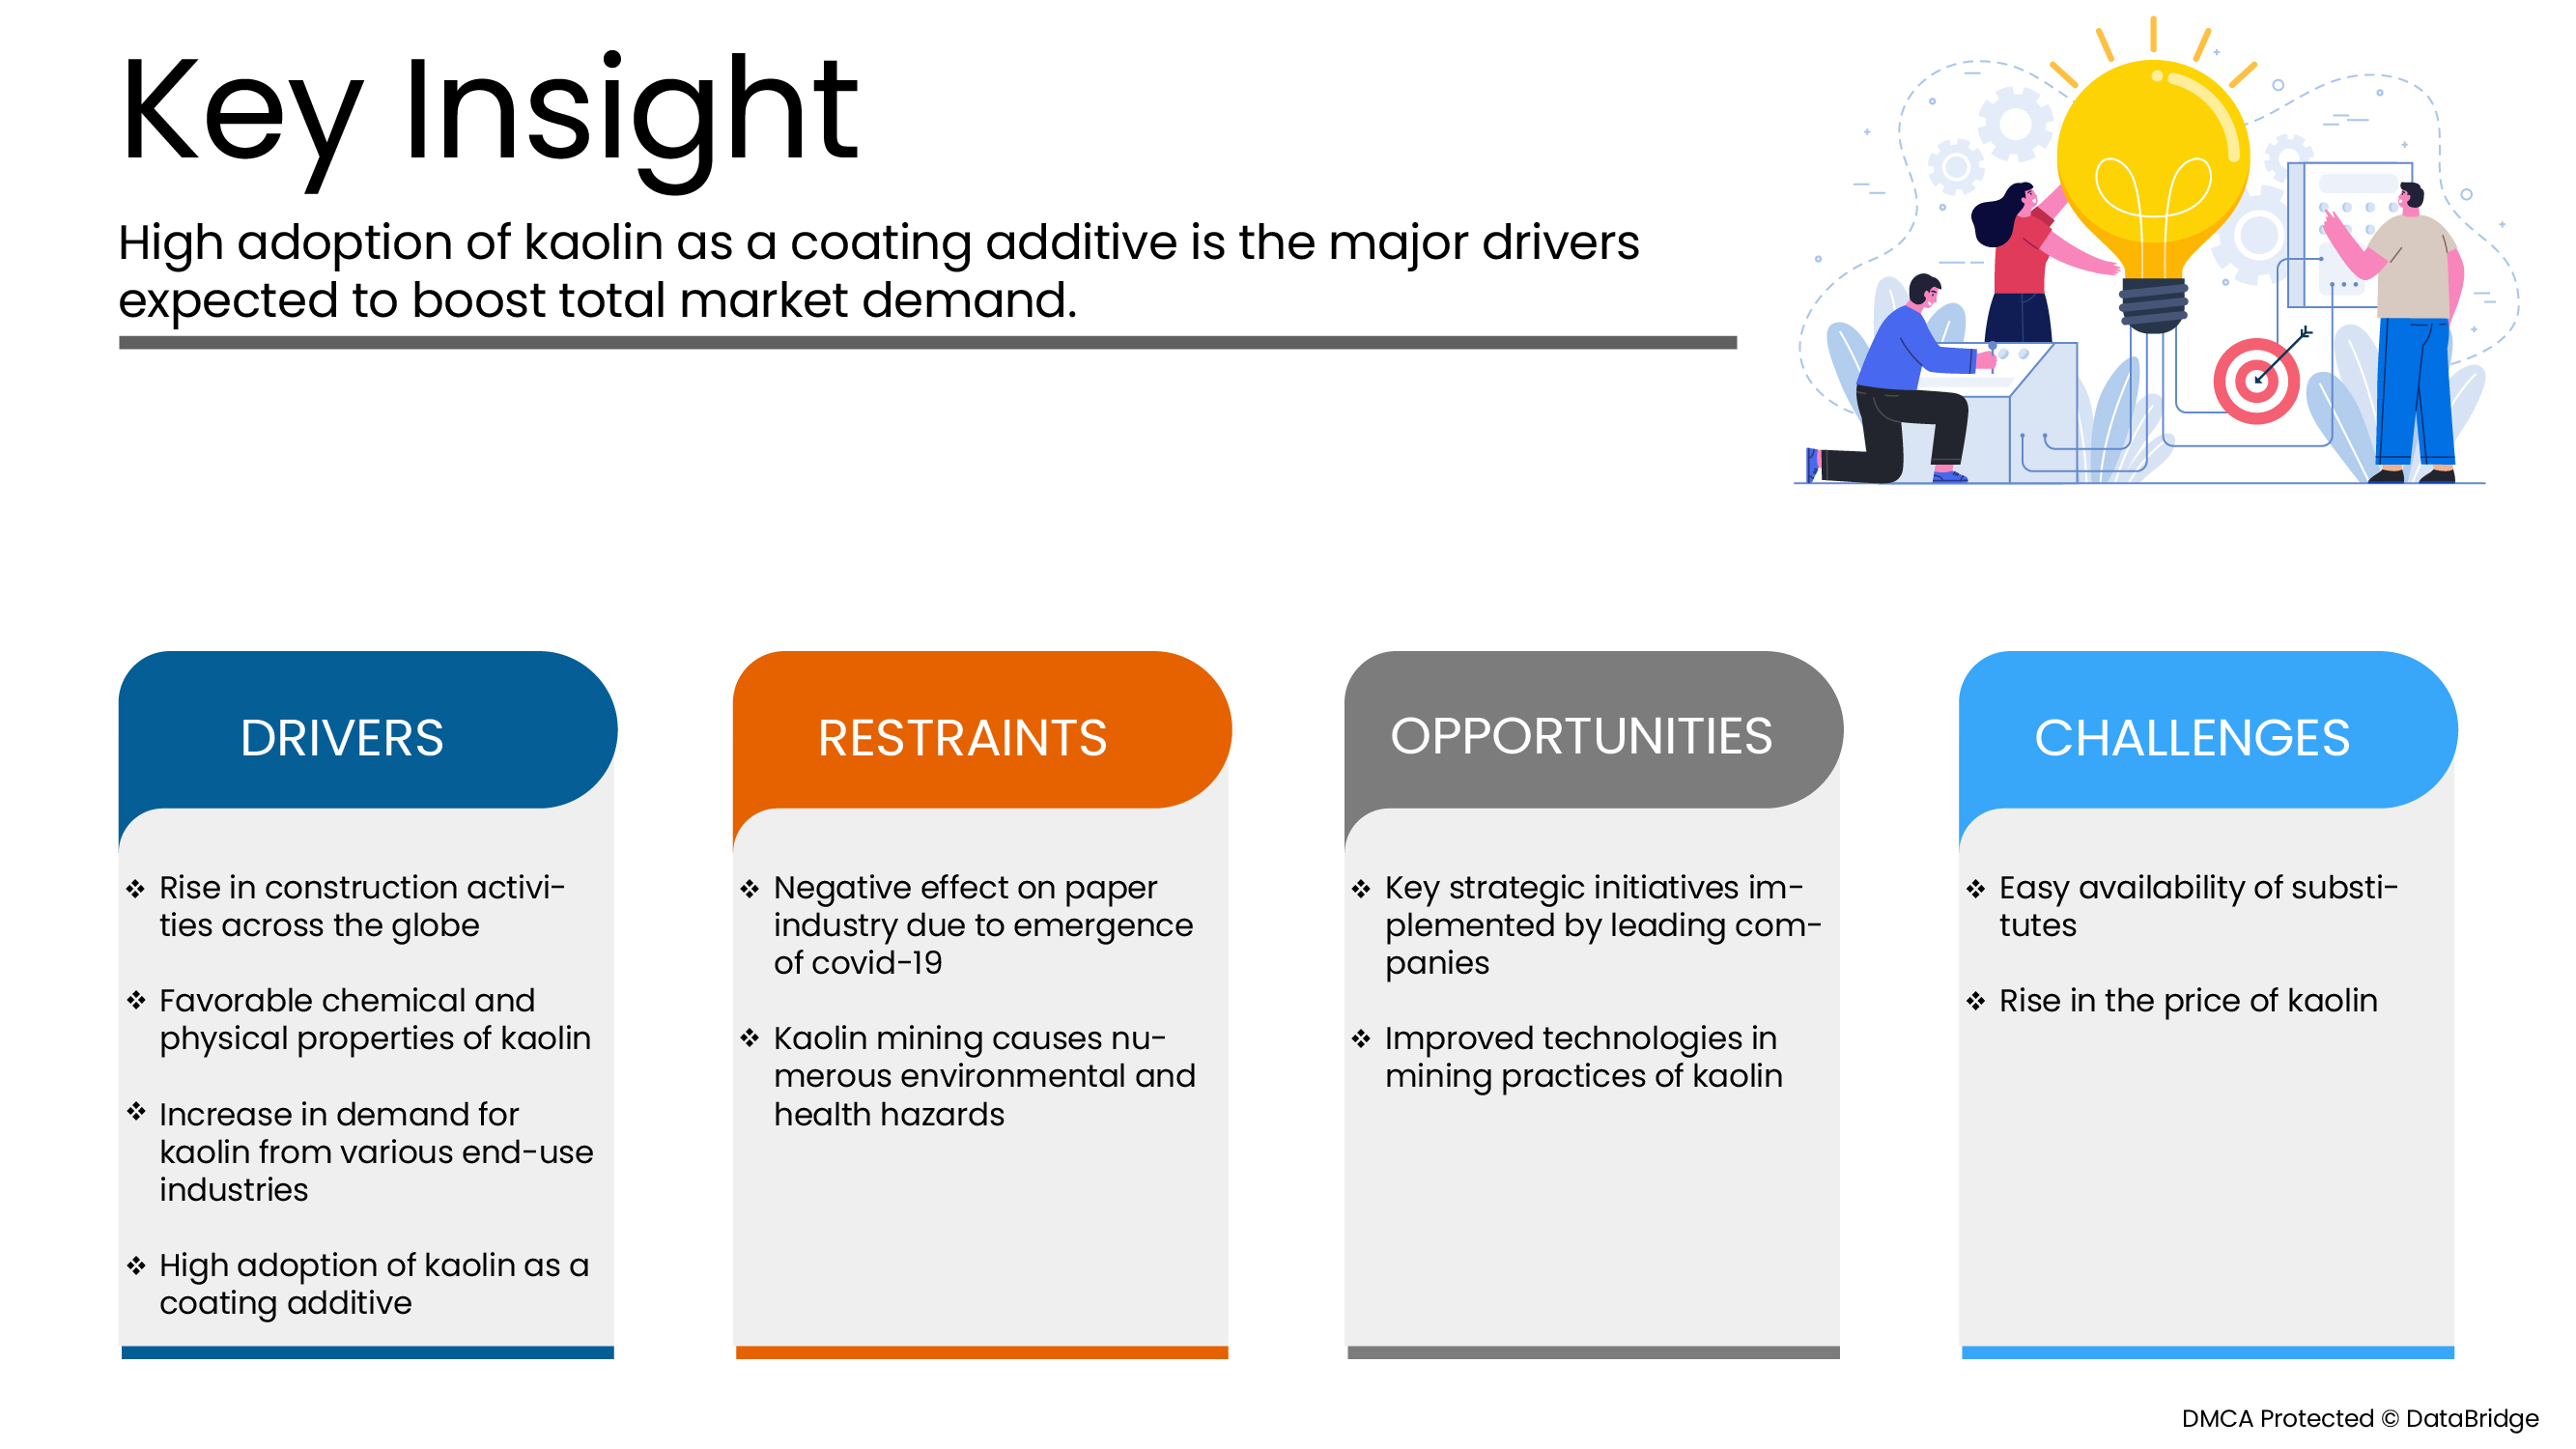
Drivers
- Rise in construction activities across the globe
Increasing construction activities in developing economies have been supported by greater migration of the rural population to urban centers and rising investment in infrastructure development. Growing product demand due to the increasing residential remodeling practices in various countries, such as the U.S. drifting consumer focus towards replacing wood floors with ceramic tiles, drives the kaolin market growth. Moreover, Europe is also expected to witness a rapid pace due to growing ceramic production and consumption in its countries.
- Favorable chemical and physical properties of kaolin
Kaolin is preferred as a metal of choice in various application and end-use industries owing to its desired and favorable chemical and physical properties it executes when used. There is a growing demand for kaolin clay in the plastics industry as its use enhances its electrical performance, durability, and strength. Moreover, the increasing adoption of ceramics is due to the opacity, chemical inertness, non-abrasive texture, and flat shape of kaolin clay. In addition, the use of kaolin in concretes and mortar is rising due to its thermal stability. Some grades of kaolin have fine particle sizes, high adsorption, and suspension properties.
- Increase in demand for kaolin from various end-use industries
Many significant variables and properties that act in favor of kaolin and rising demand for kaolin-made products have kept the kaolin market growing steadily worldwide. The most common application of kaolin is in the paper sector, allowing it to be utilized as a paper coating with a smooth texture and appropriate opacity. The increase is attributable to increased demand for paper from various end-use industries, such as packaging and printing. Furthermore, this material is widely used to fill and coat pieces as it reduces particle size and enhances strength. Kaolin is frequently used in the paper industry because it offers a variety of qualities, including good ink receptivity, paper smoothness, and the optimum opacity for paper making.
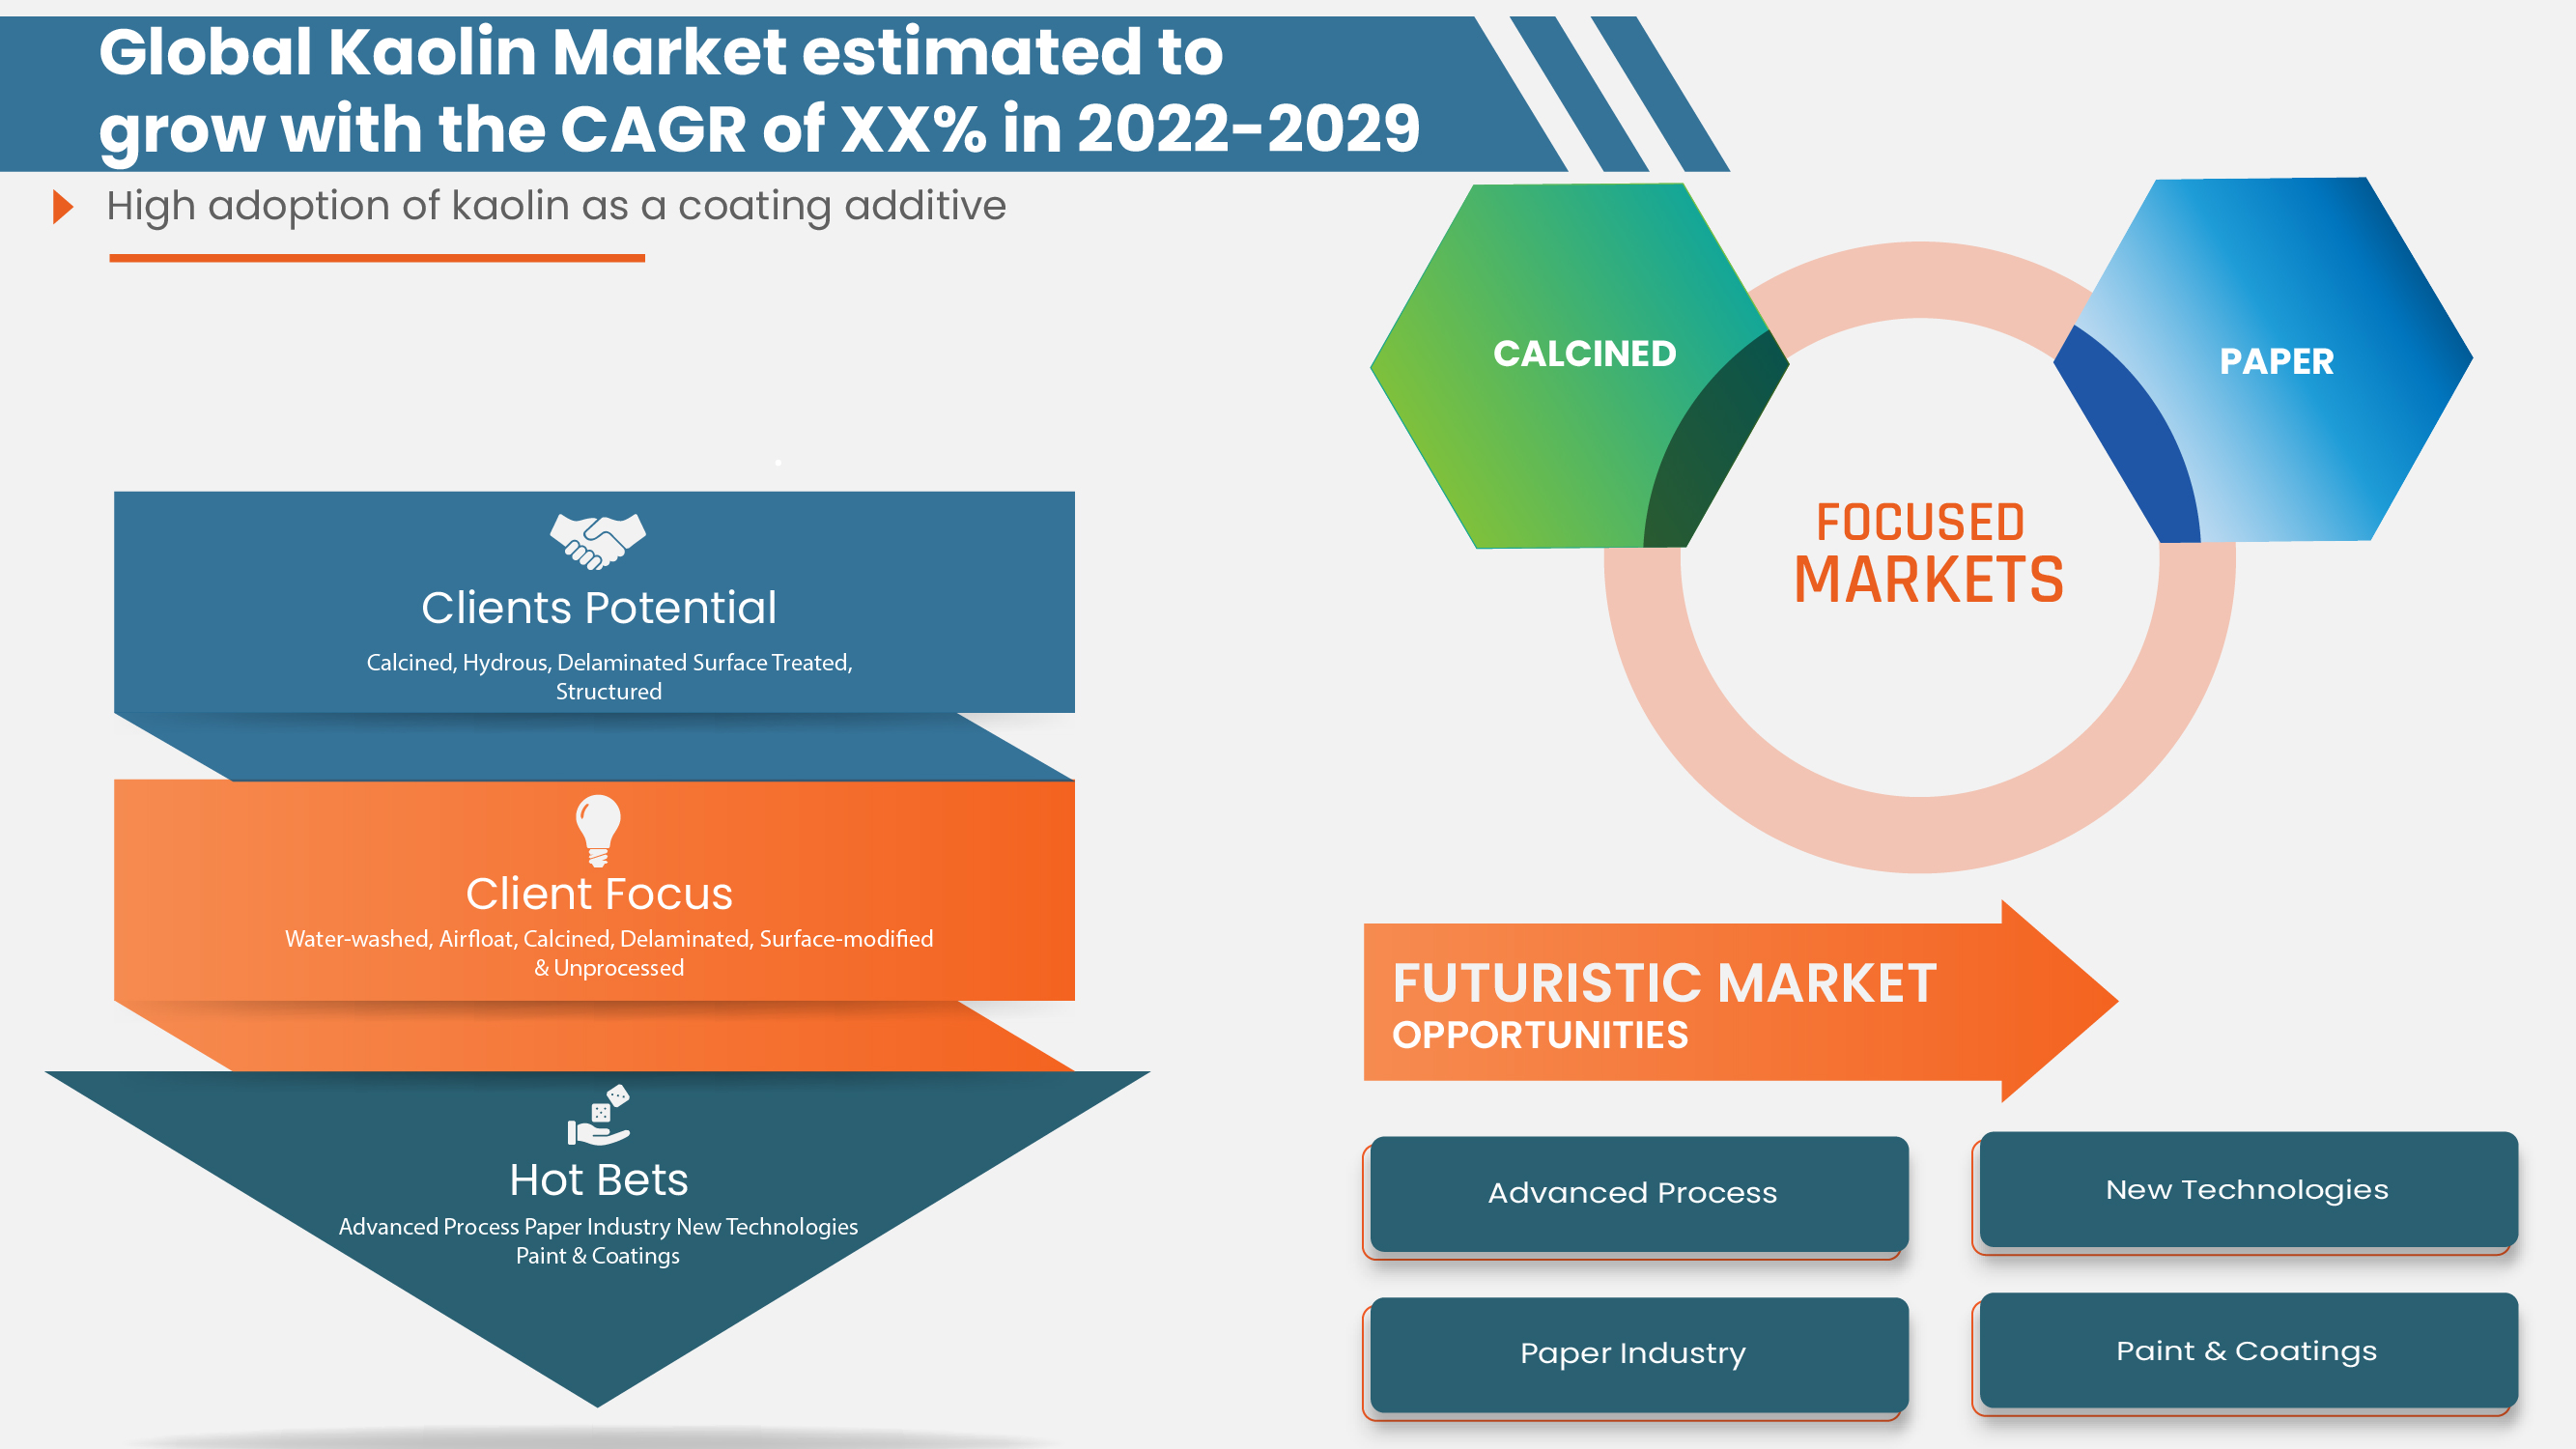
- High adoption of kaolin as a coating additive
The paper and paints & coatings industry are among the major users of kaolin in its products. Kaolin is used to enhance the performance of paints in the form of better suspension properties, rapid dispersion, corrosion resistance, superior water resistance, and reduced viscosities. In addition, kaolin is employed as a coating and filling agent when combined with adhesives in paper coating to provide its opacity, color, and printability. Kaolin is the most extensively used particulate mineral in the filling and coating paper. It improves paper appearance, characterized by gloss, smoothness, brightness, and opacity, and of greatest significance, it improves printability. Paper is also filled with kaolin to extend fiber.
Opportunity
- Key strategic initiatives implemented by leading companies
The global kaolin market has seen an unexpected negative effect due to the emergence of COVID-10 and nationwide lockdowns and movement restrictions. Therefore, the manufacturers mostly focus on keeping the liquidity flow to avoid further losses. Moreover, key players in the kaolin market have been implementing various strategic initiatives and developments to gain a major and dominant market share and enhance their operations.
Restraints/Challenges
- Negative effect on paper industry due to the emergence of covid-19
The COVID-19 outbreak has disrupted kaolin market manufacture and supply, delaying the worldwide industry's expansion. Many kaolin enterprises are employing ways to avoid downtime losses, which are increasingly concerning as the pandemic's effects endure. The performance of kaolin in paper filling applications has been eroded by competition from alternative materials, particularly calcium carbonates. Slow growth in coated paper production will limit advances for kaolin in the future, thus, restraining the development of the global kaolin market.
- Easy availability of substitutes
Some other easily available substitutes in the market are bentonite clay. Bentonite clay has powerful oil absorption properties and can absorb more than its body mass in water. This makes it an excellent ingredient for people with extremely oily skin and drives its use in cosmetic products. Bentonite clay is composed of montmorillonite, a type of smectite clay. It has high water content and swells when it comes into contact with water. This makes it effective at drawing out impurities from the skin. Another alternative is fuller's earth, which is also used for skin care and detoxification. In addition, rhassoul clay is a clay that is mined in the Atlas Mountains in Morocco. It is rich in minerals, has cleansing and conditioning properties, and is a great alternative to kaolin clay.
- Rise in the price of kaolin
The companies and players operating in the global kaolin market are focused on increasing kaolin prices to ensure the business's long-term sustainability. These players announced an increase in prices in 2021 for different applications, in which paper was among the key applications. Most companies experienced inflation in various aspects of the business, including inflation in chemicals and freight costs. In addition, the downgrade caused due to the breakout of the pandemic from key application sectors directly impacted the revenue earnings of major market participants.
Recent Development
- In July 2022, Thiele Kaolin Company announced a price increase of 9% for all product categories owing to the current global economic climate, which has resulted in increased costs to manufacturing operations worldwide. For the company, these cost increases have impacted energy, chemicals, labor, mining, maintenance, and other inputs needed to produce quality products
- In November 2021, KaMin LLC and CADAM S.A. agreed to acquire the kaolin mineral business of BASF SE. The kaolin minerals business is part of BASF's Performance Chemicals division. This greatly strengthens the company's kaolin business across the globe
Global Kaolin Market Scope
The global kaolin market is categorized based on grade, process, and application. The growth amongst these segments will help you analyze major growth segments in the industries and provide the users with a valuable market overview and market insights to make strategic decisions to identify core market applications.
Grade
- Calcined
- Hydrous
- Delaminated
- Surface treated
- Structured
Based on grade, the global kaolin market is classified into five segments, namely calcined, hydrous, delaminated, surface treated, and structured.
Process
- Water-Washed
- Airfloat
- Calcined
- Delaminated
- Surface-Modified & Unprocessed
Based on process, the global kaolin market is classified into five segments water-washed, airfloat, calcined, delaminated, and surface-modified & unprocessed.
Application
- Paper
- Ceramics
- Paint & Coatings
- Fiberglass
- Plastic
- Rubber
- Pharmaceuticals & Medical
- Cosmetics
- Others
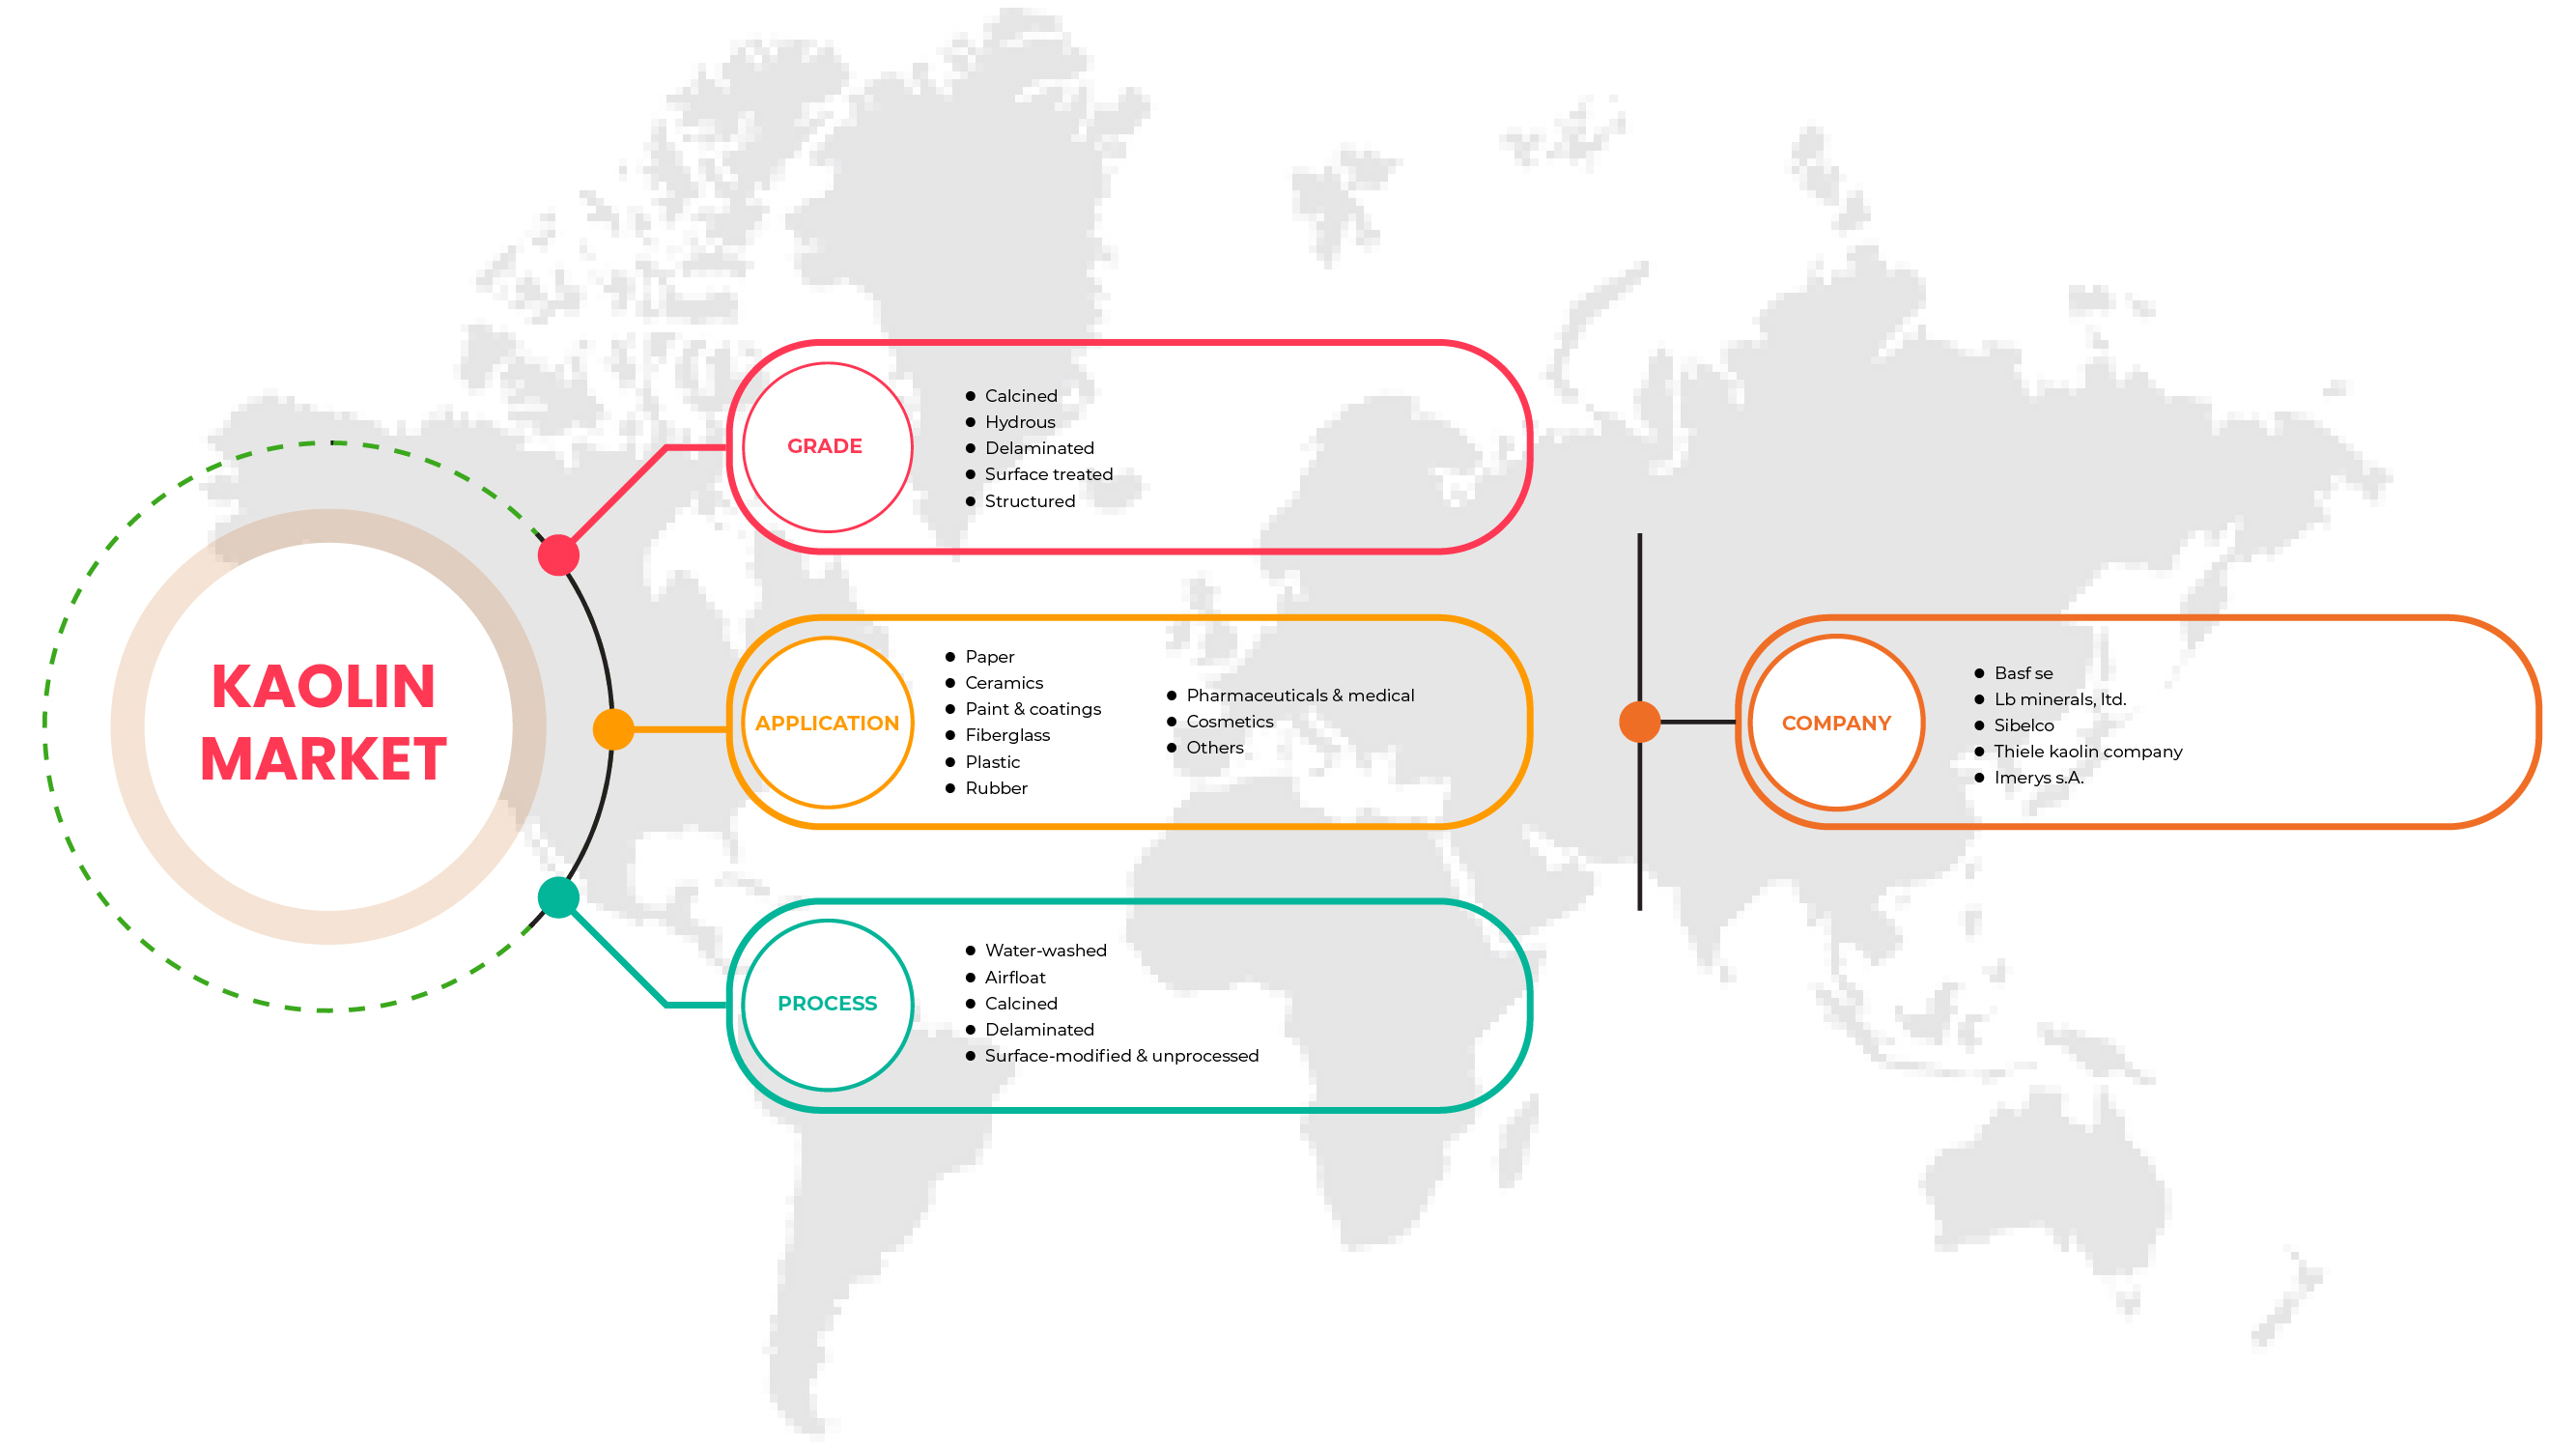
Based on the application, the global kaolin market is classified into nine segments paper, ceramics, paint & coatings, fiberglass, plastic, rubber, pharmaceuticals & medical, cosmetics, and others.
Global Kaolin Market Regional Analysis/Insights
The global kaolin market is segmented based on grade, process, and application.
The countries in the global kaolin market are the U.S., Canada, Mexico, U.K., Russia, France, Spain, Italy, Germany, Turkey, Netherlands, Switzerland, Belgium, and the Rest of Europe, Japan, China, South Korea, India, Singapore, Thailand, Indonesia, Malaysia, Philippines, Australia & New Zealand, and the rest of Asia-Pacific, Brazil, Argentina, rest of South America, Egypt, Saudi Arabia, United Arab Emirates, South Africa, Israel and rest of the Middle East and Africa.
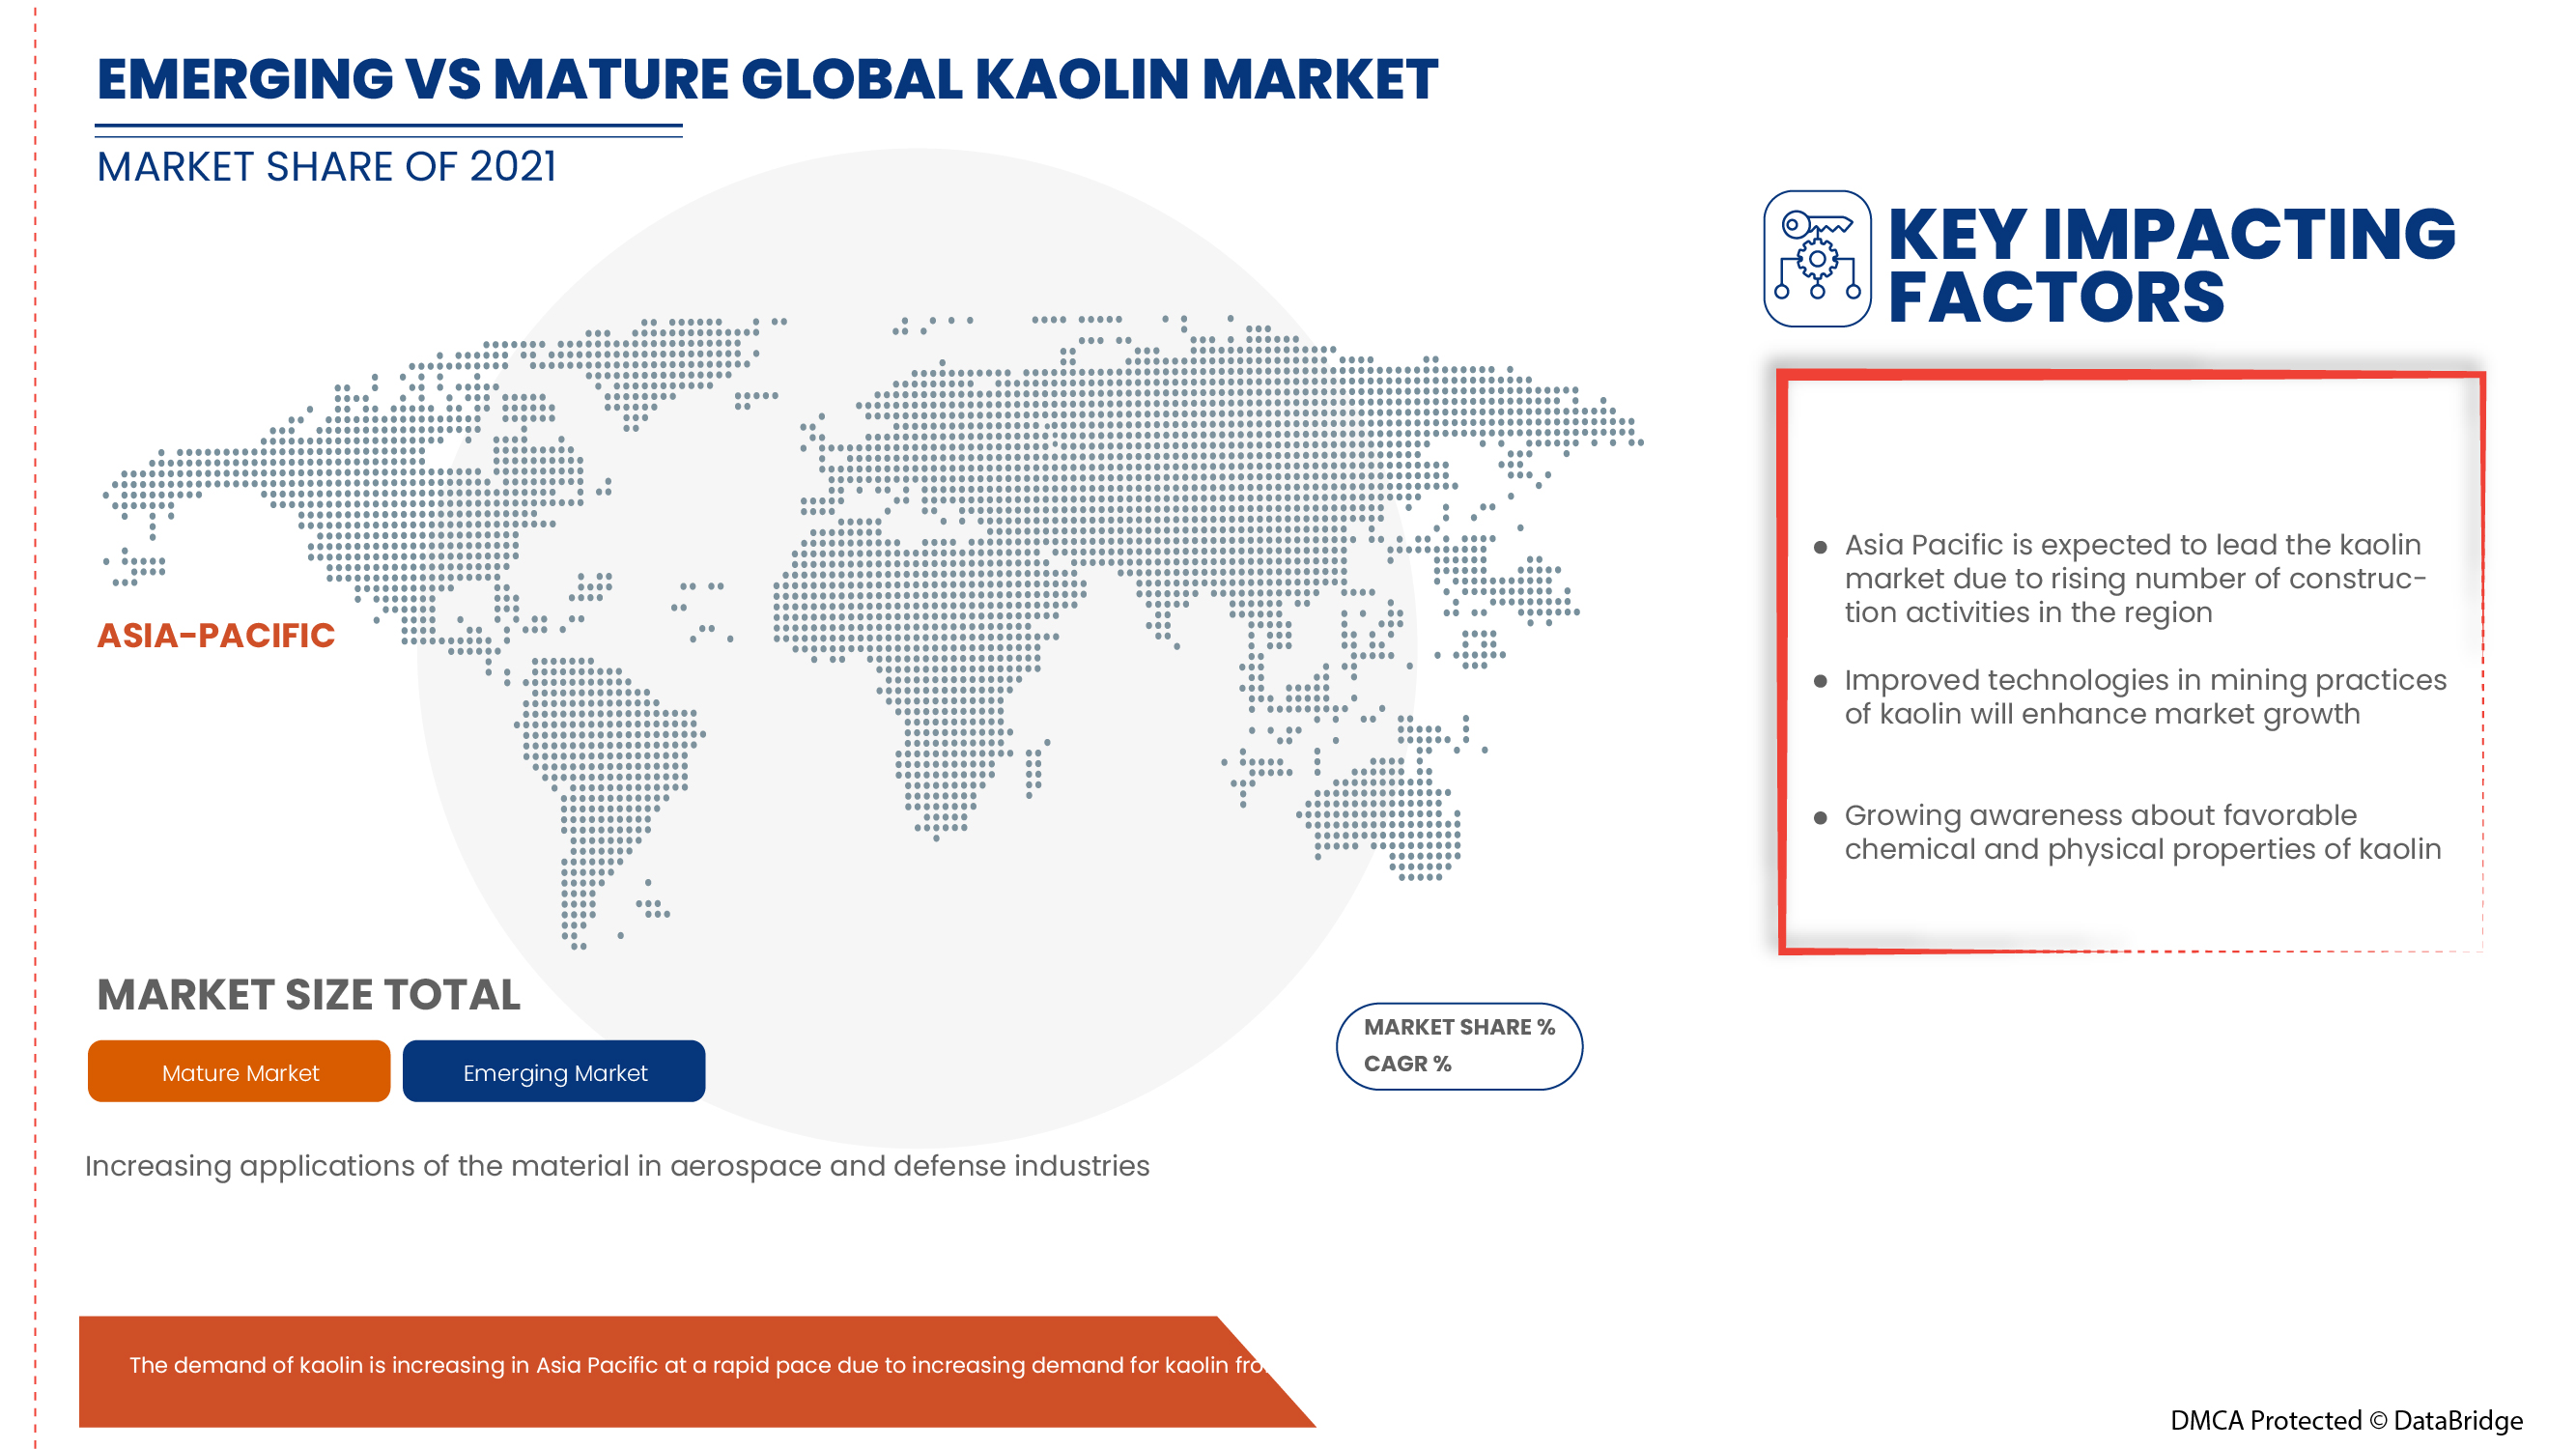
The U.S. dominates in the North American region due to the region's high adoption of kaolin as a coating additive. Germany dominated expected to dominate the Europe Kaolin market due to growing awareness of the excellent characteristics and properties of kaolin in the region. Saudi Arabia dominated the Kaolin market in the Middle East and Africa, increasing the use of paints & coatings in the region.
The country section of the report also provides individual market-impacting factors and market regulation changes that impact the market's current and future trends. Data point downstream and upstream value chain analysis, technological trends, porter's five forces analysis, and case studies are some pointers used to forecast the market scenario for individual countries. Also, the presence and availability of global brands and their challenges faced due to large or scarce competition from local and domestic brands, the impact of domestic tariffs, and trade routes are considered while providing forecast analysis of the country data.
Competitive Landscape and Global Kaolin Market Share Analysis
Global kaolin market competitive landscape provides details by competitors. Details included are company overview, company financials, revenue generated, market potential, investment in research and development, new market initiatives, production sites and facilities, company strengths and weaknesses, product launch, product trials pipelines, product approvals, patents, product width and breadth, application dominance, technology lifeline curve. The above data points provided are only related to the companies focus on the global kaolin market.
Some prominent participants operating in the global kaolin market are BASF SE, LB MINERALS, Ltd., Thiele Kaolin Company, Quartz Works GmbH, KaMin LLC. / CADAM, Ashapura Group, Imerys S.A., SIBELCO, I-MineralsInc., and EICL.
Research Methodology
Data collection and base year analysis are done using data collection modules with large sample sizes. The market data is analyzed and estimated using market statistical and coherent models. In addition, market share analysis and key trend analysis are the major success factors in the market report. The key research methodology used by the DBMR research team is data triangulation which involves data mining, analysis of the impact of data variables on the market, and primary (industry expert) validation. Data models include Vendor Positioning grids, Market Time Line Analysis, Market Overview and Guide, Company Positioning grids, Company Market Share Analysis, Standards of Measurement, Global Vs. Regional, and Vendor Share Analysis. Please request an analyst call in case of further inquiry.
SKU-
Obtenha acesso online ao relatório sobre a primeira nuvem de inteligência de mercado do mundo

- Painel interativo de análise de dados
- Painel de análise da empresa para oportunidades de elevado potencial de crescimento
- Acesso de analista de pesquisa para personalização e customização. consultas
- Análise da concorrência com painel interativo
- Últimas notícias, atualizações e atualizações Análise de tendências
- Aproveite o poder da análise de benchmark para um rastreio abrangente da concorrência
Índice
1 INTRODUÇÃO
1.1 OBJETIVOS DO ESTUDO
1.2 DEFINIÇÃO DE MERCADO
1.3 VISÃO GERAL DO MERCADO GLOBAL DE CAULIM
1.4 LIMITAÇÕES
1,5 MERCADOS COBERTOS
2 SEGMENTAÇÃO DE MERCADO
2.1 MERCADOS COBERTOS
2.2 ÂMBITO GEOGRÁFICO
2,3 ANOS CONSIDERADOS PARA O ESTUDO
2.4 MOEDA E PREÇOS
2.5 MODELO DE VALIDAÇÃO DE DADOS TRIPÉ DBMR
2.6 CURVA DA LINHA DE VIDA DO PRODUTO
2.7 MODELAGEM MULTIVARIADA
2.8 ENTREVISTAS PRINCIPAIS COM PRINCIPAIS LÍDERES DE OPINIÃO
2.9 GRADE DE POSIÇÃO DE MERCADO DBMR
2.1 GRADE DE COBERTURA DE APLICAÇÃO DE MERCADO
2.11 MATRIZ DE DESAFIOS DO MERCADO DBMR
2.12 ANÁLISE DE PARTICIPAÇÃO DE FORNECEDORES DBMR
2.13 DADOS DE IMPORTAÇÃO E EXPORTAÇÃO
2.14 FONTES SECUNDÁRIAS
2.15 PREMISSAS
3 RESUMO EXECUTIVO
4 INSIGHTS PREMIUM
4.1 ANÁLISE PESTLE
4.1.1 FATORES POLÍTICOS
4.1.2 FATORES ECONÔMICOS
4.1.3 FATORES SOCIAIS
4.1.4 FATORES TECNOLÓGICOS
4.1.5 FATORES LEGAIS
4.1.6 FATORES AMBIENTAIS
4.2 AS CINCO FORÇAS DE PORTER:
4.2.1 AMEAÇA DE NOVOS ENTRADANTES:
4.2.2 AMEAÇA DE SUBSTITUTOS:
4.2.3 PODER DE BARGANHA DO CLIENTE:
4.2.4 PODER DE BARGANHA DO FORNECEDOR:
4.2.5 CONCORRÊNCIA INTERNA (RIVALIDADE):
4.3 CRITÉRIOS CRÍTICOS DE SELEÇÃO PARA DECISÃO DE NEGÓCIOS
4.4 CENÁRIO DE IMPORTAÇÃO E EXPORTAÇÃO
4.5 PROCESSO DE FABRICAÇÃO: MERCADO GLOBAL DE CAULIM
4.6 MUDANÇAS DE MERCADO / EVENTOS ATUAIS
4.7 CAPACIDADE DE PRODUÇÃO DOS FABRICANTES: MERCADO GLOBAL DE CAULIM
4.8 ANÁLISE DA CADEIA DE SUPRIMENTOS - MERCADO GLOBAL DE CAULIM
4.8.1 VISÃO GERAL
4.8.2 CENÁRIO DE CUSTOS LOGÍSTICOS
4.8.3 IMPORTÂNCIA DOS PRESTADORES DE SERVIÇOS LOGÍSTICOS
4.9 VISÃO GERAL DAS TECNOLOGIAS
4.1 CRITÉRIOS DE SELEÇÃO DE FORNECEDORES
4.11 CENÁRIO DE ANÁLISE DE PREÇOS
4.11.1 ANÁLISE DE PREÇOS DE MATÉRIAS-PRIMAS
4.11.2 ESTATÍSTICAS DE PREÇOS ATUAIS
4.11.3 PREVISÕES DE PREÇOS
4.12 ANÁLISE DE CONSUMO DE PRODUÇÃO
4.13 COBERTURA REGULAMENTAR
4.14 CENÁRIO DE CUSTOS DE FABRICAÇÃO E IMPACTO FUTURO
5 VISÃO GERAL DO MERCADO
5.1 MOTORISTAS
5.1.1 AUMENTO DAS ATIVIDADES DE CONSTRUÇÃO EM TODO O MUNDO
5.1.2 PROPRIEDADES QUÍMICAS E FÍSICAS FAVORÁVEIS DO CAULIM
5.1.3 AUMENTO DA DEMANDA DE CAULIM POR VÁRIOS INDÚSTRIAS DE USO FINAL
5.1.4 ALTA ADOÇÃO DE CAULIM COMO ADITIVO DE REVESTIMENTO
5.2 RESTRIÇÕES
5.2.1 EFEITO NEGATIVO NA INDÚSTRIA DE PAPEL DEVIDO AO SURGIMENTO DA COVID-19
5.2.2 A MINERAÇÃO DE CAULIM CAUSA Inúmeros riscos ao meio ambiente e à saúde
5.3 OPORTUNIDADES
5.3.1 PRINCIPAIS INICIATIVAS ESTRATÉGICAS IMPLEMENTADAS POR EMPRESAS LÍDERES
5.3.2 TECNOLOGIAS MELHORADAS NAS PRÁTICAS DE MINERAÇÃO DE CAULIM
5.4 DESAFIOS
5.4.1 FÁCIL DISPONIBILIDADE DE SUBSTITUTOS
5.4.2 AUMENTO DO PREÇO DO CAULIM
6 MERCADO GLOBAL DE CAULIM, POR GRAU
6.1 VISÃO GERAL
6.2 CALCINADO
6.3 HIDRADO
6.4 DELAMINADO
6.5 SUPERFÍCIE TRATADA
6.6 ESTRUTURADO
7 MERCADO GLOBAL DE CAULIM, POR PROCESSO
7.1 VISÃO GERAL
7.2 LAVADO COM ÁGUA
7.3 FLUTUAÇÃO DE AR
7.4 CALCINADO
7,5 DELAMINADO
7.6 SUPERFÍCIE MODIFICADA E NÃO PROCESSADA
8 MERCADO GLOBAL DE CAULIM, POR APLICAÇÃO
8.1 VISÃO GERAL
8.2 PAPEL
8.3 CERÂMICA
8.4 TINTAS E REVESTIMENTOS
8,5 FIBRA DE VIDRO
8.6 PLÁSTICO
8.7 BORRACHA
8.8 PRODUTOS FARMACÊUTICOS E MÉDICOS
8.9 COSMÉTICOS
8.1 OUTROS
9 MERCADO GLOBAL DE CAULIM, POR REGIÃO
9.1 VISÃO GERAL
9.2 ÁSIA-PACÍFICO
9.2.1 CHINA
9.2.2 ÍNDIA
9.2.3 JAPÃO
9.2.4 COREIA DO SUL
9.2.5 TAILÂNDIA
9.2.6 SINGAPURA
9.2.7 INDONÉSIA
9.2.8 AUSTRÁLIA E NOVA ZELÂNDIA
9.2.9 FILIPINAS
9.2.10 MALÁSIA
9.2.11 RESTANTE DA ÁSIA-PACÍFICO
9.3 EUROPA
9.3.1 ALEMANHA
9.3.2 Reino Unido
9.3.3 FRANÇA
9.3.4 ITÁLIA
9.3.5 ESPANHA
9.3.6 RÚSSIA
9.3.7 SUÍÇA
9.3.8 TURQUIA
9.3.9 BÉLGICA
9.3.10 HOLANDA
9.3.11 RESTO DA EUROPA
9.4 AMÉRICA DO NORTE
9.4.1 EUA
9.4.2 CANADÁ
9.4.3 MÉXICO
9.5 ORIENTE MÉDIO E ÁFRICA
9.5.1 ARÁBIA SAUDITA
9.5.2 Emirados Árabes Unidos
9.5.3 ÁFRICA DO SUL
9.5.4 EGITO
9.5.5 ISRAEL
9.5.6 RESTANTE DO ORIENTE MÉDIO E ÁFRICA
9.6 AMÉRICA DO SUL
9.6.1 BRASIL
9.6.2 ARGENTINA
9.6.3 RESTO DA AMÉRICA DO SUL
10 MERCADO GLOBAL DE CAULIM: PANORAMA DA EMPRESA
10.1 ANÁLISE DE AÇÕES DA EMPRESA: GLOBAL
10.2 ANÁLISE DE AÇÕES DA EMPRESA: AMÉRICA DO NORTE
10.3 ANÁLISE DE AÇÕES DA EMPRESA: EUROPA
10.4 ANÁLISE DE AÇÕES DA EMPRESA: ÁSIA-PACÍFICO
10.5 DESINVESTIMENTO
10.6 AUMENTO DE PREÇO
10.7 AQUISIÇÃO
10.8 EXPANSÃO DAS INSTALAÇÕES
11 ANÁLISE SWOT
12 PERFIS DE EMPRESAS
12.1 IMERYS SA
12.1.1 RESUMO DA EMPRESA
12.1.2 ANÁLISE DE RECEITA
12.1.3 ANÁLISE DAS AÇÕES DA EMPRESA
12.1.4 PORTFÓLIO DE PRODUTOS
12.1.5 DESENVOLVIMENTO RECENTE
12.2 SIBELCO
12.2.1 RESUMO DA EMPRESA
12.2.2 ANÁLISE DE RECEITA
12.2.3 ANÁLISE DAS AÇÕES DA EMPRESA
12.2.4 PORTFÓLIO DE PRODUTOS
12.2.5 DESENVOLVIMENTO RECENTE
12.3 BASF SE
12.3.1 RESUMO DA EMPRESA
12.3.2 ANÁLISE DE RECEITA
12.3.3 ANÁLISE DE AÇÕES DA EMPRESA
12.3.4 PORTFÓLIO DE PRODUTOS
12.3.5 DESENVOLVIMENTO RECENTE
12.4 KAMIN LLC. / CADAM
12.4.1 RESUMO DA EMPRESA
12.4.2 ANÁLISE DAS AÇÕES DA EMPRESA
12.4.3 PORTFÓLIO DE PRODUTOS
12.4.4 DESENVOLVIMENTOS RECENTES
12.5 THIELE KAULIN COMPANY
12.5.1 RESUMO DA EMPRESA
12.5.2 ANÁLISE DAS AÇÕES DA EMPRESA
12.5.3 PORTFÓLIO DE PRODUTOS
12.5.4 DESENVOLVIMENTOS RECENTES
12.6 GRUPO ASHAPURA
12.6.1 RESUMO DA EMPRESA
12.6.2 ANÁLISE DE RECEITA
12.6.3 PORTFÓLIO DE PRODUTOS
12.6.4 DESENVOLVIMENTOS RECENTES
12.7 EICL
12.7.1 RESUMO DA EMPRESA
12.7.2 ANÁLISE DE RECEITA
12.7.3 PORTFÓLIO DE PRODUTOS
12.7.4 DESENVOLVIMENTOS RECENTES
12.8 I-MINERALSINC.
12.8.1 RESUMO DA EMPRESA
12.8.2 ANÁLISE DE RECEITA
12.8.3 PORTFÓLIO DE PRODUTOS
12.8.4 DESENVOLVIMENTOS RECENTES
12,9 LB MINERAIS, LTDA.
12.9.1 RESUMO DA EMPRESA
12.9.2 PORTFÓLIO DE PRODUTOS
12.9.3 DESENVOLVIMENTOS RECENTES
12.1 QUARTZ WORKS GMBH
12.10.1 RESUMO DA EMPRESA
12.10.2 PORTFÓLIO DE PRODUTOS
12.10.3 DESENVOLVIMENTOS RECENTES
13 QUESTIONÁRIO
14 RELATÓRIOS RELACIONADOS
Lista de Tabela
TABELA 1 DADOS DE IMPORTAÇÃO DE CAULIM E OUTRAS ARGILAS CAULÍNICAS, CALCINADAS OU NÃO; CÓDIGO SH – 2507 (MIL USD)
TABELA 2 DADOS DE EXPORTAÇÃO DE CAULIM E OUTRAS ARGILAS CAULÍNICAS, CALCINADAS OU NÃO; CÓDIGO SH – 2507 (MIL USD)
TABELA 3 A TABELA A SEGUIR MOSTRA AS CAPACIDADES DE PRODUÇÃO DE DIVERSAS EMPRESAS QUE OPERAM NO MERCADO GLOBAL DE CAULIM.
TABELA 4 QUADRO REGULAMENTAR
TABELA 5 MERCADO GLOBAL DE CAULIM, POR GRAU, 2020-2029 (US$ MILHÕES)
TABELA 6 MERCADO GLOBAL DE CAULIM, POR GRAU, 2020-2029 (QUILO TONELADAS)
TABELA 7 MERCADO GLOBAL DE CALCINADO EM CAULIM, POR REGIÃO, 2020-2029 (US$ MILHÕES)
TABELA 8 MERCADO GLOBAL DE CALCINADO EM CAULIM, POR REGIÃO, 2020-2029 (QUILO TONELADAS)
TABELA 9 HIDRADO GLOBAL NO MERCADO GLOBAL DE CAULIM, POR REGIÃO, 2020-2029 (US$ MILHÕES)
TABELA 10 HIDRADO GLOBAL NO MERCADO GLOBAL DE CAULIM, POR REGIÃO, 2020-2029 (QUILO TONELADAS)
TABELA 11 DELAMINADOS GLOBAIS NO MERCADO GLOBAL DE CAULIM, POR REGIÃO, 2020-2029 (US$ MILHÕES)
TABELA 12 DELAMINADOS GLOBAIS NO MERCADO GLOBAL DE CAULIM, POR REGIÃO, 2020-2029 (QUILO TONELADAS)
TABELA 13 SUPERFÍCIES TRATADAS NO MERCADO GLOBAL DE CAULIM, POR REGIÃO, 2020-2029 (US$ MILHÕES)
TABELA 14 SUPERFÍCIE GLOBAL TRATADA NO MERCADO GLOBAL DE CAULIM, POR REGIÃO, 2020-2029 (QUILO TONELADAS)
TABELA 15 ESTRUTURA GLOBAL DO MERCADO GLOBAL DE CAULIM, POR REGIÃO, 2020-2029 (US$ MILHÕES)
TABELA 16 ESTRUTURA GLOBAL DO MERCADO GLOBAL DE CAULIM, POR REGIÃO, 2020-2029 (QUILO TONELADAS)
TABELA 17 MERCADO GLOBAL DE CAULIM, POR PROCESSO, 2020-2029 (US$ MILHÕES)
TABELA 18 MERCADO GLOBAL DE CAULIM, POR GRAU, 2020-2029 (QUILO TONELADAS)
TABELA 19 MERCADO GLOBAL DE CAULIM LAVADO COM ÁGUA, POR REGIÃO, 2020-2029 (US$ MILHÕES)
TABELA 20 MERCADO GLOBAL DE CAULIM LAVADO COM ÁGUA, POR REGIÃO, 2020-2029 (QUILO TONELADAS)
TABELA 21 FLUTUAÇÃO GLOBAL DE AR NO MERCADO GLOBAL DE CAULIM, POR REGIÃO, 2020-2029 (US$ MILHÕES)
TABELA 22 FLUTUAÇÃO GLOBAL DE AR NO MERCADO GLOBAL DE CAULIM, POR REGIÃO, 2020-2029 (QUILO TONELADAS)
TABELA 23 CALCINADO GLOBAL NO MERCADO GLOBAL DE CAULIM, POR REGIÃO, 2020-2029 (US$ MILHÕES)
TABELA 24 CALCINADO GLOBAL NO MERCADO GLOBAL DE CAULIM, POR REGIÃO, 2020-2029 (QUILO TONELADAS)
TABELA 25 DELAMINADOS GLOBAIS NO MERCADO GLOBAL DE CAULIM, POR REGIÃO, 2020-2029 (US$ MILHÕES)
TABELA 26 DELAMINADO GLOBAL NO MERCADO GLOBAL DE CAULIM, POR REGIÃO, 2020-2029 (QUILO TONELADAS)
TABELA 27 MERCADO GLOBAL DE CAULIM SUPERFICIALMENTE MODIFICADO E NÃO PROCESSADO, POR REGIÃO, 2020-2029 (US$ MILHÕES)
TABELA 28 MERCADO GLOBAL DE CAULIM SUPERFICIALMENTE MODIFICADO E NÃO PROCESSADO, POR REGIÃO, 2020-2029 (QUILO TONELADAS)
TABELA 29 MERCADO GLOBAL DE CAULIM, POR APLICAÇÃO, 2020-2029 (US$ MILHÕES)
TABELA 30 MERCADO GLOBAL DE CAULIM, POR APLICAÇÃO, 2020-2029 (QUILO TONELADAS)
TABELA 31 MERCADO GLOBAL DE PAPEL NO CAULIM, POR REGIÃO, 2020-2029 (US$ MILHÕES)
TABELA 32 MERCADO GLOBAL DE PAPEL NO CAULIM, POR REGIÃO, 2020-2029 (QUILO TONELADAS)
TABELA 33 CERÂMICAS GLOBAIS NO MERCADO GLOBAL DE CAULIM, POR REGIÃO, 2020-2029 (US$ MILHÕES)
TABELA 34 CERÂMICAS GLOBAIS NO MERCADO GLOBAL DE CAULIM, POR REGIÃO, 2020-2029 (QUILO TONELADAS)
TABELA 35 TINTAS E REVESTIMENTOS GLOBAIS NO MERCADO GLOBAL DE CAULIM, POR REGIÃO, 2020-2029 (US$ MILHÕES)
TABELA 36 TINTAS E REVESTIMENTOS GLOBAIS NO MERCADO GLOBAL DE CAULIM, POR REGIÃO, 2020-2029 (QUILO TONELADAS)
TABELA 37 FIBRA DE VIDRO NO MERCADO GLOBAL DE CAULIM, POR REGIÃO, 2020-2029 (US$ MILHÕES)
TABELA 38 FIBRA DE VIDRO NO MERCADO GLOBAL DE CAULIM, POR REGIÃO, 2020-2029 (QUILO TONELADAS)
TABELA 39 PLÁSTICO GLOBAL NO MERCADO GLOBAL DE CAULIM, POR REGIÃO, 2020-2029 (US$ MILHÕES)
TABELA 40 PLÁSTICO GLOBAL NO MERCADO GLOBAL DE CAULIM, POR REGIÃO, 2020-2029 (QUILO TONELADAS)
TABELA 41 BORRACHA GLOBAL NO MERCADO GLOBAL DE CAULIM, POR REGIÃO, 2020-2029 (US$ MILHÕES)
TABELA 42 BORRACHA GLOBAL NO MERCADO GLOBAL DE CAULIM, POR REGIÃO, 2020-2029 (QUILO TONELADAS)
TABELA 43 PRODUTOS FARMACÊUTICOS E MÉDICOS GLOBAIS NO MERCADO GLOBAL DE CAULIM, POR REGIÃO, 2020-2029 (US$ MILHÕES)
TABELA 44 PRODUTOS FARMACÊUTICOS E MÉDICOS GLOBAIS NO MERCADO GLOBAL DE CAULIM, POR REGIÃO, 2020-2029 (QUILO TONELADAS)
TABELA 45 COSMÉTICOS GLOBAIS NO MERCADO GLOBAL DE CAULIM, POR REGIÃO, 2020-2029 (US$ MILHÕES)
TABELA 46 COSMÉTICOS GLOBAIS NO MERCADO GLOBAL DE CAULIM, POR REGIÃO, 2020-2029 (QUILO TONELADAS)
TABELA 47 OUTROS NO MERCADO GLOBAL DE CAULIM, POR REGIÃO, 2020-2029 (US$ MILHÕES)
TABELA 48 OUTROS NO MERCADO GLOBAL DE CAULIM, POR REGIÃO, 2020-2029 (QUILO TONELADAS)
TABELA 49 MERCADO GLOBAL DE CAULIM, POR REGIÃO, 2020-2029 (US$ MILHÕES)
TABELA 50 MERCADO GLOBAL DE CAULIM, POR REGIÃO, 2020-2029 (QUILO TONELADAS)
TABELA 51 MERCADO DE CAULIM DA ÁSIA-PACÍFICO, POR PAÍS, 2020-2029 (US$ MILHÕES)
TABELA 52 MERCADO DE CAULIM DA ÁSIA-PACÍFICO, POR PAÍS, 2020-2029 (QUILO TONELADAS)
TABELA 53 MERCADO DE CAULIM DA ÁSIA-PACÍFICO, POR GRAU, 2020-2029 (US$ MILHÕES)
TABELA 54 MERCADO DE CAULIM DA ÁSIA-PACÍFICO, POR GRAU, 2020-2029 (QUILO TONELADAS)
TABELA 55 MERCADO DE CAULIM DA ÁSIA-PACÍFICO, POR PROCESSO, 2020-2029 (US$ MILHÕES)
TABELA 56 MERCADO DE CAULIM DA ÁSIA-PACÍFICO, POR PROCESSO, 2020-2029 (QUILO TONELADAS)
TABELA 57 MERCADO DE CAULIM DA ÁSIA-PACÍFICO, POR APLICAÇÃO, 2020-2029 (US$ MILHÕES)
TABELA 58 MERCADO DE CAULIM DA ÁSIA-PACÍFICO, POR APLICAÇÃO, 2020-2029 (QUILO TONELADAS)
TABELA 59 MERCADO DE CAULIM DA CHINA, POR GRAU, 2020-2029 (US$ MILHÕES)
TABELA 60 MERCADO DE CAULIM DA CHINA, POR GRAU, 2020-2029 (QUILO TONELADAS)
TABELA 61 MERCADO DE CAULIM DA CHINA, POR PROCESSO, 2020-2029 (US$ MILHÕES)
TABELA 62 MERCADO DE CAULIM DA CHINA, POR PROCESSO, 2020-2029 (QUILO TONELADAS)
TABELA 63 MERCADO DE CAULIM DA CHINA, POR APLICAÇÃO, 2020-2029 (US$ MILHÕES)
TABELA 64 MERCADO DE CAULIM DA CHINA, POR APLICAÇÃO, 2020-2029 (QUILO TONELADAS)
TABELA 65 MERCADO DE CAULIM DA ÍNDIA, POR GRAU, 2020-2029 (US$ MILHÕES)
TABELA 66 MERCADO DE CAULIM DA ÍNDIA, POR GRAU, 2020-2029 (QUILO TONELADAS)
TABELA 67 MERCADO DE CAULIM DA ÍNDIA, POR PROCESSO, 2020-2029 (US$ MILHÕES)
TABELA 68 MERCADO DE CAULIM DA ÍNDIA, POR PROCESSO, 2020-2029 (QUILO TONELADAS)
TABELA 69 MERCADO DE CAULIM DA ÍNDIA, POR APLICAÇÃO, 2020-2029 (US$ MILHÕES)
TABELA 70 MERCADO DE CAULIM DA ÍNDIA, POR APLICAÇÃO, 2020-2029 (QUILO TONELADAS)
TABELA 71 MERCADO DE CAULIM DO JAPÃO, POR GRAU, 2020-2029 (US$ MILHÕES)
TABELA 72 MERCADO DE CAULIM NO JAPÃO, POR GRAU, 2020-2029 (QUILO TONELADAS)
TABELA 73 MERCADO DE CAULIM DO JAPÃO, POR PROCESSO, 2020-2029 (US$ MILHÕES)
TABELA 74 MERCADO DE CAULIM DO JAPÃO, POR PROCESSO, 2020-2029 (QUILO TONELADAS)
TABELA 75 MERCADO DE CAULIM DO JAPÃO, POR APLICAÇÃO, 2020-2029 (US$ MILHÕES)
TABELA 76 MERCADO DE CAULIM DO JAPÃO, POR APLICAÇÃO, 2020-2029 (QUILO TONELADAS)
TABELA 77 MERCADO DE CAULIM DA COREIA DO SUL, POR GRAU, 2020-2029 (US$ MILHÕES)
TABELA 78 MERCADO DE CAULIM DA COREIA DO SUL, POR GRAU, 2020-2029 (QUILO TONELADAS)
TABELA 79 MERCADO DE CAULIM DA COREIA DO SUL, POR PROCESSO, 2020-2029 (US$ MILHÕES)
TABELA 80 MERCADO DE CAULIM DA COREIA DO SUL, POR PROCESSO, 2020-2029 (QUILO TONELADAS)
TABELA 81 MERCADO DE CAULIM DA COREIA DO SUL, POR APLICAÇÃO, 2020-2029 (US$ MILHÕES)
TABELA 82 MERCADO DE CAULIM DA COREIA DO SUL, POR APLICAÇÃO, 2020-2029 (QUILO TONELADAS)
TABELA 83 MERCADO DE CAULIM DA TAILÂNDIA, POR GRAU, 2020-2029 (US$ MILHÕES)
TABELA 84 MERCADO DE CAULIM DA TAILÂNDIA, POR GRAU, 2020-2029 (QUILO TONELADAS)
TABELA 85 MERCADO DE CAULIM DA TAILÂNDIA, POR PROCESSO, 2020-2029 (US$ MILHÕES)
TABELA 86 MERCADO DE CAULIM DA TAILÂNDIA, POR PROCESSO, 2020-2029 (QUILO TONELADAS)
TABELA 87 MERCADO DE CAULIM DA TAILÂNDIA, POR APLICAÇÃO, 2020-2029 (US$ MILHÕES)
TABELA 88 MERCADO DE CAULIM DA TAILÂNDIA, POR APLICAÇÃO, 2020-2029 (QUILO TONELADAS)
TABELA 89 MERCADO DE CAULIM DE SINGAPURA, POR GRAU, 2020-2029 (US$ MILHÕES)
TABELA 90 MERCADO DE CAULIM DE SINGAPURA, POR GRAU, 2020-2029 (QUILO TONELADAS)
TABELA 91 MERCADO DE CAULIM DE SINGAPURA, POR PROCESSO, 2020-2029 (US$ MILHÕES)
TABELA 92 MERCADO DE CAULIM DE SINGAPURA, POR PROCESSO, 2020-2029 (QUILO TONELADAS)
TABELA 93 MERCADO DE CAULIM DE SINGAPURA, POR APLICAÇÃO, 2020-2029 (US$ MILHÕES)
TABELA 94 MERCADO DE CAULIM DE SINGAPURA, POR APLICAÇÃO, 2020-2029 (QUILO TONELADAS)
TABELA 95 MERCADO DE CAULIM DA INDONÉSIA, POR GRAU, 2020-2029 (US$ MILHÕES)
TABELA 96 MERCADO DE CAULIM DA INDONÉSIA, POR GRAU, 2020-2029 (QUILO TONELADAS)
TABELA 97 MERCADO DE CAULIM DA INDONÉSIA, POR PROCESSO, 2020-2029 (US$ MILHÕES)
TABELA 98 MERCADO DE CAULIM DA INDONÉSIA, POR PROCESSO, 2020-2029 (QUILO TONELADAS)
TABELA 99 MERCADO DE CAULIM DA INDONÉSIA, POR APLICAÇÃO, 2020-2029 (US$ MILHÕES)
TABELA 100 MERCADO DE CAULIM DA INDONÉSIA, POR APLICAÇÃO, 2020-2029 (QUILO TONELADAS)
TABELA 101 MERCADO DE CAULIM DA AUSTRÁLIA E NOVA ZELÂNDIA, POR GRAU, 2020-2029 (US$ MILHÕES)
TABELA 102 MERCADO DE CAULIM NA AUSTRÁLIA E NOVA ZELÂNDIA, POR GRAU, 2020-2029 (QUILO TONELADAS)
TABELA 103 MERCADO DE CAULIM DA AUSTRÁLIA E NOVA ZELÂNDIA, POR PROCESSO, 2020-2029 (US$ MILHÕES)
TABELA 104 MERCADO DE CAULIM DA AUSTRÁLIA E NOVA ZELÂNDIA, POR PROCESSO, 2020-2029 (QUILO TONELADAS)
TABELA 105 MERCADO DE CAULIM DA AUSTRÁLIA E NOVA ZELÂNDIA, POR APLICAÇÃO, 2020-2029 (US$ MILHÕES)
TABELA 106 MERCADO DE CAULIM DA AUSTRÁLIA E NOVA ZELÂNDIA, POR APLICAÇÃO, 2020-2029 (QUILO TONELADAS)
TABELA 107 MERCADO DE CAULIM DAS FILIPINAS, POR GRAU, 2020-2029 (US$ MILHÕES)
TABELA 108 MERCADO DE CAULIM DAS FILIPINAS, POR GRAU, 2020-2029 (QUILO TONELADAS)
TABELA 109 MERCADO DE CAULIM DAS FILIPINAS, POR PROCESSO, 2020-2029 (US$ MILHÕES)
TABELA 110 MERCADO DE CAULIM DAS FILIPINAS, POR PROCESSO, 2020-2029 (QUILO TONELADAS)
TABELA 111 MERCADO DE CAULIM NAS FILIPINAS, POR APLICAÇÃO, 2020-2029 (US$ MILHÕES)
TABELA 112 MERCADO DE CAULIM NAS FILIPINAS, POR APLICAÇÃO, 2020-2029 (QUILO TONELADAS)
TABELA 113 MERCADO DE CAULIM DA MALÁSIA, POR GRAU, 2020-2029 (US$ MILHÕES)
TABELA 114 MERCADO DE CAULIM DA MALÁSIA, POR GRAU, 2020-2029 (QUILO TONELADAS)
TABELA 115 MERCADO DE CAULIM DA MALÁSIA, POR PROCESSO, 2020-2029 (US$ MILHÕES)
TABELA 116 MERCADO DE CAULIM DA MALÁSIA, POR PROCESSO, 2020-2029 (QUILO TONELADAS)
TABELA 117 MERCADO DE CAULIM DA MALÁSIA, POR APLICAÇÃO, 2020-2029 (US$ MILHÕES)
TABELA 118 MERCADO DE CAULIM DA MALÁSIA, POR APLICAÇÃO, 2020-2029 (QUILO TONELADAS)
TABELA 119 RESTANTE DO MERCADO DE CAULIM DA ÁSIA-PACÍFICO, POR GRAU, 2020-2029 (US$ MILHÕES)
TABELA 120 MERCADO DE CAULIM DO RESTO DA ÁSIA-PACÍFICO, POR GRAU, 2020-2029 (QUILO TONELADAS)
TABELA 121 MERCADO DE CAULIM NA EUROPA, POR PAÍS, 2020-2029 (US$ MILHÕES)
TABELA 122 MERCADO DE CAULIM NA EUROPA, POR PAÍS, 2020-2029 (QUILO TONELADAS)
TABELA 123 MERCADO DE CAULIM NA EUROPA, POR GRAU, 2020-2029 (US$ MILHÕES)
TABELA 124 MERCADO DE CAULIM NA EUROPA, POR GRAU, 2020-2029 (QUILO TONELADAS)
TABELA 125 MERCADO DE CAULIM NA EUROPA, POR PROCESSO, 2020-2029 (US$ MILHÕES)
TABELA 126 MERCADO DE CAULIM NA EUROPA, POR PROCESSO, 2020-2029 (QUILO TONELADAS)
TABELA 127 MERCADO DE CAULIM NA EUROPA, POR APLICAÇÃO, 2020-2029 (MILHÕES DE DÓLARES)
TABELA 128 MERCADO DE CAULIM NA EUROPA, POR APLICAÇÃO, 2020-2029 (QUILO TONELADAS)
TABELA 129 MERCADO DE CAULIM DA ALEMANHA, POR GRAU, 2020-2029 (US$ MILHÕES)
TABELA 130 MERCADO DE CAULIM DA ALEMANHA, POR GRAU, 2020-2029 (QUILO TONELADAS)
TABELA 131 MERCADO DE CAULIM DA ALEMANHA, POR PROCESSO, 2020-2029 (US$ MILHÕES)
TABELA 132 MERCADO DE CAULIM DA ALEMANHA, POR PROCESSO, 2020-2029 (QUILO TONELADAS)
TABELA 133 MERCADO DE CAULIM DA ALEMANHA, POR APLICAÇÃO, 2020-2029 (US$ MILHÕES)
TABELA 134 MERCADO DE CAULIM NA ALEMANHA, POR APLICAÇÃO, 2020-2029 (QUILO TONELADAS)
TABELA 135 MERCADO DE CAULIM DO REINO UNIDO, POR GRAU, 2020-2029 (MILHÕES DE DÓLARES)
TABELA 136 MERCADO DE CAULIM DO REINO UNIDO, POR GRAU, 2020-2029 (QUILO TONELADAS)
TABELA 137 MERCADO DE CAULIM DO REINO UNIDO, POR PROCESSO, 2020-2029 (US$ MILHÕES)
TABELA 138 MERCADO DE CAULIM NO REINO UNIDO, POR PROCESSO, 2020-2029 (QUILO TONELADAS)
TABELA 139 MERCADO DE CAULIM DO REINO UNIDO, POR APLICAÇÃO, 2020-2029 (MILHÕES DE DÓLARES)
TABELA 140 MERCADO DE CAULIM NO REINO UNIDO, POR APLICAÇÃO, 2020-2029 (QUILO TONELADAS)
TABELA 141 MERCADO DE CAULIM NA FRANÇA, POR GRAU, 2020-2029 (US$ MILHÕES)
TABELA 142 MERCADO DE CAULIM NA FRANÇA, POR GRAU, 2020-2029 (QUILO TONELADAS)
TABELA 143 MERCADO DE CAULIM NA FRANÇA, POR PROCESSO, 2020-2029 (US$ MILHÕES)
TABELA 144 MERCADO DE CAULIM NA FRANÇA, POR PROCESSO, 2020-2029 (QUILO TONELADAS)
TABELA 145 MERCADO DE CAULIM NA FRANÇA, POR APLICAÇÃO, 2020-2029 (US$ MILHÕES)
TABELA 146 MERCADO DE CAULIM NA FRANÇA, POR APLICAÇÃO, 2020-2029 (QUILO TONELADAS)
TABELA 147 MERCADO DE CAULIM DA ITÁLIA, POR GRAU, 2020-2029 (US$ MILHÕES)
TABELA 148 MERCADO DE CAULIM NA ITÁLIA, POR GRAU, 2020-2029 (QUILO TONELADAS)
TABELA 149 MERCADO DE CAULIM DA ITÁLIA, POR PROCESSO, 2020-2029 (US$ MILHÕES)
TABELA 150 MERCADO DE CAULIM DA ITÁLIA, POR PROCESSO, 2020-2029 (QUILO TONELADAS)
TABELA 151 MERCADO DE CAULIM NA ITÁLIA, POR APLICAÇÃO, 2020-2029 (US$ MILHÕES)
TABELA 152 MERCADO DE CAULIM NA ITÁLIA, POR APLICAÇÃO, 2020-2029 (QUILO TONELADAS)
TABELA 153 MERCADO DE CAULIM NA ESPANHA, POR GRAU, 2020-2029 (US$ MILHÕES)
TABELA 154 MERCADO DE CAULIM NA ESPANHA, POR GRAU, 2020-2029 (QUILO TONELADAS)
TABELA 155 MERCADO DE CAULIM NA ESPANHA, POR PROCESSO, 2020-2029 (US$ MILHÕES)
TABELA 156 MERCADO DE CAULIM NA ESPANHA, POR PROCESSO, 2020-2029 (QUILO TONELADAS)
TABELA 157 MERCADO DE CAULIM NA ESPANHA, POR APLICAÇÃO, 2020-2029 (US$ MILHÕES)
TABELA 158 MERCADO DE CAULIM NA ESPANHA, POR APLICAÇÃO, 2020-2029 (QUILO TONELADAS)
TABELA 159 MERCADO DE CAULIM DA RÚSSIA, POR GRAU, 2020-2029 (US$ MILHÕES)
TABELA 160 MERCADO DE CAULIM DA RÚSSIA, POR GRAU, 2020-2029 (QUILO TONELADAS)
TABELA 161 MERCADO DE CAULIM DA RÚSSIA, POR PROCESSO, 2020-2029 (US$ MILHÕES)
TABELA 162 MERCADO DE CAULIM DA RÚSSIA, POR PROCESSO, 2020-2029 (QUILO TONELADAS)
TABELA 163 MERCADO DE CAULIM DA RÚSSIA, POR APLICAÇÃO, 2020-2029 (US$ MILHÕES)
TABELA 164 MERCADO DE CAULIM DA RÚSSIA, POR APLICAÇÃO, 2020-2029 (QUILO TONELADAS)
TABELA 165 MERCADO DE CAULIM NA SUÍÇA, POR GRAU, 2020-2029 (US$ MILHÕES)
TABELA 166 MERCADO DE CAULIM NA SUÍÇA, POR GRAU, 2020-2029 (QUILO TONELADAS)
TABELA 167 MERCADO DE CAULIM DA SUÍÇA, POR PROCESSO, 2020-2029 (US$ MILHÕES)
TABELA 168 MERCADO DE CAULIM NA SUÍÇA, POR PROCESSO, 2020-2029 (QUILO TONELADAS)
TABELA 169 MERCADO DE CAULIM DA SUÍÇA, POR APLICAÇÃO, 2020-2029 (US$ MILHÕES)
TABELA 170 MERCADO DE CAULIM DA SUÍÇA, POR APLICAÇÃO, 2020-2029 (QUILO TONELADAS)
TABELA 171 MERCADO DE CAULIM DA TURQUIA, POR GRAU, 2020-2029 (US$ MILHÕES)
TABELA 172 MERCADO DE CAULIM DA TURQUIA, POR GRAU, 2020-2029 (QUILO TONELADAS)
TABELA 173 MERCADO DE CAULIM DA TURQUIA, POR PROCESSO, 2020-2029 (US$ MILHÕES)
TABELA 174 MERCADO DE CAULIM DA TURQUIA, POR PROCESSO, 2020-2029 (QUILO TONELADAS)
TABELA 175 MERCADO DE CAULIM DA TURQUIA, POR APLICAÇÃO, 2020-2029 (US$ MILHÕES)
TABELA 176 MERCADO DE CAULIM DA TURQUIA, POR APLICAÇÃO, 2020-2029 (QUILO TONELADAS)
TABELA 177 MERCADO DE CAULIM DA BÉLGICA, POR GRAU, 2020-2029 (US$ MILHÕES)
TABELA 178 MERCADO DE CAULIM DA BÉLGICA, POR GRAU, 2020-2029 (QUILO TONELADAS)
TABELA 179 MERCADO DE CAULIM DA BÉLGICA, POR PROCESSO, 2020-2029 (US$ MILHÕES)
TABELA 180 MERCADO DE CAULIM DA BÉLGICA, POR PROCESSO, 2020-2029 (QUILO TONELADAS)
TABELA 181 MERCADO DE CAULIM DA BÉLGICA, POR APLICAÇÃO, 2020-2029 (US$ MILHÕES)
TABELA 182 MERCADO DE CAULIM DA BÉLGICA, POR APLICAÇÃO, 2020-2029 (QUILO TONELADAS)
TABELA 183 MERCADO DE CAULIM HOLANDÊS, POR GRAU, 2020-2029 (US$ MILHÕES)
TABELA 184 MERCADO DE CAULIM HOLANDÊS, POR GRAU, 2020-2029 (QUILO TONELADAS)
TABELA 185 MERCADO DE CAULIM HOLANDÊS, POR PROCESSO, 2020-2029 (US$ MILHÕES)
TABELA 186 MERCADO DE CAULIM HOLANDÊS, POR PROCESSO, 2020-2029 (QUILO TONELADAS)
TABELA 187 MERCADO HOLANDÊS DE CAULIM, POR APLICAÇÃO, 2020-2029 (US$ MILHÕES)
TABELA 188 MERCADO HOLANDÊS DE CAULIM, POR APLICAÇÃO, 2020-2029 (QUILO TONELADAS)
TABELA 189 MERCADO DE CAULIM NO RESTO DA EUROPA, POR GRAU, 2020-2029 (US$ MILHÕES)
TABELA 190 MERCADO DE CAULIM NO RESTO DA EUROPA, POR GRAU, 2020-2029 (QUILO TONELADAS)
TABELA 191 MERCADO DE CAULIM NA AMÉRICA DO NORTE, POR PAÍS, 2020-2029 (US$ MILHÕES)
TABELA 192 MERCADO DE CAULIM NA AMÉRICA DO NORTE, POR PAÍS, 2020-2029 (QUILO TONELADAS)
TABELA 193 MERCADO DE CAULIM NA AMÉRICA DO NORTE, POR GRAU, 2020-2029 (US$ MILHÕES)
TABELA 194 MERCADO DE CAULIM NA AMÉRICA DO NORTE, POR GRAU, 2020-2029 (QUILO TONELADAS)
TABELA 195 MERCADO DE CAULIM DA AMÉRICA DO NORTE, POR PROCESSO, 2020-2029 (US$ MILHÕES)
TABELA 196 MERCADO DE CAULIM DA AMÉRICA DO NORTE, POR PROCESSO, 2020-2029 (QUILO TONELADAS)
TABELA 197 MERCADO DE CAULIM NA AMÉRICA DO NORTE, POR APLICAÇÃO, 2020-2029 (US$ MILHÕES)
TABELA 198 MERCADO DE CAULIM NA AMÉRICA DO NORTE, POR APLICAÇÃO, 2020-2029 (QUILO TONELADAS)
TABELA 199 MERCADO DE CAULIM NOS EUA, POR GRAU, 2020-2029 (US$ MILHÕES)
TABELA 200 MERCADO DE CAULIM NOS EUA, POR GRAU, 2020-2029 (QUILO TONELADAS)
TABELA 201 MERCADO DE CAULIM NOS EUA, POR PROCESSO, 2020-2029 (US$ MILHÕES)
TABELA 202 MERCADO DE CAULIM NOS EUA, POR PROCESSO, 2020-2029 (QUILO TONELADAS)
TABELA 203 MERCADO DE CAULIM NOS EUA, POR APLICAÇÃO, 2020-2029 (US$ MILHÕES)
TABELA 204 MERCADO DE CAULIM NOS EUA, POR APLICAÇÃO, 2020-2029 (QUILO TONELADAS)
TABELA 205 MERCADO DE CAULIM DO CANADÁ, POR GRAU, 2020-2029 (US$ MILHÕES)
TABELA 206 MERCADO DE CAULIM DO CANADÁ, POR GRAU, 2020-2029 (QUILO TONELADAS)
TABELA 207 MERCADO DE CAULIM DO CANADÁ, POR PROCESSO, 2020-2029 (US$ MILHÕES)
TABELA 208 MERCADO DE CAULIM DO CANADÁ, POR PROCESSO, 2020-2029 (QUILO TONELADAS)
TABELA 209 MERCADO DE CAULIM DO CANADÁ, POR APLICAÇÃO, 2020-2029 (US$ MILHÕES)
TABELA 210 MERCADO DE CAULIM DO CANADÁ, POR APLICAÇÃO, 2020-2029 (QUILO TONELADAS)
TABELA 211 MERCADO DE CAULIM NO MÉXICO, POR GRAU, 2020-2029 (US$ MILHÕES)
TABELA 212 MERCADO DE CAULIM NO MÉXICO, POR GRAU, 2020-2029 (QUILO TONELADAS)
TABELA 213 MERCADO DE CAULIM NO MÉXICO, POR PROCESSO, 2020-2029 (US$ MILHÕES)
TABELA 214 MERCADO DE CAULIM NO MÉXICO, POR PROCESSO, 2020-2029 (QUILO TONELADAS)
TABELA 215 MERCADO DE CAULIM DO MÉXICO, POR APLICAÇÃO, 2020-2029 (US$ MILHÕES)
TABELA 216 MERCADO DE CAULIM NO MÉXICO, POR APLICAÇÃO, 2020-2029 (QUILO TONELADAS)
TABELA 217 MERCADO DE CAULIM NO ORIENTE MÉDIO E ÁFRICA, POR PAÍS, 2020-2029 (US$ MILHÕES)
TABELA 218 MERCADO DE CAULIM NO ORIENTE MÉDIO E ÁFRICA, POR PAÍS, 2020-2029 (QUILO TONELADAS)
TABELA 219 MERCADO DE CAULIM NO ORIENTE MÉDIO E ÁFRICA, POR GRAU, 2020-2029 (US$ MILHÕES)
TABELA 220 MERCADO DE CAULIM NO ORIENTE MÉDIO E ÁFRICA, POR GRAU, 2020-2029 (QUILO TONELADAS)
TABELA 221 MERCADO DE CAULIM NO ORIENTE MÉDIO E ÁFRICA, POR PROCESSO, 2020-2029 (US$ MILHÕES)
TABELA 222 MERCADO DE CAULIM NO ORIENTE MÉDIO E ÁFRICA, POR PROCESSO, 2020-2029 (QUILO TONELADAS)
TABELA 223 MERCADO DE CAULIM NO ORIENTE MÉDIO E ÁFRICA, POR APLICAÇÃO, 2020-2029 (US$ MILHÕES)
TABELA 224 MERCADO DE CAULIM NO ORIENTE MÉDIO E ÁFRICA, POR APLICAÇÃO, 2020-2029 (QUILO TONELADAS)
TABELA 225 MERCADO DE CAULIM DA ARÁBIA SAUDITA, POR GRAU, 2020-2029 (US$ MILHÕES)
TABELA 226 MERCADO DE CAULIM DA ARÁBIA SAUDITA, POR GRAU, 2020-2029 (QUILO TONELADAS)
TABELA 227 MERCADO DE CAULIM DA ARÁBIA SAUDITA, POR PROCESSO, 2020-2029 (US$ MILHÕES)
TABELA 228 MERCADO DE CAULIM DA ARÁBIA SAUDITA, POR PROCESSO, 2020-2029 (QUILO TONELADAS)
TABELA 229 MERCADO DE CAULIM DA ARÁBIA SAUDITA, POR APLICAÇÃO, 2020-2029 (US$ MILHÕES)
TABELA 230 MERCADO DE CAULIM DA ARÁBIA SAUDITA, POR APLICAÇÃO, 2020-2029 (QUILO TONELADAS)
TABELA 231 MERCADO DE CAULIM NOS EAU, POR GRAU, 2020-2029 (US$ MILHÕES)
TABELA 232 MERCADO DE CAULIM NOS EAU, POR GRAU, 2020-2029 (QUILO TONELADAS)
TABELA 233 MERCADO DE CAULIM NOS EAU, POR PROCESSO, 2020-2029 (US$ MILHÕES)
TABELA 234 MERCADO DE CAULIM NOS EAU, POR PROCESSO, 2020-2029 (QUILO TONELADAS)
TABELA 235 MERCADO DE CAULIM NOS EAU, POR APLICAÇÃO, 2020-2029 (US$ MILHÕES)
TABELA 236 MERCADO DE CAULIM NOS EAU, POR APLICAÇÃO, 2020-2029 (US$ MILHÕES)
TABELA 237 MERCADO DE CAULIM DA ÁFRICA DO SUL, POR GRAU, 2020-2029 (US$ MILHÕES)
TABELA 238 MERCADO DE CAULIM DA ÁFRICA DO SUL, POR GRAU, 2020-2029 (QUILO TONELADAS)
TABELA 239 MERCADO DE CAULIM DA ÁFRICA DO SUL, POR PROCESSO, 2020-2029 (US$ MILHÕES)
TABELA 240 MERCADO DE CAULIM DA ÁFRICA DO SUL, POR PROCESSO, 2020-2029 (QUILO TONELADAS)
TABELA 241 MERCADO DE CAULIM DA ÁFRICA DO SUL, POR APLICAÇÃO, 2020-2029 (US$ MILHÕES)
TABELA 242 MERCADO DE CAULIM DA ÁFRICA DO SUL, POR APLICAÇÃO, 2020-2029 (QUILO TONELADAS)
TABELA 243 MERCADO DE CAULIM DO EGITO, POR GRAU, 2020-2029 (US$ MILHÕES)
TABELA 244 MERCADO DE CAULIM DO EGITO, POR GRAU, 2020-2029 (QUILO TONELADAS)
TABELA 245 MERCADO DE CAULIM DO EGITO, POR PROCESSO, 2020-2029 (US$ MILHÕES)
TABELA 246 MERCADO DE CAULIM DO EGITO, POR PROCESSO, 2020-2029 (QUILO TONELADAS)
TABELA 247 MERCADO DE CAULIM DO EGITO, POR APLICAÇÃO, 2020-2029 (US$ MILHÕES)
TABLE 248 EGYPT KAOLIN MARKET, BY APPLICATION, 2020-2029 (KILO TONS)
TABLE 249 ISRAEL KAOLIN MARKET, BY GRADE, 2020-2029 (USD MILLION)
TABLE 250 ISRAEL KAOLIN MARKET, BY GRADE, 2020-2029 (KILO TONS)
TABLE 251 ISRAEL KAOLIN MARKET, BY PROCESS, 2020-2029 (USD MILLION)
TABLE 252 ISRAEL KAOLIN MARKET, BY PROCESS, 2020-2029 (KILO TONS)
TABLE 253 ISRAEL KAOLIN MARKET, BY APPLICATION, 2020-2029 (USD MILLION)
TABLE 254 ISRAEL KAOLIN MARKET, BY APPLICATION, 2020-2029 (KILO TONS)
TABLE 255 REST OF MIDDLE EAST AND AFRICA KAOLIN MARKET, BY GRADE, 2020-2029 (USD MILLION)
TABLE 256 REST OF MIDDLE EAST AND AFRICA KAOLIN MARKET, BY GRADE, 2020-2029 (KILO TONS)
TABLE 257 SOUTH AMERICA KAOLIN MARKET, BY COUNTRY, 2020-2029 (USD MILLION)
TABLE 258 SOUTH AMERICA KAOLIN MARKET, BY COUNTRY, 2020-2029 (KILO TONS)
TABLE 259 SOUTH AMERICA KAOLIN MARKET, BY GRADE, 2020-2029 (USD MILLION)
TABLE 260 SOUTH AMERICA KAOLIN MARKET, BY GRADE, 2020-2029 (KILO TONS)
TABLE 261 SOUTH AMERICA KAOLIN MARKET, BY PROCESS, 2020-2029 (USD MILLION)
TABLE 262 SOUTH AMERICA KAOLIN MARKET, BY PROCESS, 2020-2029 (KILO TONS)
TABLE 263 SOUTH AMERICA KAOLIN MARKET, BY APPLICATION, 2020-2029 (USD MILLION)
TABLE 264 SOUTH AMERICA KAOLIN MARKET, BY APPLICATION, 2020-2029 (KILO TONS)
TABLE 265 BRAZIL KAOLIN MARKET, BY GRADE, 2020-2029 (USD MILLION)
TABLE 266 BRAZIL KAOLIN MARKET, BY GRADE, 2020-2029 (KILO TONS)
TABLE 267 BRAZIL KAOLIN MARKET, BY PROCESS, 2020-2029 (USD MILLION)
TABLE 268 BRAZIL KAOLIN MARKET, BY PROCESS, 2020-2029 (KILO TONS)
TABLE 269 BRAZIL KAOLIN MARKET, BY APPLICATION, 2020-2029 (USD MILLION)
TABLE 270 BRAZIL KAOLIN MARKET, BY APPLICATION, 2020-2029 (KILO TONS)
TABLE 271 ARGENTINA KAOLIN MARKET, BY GRADE, 2020-2029 (USD MILLION)
TABLE 272 ARGENTINA KAOLIN MARKET, BY GRADE, 2020-2029 (KILO TONS)
TABLE 273 ARGENTINA KAOLIN MARKET, BY PROCESS, 2020-2029 (USD MILLION)
TABLE 274 ARGENTINA KAOLIN MARKET, BY PROCESS, 2020-2029 (KILO TONS)
TABLE 275 ARGENTINA KAOLIN MARKET, BY APPLICATION, 2020-2029 (USD MILLION)
TABLE 276 ARGENTINA KAOLIN MARKET, BY APPLICATION, 2020-2029 (KILO TONS)
TABLE 277 REST OF SOUTH AMERICA KAOLIN MARKET, BY GRADE, 2020-2029 (USD MILLION)
TABLE 278 REST OF SOUTH AMERICA KAOLIN MARKET, BY GRADE, 2020-2029 (KILO TONS)
Lista de Figura
FIGURE 1 GLOBAL KAOLIN MARKET
FIGURE 2 GLOBAL KAOLIN MARKET: DATA TRIANGULATION
FIGURE 3 GLOBAL KAOLIN MARKET: DROC ANALYSIS
FIGURE 4 GLOBAL KAOLIN MARKET: GLOBAL VS REGIONAL MARKET ANALYSIS
FIGURE 5 GLOBAL KAOLIN MARKET: COMPANY RESEARCH ANALYSIS
FIGURE 6 GLOBAL KAOLIN MARKET: THE PRODUCT LIFE LINE CURVE
FIGURE 7 GLOBAL KAOLIN MARKET: MULTIVARIATE MODELLING
FIGURE 8 GLOBAL KAOLIN MARKET: INTERVIEW DEMOGRAPHICS
FIGURE 9 GLOBAL KAOLIN MARKET: DBMR MARKET POSITION GRID
FIGURE 10 GLOBAL KAOLIN MARKET: MARKET APPLICATION COVERAGE GRID
FIGURE 11 GLOBAL KAOLIN MARKET: THE MARKET CHALLENGE MATRIX
FIGURE 12 GLOBAL KAOLIN MARKET: VENDOR SHARE ANALYSIS
FIGURE 13 GLOBAL KAOLIN MARKET: SEGMENTATION
FIGURA 14 ESPERA-SE QUE A ÁSIA-PACÍFICO DOMINE O MERCADO GLOBAL DE CAULIM, ENQUANTO A AMÉRICA DO NORTE DEVE CRESCER COM O MAIOR CAGR NO PERÍODO PREVISTO
FIGURA 15 O AUMENTO NAS ATIVIDADES DE CONSTRUÇÃO EM TODO O MUNDO DEVE IMPULSIONAR O MERCADO GLOBAL DE CAULIM NO PERÍODO PREVISTO
FIGURA 16 O SEGMENTO CALCINADO DEVE SER REPRESENTANTE DA MAIOR PARCIALIDADE DO MERCADO GLOBAL DE CAULIM EM 2022 E 2029
FIGURA 17 A ÁSIA-PACÍFICO É O MERCADO COM CRESCIMENTO MAIS RÁPIDO PARA OS FABRICANTES DE CAULIM NO PERÍODO PREVISTO
FIGURA 18 CENÁRIO DE IMPORTAÇÃO E EXPORTAÇÃO (MIL USD)
FIGURA 19 ESTATÍSTICAS DE PREÇOS ATUAIS (POR KG)
FIGURA 20 PREVISÕES DE PREÇOS (POR KG)
FIGURA 21 ANÁLISE DE PRODUÇÃO E CONSUMO
FIGURA 22 MOTIVADORES, RESTRIÇÕES, OPORTUNIDADES E DESAFIOS DO MERCADO GLOBAL DE CAULIM
FIGURA 23 MERCADO GLOBAL DE CAULIM: POR GRAU, 2021
FIGURA 24 MERCADO GLOBAL DE CAULIM: POR PROCESSO, 2021
FIGURA 25 MERCADO GLOBAL DE CAULIM: POR APLICAÇÃO, 2021
FIGURA 26 MERCADO GLOBAL DE CAULIM: INSTANTÂNEO (2021)
FIGURA 27 MERCADO GLOBAL DE CAULIM: POR REGIÃO (2021)
FIGURA 28 MERCADO GLOBAL DE CAULIM: POR REGIÃO (2022 E 2029)
FIGURA 29 MERCADO GLOBAL DE CAULIM: POR REGIÃO (2021 E 2029)
FIGURA 30 MERCADO GLOBAL DE CAULIM: POR GRAU (2022-2029)
FIGURA 31 MERCADO DE CAULIM DA ÁSIA-PACÍFICO: INSTANTÂNEO (2021)
FIGURA 32 MERCADO DE CAULIM DA ÁSIA-PACÍFICO: POR PAÍS (2021)
FIGURA 33 MERCADO DE CAULIM DA ÁSIA-PACÍFICO: POR PAÍS (2022 E 2029)
FIGURA 34 MERCADO DE CAULIM DA ÁSIA-PACÍFICO: POR PAÍS (2021 E 2029)
FIGURA 35 MERCADO DE CAULIM DA ÁSIA-PACÍFICO: POR GRAU (2022-2029)
FIGURA 36 MERCADO DE CAULIM NA EUROPA: INSTANTÂNEO (2021)
FIGURA 37 MERCADO DE CAULIM NA EUROPA: POR PAÍS (2021)
FIGURA 38 MERCADO DE CAULIM NA EUROPA: POR PAÍS (2022 E 2029)
FIGURA 39 MERCADO DE CAULIM NA EUROPA: POR PAÍS (2021 E 2029)
FIGURA 40 MERCADO DE CAULIM NA EUROPA: POR GRAU (2022-2029)
FIGURA 41 MERCADO DE CAULIM DA AMÉRICA DO NORTE: INSTANTÂNEO (2021)
FIGURA 42 MERCADO DE CAULIM NA AMÉRICA DO NORTE: POR PAÍS (2021)
FIGURA 43 MERCADO DE CAULIM DA AMÉRICA DO NORTE: POR PAÍS (2022 E 2029)
FIGURA 44 MERCADO DE CAULIM DA AMÉRICA DO NORTE: POR PAÍS (2021 E 2029)
FIGURA 45 MERCADO DE CAULIM DA AMÉRICA DO NORTE: POR GRAU (2022-2029)
FIGURA 46 MERCADO DE CAULIM NO ORIENTE MÉDIO E ÁFRICA: INSTANTÂNEO (2021)
FIGURA 47 MERCADO DE CAULIM NO ORIENTE MÉDIO E ÁFRICA: POR PAÍS (2021)
FIGURA 48 MERCADO DE CAULIM NO ORIENTE MÉDIO E ÁFRICA: POR PAÍS (2022 E 2029)
FIGURA 49 MERCADO DE CAULIM NO ORIENTE MÉDIO E ÁFRICA: POR PAÍS (2021 E 2029)
FIGURA 50 MERCADO DE CAULIM NO ORIENTE MÉDIO E ÁFRICA: POR GRAU (2022 E 2029)
FIGURA 51 MERCADO DE CAULIM DA AMÉRICA DO SUL: INSTANTÂNEO (2021)
FIGURA 52 MERCADO DE CAULIM DA AMÉRICA DO SUL: POR PAÍS (2021)
FIGURA 53 MERCADO DE CAULIM DA AMÉRICA DO SUL: POR PAÍS (2022 E 2029)
FIGURA 54 MERCADO DE CAULIM DA AMÉRICA DO SUL: POR PAÍS (2021 E 2029)
FIGURA 55 MERCADO DE CAULIM DA AMÉRICA DO SUL: POR GRAU (2022-2029)
FIGURA 56 MERCADO GLOBAL DE CAULIM: PARTICIPAÇÃO DA EMPRESA EM 2021 (%)
FIGURA 57 MERCADO DE CAULIM DA AMÉRICA DO NORTE: PARTICIPAÇÃO DA EMPRESA EM 2021 (%)
FIGURA 58 MERCADO DE CAULIM NA EUROPA: PARTICIPAÇÃO DA EMPRESA EM 2021 (%)
FIGURA 59 MERCADO DE CAULIM DA ÁSIA-PACÍFICO: PARTICIPAÇÃO DA EMPRESA EM 2021 (%)
Metodologia de Investigação
A recolha de dados e a análise do ano base são feitas através de módulos de recolha de dados com amostras grandes. A etapa inclui a obtenção de informações de mercado ou dados relacionados através de diversas fontes e estratégias. Inclui examinar e planear antecipadamente todos os dados adquiridos no passado. Da mesma forma, envolve o exame de inconsistências de informação observadas em diferentes fontes de informação. Os dados de mercado são analisados e estimados utilizando modelos estatísticos e coerentes de mercado. Além disso, a análise da quota de mercado e a análise das principais tendências são os principais fatores de sucesso no relatório de mercado. Para saber mais, solicite uma chamada de analista ou abra a sua consulta.
A principal metodologia de investigação utilizada pela equipa de investigação do DBMR é a triangulação de dados que envolve a mineração de dados, a análise do impacto das variáveis de dados no mercado e a validação primária (especialista do setor). Os modelos de dados incluem grelha de posicionamento de fornecedores, análise da linha de tempo do mercado, visão geral e guia de mercado, grelha de posicionamento da empresa, análise de patentes, análise de preços, análise da quota de mercado da empresa, normas de medição, análise global versus regional e de participação dos fornecedores. Para saber mais sobre a metodologia de investigação, faça uma consulta para falar com os nossos especialistas do setor.
Personalização disponível
A Data Bridge Market Research é líder em investigação formativa avançada. Orgulhamo-nos de servir os nossos clientes novos e existentes com dados e análises que correspondem e atendem aos seus objetivos. O relatório pode ser personalizado para incluir análise de tendências de preços de marcas-alvo, compreensão do mercado para países adicionais (solicite a lista de países), dados de resultados de ensaios clínicos, revisão de literatura, mercado remodelado e análise de base de produtos . A análise de mercado dos concorrentes-alvo pode ser analisada desde análises baseadas em tecnologia até estratégias de carteira de mercado. Podemos adicionar quantos concorrentes necessitar de dados no formato e estilo de dados que procura. A nossa equipa de analistas também pode fornecer dados em tabelas dinâmicas de ficheiros Excel em bruto (livro de factos) ou pode ajudá-lo a criar apresentações a partir dos conjuntos de dados disponíveis no relatório.

