Global Nuts Market
Tamanho do mercado em biliões de dólares
CAGR :
% 
 USD
23.42 Billion
USD
35.67 Billion
2024
2032
USD
23.42 Billion
USD
35.67 Billion
2024
2032
| 2025 –2032 | |
| USD 23.42 Billion | |
| USD 35.67 Billion | |
| % | |
|
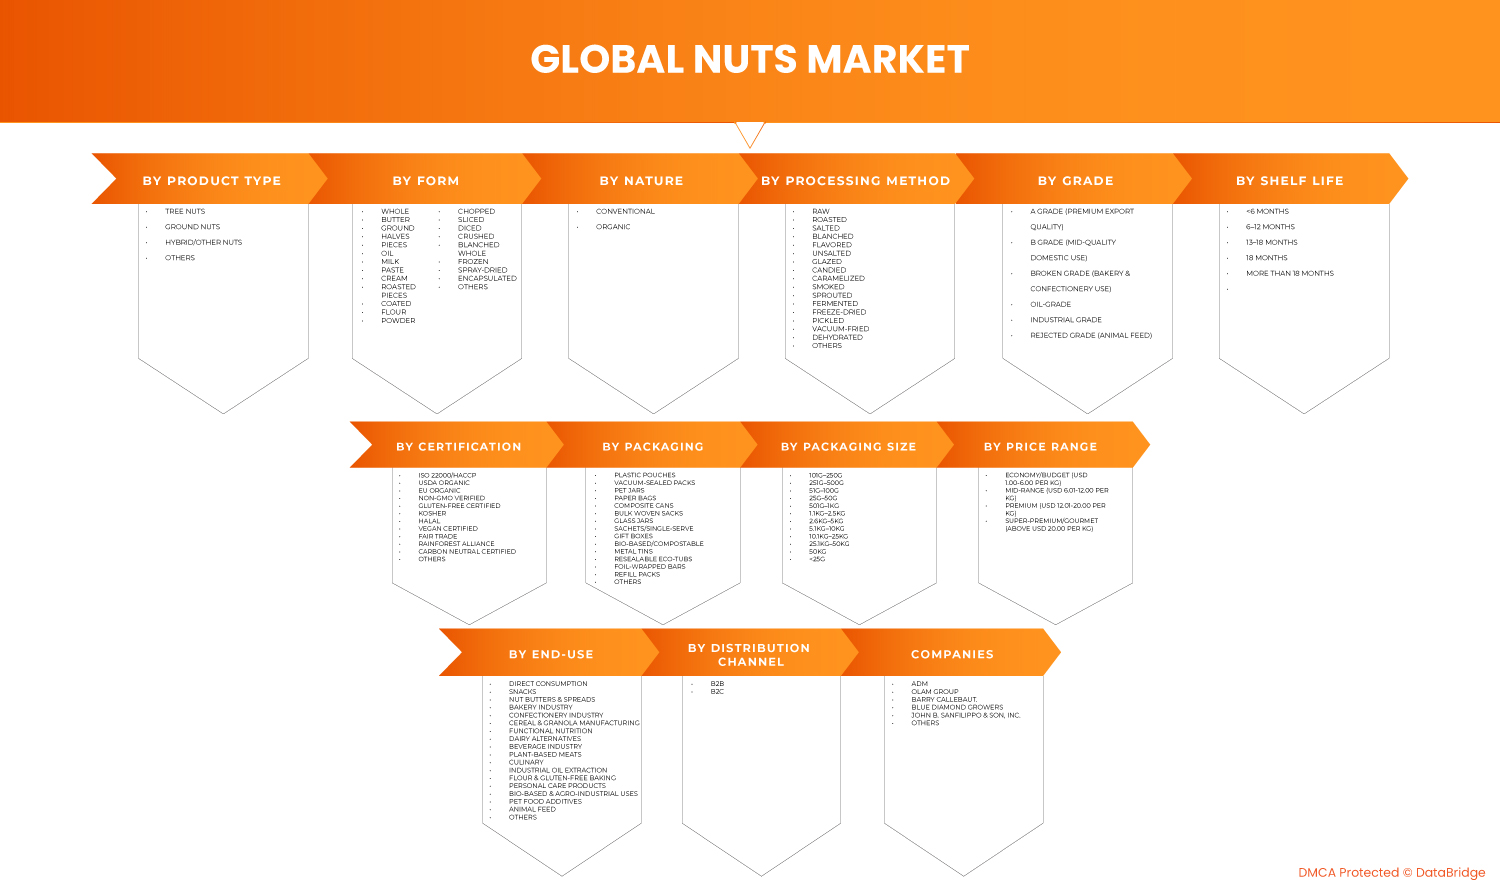
Segmentação do mercado global de nozes, por tipo de produto (nozes de árvore, nozes moídas, nozes híbridas/outras e outras), forma (inteira, manteiga, moída, metades, pedaços, óleo, leite, pasta, creme, pedaços torrados, revestidos, farinha, pó, picados, fatiados, em cubos, triturados, escaldados inteiros, congelados, secos por pulverização, encapsulados e outros), natureza (convencional e orgânica), método de processamento (cru, torrado, salgado, escaldado, aromatizado, sem sal, glaceado, cristalizado, caramelizado, defumado, germinado, fermentado, liofilizado, em conserva, frito a vácuo, desidratado e outros), grau (grau A (qualidade premium para exportação), grau B (uso doméstico de qualidade média), grau quebrado (uso em padaria e confeitaria), grau para óleo, grau industrial, grau rejeitado (ração animal)), prazo de validade (
Tamanho do mercado de nozes
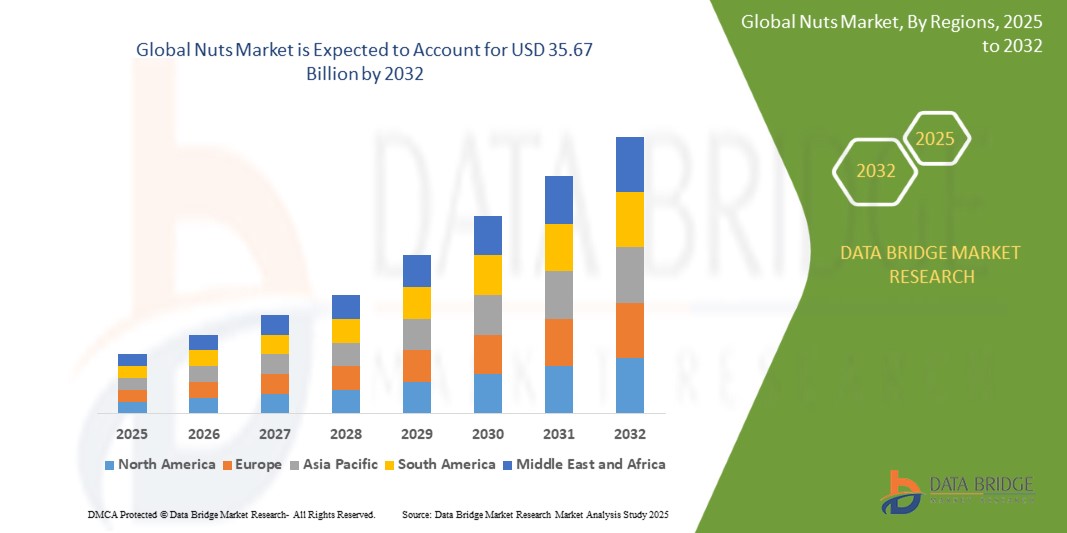
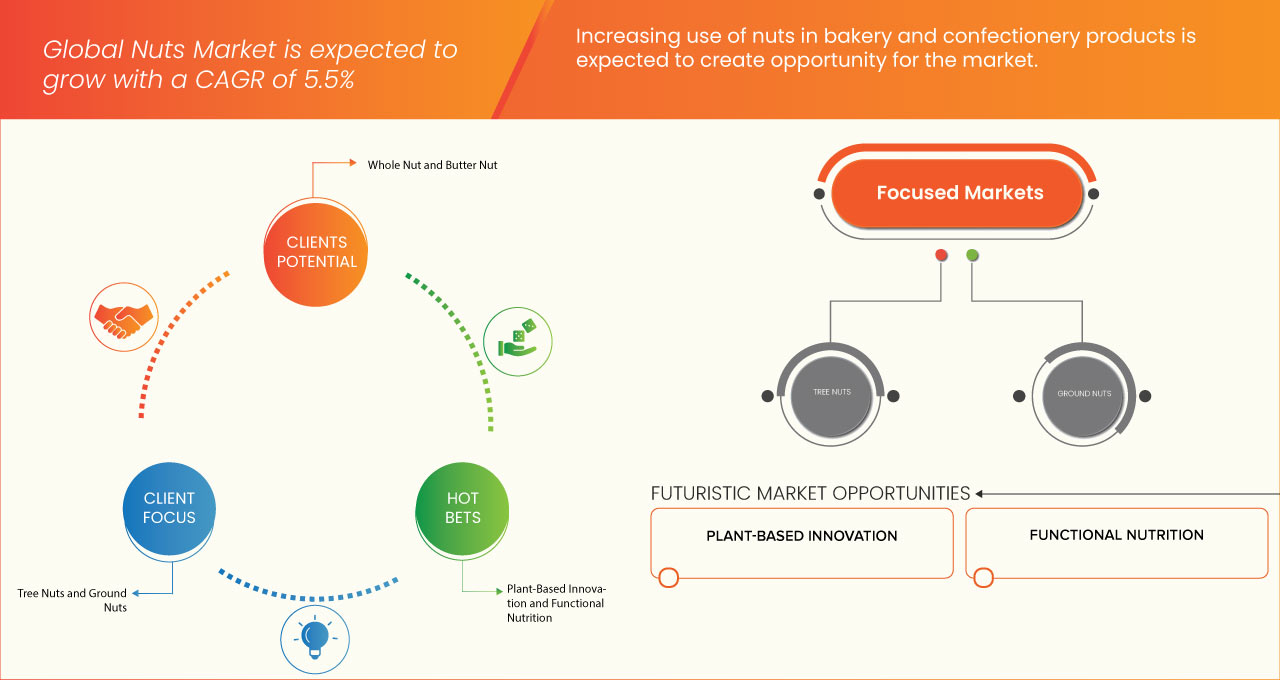
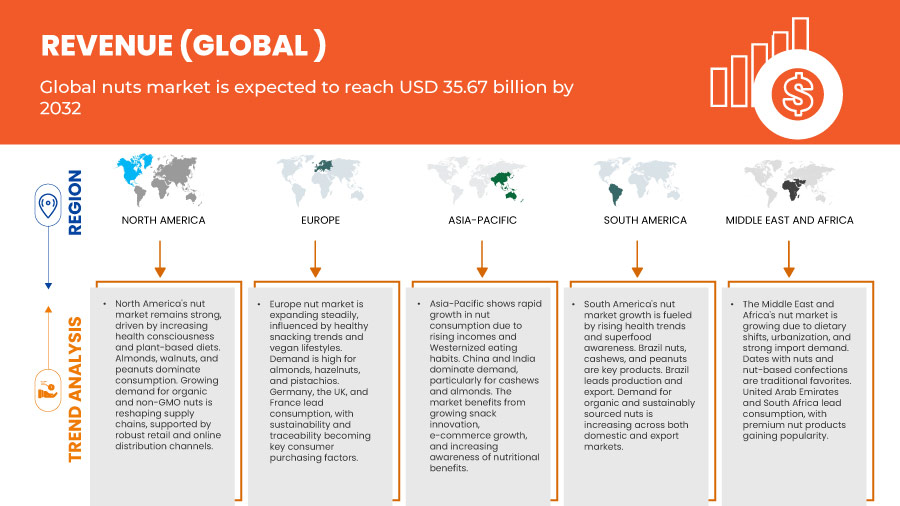
- O tamanho do mercado global de nozes foi avaliado em US$ 23,42 bilhões em 2024 e deve atingir US$ 35,67 bilhões até 2032 , com um CAGR de 5,5% durante o período previsto.
- O mercado de nozes é impulsionado principalmente pela crescente conscientização sobre seus benefícios à saúde, já que são ricas em fibras, proteínas, minerais, vitaminas e diversos outros antioxidantes. São uma boa fonte de gorduras saturadas e ajudam a manter o coração e o cérebro saudáveis. Os consumidores geralmente estão cientes das preferências por lanches veganos em todo o mundo.
Análise de Mercado de Nozes
- Uma noz é uma fruta composta por uma casca dura não comestível e uma semente comestível. Elas são uma boa fonte de gorduras boas, fibras e outros nutrientes benéficos. Cada tipo de noz oferece diferentes benefícios. As nozes estão entre as melhores fontes de proteínas vegetais. Uma dieta rica em nozes ajuda a prevenir fatores de risco, como inflamações ou algumas doenças crônicas.
- De muitas maneiras, comer nozes regularmente melhora a saúde, como reduzir o risco de diabetes e doenças cardíacas, além de diminuir os níveis de colesterol e triglicerídeos. Apesar do alto teor calórico, este tratamento nutritivo e rico em fibras também pode ajudar na perda de peso.
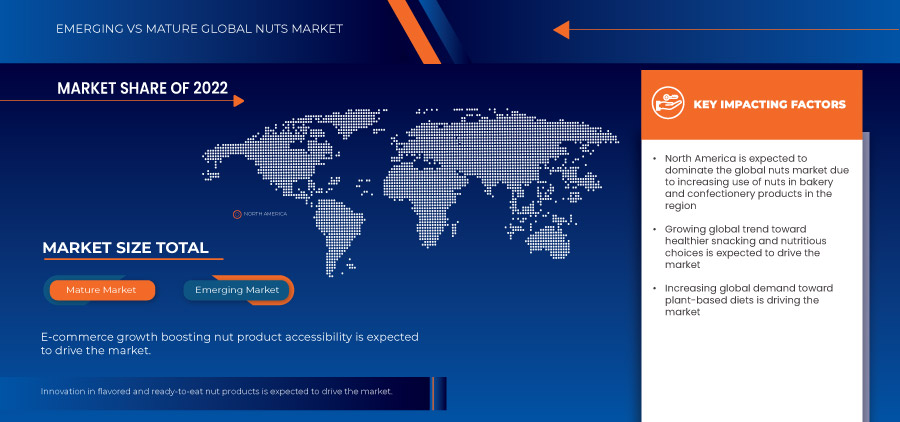
- Espera-se que a América do Norte domine o mercado global de nozes, com a maior participação de receita de 27,41% em 2025. O mercado nessa região é impulsionado pela crescente conscientização sobre saúde, maiores rendas disponíveis e um forte foco em nutrição à base de plantas.
- A região da Ásia-Pacífico deverá crescer à taxa composta de crescimento anual (CAGR) mais rápida, de 5,9%, entre 2025 e 2032, impulsionada pela rápida urbanização, pelo aumento da população de classe média e pela mudança nos padrões alimentares. O crescente consumo de nozes como petiscos e ingredientes em receitas tradicionais e modernas está expandindo o mercado em toda a região.
- A projeção é que o segmento de nozes domine o mercado com uma participação de receita de 52,23% em 2024, impulsionado pela ampla popularidade e disponibilidade de amêndoas, castanhas de caju, nozes, pistaches e outras variedades.
Escopo do Relatório e Segmentação do Mercado de Nozes
|
Atributos |
Principais insights do mercado de nozes |
|
Segmentos abrangidos |
|
|
Países abrangidos |
América do Norte
Europa
Ásia-Pacífico
Oriente Médio e África
Ámérica do Sul
|
|
Principais participantes do mercado |
|
|
Oportunidades de mercado |
|
|
Conjuntos de informações de dados de valor agregado |
Além dos insights sobre cenários de mercado, como valor de mercado, taxa de crescimento, segmentação, cobertura geográfica e principais participantes, os relatórios de mercado selecionados pela Data Bridge Market Research também incluem análises aprofundadas de especialistas, análises de preços, análises de participação de marca, pesquisas com consumidores, análises demográficas, análises da cadeia de suprimentos, análises da cadeia de valor, visão geral de matérias-primas/consumíveis, critérios de seleção de fornecedores, análise PESTLE, análise de Porter e estrutura regulatória. |
Tendências do mercado de nozes
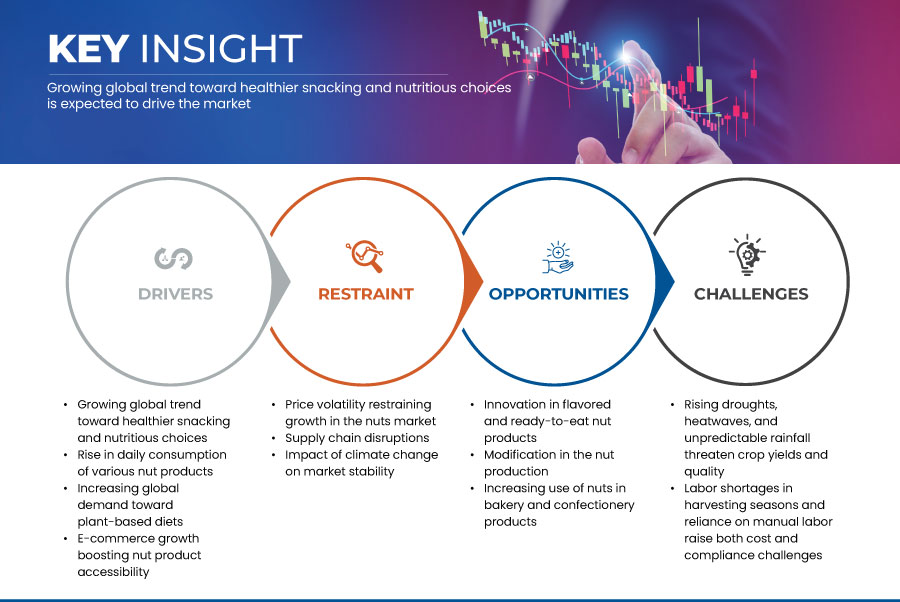
“ Tendência global crescente em direção a lanches mais saudáveis e escolhas nutritivas ”
- O mercado de nozes está crescendo rapidamente, impulsionado pela crescente tendência de lanches saudáveis. Os consumidores buscam lanches nutritivos e práticos, e as nozes atendem perfeitamente a essa demanda devido à sua riqueza em proteínas, fibras e gorduras saudáveis. Com o aumento da conscientização sobre bem-estar, as nozes estão se tornando a escolha preferida para lanches sem culpa, impulsionando o crescimento do mercado e incentivando a inovação na oferta de produtos.
- Um dos principais impulsionadores da popularidade das nozes como lanches é a crescente conscientização sobre saúde entre os consumidores. Valorizadas por seu conteúdo nutricional, as nozes são vistas como uma alternativa saudável aos lanches tradicionais. São ricas em vitaminas, minerais, fibras e proteínas essenciais, além de conterem gorduras monoinsaturadas e poli-insaturadas, benéficas para o coração. Sua portabilidade e praticidade naturais as tornam ideais para estilos de vida agitados, oferecendo um lanche rápido e nutritivo ao longo do dia.
- Por exemplo, em junho de 2024, de acordo com a Business Standard Private Ltd., a Nutraj anunciou o lançamento de seu novo produto, o “NutrajSnackrite Daily Nutrition Pack”. Este pacote cuidadosamente projetado contém sachês práticos recheados com uma deliciosa e nutritiva mistura para trilhas, combinando uma variedade de nozes premium e frutas secas. Destinado a consumidores preocupados com a saúde, ele oferece uma opção perfeita de lanche para viagem que fornece nutrientes essenciais e energia ao longo do dia, atendendo à crescente demanda por opções de lanches saudáveis e saborosos.
Dinâmica do Mercado de Nozes
Motorista
“Aumento no consumo diário de vários produtos de nozes”
- O mercado global de nozes está passando por um crescimento significativo, impulsionado principalmente pelo aumento do consumo mundial de nozes. Um dos principais fatores que impulsionam esse crescimento é a crescente conscientização dos consumidores sobre os benefícios das nozes para a saúde.
- Além disso, a mudança para estilos de vida baseados em vegetais e uma alimentação saudável tornou as nozes uma escolha popular como um lanche natural e saudável. A praticidade também desempenha um papel crucial, já que as nozes são fáceis de transportar e consumir em qualquer lugar, adaptando-se perfeitamente ao estilo de vida moderno e agitado. Além disso, a inovação em produtos, incluindo novos sabores, embalagens e opções prontas para consumo, ampliou o apelo, incentivando mais consumidores a incorporar nozes em suas dietas diárias e impulsionando a expansão do mercado global.
- Por exemplo, em setembro de 2024, de acordo com a Forbes Media LLC, a Daily Crunch levantou US$ 4 milhões em financiamento Série A para apoiar sua expansão no crescente mercado de lanches à base de nozes. O investimento está focado em aprimorar sua linha de lanches de nozes germinadas, como amêndoas, nozes e castanhas de caju, aumentando a produção e a disponibilidade no varejo para atender à crescente demanda global por produtos nutritivos de nozes para viagem.
Restrição/Desafio
“ Volatilidade dos preços restringe o crescimento do mercado de nozes ”
- A volatilidade dos preços é um fator importante que restringe o crescimento do mercado global de nozes. A flutuação dos preços, impulsionada por eventos climáticos imprevisíveis, como secas, inundações e geadas, interrompe as cadeias de suprimentos e cria incerteza tanto para produtores quanto para compradores. Por exemplo, condições adversas em regiões-chave de cultivo, como a Califórnia, levaram à redução da produtividade e a fortes aumentos de preços, dificultando a manutenção da estabilidade dos custos dos produtos pelos fabricantes.
- Além disso, as tensões comerciais e as tarifas variáveis agravam ainda mais a instabilidade de preços, limitando a expansão do mercado. Essa imprevisibilidade desestimula o investimento e desafia o planejamento de longo prazo do setor. Como resultado, os consumidores podem enfrentar preços mais altos ou disponibilidade reduzida, o que pode reduzir a demanda. Lidar com a volatilidade dos preços é crucial para garantir o crescimento estável e a sustentabilidade do mercado global de nozes.
- Por exemplo, em junho de 2024, de acordo com o SGGP, a Associação Vietnamita do Caju (VINACAS) criou uma força-tarefa dedicada a combater as flutuações de preços da castanha de caju in natura. Este grupo colabora com o governo e os ministérios para estabilizar os preços, com o objetivo de reduzir as interrupções na cadeia de suprimentos e apoiar o crescimento sustentável da indústria de caju do Vietnã.
Escopo do mercado de nozes
O mercado global de nozes é segmentado em doze segmentos notáveis com base no tipo de produto, forma, natureza, método de processamento, qualidade, prazo de validade, certificação, embalagem, tamanho da embalagem, faixa de preço, uso final e canal de distribuição.
- Por tipo de produto
Com base no tipo de produto, o mercado de nozes é segmentado em nozes de árvore, amendoim, nozes híbridas/outras e outras. A projeção é de que o segmento de nozes de árvore domine o mercado, com uma participação de mercado de 52,39% em 2025, impulsionado pela ampla popularidade e disponibilidade de amêndoas, castanhas de caju, nozes, pistaches e outras variedades. Seu papel consolidado nas dietas globais, juntamente com seu alto valor nutricional e uso crescente em lanches saudáveis, faz das nozes de árvore a categoria preferida. Além disso, o comércio global de amêndoas e castanhas de caju, especialmente dos EUA, Índia e Vietnã, impulsiona o crescimento desse segmento.
- Por Formulário
Com base na forma, o mercado é segmentado em: inteiros, manteiga, moídos, metades, pedaços, óleo, leite, pasta, creme, pedaços torrados, revestidos, farinha, pó, picados, fatiados, em cubos, triturados, inteiros escaldados, congelados, secos por pulverização, encapsulados e outros. Em 2025, espera-se que o segmento inteiro lidere o segmento de formas, com uma participação de mercado de 11,95%, impulsionado pela crescente conscientização sobre a saúde e pela preferência do consumidor por alimentos não processados e com rótulos limpos. As castanhas inteiras oferecem conveniência, apelo visual e frescor perceptível, tornando-as uma escolha preferencial tanto para consumo direto quanto para aplicações culinárias.
- Por natureza
Com base na natureza, o mercado de nozes é segmentado em convencionais e orgânicos. Espera-se que o segmento convencional domine a fatia de mercado de 61,72% em 2025 devido à sua acessibilidade, facilidade de aquisição e forte presença nos principais canais de varejo. Em regiões em desenvolvimento e sensíveis a preços, as nozes convencionais continuam a deter uma fatia significativa devido à sua familiaridade, qualidade consistente e maior disponibilidade em comparação com alternativas orgânicas premium.
- Por método de processamento
O mercado é segmentado por método de processamento em cru, torrado, salgado, escaldado, aromatizado, sem sal, glaceado, cristalizado, caramelizado, defumado, germinado, fermentado, liofilizado, em conserva, frito a vácuo, desidratado e outros. Prevê-se que o segmento cru domine o mercado, com uma participação de mercado de 12,67% em 2025, à medida que as tendências de consumo mudam para alimentos minimamente processados e ricos em nutrientes. As nozes cruas retêm enzimas e nutrientes naturais, atraindo fortemente comunidades preocupadas com a saúde, veganas e adeptas de uma alimentação saudável.
- Por grau
Com base na classificação, o mercado é categorizado em grau A (qualidade premium para exportação), grau B (uso doméstico de qualidade média), grau quebrado (uso em panificação e confeitaria), grau para óleo, grau industrial e grau rejeitado (ração animal). O segmento de grau A deverá dominar o mercado, com uma participação de mercado de 33,99% em 2025, principalmente devido à crescente demanda internacional por nozes de alta qualidade e visualmente consistentes. Exportadores premium se beneficiam de um rigoroso controle de qualidade, atraindo mercados voltados para a saúde na América do Norte, Europa e Leste Asiático.
- Por prazo de validade
O mercado é segmentado por prazo de validade em <6 meses, 6 a 12 meses, 13 a 18 meses, 18 meses e mais de 18 meses. Prevê-se que o segmento <6 meses domine o mercado, com uma participação de mercado de 36,49% em 2025, refletindo uma demanda crescente por nozes mais frescas e recém-colhidas. Consumidores premium, especialmente nos setores de varejo e saúde, associam prazo de validade curto a melhor sabor, textura e valor nutricional.
- Por Certificação
Com base na certificação, o mercado inclui ISO 22000/HACCP, USDA Organic, EU Organic, Non-GMO Verified, Gluten-Free Certified, Kosher, Halal, Vegan Certified, Fair Trade, Rainforest Alliance, Carbon Neutral Certified, entre outros. O segmento ISO 22000/HACCP deverá liderar o mercado com uma participação de mercado de 20,62% em 2025, devido ao aumento das regulamentações globais de segurança alimentar e à demanda do consumidor por produtos de nozes rastreáveis, higiênicos e com garantia de qualidade.
- Por embalagem
Os tipos de embalagem incluem sachês plásticos, embalagens seladas a vácuo, potes de PET, sacos de papel, latas compostas, sacos de tecido a granel, potes de vidro, sachês/unidades, caixas de presente, embalagens de base biológica/compostáveis, latas de metal, potes ecológicos resseláveis, barras embaladas em papel alumínio, embalagens recarregáveis e outros. Em 2025, espera-se que os sachês plásticos dominem o mercado, com uma participação de mercado de 20,47%, impulsionados por sua conveniência, portabilidade, custo-benefício e benefícios de prazo de validade. Subsegmentos como embalagens com zíper também atendem bem às vitrines modernas do varejo e ao uso do consumidor.
- Por tamanho da embalagem
O mercado é segmentado em 101g–250g, 251g–500g, 51g–100g, 25g–50g, 501g–1kg, 1,1kg–2,5kg, 2,6kg–5kg, 5,1kg–10kg, 10,1kg–25kg, 25,1kg–50kg, 50kg e <25g. Em 2025, espera-se que o segmento de 101g–250g domine o mercado, com uma participação de mercado de 15,49%, atendendo ao consumo em movimento, compras de teste e lanches saudáveis. Essa linha equilibra conveniência e valor, tornando-se atraente tanto no varejo moderno quanto nos canais online.
- Por faixa de preço
As faixas de preço incluem econômica/econômica (US$ 1,00 a US$ 6,00 por kg), intermediária (US$ 6,01 a US$ 12,00 por kg), premium (US$ 12,01 a US$ 20,00 por kg) e superpremium/gourmet (acima de US$ 20,00 por kg). A projeção é de que o segmento econômico/econômico domine o mercado, com uma participação de mercado de 39,11% em 2025, devido à demanda impulsionada pela acessibilidade em mercados emergentes, compradores institucionais e canais de varejo de massa.
- Por uso final
O mercado é segmentado em consumo direto, snacks, manteigas e pastas de nozes, indústria de panificação, indústria de confeitaria, fabricação de cereais e granola, nutrição funcional, alternativas lácteas, indústria de bebidas, carnes vegetais, culinária, extração industrial de óleo, panificação sem farinha e glúten, produtos de higiene pessoal, usos de base biológica e agroindustriais, aditivos para alimentos para animais de estimação, ração animal e outros. Em 2025, prevê-se que o segmento de consumo direto domine o mercado, com uma quota de mercado de 13,17%, devido à crescente procura por snacks práticos e nutritivos. A ascensão de estilos de vida saudáveis e dietas ricas em proteínas impulsiona ainda mais este segmento nos canais de retalho, online e de viagens.
- Por canal de distribuição
Com base no canal de distribuição, o mercado é segmentado em B2B e B2C. O B2C é ainda dividido em canais offline e online. O offline inclui supermercados/hipermercados, lojas de conveniência, lojas de produtos naturais, padarias, lojas especializadas, HoReCa, lojas duty-free e companhias aéreas. O online inclui marketplaces de e-commerce e sites de marcas próprias. Espera-se que o segmento B2B domine o mercado, com uma participação de mercado de 53,66% em 2025, impulsionado pela ampla disponibilidade de produtos, confiança no varejo físico e comportamento de compra por impulso, especialmente em mercados tradicionais e emergentes.
Análise regional do mercado de nozes
- Espera-se que a América do Norte domine o mercado global de nozes, com a maior participação de receita de 27,41% em 2025. O mercado nessa região é impulsionado pela crescente conscientização sobre saúde, maiores rendas disponíveis e um forte foco em nutrição à base de plantas.
- Os consumidores preferem cada vez mais nozes como amêndoas, nozes, nozes-pecã e pistaches devido aos seus benefícios à saúde, incluindo saúde do coração, controle de peso e alto teor de proteínas e fibras.
- A região se beneficia de uma robusta indústria de processamento de alimentos e canais de distribuição de varejo bem estabelecidos.
Visão geral do mercado de nozes dos EUA
Espera-se que os Estados Unidos liderem o mercado norte-americano, contribuindo com aproximadamente 82,38% da receita regional. Isso se deve à ampla popularidade de lanches à base de nozes, ao aumento da demanda por variedades orgânicas e não transgênicas e às crescentes aplicações em panificação, alternativas a laticínios e alimentos funcionais. A Califórnia desempenha um papel central, sendo um dos maiores produtores mundiais de amêndoas e nozes. Os EUA também demonstram forte demanda por produtos de nozes com valor agregado, como nozes torradas com sabor, mixes de trilha, manteigas de nozes e barras de proteína, refletindo uma base de consumidores madura e focada em saúde.
Visão geral do mercado de nozes na Europa
A Europa deverá apresentar crescimento constante durante o período previsto, impulsionado pela crescente demanda por alternativas alimentares saudáveis e naturais. Os consumidores europeus estão se tornando mais preocupados com a saúde e migrando para dietas que enfatizam proteínas vegetais e alimentos funcionais. A região demonstra uma preferência crescente por nozes orgânicas, de origem ética e comércio justo. As nozes são amplamente utilizadas em lanches, produtos de panificação e cereais matinais, com demanda crescente por variedades premium e saborizadas.
Visão geral do mercado de nozes do Reino Unido
No Reino Unido, espera-se que o mercado se expanda devido à mudança nos hábitos de consumo de lanches e à forte migração para opções práticas e saudáveis, incluindo pacotes de nozes em porções e barras de nozes. Um setor de e-commerce e uma rede varejista bem estabelecidos sustentam ainda mais esse crescimento.
Visão geral do mercado de nozes da Alemanha
O mercado de nozes na Alemanha está em constante crescimento, impulsionado pela demanda por produtos de alta qualidade e de origem ética. A forte presença de consumidores preocupados com a saúde e uma indústria de processamento de alimentos bem desenvolvida no país promovem a inovação em lanches, manteigas de nozes e produtos de panificação à base de nozes.
Visão do mercado de nozes da Ásia-Pacífico
A região da Ásia-Pacífico deverá crescer à taxa composta de crescimento anual (CAGR) mais rápida, de 5,9%, entre 2025 e 2032, impulsionada pela rápida urbanização, pelo aumento da população de classe média e pela mudança nos padrões alimentares. O crescente consumo de nozes como petiscos e ingredientes em receitas tradicionais e modernas está expandindo o mercado em toda a região.
Visão geral do mercado de castanhas japonesas
No Japão, a crescente conscientização sobre saúde e o envelhecimento da população estão impulsionando a demanda por alimentos funcionais, incluindo nozes ricas em nutrientes essenciais. A popularidade de amêndoas e nozes em cereais, doces e lanches para viagem está crescendo rapidamente tanto em áreas urbanas quanto suburbanas.
Visão do mercado de nozes da China
A China deverá crescer com a maior fatia de mercado, de 14,44%, na região Ásia-Pacífico em 2025, devido à sua vasta população, à crescente conscientização sobre saúde e à expansão das redes de varejo e e-commerce. O mercado é impulsionado pela forte produção nacional de nozes e pela crescente demanda por amêndoas e castanhas de caju importadas. Iniciativas governamentais que promovem uma alimentação saudável e o surgimento de marcas premium de nozes também estão impulsionando o crescimento do mercado.
Participação no mercado de nozes
A indústria de nozes é liderada principalmente por empresas bem estabelecidas, incluindo:
- Olam Group (Singapura)
- ADM (EUA)
- Mariani Nut Company (EUA)
- BORGES AGRICULTURAL & INDUSTRIAL NUTS, SA (Espanha)
- COLHEITAS SELECIONADAS (Austrália)
- Blue Diamond Growers (EUA)
- Wonderful Pistachios LLC (EUA)
- Treehouse California Almonds, LLC (EUA)
- Sahale Snacks (EUA)
- Santé Nuts (EUA)
- JOHN B. SANFILIPPO & SON, INC. (EUA)
- SETTON PISTACHIO DA TERRA BELLA, INC. (EUA)
- TERRA NUTS ( Brasil )
- HINES NUT COMPANY (EUA)
- JINDAL CACAU E NOZES (Índia)
- Golden Peanut Company, LLC (EUA)
- Barry Callebaut. (Suíça)
- GRUPO INTERSNACK (Alemanha)
- ROYAL NUT COMPANY (Austrália)
- Noz Gourmet (EUA)
- Diamond Foods (EUA)
- Hormel Foods Corporation (EUA)
- Del Alba (Coreia do Sul)
- Poindexter Nut Company (EUA)
- Now Foods (Canadá)
- Nutland Group (Holanda)
- Mount Franklin Foods (EUA)
- nutwork Handelsgesellschaft mbH (Alemanha)
- Western Nut Company Inc. (EUA)
- The Daily Nut Co. (Índia)
Últimos desenvolvimentos no mercado global de nozes
- Em abril de 2024, o Olam Group (Singapura) anunciou uma grande expansão de suas capacidades de processamento de castanhas na Nigéria, com o objetivo de aumentar os volumes de processamento de castanha de caju para consumo interno e exportação. Este investimento está alinhado à estratégia da Olam de fortalecer sua presença em produtos agrícolas de valor agregado e apoiar as economias locais por meio da criação de empregos e do desenvolvimento de capacidades em mercados emergentes.
- Em março de 2024, a Blue Diamond Growers (EUA) lançou uma nova linha de snacks proteicos à base de amêndoas sob a marca “Nut-Thins”, com foco em opções de snacks ricos em proteína e sem glúten. Este lançamento atende à crescente demanda dos consumidores por opções de snacks saudáveis para levar e reforça a posição da Blue Diamond no segmento de snacks funcionais da indústria de nozes.
- Em fevereiro de 2024, a Select Harvests (Austrália) anunciou a aquisição de pomares de amêndoas adicionais em Victoria para aumentar sua capacidade de produção. Espera-se que essa mudança estratégica melhore a integração vertical e garanta um fornecimento estável de amêndoas de alta qualidade, fortalecendo a competitividade global da empresa em meio à crescente demanda dos mercados da Ásia-Pacífico.
- Em janeiro de 2024, a Wonderful Pistachios LLC (EUA) lançou uma campanha de marketing global intitulada "O Poder dos Pistaches", destacando os benefícios do consumo de pistache para a saúde. A campanha tem como alvo os principais mercados internacionais, incluindo Índia, China e Oriente Médio, e conta com o apoio de parcerias de marketing de influência e conscientização nutricional.
- Em dezembro de 2023, a John B. Sanfilippo & Son, Inc. (EUA) investiu em automação e digitalização em sua unidade de processamento em Illinois para aumentar a eficiência e garantir qualidade consistente em suas linhas de produtos de amendoim e nozes. A atualização inclui sistemas de triagem com tecnologia de IA e medidas de sustentabilidade aprimoradas em embalagens e no uso de água.
- Em novembro de 2023, a Borges Agricultural & Industrial Nuts, SA (Espanha) anunciou uma parceria com uma plataforma blockchain para implementar a rastreabilidade completa em suas cadeias de suprimentos de amêndoas e nozes. Esta iniciativa visa garantir transparência, certificação de comércio justo e a confiança do consumidor nos mercados europeu e norte-americano.
SKU-
Obtenha acesso online ao relatório sobre a primeira nuvem de inteligência de mercado do mundo

- Painel interativo de análise de dados
- Painel de análise da empresa para oportunidades de elevado potencial de crescimento
- Acesso de analista de pesquisa para personalização e customização. consultas
- Análise da concorrência com painel interativo
- Últimas notícias, atualizações e atualizações Análise de tendências
- Aproveite o poder da análise de benchmark para um rastreio abrangente da concorrência
Índice
1 INTRODUÇÃO
1.1 OBJETIVOS DO ESTUDO
1.2 DEFINIÇÃO DE MERCADO
1.3 VISÃO GERAL
1.4 LIMITAÇÕES
1,5 MERCADOS COBERTOS
2 SEGMENTAÇÃO DE MERCADO
2.1 MERCADOS COBERTOS
2.2 ÂMBITO GEOGRÁFICO
2,3 ANOS CONSIDERADOS PARA O ESTUDO
2.4 MOEDA E PREÇOS
2.5 MODELO DE VALIDAÇÃO DE DADOS TRIPÉ DBMR
2.6 MODELAGEM MULTIVARIADA
2.7 ENTREVISTAS PRINCIPAIS COM PRINCIPAIS LÍDERES DE OPINIÃO
2.8 GRADE DE POSIÇÃO DE MERCADO DBMR
2.9 GRADE DE COBERTURA DE USO FINAL DO MERCADO
2.1 ANÁLISE DE PARTICIPAÇÃO DE FORNECEDORES DBMR
2.11 FONTES SECUNDÁRIAS
2.12 PREMISSAS
3 RESUMO EXECUTIVO
4 INSIGHTS PREMIUM
4.1 CADEIA DE VALOR
4.1.1 PRODUÇÃO:
4.1.2 PROCESSAMENTO:
4.1.3 MARKETING/DISTRIBUIÇÃO:
4.1.4 COMPRADORES:
4.2 ANÁLISE DA CADEIA DE SUPRIMENTOS
4.3 ANÁLISE DAS CINCO FORÇAS DE PORTER
4.4 ANÁLISE DE SOURCING DE MATÉRIA-PRIMA
4.5 VISÃO GERAL DAS INOVAÇÕES TECNOLÓGICAS
4.6 ESTRATÉGIAS DE CRESCIMENTO ADOTADAS PELOS PRINCIPAIS ATORES DO MERCADO
4.7 FATORES QUE INFLUENCIAM A DECISÃO DE COMPRA DOS USUÁRIOS FINAIS
4.8 IMPACTO DA DESACELERAÇÃO ECONÔMICA NO MERCADO
4.8.1 IMPACTO NO PREÇO
4.8.2 IMPACTO NA CADEIA DE SUPRIMENTOS
4.8.3 IMPACTO NA REMESSA
4.8.4 IMPACTO NAS DECISÕES ESTRATÉGICAS DA EMPRESA
4.9 QUADRO REGULAMENTAR E DIRETRIZES
4.9.1 DETALHAMENTO DA ANÁLISE DE CUSTOS
4.1 RASTREADOR DE INOVAÇÃO E ANÁLISE ESTRATÉGICA
4.10.1 ANÁLISE DE GRANDES NEGÓCIOS E ALIANÇAS ESTRATÉGICAS
4.10.1.1 JOINT VENTURES
4.10.1.2 FUSÕES E AQUISIÇÕES
4.10.1.3 LICENCIAMENTO E PARCERIA
4.10.1.4 COLABORAÇÕES DE TECNOLOGIA
4.10.1.5 DESINVESTIMENTOS ESTRATÉGICOS
4.10.2 NÚMERO DE PRODUTOS EM DESENVOLVIMENTO
4.10.3 ESTÁGIO DE DESENVOLVIMENTO
4.10.4 CRONOGRAMAS E MARCOS
4.10.5 ESTRATÉGIAS E METODOLOGIAS DE INOVAÇÃO
4.10.6 AVALIAÇÃO E MITIGAÇÃO DE RISCOS
4.10.7 PERSPECTIVAS FUTURAS
4.11 TARIFAS E IMPACTO NO MERCADO
4.11.1 TARIFA(S) ATUAL(AIS) NOS 5 PRINCIPAIS MERCADOS DO PAÍS
4.11.2 PERSPECTIVAS: PRODUÇÃO LOCAL V/S DEPENDÊNCIA DE IMPORTAÇÕES
4.11.3 DINÂMICA DOS CRITÉRIOS DE SELEÇÃO DE FORNECEDORES
4.11.4 IMPACTO NA CADEIA DE SUPRIMENTOS
4.11.4.1 AQUISIÇÃO DE MATÉRIA-PRIMA
4.11.4.2 FABRICAÇÃO E PRODUÇÃO
4.11.4.3 LOGÍSTICA E DISTRIBUIÇÃO
4.11.4.4 PREÇO DE APRESENTAÇÃO E POSICIONAMENTO DE MERCADO
4.11.5 PARTICIPANTES DA INDÚSTRIA: MOVIMENTOS PROATIVOS
4.11.5.1 OTIMIZAÇÃO DA CADEIA DE SUPRIMENTOS
4.11.5.2 ESTABELECIMENTOS DE JOINT VENTURE
4.11.6 IMPACTO NOS PREÇOS
4.11.7 INCLINAÇÃO REGULAMENTAR
4.11.7.1 SITUAÇÃO GEOPOLÍTICA
4.11.7.2 PARCERIAS COMERCIAIS ENTRE OS PAÍSES
4.11.7.2.1 ACORDOS DE LIVRE COMÉRCIO
4.11.7.2.2 ESTABELECIMENTOS DE ALIANÇAS
4.11.7.3 ACREDIÇÃO DE STATUS (INCLUINDO MFTN)
4.11.7.4 CURSO CORRETIVO DOMÉSTICO
4.11.7.4.1 REGIMES DE INCENTIVOS PARA AUMENTAR A PRODUÇÃO
4.11.7.4.2 CRIAÇÃO DE ZONAS ECONÔMICAS ESPECIAIS/PARQUES INDUSTRIAIS
4.12 PERSPECTIVA DA MARCA
4.12.1 ANÁLISE COMPARATIVA DE MARCAS
4.12.2 VISÃO GERAL DO PRODUTO E DA MARCA
4.13 ANÁLISE DA CADEIA DE SUPRIMENTOS
4.13.1 VISÃO GERAL
4.13.2 CENÁRIO DE CUSTOS LOGÍSTICOS
4.13.3 IMPORTÂNCIA DOS PRESTADORES DE SERVIÇOS LOGÍSTICOS
4.14 ANÁLISE DE PRODUÇÃO E CONSUMO
4.15 ANÁLISE DE IMPORTAÇÃO-EXPORTAÇÃO
4.16 ANÁLISE DE PATENTES
4.16.1 QUALIDADE E RESISTÊNCIA DA PATENTE
4.16.2 FAMÍLIAS DE PATENTES
4.16.3 NÚMERO DE FAMÍLIAS DE PATENTES INTERNACIONAIS POR ANO DE PUBLICAÇÃO
4.17 LICENCIAMENTO E COLABORAÇÕES
4.17.1 CENÁRIO DE PATENTES DE EMPRESAS
4.18 PANORAMA DE PATENTES DA REGIÃO
4.19 ESTRATÉGIA E GESTÃO DE PI
4.2 ANÁLISE DE PATENTES
4.21 CENÁRIO DE MARGENS DE LUCRO
4.22 ANÁLISE DE PREÇOS
4.23 ANÁLISE DE ECOSSISTEMAS DA INDÚSTRIA
4.23.1 EMPRESAS DESTACADAS
4.23.2 PEQUENAS E MÉDIAS EMPRESAS
4.23.3 USUÁRIOS FINAIS
4.24 IMPACTO DA DESACELERAÇÃO ECONÔMICA NO MERCADO GLOBAL DE NOZES
4.24.1 IMPACTO NOS PREÇOS
4.24.2 IMPACTO NA CADEIA DE SUPRIMENTOS
4.24.3 IMPACTO NA REMESSA
4.24.4 IMPACTO NA DEMANDA
4.24.5 IMPACTO NAS DECISÕES ESTRATÉGICAS
5 VISÃO GERAL DO MERCADO
5.1 MOTORISTAS
5.1.1 TENDÊNCIA GLOBAL CRESCENTE EM DIREÇÃO A LANCHES MAIS SAUDÁVEIS E ESCOLHAS NUTRITIVAS
5.1.2 AUMENTO NO CONSUMO DIÁRIO DE VÁRIOS PRODUTOS DE CASTANHAS
5.1.3 AUMENTO DA DEMANDA GLOBAL POR DIETAS À BASE DE PLANTAS
5.1.4 CRESCIMENTO DO COMÉRCIO ELETRÔNICO IMPULSIONANDO A ACESSIBILIDADE DE PRODUTOS DE ALTA QUALIDADE
5.2 RESTRIÇÕES
5.2.1 A VOLATILIDADE DOS PREÇOS RESTRINGE O CRESCIMENTO NO MERCADO DE NOZES
5.2.2 INTERRUPÇÕES NA CADEIA DE SUPRIMENTOS
5.2.3 IMPACTO DAS ALTERAÇÕES CLIMÁTICAS NA ESTABILIDADE DO MERCADO
5.3 OPORTUNIDADES
5.3.1 INOVAÇÃO EM PRODUTOS DE CASTANHAS SABORIZADOS E PRONTOS PARA CONSUMO
5.3.2 MODIFICAÇÃO NA PRODUÇÃO DE CASTANHAS
5.3.3 AUMENTO DO USO DE NOZES EM PRODUTOS DE PADARIA E CONFEITARIA
5.4 DESAFIOS
5.4.1 O AUMENTO DA SECA, AS ONDAS DE CALOR E AS CHUVA IMPREVISÍVEIS AMEAÇAM A PRODUTIVIDADE E A QUALIDADE DAS CULTURAS
5.4.2 A ESCASSEZ DE MÃO DE OBRA NAS ÉPOCAS DE COLHEITA E A DEPENDÊNCIA DO TRABALHO MANUAL AUMENTAM OS DESAFIOS DE CUSTOS E DE CONFORMIDADE
6 MERCADO GLOBAL DE NOZES, POR TIPO DE PRODUTO
6.1 VISÃO GERAL
6.2 NOZES
6.2.1 NOZES, POR TIPO
6.2.1.1 AMÊNDOAS
6.2.1.2 CAJU
6.2.1.3 NOZES
6.2.1.4 PISTACHES
6.2.1.5 AVELÃS
6.2.1.6 PECÃS-PECÃ
6.2.1.7 MACADÂMIAS
6.2.1.8 PINHÕES
6.2.1.9 CASTANHA-DO-PARÁ
6.2.1.10 CASTANHAS
6.2.1.11 NOZES PILI
6.2.1.12 NOZES DE BARUKAS
6.2.1.13 OUTROS
6.3 AMENDOIM
6.3.1 AMENDOIM, POR AMENDOIM
6.3.1.1 CORREDOR
6.3.1.2 VIRGÍNIA
6.3.1.3 ESPANHOL
6.3.1.4 VALÊNCIA
6.3.1.5 OUTROS
6.4 HÍBRIDOS/OUTROS NOZES
6.4.1 HÍBRIDAS/OUTRAS NOZES, POR TIPO
6.4.1.1 COCOS
6.4.1.2 NOZES DE BÉTELE
6.4.1.3 TIGER NUTS
6.4.1.4 NOZES DE GINKGO
6.4.1.5 OUTROS
6.5 OUTROS
7 MERCADO GLOBAL DE NOZES, FORMULÁRIO
7.1 VISÃO GERAL
7.2 INTEIRO
7.3 MANTEIGA
7.4 TERRA
7,5 METADES
7,6 PEÇAS
7.7 ÓLEO
7.8 LEITE
7.9 COLAR
7.1 CREME
7.11 PEÇAS ASSADAS
7.12 REVESTIDO
7.13 FARINHA
7.14 PÓ
7.15 PICADO
7.16 FATIADO
7.17 CUBOS
7.18 ESMAGADO
7.19 INTEIRO BRANQUEADO
7.2 CONGELADO
7.21 SECAGEM POR ASPERSÃO
7.22 ENCAPSULADO
7.23 OUTROS
8 MERCADO GLOBAL DE NOZES, POR NATUREZA
8.1 VISÃO GERAL
8.2 CONVENCIONAL
8.3 ORGÂNICO
9 MERCADO GLOBAL DE NOZES, POR MÉTODO DE PROCESSAMENTO
9.1 VISÃO GERAL
9.2 RAW
9.3 ASSADO
9.3.1 TORRADAS, POR TIPO
9.3.1.1 TORRA SECA
9.3.1.2 TORRADAS EM ÓLEO
9.4 SALGADO
9,5 BRANQUEADO
9.6 SABORIZADO
9.6.1 SABORIZADO, POR TIPO
9.6.1.1 ADOÇADO
9.6.1.2 APIMENTADO
9.6.1.3 COBERTO DE CHOCOLATE
9.6.1.4 INFUSÃO DE ERVAS
9.6.1.5 REVESTIDO COM IOGURTE
9.6.1.6 OUTROS
9.7 SEM SAL
9.8 VIDRO
9.9 CRISTALIZADO
9.1 CARAMELIZADO
9.11 FUMADO
9.12 BROTOS
9.13 FERMENTADO
9.14 LIOFILIZADO
9.15 EM CONSERVA
9.16 FRITO A VÁCUO
9.17 DESIDRATADO
9.18 OUTROS
10 MERCADOS GLOBAIS DE NOZES, POR GRAU
10.1 VISÃO GERAL
10.2 A GRADE (QUALIDADE DE EXPORTAÇÃO PREMIUM)
10.3 GRAU B (USO DOMÉSTICO DE QUALIDADE MÉDIA)
10.4 GRAU QUEBRADO (USO EM PADARIA E CONFEITARIA)
10.5 ÓLEO GRAU
10.6 NÍVEL INDUSTRIAL
10.7 GRAU REJEITADO (RAÇÃO ANIMAL)
11 MERCADO GLOBAL DE NOZES, POR VALIDADE
11.1 VISÃO GERAL
11,2 <6 MESES
11.3 6–12 MESES
11.4 13–18 MESES
11,5 18 MESES
11,6 MAIS DE 18 MESES
12 MERCADO GLOBAL DE NOZES, POR CERTIFICAÇÃO
12.1 VISÃO GERAL
12.2 ISO 22000/HACCP
12.3 USDA ORGÂNICO
12.4 UE ORGÂNICO
12.5 NÃO OGM VERIFICADO
12.6 CERTIFICADO SEM GLÚTEN
12,7 KOSHER
12,8 HALAL
12.9 CERTIFICADO VEGANO
12.1 COMÉRCIO JUSTO
12.11 ALIANÇA DA FLORESTA TROPICAL
12.12 CERTIFICADO DE CARBONO NEUTRO
12.13 OUTROS
13 MERCADO GLOBAL DE NOZES, EMBALAGEM
13.1 VISÃO GERAL
13.2 SACOLAS PLÁSTICAS
13.2.1 SACOLAS PLÁSTICAS, POR TIPO
13.2.1.1 PACOTES COM ZÍPER STAND-UP
13.2.1.2 PACOTES DE TRAVESSEIROS
13.3 EMBALAGENS SELADAS A VÁCUO
13.4 POTES PET
13,5 SACOLAS DE PAPEL
13.6 LATAS COMPOSTAS
13.7 SACOS DE TECIDO A GRANEL
13.8 FRASCOS DE VIDRO
13,9 SACHÊS/SERVIÇA INDIVIDUAL
13.1 CAIXAS DE PRESENTE
13.11 BIO-BASEADO/COMPOSTABLE
13.12 LATAS DE METAL
13.13 Eco-tubos rêsseláveis
13.14 BARRAS EMBALADAS EM PAPEL ALUMÍNIO
13.15 PACOTES DE RECARGA
13.16 OUTROS
14 MERCADO GLOBAL DE NOZES, POR TAMANHO DE EMBALAGEM
14.1 VISÃO GERAL
14,2 101G–250G
14,3 251G–500G
14,4 51G–100G
14,5 25G–50G
14,6 501G–1KG
14,7 1,1 kg–2,5 kg
14,8 2,6 kg–5 kg
14,9 5,1 kg–10 kg
14,1 10,1 kg–25 kg
14.11 25,1 kg–50 kg
14.12 50KG
14,13 <25G
15 MERCADOS GLOBAIS DE NOZES, POR FAIXA DE PREÇO
15.1 VISÃO GERAL
15.2 ECONOMIA/ORÇAMENTO (USD 1,00-6,00 POR KG)
15.3 MÉDIO (USD 6,01-12,00 POR KG)
15.4 PREMIUM (USD 12,01-20,00 POR KG)
15,5 SUPER-PREMIUM/GOURMET (ACIMA DE USD 20,00 POR KG)
16 MERCADO GLOBAL DE NOZES, POR USO FINAL
16.1 VISÃO GERAL
16.2 CONSUMO DIRETO
16.3 LANCHES
16.4 MANTEIGAS E CREMES DE CASTANHAS
16.5 INDÚSTRIA DE PADARIA
16.6 INDÚSTRIA DE CONFEITARIA
16.7 FABRICAÇÃO DE CEREAIS E GRANOLA
16.8 NUTRIÇÃO FUNCIONAL
16.8.1 NUTRIÇÃO FUNCIONAL, POR TIPO
16.8.1.1 BARRAS DE PROTEÍNA
16.8.1.2 SUBSTITUTOS DE REFEIÇÃO
16.8.1.3 SUPLEMENTOS
16.8.1.4 OUTROS
16.9 ALTERNATIVAS AOS LATICÍNIOS
16.1 INDÚSTRIA DE BEBIDAS
16.10.1 INDÚSTRIA DE BEBIDAS, POR TIPO
16.10.1.1 LEITE DE NOZES
16.10.1.2 BEBIDAS PROTEICAS À BASE DE NOZES
16.10.1.3 BEBIDAS DE NOZES FERMENTADAS
16.10.1.4 OUTROS
16.11 CARNES DE ORIGEM VEGETAL
16.12 CULINÁRIA
16.12.1 CULINÁRIA, POR TIPO
16.12.1.1 GUARNIÇÃO
16.12.1.2 MOLHOS
16.12.1.3 CONDIMENTOS
16.12.1.4 OUTROS
16.13 EXTRAÇÃO INDUSTRIAL DE PETRÓLEO
16.14 PÃES SEM FARINHA E SEM GLÚTEN
16.15 PRODUTOS DE CUIDADOS PESSOAIS
16.15.1 PRODUTOS DE CUIDADOS PESSOAIS, POR TIPO
16.15.1.1 CUIDADOS COM A PELE
16.15.1.2 ÓLEO PARA CABELO
16.15.1.3 ESFOLIANTES
16.15.1.4 OUTROS
16.16 USOS DE BASE BIOLÓGICA E AGROINDUSTRIAIS
16.16.1 USOS DE BASE BIOLÓGICA E AGROINDUSTRIAIS, POR TIPO
16.16.1.1 CARVÃO ATIVADO
16.16.1.2 ABRASIVOS
16.16.1.3 ADITIVOS PARA BIOCOMBUSTÍVEIS
16.16.1.4 OUTROS
16.17 ADITIVOS PARA ALIMENTOS PARA ANIMAIS DE ESTIMAÇÃO
16.18 ALIMENTAÇÃO ANIMAL
16.18.1 ALIMENTOS PARA ANIMAIS, POR TIPO
16.18.1.1 RESÍDUO DE REFEIÇÃO
16.18.1.2 CONCHAS
16.18.1.3 OUTROS
16.19 OUTROS
17 MERCADO GLOBAL DE NOZES, POR CANAL DE DISTRIBUIÇÃO
17.1 VISÃO GERAL
17.2 B2B
17.3 B2C
17.3.1 B2C, POR TIPO
17.3.1.1 OFFLINE
17.3.1.1.1 SUPERMERCADOS/HIPERMERCADOS
17.3.1.1.2 LOJAS DE CONVENIÊNCIA
17.3.1.1.3 LOJAS DE ALIMENTOS SAUDÁVEIS
17.3.1.1.4 PADARIAS
17.3.1.1.5 LOJAS ESPECIALIZADAS
17.3.1.1.6 HORECA
17.3.1.1.7 LOJAS DUTY-FREE
17.3.1.1.8 COMPANHIAS AÉREAS
17.3.1.1.9 OUTROS
17.3.1.2 ONLINE
17.3.1.2.1 MERCADOS DE COMÉRCIO ELETRÔNICO
17.3.1.2.2 SITES DE PROPRIEDADE DA MARCA
18 MERCADO GLOBAL DE NOZES, POR REGIÃO
18.1 VISÃO GERAL
18.2 AMÉRICA DO NORTE
18.2.1 EUA
18.2.2 CANADÁ
18.2.3 MÉXICO
18.3 EUROPA
18.3.1 ALEMANHA
18.3.2 FRANÇA
18.3.3 HOLANDA
18.3.4 ESPANHA
18.3.5 ITÁLIA
18.3.6 Reino Unido
18.3.7 POLÔNIA
18.3.8 RÚSSIA
18.3.9 BÉLGICA
18.3.10 SUÍÇA
18.3.11 TURQUIA
18.3.12 SUÉCIA
18.3.13 NORUEGA
18.3.14 DINAMARCA
18.3.15 FINLÂNDIA
18.3.16 RESTO DA EUROPA
18.4 ÁSIA-PACÍFICO
18.4.1 CHINA
18.4.2 ÍNDIA
18.4.3 JAPÃO
18.4.4 COREIA DO SUL
18.4.5 AUSTRÁLIA
18.4.6 MALÁSIA
18.4.7 INDONÉSIA
18.4.8 TAILÂNDIA
18.4.9 FILIPINAS
18.4.10 SINGAPURA
18.4.11 HONG KONG
18.4.12 NOVA ZELÂNDIA
18.4.13 TAIWAN
18.4.14 RESTO DA ÁSIA-PACÍFICO
18.5 ORIENTE MÉDIO E ÁFRICA
18.5.1 Emirados Árabes Unidos
18.5.2 ARÁBIA SAUDITA
18.5.3 EGITO
18.5.4 ÁFRICA DO SUL
18.5.5 ISRAEL
18.5.6 KUWAIT
18.5.7 OMÃ
18.5.8 BAHREIN
18.5.9 CATAR
18.5.10 RESTANTE DO ORIENTE MÉDIO E ÁFRICA
18.6 AMÉRICA DO SUL
18.6.1 BRASIL
18.6.2 CHILE
18.6.3 ARGENTINA
18.6.4 PERU
18.6.5 COLÔMBIA
18.6.6 BOLÍVIA
18.6.7 EQUADOR
18.6.8 PARAGUAI
18.6.9 URUGUAI
18.6.10 VENEZUELA
18.6.11 RESTO DA AMÉRICA DO SUL
19 CENÁRIO GLOBAL DA EMPRESA DO MERCADO DE NOZES
19.1 ANÁLISE DE AÇÕES DA EMPRESA: GLOBAL
19.2 ANÁLISE DE AÇÕES DA EMPRESA: NA
19.3 ANÁLISE DE AÇÕES DA EMPRESA: APAC
19.4 ANÁLISE DE AÇÕES DA EMPRESA: EUROPA
20 ANÁLISE SWOT
21 PERFIS DE EMPRESAS
21.1 ADM
21.1.1 RESUMO DA EMPRESA
21.1.2 ANÁLISE DE RECEITA
21.1.3 ANÁLISE DE AÇÕES DA EMPRESA
21.1.4 PORTFÓLIO DE PRODUTOS
21.1.5 DESENVOLVIMENTO RECENTE
21.2 GRUPO OLAM
21.2.1 RESUMO DA EMPRESA
21.2.2 ANÁLISE DE RECEITA
21.2.3 ANÁLISE DAS AÇÕES DA EMPRESA
21.2.4 PORTFÓLIO DE PRODUTOS
21.2.5 DESENVOLVIMENTO RECENTE
21.3 BARRY CALLEBAUT
21.3.1 RESUMO DA EMPRESA
21.3.2 ANÁLISE DE RECEITA
21.3.3 ANÁLISE DE AÇÕES DA EMPRESA
21.3.4 PORTFÓLIO DE PRODUTOS
21.3.5 DESENVOLVIMENTO RECENTE
21.4 PRODUTORES DE DIAMANTES AZUIS.
21.4.1 RESUMO DA EMPRESA
21.4.2 ANÁLISE DAS AÇÕES DA EMPRESA
21.4.3 PORTFÓLIO DE PRODUTOS
21.4.4 DESENVOLVIMENTOS/NOTÍCIAS RECENTES
21.5 JOHN B. SANFILIPPO & FILHO, INC.
21.5.1 RESUMO DA EMPRESA
21.5.2 ANÁLISE DE RECEITA
21.5.3 ANÁLISE DE AÇÕES DA EMPRESA
21.5.4 PORTFÓLIO DE PRODUTOS
21.5.5 DESENVOLVIMENTOS RECENTES
21.6 BORGES AGRICULTURAL & INDUSTRIAL NUTS, SA
21.6.1 RESUMO DA EMPRESA
21.6.2 ANÁLISE DE RECEITA
21.6.3 PORTFÓLIO DE PRODUTOS
21.6.4 DESENVOLVIMENTOS/NOTÍCIAS RECENTES
21.7 DEL ALBA.
21.7.1 RESUMO DA EMPRESA
21.7.2 PORTFÓLIO DE PRODUTOS
21.7.3 DESENVOLVIMENTO/NOTÍCIAS RECENTES
21.8 ALIMENTOS DIAMANTE
21.8.1 RESUMO DA EMPRESA
21.8.2 PORTFÓLIO DE PRODUTOS
21.8.3 DESENVOLVIMENTOS/NOTÍCIAS RECENTES
21.9 GOLDEN PEANUT COMPANY, LLC
21.9.1 RESUMO DA EMPRESA
21.9.2 PORTFÓLIO DE PRODUTOS
21.9.3 DESENVOLVIMENTOS RECENTES
21.1 NOZ GOURMET
21.10.1 RESUMO DA EMPRESA
21.10.2 PORTFÓLIO DE PRODUTOS
21.10.3 DESENVOLVIMENTOS/NOTÍCIAS RECENTES
21.11 HINES NUT COMPANY
21.11.1 RESUMO DA EMPRESA
21.11.2 PORTFÓLIO DE PRODUTOS
21.12 CORPORAÇÃO DE ALIMENTOS HORMEL
21.12.1 COMPANY SNAPSHOT
21.12.2 REVENUE ANALYSIS
21.12.3 PRODUCT PORTFOLIO
21.12.4 RECENT DEVELOPMENTS/NEWS
21.13 INTERSNACK GROUP GMBH & CO. KG
21.13.1 COMPANY SNAPSHOT
21.13.2 PRODUCT PORTFOLIO
21.13.3 RECENT DEVELOPMENTS
21.14 JINDAL COCOA
21.14.1 COMPANY SNAPSHOT
21.14.2 PRODUCT PORTFOLIO
21.14.3 RECENT DEVELOPMENTS
21.15 MARIANI NUT COMPANY
21.15.1 COMPANY SNAPSHOT
21.15.2 PRODUCT PORTFOLIO
21.15.3 RECENT DEVELOPMENTS
21.16 MOUNT FRANKLIN FOODS
21.16.1 COMPANY SNAPSHOT
21.16.2 PRODUCT PORTFOLIO
21.16.3 RECENT DEVELOPMENTS
21.17 NOW FOODS
21.17.1 COMPANY SNAPSHOT
21.17.2 PRODUCT PORTFOLIO
21.17.3 RECENT DEVELOPMENTS/NEWS
21.18 NUTLAND
21.18.1 COMPANY SNAPSHOT
21.18.2 PRODUCT PORTFOLIO
21.18.3 RECENT DEVELOPMENTS
21.19 NUTWORK HANDELSGESELLSCHAFT MBH
21.19.1 COMPANY SNAPSHOT
21.19.2 PRODUCT PORTFOLIO
21.19.3 RECENT DEVELOPMENTS/NEWS
21.2 POINDEXTER NUT COMPANY
21.20.1 COMPANY SNAPSHOT
21.20.2 PRODUCT PORTFOLIO
21.20.3 RECENT DEVELOPMENTS
21.21 ROYAL NUT COMPANY
21.21.1 COMPANY SNAPSHOT
21.21.2 PRODUCT PORTFOLIO
21.21.3 RECENT DEVELOPMENTS
21.22 SAHALE SNACKS
21.22.1 COMPANY SNAPSHOT
21.22.2 PRODUCT PORTFOLIO
21.22.3 RECENT DEVELOPMENTS
21.23 SANTÉ NUTS
21.23.1 COMPANY SNAPSHOT
21.23.2 PRODUCT PORTFOLIO
21.23.3 RECENT DEVELOPMENTS/NEWS
21.24 SELECT HARVESTS LIMITED
21.24.1 COMPANY SNAPSHOT
21.24.2 REVENUE ANALYSIS
21.24.3 PRODUCT PORTFOLIO
21.24.4 RECENT DEVELOPMENTS/NEWS
21.25 SETTON PISTACHIO OF TERRA BELLA, INC.
21.25.1 COMPANY SNAPSHOT
21.25.2 PRODUCT PORTFOLIO
21.25.3 RECENT DEVELOPMENTS
21.26 TERRANUT
21.26.1 COMPANY SNAPSHOT
21.26.2 PRODUCT PORTFOLIO
21.26.3 RECENT DEVELOPMENTS/NEW
21.27 TREEHOUSE CALIFORNIA ALMONDS, LLC
21.27.1 COMPANY SNAPSHOT
21.27.2 PRODUCT PORTFOLIO
21.27.3 RECENT DEVELOPMENT
21.28 THE DAILY NUT CO.
21.28.1 COMPANY SNAPSHOT
21.28.2 PRODUCT PORTFOLIO
21.28.3 RECENT DEVELOPMENTS/NEWS
21.29 WONDERFUL PISTACHIOS LLC
21.29.1 COMPANY SNAPSHOT
21.29.2 PRODUCT PORTFOLIO
21.29.3 RECENT DEVELOPMENTS/NEWS
21.3 WESTERN NUT COMPANY INC.
21.30.1 COMPANY SNAPSHOT
21.30.2 PRODUCT PORTFOLIO
21.30.3 RECENT DEVELOPMENTS/NEWS
22 QUESTIONNAIRE
23 RELATED REPORTS
Lista de Tabela
TABELA 1 QUADRO REGULAMENTAR E DIRETRIZES
TABELA 2 CUSTO DOS EQUIPAMENTOS PRINCIPAIS E DAS PLANTAS DE PROCESSAMENTO DE CASTANHA DE CAJU EM GERAL
TABELA 3 DESENVOLVIMENTOS RECENTES NO SETOR DE NOZES, DESTACANDO LANÇAMENTOS DE NOVOS PRODUTOS, INOVAÇÕES E TENDÊNCIAS
TABELA 4 CRONOGRAMAS E MARCOS NA INDÚSTRIA DE NOZES
TABELA 5 TAXAS DE TARIFAS DE IMPORTAÇÃO DE NOZES NOS 5 PRINCIPAIS MERCADOS (2024)
TABELA 6 PRODUÇÃO LOCAL V/S DEPENDÊNCIA DE IMPORTAÇÕES
TABELA 7 INCLINAÇÃO REGULAMENTAR
TABELA 8 PARCERIAS COMERCIAIS ENTRE OS PAÍSES
TABELA 9 ESTABELECIMENTOS DE ALIANÇAS
TABELA 10 ESTABELECIMENTO DE ZONAS ECONÔMICAS ESPECIAIS (ZEE) E PARQUES INDUSTRIAIS
TABELA 11 ANÁLISE COMPARATIVA DE MARCAS
TABELA 12 PRODUÇÃO
TABELA 13 CONSUMO
TABELA 14 COMPORTAMENTO DE COMPRA DO CONSUMIDOR
TABELA 15 CONJUNTOS DE DADOS DE EXPORTAÇÃO
TABELA 16 CONJUNTOS DE DADOS DE IMPORTAÇÃO
TABELA 17 COMPORTAMENTO DE COMPRA DO CONSUMIDOR
TABELA 18 MERCADO GLOBAL DE NOZES, POR TIPO DE PRODUTO, 2018-2032 (MIL USD)
TABELA 19 MERCADO GLOBAL DE NOZES, POR TIPO DE PRODUTO, 2018-2032 (MIL TONELADAS)
TABELA 20 NOZES NO MERCADO GLOBAL DE NOZES, POR REGIÃO, 2018-2032 (MIL USD)
TABELA 21 NOZES NO MERCADO GLOBAL DE NOZES, POR TIPO, 2018-2032 (MIL USD)
TABELA 22 AMIDO NO MERCADO GLOBAL DE NOZES, POR REGIÃO, 2018-2032 (MIL USD)
TABELA 23 AMIDO NO MERCADO GLOBAL DE NOZES, POR TIPO, 2018-2032 (MIL USD)
TABELA 24 NOZES HÍBRIDAS/OUTRAS NO MERCADO GLOBAL DE NOZES, POR REGIÃO, 2018-2032 (MIL USD)
TABELA 25 NOZES HÍBRIDAS/OUTRAS NO MERCADO GLOBAL DE NOZES, POR TIPO, 2018-2032 (MIL USD)
TABELA 26 OUTROS MERCADOS GLOBAIS DE NOZES, POR REGIÃO, 2018-2032 (MIL USD)
TABELA 27 MERCADO GLOBAL DE NOZES, POR FORMA, 2018-2032 (MIL USD)
TABELA 28 MERCADO GLOBAL DE NOZES INTEIRAS, POR REGIÃO, 2018-2032 (MIL USD)
TABELA 29 MERCADO GLOBAL DE MANTEIGA EM NOZES, POR REGIÃO, 2018-2032 (MIL USD)
TABELA 30 MERCADO GLOBAL DE NOZES, POR REGIÃO, 2018-2032 (MIL USD)
TABELA 31 METADES GLOBAIS NO MERCADO DE NOZES, POR REGIÃO, 2018-2032 (MIL USD)
TABELA 32 PEÇAS GLOBAIS NO MERCADO DE NOZES, POR REGIÃO, 2018-2032 (MIL USD)
TABELA 33 MERCADO GLOBAL DE ÓLEO EM NOZES, POR REGIÃO, 2018-2032 (MIL USD)
TABELA 34 MERCADO GLOBAL DE LEITE EM CASTANHAS, POR REGIÃO, 2018-2032 (MIL USD)
TABELA 35 MERCADO GLOBAL DE PASTAS DE NOZES, POR REGIÃO, 2018-2032 (MIL USD)
TABELA 36 MERCADO GLOBAL DE CREME DE CASTANHAS, POR REGIÃO, 2018-2032 (MIL USD)
TABELA 37 MERCADO GLOBAL DE PEDAÇOS TORRADOS DE NOZES, POR REGIÃO, 2018-2032 (MIL USD)
TABELA 38 MERCADO GLOBAL DE NOZES REVESTIDAS, POR REGIÃO, 2018-2032 (MIL USD)
TABELA 39 MERCADO GLOBAL DE FARINHA DE NOZES, POR REGIÃO, 2018-2032 (MIL USD)
TABELA 40 MERCADO GLOBAL DE PÓ PARA CASTANHAS, POR REGIÃO, 2018-2032 (MIL USD)
TABELA 41 MERCADO GLOBAL DE NOZES PICADAS, POR REGIÃO, 2018-2032 (MIL USD)
TABELA 42 MERCADO GLOBAL DE NOZES FATIADAS, POR REGIÃO, 2018-2032 (MIL USD)
TABELA 43 MERCADO GLOBAL DE NOZES EM CUBOS, POR REGIÃO, 2018-2032 (MIL USD)
TABELA 44 MERCADO GLOBAL DE NOZES BRILHADAS, POR REGIÃO, 2018-2032 (MIL USD)
TABELA 45 MERCADO GLOBAL DE NOZES INTEIRAS BRANQUEADAS, POR REGIÃO, 2018-2032 (MIL USD)
TABELA 46 MERCADO GLOBAL DE NOZES CONGELADAS, POR REGIÃO, 2018-2032 (MIL USD)
TABELA 47 MERCADO GLOBAL DE NOZES SECAS POR ASPERSÃO, POR REGIÃO, 2018-2032 (MIL USD)
TABELA 48 MERCADO GLOBAL DE NOZES ENCAPSULADAS, POR REGIÃO, 2018-2032 (MIL USD)
TABELA 49 OUTROS MERCADOS GLOBAIS DE NOZES, POR REGIÃO, 2018-2032 (MIL USD)
TABELA 50 MERCADO GLOBAL DE NOZES, POR NATUREZA, 2018-2032 (MIL USD)
TABELA 51 MERCADO GLOBAL DE NOZES CONVENCIONAIS, POR REGIÃO, 2018-2032 (MIL USD)
TABELA 52 MERCADO GLOBAL DE NOZES ORGÂNICAS, POR REGIÃO, 2018-2032 (MIL USD)
TABELA 53 MERCADO GLOBAL DE NOZES, POR MÉTODO DE PROCESSAMENTO, 2018-2032 (MIL USD)
TABELA 54 MERCADO GLOBAL DE NOZES EM MATÉRIA-PRIMA, POR REGIÃO, 2018-2032 (MIL USD)
TABELA 55 MERCADO GLOBAL DE NOZES TORRADAS, POR REGIÃO, 2018-2032 (MIL USD)
TABELA 56 MERCADO GLOBAL DE NOZES TORRADAS, POR TIPO, 2018-2032 (MIL USD)
TABELA 57 MERCADO GLOBAL DE NOZES SALGADAS, POR REGIÃO, 2018-2032 (MIL USD)
TABELA 58 MERCADO GLOBAL DE NOZES BRANCADAS, POR REGIÃO, 2018-2032 (MIL USD)
TABELA 59 MERCADO GLOBAL DE NOZES COM SABOR, POR REGIÃO, 2018-2032 (MIL USD)
TABELA 60 MERCADO GLOBAL DE NOZES COM SABOR, POR TIPO, 2018-2032 (MIL USD)
TABELA 61 MERCADO GLOBAL DE NOZES SEM SAL, POR REGIÃO, 2018-2032 (MIL USD)
TABELA 62 MERCADO GLOBAL DE NOZES GLACEADAS, POR REGIÃO, 2018-2032 (MIL USD)
TABELA 63 MERCADO GLOBAL DE NOZES CRISTALIZADAS, POR REGIÃO, 2018-2032 (MIL USD)
TABELA 64 MERCADO GLOBAL DE NOZES CARAMELIZADAS, POR REGIÃO, 2018-2032 (MIL USD)
TABELA 65 MERCADO GLOBAL DE NOZES DEFUMADAS, POR REGIÃO, 2018-2032 (MIL USD)
TABELA 66 MERCADO GLOBAL DE NOZES GROTEADAS, POR REGIÃO, 2018-2032 (MIL USD)
TABELA 67 MERCADO GLOBAL DE NOZES FERMENTADOS, POR REGIÃO, 2018-2032 (MIL USD)
TABELA 68 MERCADO GLOBAL DE NOZES LIOFILIZADAS, POR REGIÃO, 2018-2032 (MIL USD)
TABELA 69 MERCADO GLOBAL DE NOZES EM CONSERVA, POR REGIÃO, 2018-2032 (MIL USD)
TABELA 70 MERCADO GLOBAL DE NOZES FRITAS A VÁCUO, POR REGIÃO, 2018-2032 (MIL USD)
TABELA 71 MERCADO GLOBAL DE NOZES DESIDRATADAS, POR REGIÃO, 2018-2032 (MIL USD)
TABELA 72 OUTROS MERCADOS GLOBAIS DE NOZES, POR REGIÃO, 2018-2032 (MIL USD)
TABELA 73 MERCADO GLOBAL DE NOZES, POR GRAU, 2018-2032 (MIL USD)
TABELA 74 CLASSIFICAÇÃO GLOBAL A (QUALIDADE PREMIUM PARA EXPORTAÇÃO) NO MERCADO DE NOZES, POR REGIÃO, 2018-2032 (MIL USD)
TABELA 75 CLASSIFICAÇÃO GLOBAL B (USO DOMÉSTICO DE QUALIDADE MÉDIA) NO MERCADO DE NOZES, POR REGIÃO, 2018-2032 (MIL USD)
TABELA 76 CLASSIFICAÇÃO GLOBAL DE QUEBRA (USO EM PADARIA E CONFEITARIA) NO MERCADO DE NOZES, POR REGIÃO, 2018-2032 (MIL USD)
TABELA 77 MERCADO GLOBAL DE NOZES GRAU ÓLEO, POR REGIÃO, 2018-2032 (MIL USD)
TABELA 78 CLASSIFICAÇÃO INDUSTRIAL GLOBAL NO MERCADO DE NOZES, POR REGIÃO, 2018-2032 (MIL USD)
TABELA 79 GRAU GLOBAL DE REJEIÇÃO (RAÇÃO ANIMAL) NO MERCADO DE NOZES, POR REGIÃO, 2018-2032 (MIL USD)
TABELA 80 MERCADO GLOBAL DE NOZES, POR VALIDADE, 2018-2032 (MIL USD)
TABELA 81 MERCADO GLOBAL DE NOZES POR <6 MESES, POR REGIÃO, 2018-2032 (MIL USD)
TABELA 82 MERCADO GLOBAL DE NOZES DE 6 A 12 MESES, POR REGIÃO, 2018-2032 (MIL USD)
TABELA 83 MERCADO GLOBAL DE NOZES, 13 A 18 MESES, POR REGIÃO, 2018-2032 (MIL USD)
TABELA 84 MERCADO GLOBAL DE NOZES EM 18 MESES, POR REGIÃO, 2018-2032 (MIL USD)
TABELA 85 MERCADO GLOBAL DE NOZES COM MAIS DE 18 MESES DE PERMANÊNCIA, POR REGIÃO, 2018-2032 (MIL USD)
TABELA 86 MERCADO GLOBAL DE NOZES, POR CERTIFICAÇÃO, 2018-2032 (MIL USD)
TABELA 87 ISO 22000/HACCP GLOBAL NO MERCADO DE NOZES, POR REGIÃO, 2018-2032 (MIL USD)
TABELA 88 MERCADO GLOBAL DE NOZES ORGÂNICAS DO USDA, POR REGIÃO, 2018-2032 (MIL USD)
TABELA 89 MERCADO GLOBAL DE NOZES ORGÂNICAS DA UE, POR REGIÃO, 2018-2032 (MIL USD)
TABELA 90 NÃO OGM VERIFICADO NO MERCADO GLOBAL DE NOZES, POR REGIÃO, 2018-2032 (MIL USD)
TABELA 91 MERCADO GLOBAL DE NOZES CERTIFICADO COMO SEM GLÚTEN, POR REGIÃO, 2018-2032 (MIL USD)
TABELA 92 MERCADO GLOBAL DE NOZES KOSHER, POR REGIÃO, 2018-2032 (MIL USD)
TABELA 93 MERCADO GLOBAL DE HALAL EM NOZES, POR REGIÃO, 2018-2032 (MIL USD)
TABELA 94 CERTIFICAÇÃO GLOBAL DE VEGANOS NO MERCADO DE NOZES, POR REGIÃO, 2018-2032 (MIL USD)
TABELA 95 MERCADO GLOBAL DE COMÉRCIO JUSTO DE NOZES, POR REGIÃO, 2018-2032 (MIL USD)
TABELA 96 ALIANÇA GLOBAL DAS FLORESTAS TROPICAIS NO MERCADO DE NOZES, POR REGIÃO, 2018-2032 (MIL USD)
TABELA 97 CERTIFICAÇÃO GLOBAL DE CARBONO NEUTRO NO MERCADO DE NOZES, POR REGIÃO, 2018-2032 (MIL USD)
TABELA 98 OUTROS MERCADOS GLOBAIS DE NOZES, POR REGIÃO, 2018-2032 (MIL USD)
TABELA 99 MERCADO GLOBAL DE NOZES, POR EMBALAGEM, 2018-2032 (MIL USD)
TABELA 100 SACHÊS PLÁSTICOS GLOBAIS NO MERCADO DE NOZES, POR REGIÃO, 2018-2032 (MIL USD)
TABELA 101 TABELA 14 MERCADO GLOBAL DE SACOS PLÁSTICOS DE NOZES, POR TIPO, 2018-2032 (MIL USD)
TABELA 102 EMBALAGENS SELADAS A VÁCUO NO MERCADO GLOBAL DE NOZES, POR REGIÃO, 2018-2032 (MIL USD)
TABELA 103 MERCADO GLOBAL DE FRASCOS PET NO MERCADO DE NOZES, POR REGIÃO, 2018-2032 (MIL USD)
TABELA 104 MERCADO GLOBAL DE SACOLAS DE PAPEL NO MERCADO DE NOZES, POR REGIÃO, 2018-2032 (MIL USD)
TABELA 105 MERCADO GLOBAL DE LATAS COMPOSTAS NO MERCADO DE NOZES, POR REGIÃO, 2018-2032 (MIL USD)
TABELA 106 SACOS TECIDOS A GRANEL NO MERCADO GLOBAL DE NOZES, POR REGIÃO, 2018-2032 (MIL USD)
TABELA 107 MERCADO GLOBAL DE FRASCOS DE VIDRO NO MERCADO DE NOZES, POR REGIÃO, 2018-2032 (MIL USD)
TABELA 108 SACHÊS/DOSE INDIVIDUAL NO MERCADO GLOBAL DE NOZES, POR REGIÃO, 2018-2032 (MIL USD)
TABELA 109 CAIXAS DE PRESENTE GLOBAIS NO MERCADO DE NOZES, POR REGIÃO, 2018-2032 (MIL USD)
TABELA 110 MERCADO GLOBAL DE NOZES DE BASE BIOLÓGICA/COMPOSTABLE, POR REGIÃO, 2018-2032 (MIL USD)
TABELA 111 MERCADO GLOBAL DE LATAS METÁLICAS PARA NOZES, POR REGIÃO, 2018-2032 (MIL USD)
TABELA 112 ECO-TUBS RESELÁVEIS GLOBAIS NO MERCADO DE NOZES, POR REGIÃO, 2018-2032 (MIL USD)
TABELA 113 BARRAS EMBALADAS EM PAPEL ELÁSTICO NO MERCADO GLOBAL DE NOZES, POR REGIÃO, 2018-2032 (MIL USD)
TABELA 114 REFIL GLOBAL NO MERCADO DE NOZES, POR REGIÃO, 2018-2032 (MIL USD)
TABELA 115 OUTROS MERCADOS GLOBAIS DE NOZES, POR REGIÃO, 2018-2032 (MIL USD)
TABELA 116 MERCADO GLOBAL DE NOZES, POR TAMANHO DE EMBALAGEM, 2018-2032 (MIL USD)
TABELA 117 MERCADO GLOBAL DE 101G–250G DE NOZES, POR REGIÃO, 2018-2032 (MIL USD)
TABELA 118 MERCADO GLOBAL DE 251G–500G DE NOZES, POR REGIÃO, 2018-2032 (MIL USD)
TABELA 119 MERCADO GLOBAL DE 51G–100G DE NOZES, POR REGIÃO, 2018-2032 (MIL USD)
TABELA 120 MERCADO GLOBAL DE 25G–50G DE NOZES, POR REGIÃO, 2018-2032 (MIL USD)
TABELA 121 MERCADO GLOBAL DE 501G–1KG DE NOZES, POR REGIÃO, 2018-2032 (MIL USD)
TABELA 122 MERCADO GLOBAL DE 1,1 KG A 2,5 KG DE NOZES, POR REGIÃO, 2018-2032 (MIL USD)
TABELA 123 MERCADO GLOBAL DE 2,6 KG A 5 KG DE NOZES, POR REGIÃO, 2018-2032 (MIL USD)
TABELA 124 MERCADO GLOBAL DE 5,1KG A 10KG DE NOZES, POR REGIÃO, 2018-2032 (MIL USD)
TABELA 125 MERCADO GLOBAL DE 10,1KG–25KG DE NOZES, POR REGIÃO, 2018-2032 (MIL USD)
TABELA 126 MERCADO GLOBAL DE 25,1KG–50KG DE NOZES, POR REGIÃO, 2018-2032 (MIL USD)
TABELA 127 MERCADO GLOBAL DE NOZES DE 50 KG, POR REGIÃO, 2018-2032 (MIL USD)
TABELA 128 MERCADO GLOBAL DE NOZES <25G, POR REGIÃO, 2018-2032 (MIL USD)
TABELA 129 MERCADO GLOBAL DE NOZES, POR FAIXA DE PREÇO, 2018-2032 (MIL USD)
TABELA 130 ECONOMIA/ORÇAMENTO GLOBAL (US$ 1,00-6,00 POR KG) NO MERCADO DE NOZES, POR REGIÃO, 2018-2032 (MIL USD)
TABELA 131 MERCADO MÉDIO GLOBAL (US$ 6,01-12,00 POR KG) DE NOZES, POR REGIÃO, 2018-2032 (US$ MIL)
TABELA 132 PRÊMIO GLOBAL (US$ 12,01-20,00 POR KG) NO MERCADO DE NOZES, POR REGIÃO, 2018-2032 (US$ MIL)
TABELA 133 SUPERPREMIUM/GOURMET GLOBAL (ACIMA DE US$ 20,00 POR KG) NO MERCADO DE NOZES, POR REGIÃO, 2018-2032 (MIL USD)
TABELA 134 MERCADO GLOBAL DE NOZES, POR USO FINAL, 2018-2032 (MIL USD)
TABELA 135 CONSUMO DIRETO GLOBAL NO MERCADO DE NOZES, POR REGIÃO, 2018-2032 (MIL USD)
TABELA 136 MERCADO GLOBAL DE LANCHES DE NOZES, POR REGIÃO, 2018-2032 (MIL USD)
TABELA 137 MANTEIGAS E CREMES DE CASTANHAS NO MERCADO GLOBAL DE NOZES, POR REGIÃO, 2018-2032 (MIL USD)
TABELA 138 INDÚSTRIA GLOBAL DE PADARIA NO MERCADO DE NOZES, POR REGIÃO, 2018-2032 (MIL USD)
TABELA 139 INDÚSTRIA GLOBAL DE CONFEITARIA NO MERCADO DE NOZES, POR REGIÃO, 2018-2032 (MIL USD)
TABELA 140 FABRICAÇÃO GLOBAL DE CEREAIS E GRANOLA NO MERCADO DE NOZES, POR REGIÃO, 2018-2032 (MIL USD)
TABELA 141 NUTRIÇÃO FUNCIONAL GLOBAL NO MERCADO DE NOZES, POR REGIÃO, 2018-2032 (MIL USD)
TABELA 142 MERCADO GLOBAL DE NUTRIÇÃO FUNCIONAL EM NOZES, POR TIPO, 2018-2032 (MIL USD)
TABELA 143 ALTERNATIVAS GLOBAIS AO LÁCTEOS NO MERCADO DE NOZES, POR REGIÃO, 2018-2032 (MIL USD)
TABELA 144 INDÚSTRIA GLOBAL DE BEBIDAS NO MERCADO DE NOZES, POR REGIÃO, 2018-2032 (MIL USD)
TABELA 145 INDÚSTRIA GLOBAL DE BEBIDAS NO MERCADO DE NOZES, POR TIPO, 2018-2032 (MIL USD)
TABELA 146 MERCADO GLOBAL DE CARNES DE ORIGEM VEGETAL EM NOZES, POR REGIÃO, 2018-2032 (MIL USD)
TABELA 147 MERCADO GLOBAL DE NOZES CULINÁRIAS, POR REGIÃO, 2018-2032 (MIL USD)
TABELA 148 MERCADO GLOBAL DE NOZES CULINÁRIAS, POR TIPO, 2018-2032 (MIL USD)
TABELA 149 EXTRAÇÃO INDUSTRIAL DE ÓLEO NO MERCADO GLOBAL DE CASTANHAS, POR REGIÃO, 2018-2032 (MIL USD)
TABELA 150 MERCADO GLOBAL DE FARINHA E PÃES SEM GLÚTEN NO MERCADO DE NOZES, POR REGIÃO, 2018-2032 (MIL USD)
TABELA 151 PRODUTOS DE CUIDADOS PESSOAIS NO MERCADO GLOBAL DE NOZES, POR REGIÃO, 2018-2032 (MIL USD)
TABELA 152 PRODUTOS DE CUIDADOS PESSOAIS NO MERCADO GLOBAL DE NOZES, POR TIPO, 2018-2032 (MIL USD)
TABELA 153 USOS GLOBAIS DE BASE BIOLÓGICA E AGROINDUSTRIAIS NO MERCADO DE NOZES, POR REGIÃO, 2018-2032 (MIL USD)
TABELA 154 USOS GLOBAIS DE BASE BIOLÓGICA E AGROINDUSTRIAIS NO MERCADO DE NOZES, POR TIPO, 2018-2032 (MIL USD)
TABELA 155 MERCADO GLOBAL DE ADITIVOS PARA ALIMENTOS PET NO MERCADO DE NOZES, POR REGIÃO, 2018-2032 (MIL USD)
TABELA 156 MERCADO GLOBAL DE RAÇÃO ANIMAL EM NOZES, POR REGIÃO, 2018-2032 (MIL USD)
TABELA 157 MERCADO GLOBAL DE RAÇÃO ANIMAL EM NOZES, POR TIPO, 2018-2032 (MIL USD)
TABELA 158 OUTROS MERCADOS GLOBAIS DE NOZES, POR REGIÃO, 2018-2032 (MIL USD)
TABELA 159 MERCADO GLOBAL DE NOZES, POR CANAL DE DISTRIBUIÇÃO, 2018-2032 (MIL USD)
TABELA 160 MERCADO GLOBAL B2B DE NOZES, POR REGIÃO, 2018-2032 (MIL USD)
TABELA 161 MERCADO GLOBAL B2C DE NOZES, POR REGIÃO, 2018-2032 (MIL USD)
TABELA 162 MERCADO GLOBAL B2C DE NOZES, POR TIPO, 2018-2032 (MIL USD)
TABELA 163 MERCADO GLOBAL OFFLINE DE NOZES, POR TIPO, 2018-2032 (MIL USD)
TABELA 164 MERCADO GLOBAL ONLINE DE NOZES, POR TIPO, 2018-2032 (MIL USD)
TABELA 165 MERCADO GLOBAL DE NOZES, POR REGIÃO, 2018-2032, USD (MIL)
TABELA 166 MERCADO DE CASTANHAS DA AMÉRICA DO NORTE, POR PAÍS, 2018-2032 (MIL USD)
TABELA 167 MERCADO DE CASTANHAS DA AMÉRICA DO NORTE, POR TIPO DE PRODUTO, 2018-2032 (MIL USD)
TABELA 168 MERCADO DE CASTANHAS DA AMÉRICA DO NORTE, POR TIPO DE PRODUTO, 2018-2032 (MIL TONELADAS)
TABELA 169 NOZES DA AMÉRICA DO NORTE NO MERCADO DE NOZES, POR TIPO, 2018-2032 (MIL USD)
TABELA 170 AMÊNDOAS NO MERCADO DE NOZES DA AMÉRICA DO NORTE, POR AMENDOIM, 2018-2032 (MIL USD)
TABELA 171 NOZES HÍBRIDAS/OUTRAS DA AMÉRICA DO NORTE NO MERCADO DE NOZES, POR TIPO, 2018-2032 (MIL USD)
TABELA 172 MERCADO DE CASTANHAS DA AMÉRICA DO NORTE, POR FORMA, 2018-2032 (MIL USD)
TABELA 173 MERCADO DE CASTANHAS DA AMÉRICA DO NORTE, POR NATUREZA, 2018-2032 (MIL USD)
TABELA 174 MERCADO DE CASTANHAS DA AMÉRICA DO NORTE, POR MÉTODO DE PROCESSAMENTO, 2018-2032 (MIL USD)
TABELA 175 MERCADO DE NOZES TORRADAS NA AMÉRICA DO NORTE, POR TIPO, 2018-2032 (MIL USD)
TABELA 176 MERCADO DE NOZES COM SABOR DA AMÉRICA DO NORTE, POR TIPO, 2018-2032 (MIL USD)
TABELA 177 MERCADO DE CASTANHAS DA AMÉRICA DO NORTE, POR GRAU, 2018-2032 (MIL USD)
TABELA 178 MERCADO DE CASTANHAS DA AMÉRICA DO NORTE, POR VALIDADE, 2018-2032 (MIL USD)
TABELA 179 MERCADO DE CASTANHAS DA AMÉRICA DO NORTE, POR CERTIFICAÇÃO, 2018-2032 (MIL USD)
TABELA 180 MERCADO DE CASTANHAS DA AMÉRICA DO NORTE, POR EMBALAGEM, 2018-2032 (MIL USD)
TABELA 181 MERCADO DE SACOS PLÁSTICOS DA AMÉRICA DO NORTE NO MERCADO DE NOZES, POR TIPO, 2018-2032 (MIL USD)
TABELA 182 MERCADO DE CASTANHAS DA AMÉRICA DO NORTE, POR TAMANHO DA EMBALAGEM, 2018-2032 (MIL USD)
TABELA 183 MERCADO DE CASTANHAS DA AMÉRICA DO NORTE, POR FAIXA DE PREÇO, 2018-2032 (MIL USD)
TABELA 184 MERCADO DE CASTANHAS DA AMÉRICA DO NORTE, POR USO FINAL, 2018-2032 (MIL USD)
TABELA 185 MERCADO DE NUTRIÇÃO FUNCIONAL DE NOZES NA AMÉRICA DO NORTE, POR TIPO, 2018-2032 (MIL USD)
TABELA 186 INDÚSTRIA DE BEBIDAS DA AMÉRICA DO NORTE NO MERCADO DE NOZES, POR TIPO, 2018-2032 (MIL USD)
TABELA 187 MERCADO CULINÁRIO DE NOZES DA AMÉRICA DO NORTE, POR TIPO, 2018-2032 (MIL USD)
TABELA 188 PRODUTOS DE CUIDADOS PESSOAIS NO MERCADO DE NOZES DA AMÉRICA DO NORTE, POR TIPO, 2018-2032 (MIL USD)
TABELA 189 USOS DE BASE BIOLÓGICA E AGROINDUSTRIAIS NO MERCADO DE NOZES NA AMÉRICA DO NORTE, POR TIPO, 2018-2032 (MIL USD)
TABELA 190 MERCADO DE RAÇÃO ANIMAL NA AMÉRICA DO NORTE, POR TIPO, 2018-2032 (MIL USD)
TABELA 191 MERCADO DE CASTANHAS DA AMÉRICA DO NORTE, POR CANAL DE DISTRIBUIÇÃO, 2018-2032 (MIL USD)
TABELA 192 MERCADO DE NOZES B2C DA AMÉRICA DO NORTE, POR TIPO, 2018-2032 (MIL USD)
TABELA 193 AMÉRICA DO NORTE OFFLINE NO MERCADO DE NOZES, POR TIPO, 2018-2032 (MIL USD)
TABELA 194 AMÉRICA DO NORTE ONLINE NO MERCADO DE NOZES, POR TIPO, 2018-2032 (MIL USD)
TABELA 195 MERCADO DE NOZES NOS EUA, POR TIPO DE PRODUTO, 2018-2032 (MIL USD)
TABELA 196 MERCADO DE NOZES NOS EUA, POR TIPO DE PRODUTO, 2018-2032 (MIL TONELADAS)
TABELA 197 NOZES AMERICANAS NO MERCADO DE NOZES, POR TIPO, 2018-2032 (MIL USD)
TABELA 198 AMIDO-AMERICANO NO MERCADO DE NOZES, POR AMENDOIM, 2018-2032 (MIL USD)
TABELA 199 NOZES HÍBRIDAS/OUTRAS NO MERCADO DE NOZES, POR TIPO, 2018-2032 (MIL USD)
TABELA 200 MERCADO DE CASTANHAS DOS EUA, POR FORMA, 2018-2032 (MIL USD)
TABELA 201 MERCADO DE CASTANHAS NOS EUA, POR NATUREZA, 2018-2032 (MIL USD)
TABELA 202 MERCADO DE CASTANHAS NOS EUA, POR MÉTODO DE PROCESSAMENTO, 2018-2032 (MIL USD)
TABELA 203 MERCADO DE NOZES TORRADAS NOS EUA, POR TIPO, 2018-2032 (MIL USD)
TABELA 204 MERCADO DE NOZES COM SABOR NOS EUA, POR TIPO, 2018-2032 (MIL USD)
TABELA 205 MERCADO DE CASTANHAS DOS EUA, POR GRAU, 2018-2032 (MIL USD)
TABELA 206 MERCADO DE NOZES NOS EUA, POR VALIDADE, 2018-2032 (MIL USD)
TABELA 207 MERCADO DE CASTANHAS DOS EUA, POR CERTIFICAÇÃO, 2018-2032 (MIL USD)
TABELA 208 MERCADO DE NOZES NOS EUA, POR EMBALAGEM, 2018-2032 (MIL USD)
TABELA 209 SACOLAS PLÁSTICAS NO MERCADO DE NOZES NOS EUA, POR TIPO, 2018-2032 (MIL USD)
TABELA 210 MERCADO DE NOZES NOS EUA, POR TAMANHO DE EMBALAGEM, 2018-2032 (MIL USD)
TABELA 211 MERCADO DE CASTANHAS NOS EUA, POR FAIXA DE PREÇO, 2018-2032 (MIL USD)
TABELA 212 MERCADO DE CASTANHAS NOS EUA, POR USO FINAL, 2018-2032 (MIL USD)
TABELA 213 NUTRIÇÃO FUNCIONAL NO MERCADO DE NOZES NOS EUA, POR TIPO, 2018-2032 (MIL USD)
TABELA 214 INDÚSTRIA DE BEBIDAS DOS EUA NO MERCADO DE NOZES, POR TIPO, 2018-2032 (MIL USD)
TABELA 215 MERCADO DE NOZES CULINÁRIAS NOS EUA, POR TIPO, 2018-2032 (MIL USD)
TABELA 216 PRODUTOS DE CUIDADOS PESSOAIS NO MERCADO DE NOZES NOS EUA, POR TIPO, 2018-2032 (MIL USD)
TABELA 217 USOS DE BASE BIOLÓGICA E AGROINDUSTRIAIS NO MERCADO DE NOZES NOS EUA, POR TIPO, 2018-2032 (MIL USD)
TABELA 218 MERCADO DE RAÇÃO ANIMAL NOS EUA, POR TIPO, 2018-2032 (MIL USD)
TABELA 219 MERCADO DE CASTANHAS NOS EUA, POR CANAL DE DISTRIBUIÇÃO, 2018-2032 (MIL USD)
TABELA 220 MERCADO DE NOZES B2C NOS EUA, POR TIPO, 2018-2032 (MIL USD)
TABELA 221 MERCADO DE NOZES OFFLINE NOS EUA, POR TIPO, 2018-2032 (MIL USD)
TABELA 222 MERCADO DE NOZES ONLINE NOS EUA, POR TIPO, 2018-2032 (MIL USD)
TABELA 223 MERCADO DE CASTANHAS DO CANADÁ, POR TIPO DE PRODUTO, 2018-2032 (MIL USD)
TABELA 224 MERCADO DE CASTANHAS DO CANADÁ, POR TIPO DE PRODUTO, 2018-2032 (MIL TONELADAS)
TABELA 225 NOZES DO CANADÁ NO MERCADO DE NOZES, POR TIPO, 2018-2032 (MIL USD)
TABELA 226 AMIDO-DO-CANTARES NO MERCADO DE NOZES, POR AMENDOIM, 2018-2032 (MIL USD)
TABELA 227 NOZES HÍBRIDAS/OUTRAS DO CANADÁ NO MERCADO DE NOZES, POR TIPO, 2018-2032 (MIL USD)
TABELA 228 MERCADO DE CASTANHAS DO CANADÁ, POR FORMA, 2018-2032 (MIL USD)
TABELA 229 MERCADO DE CASTANHAS DO CANADÁ, POR NATUREZA, 2018-2032 (MIL USD)
TABELA 230 MERCADO DE CASTANHAS DO CANADÁ, POR MÉTODO DE PROCESSAMENTO, 2018-2032 (MIL USD)
TABELA 231 MERCADO DE NOZES TORRADAS NO CANADÁ, POR TIPO, 2018-2032 (MIL USD)
TABELA 232 MERCADO DE NOZES COM SABOR CANADÁ, POR TIPO, 2018-2032 (MIL USD)
TABELA 233 MERCADO DE CASTANHAS DO CANADÁ, POR GRAU, 2018-2032 (MIL USD)
TABELA 234 MERCADO DE CASTANHAS DO CANADÁ, POR VALIDADE, 2018-2032 (MIL USD)
TABELA 235 MERCADO DE CASTANHAS DO CANADÁ, POR CERTIFICAÇÃO, 2018-2032 (MIL USD)
TABELA 236 MERCADO DE CASTANHAS DO CANADÁ, POR EMBALAGEM, 2018-2032 (MIL USD)
TABELA 237 SACOLAS PLÁSTICAS NO MERCADO DE NOZES DO CANADÁ, POR TIPO, 2018-2032 (MIL USD)
TABELA 238 MERCADO DE CASTANHAS DO CANADÁ, POR TAMANHO DE EMBALAGEM, 2018-2032 (MIL USD)
TABELA 239 MERCADO DE CASTANHAS DO CANADÁ, POR FAIXA DE PREÇO, 2018-2032 (MIL USD)
TABELA 240 MERCADO DE CASTANHAS DO CANADÁ, POR USO FINAL, 2018-2032 (MIL USD)
TABELA 241 MERCADO DE NUTRIÇÃO FUNCIONAL DE NOZES DO CANADÁ, POR TIPO, 2018-2032 (MIL USD)
TABELA 242 INDÚSTRIA DE BEBIDAS DO CANADÁ NO MERCADO DE NOZES, POR TIPO, 2018-2032 (MIL USD)
TABELA 243 MERCADO DE NOZES CULINÁRIAS DO CANADÁ, POR TIPO, 2018-2032 (MIL USD)
TABELA 244 PRODUTOS DE CUIDADOS PESSOAIS NO MERCADO DE NOZES DO CANADÁ, POR TIPO, 2018-2032 (MIL USD)
TABELA 245 USOS DE BASE BIOLÓGICA E AGROINDUSTRIAIS NO MERCADO DE NOZES NO CANADÁ, POR TIPO, 2018-2032 (MIL USD)
TABELA 246 MERCADO DE RAÇÃO ANIMAL NO CANADÁ, POR TIPO, 2018-2032 (MIL USD)
TABELA 247 MERCADO DE CASTANHAS DO CANADÁ, POR CANAL DE DISTRIBUIÇÃO, 2018-2032 (MIL USD)
TABELA 248 CANADÁ B2C NO MERCADO DE NOZES, POR TIPO, 2018-2032 (MIL USD)
TABELA 249 CANADÁ OFFLINE NO MERCADO DE NOZES, POR TIPO, 2018-2032 (MIL USD)
TABELA 250 CANADÁ ONLINE NO MERCADO DE NOZES, POR TIPO, 2018-2032 (MIL USD)
TABELA 251 MERCADO DE CASTANHA DO MÉXICO, POR TIPO DE PRODUTO, 2018-2032 (MIL USD)
TABELA 252 MERCADO DE CASTANHA DO MÉXICO, POR TIPO DE PRODUTO, 2018-2032 (MIL TONELADAS)
TABELA 253 NOZES DO MÉXICO NO MERCADO DE NOZES, POR TIPO, 2018-2032 (MIL USD)
TABELA 254 AMIDO DO MÉXICO NO MERCADO DE NOZES, POR AMENDOIM, 2018-2032 (MIL USD)
TABELA 255 MÉXICO HÍBRIDO/OUTRAS NOZES NO MERCADO DE NOZES, POR TIPO, 2018-2032 (MIL USD)
TABELA 256 MERCADO DE CASTANHA DO MÉXICO, POR FORMA, 2018-2032 (MIL USD)
TABELA 257 MERCADO DE CASTANHA DO MÉXICO, POR NATUREZA, 2018-2032 (MIL USD)
TABELA 258 MERCADO DE CASTANHA DO MÉXICO, POR MÉTODO DE PROCESSAMENTO, 2018-2032 (MIL USD)
TABELA 259 MERCADO DE NOZES TORRADAS NO MÉXICO, POR TIPO, 2018-2032 (MIL USD)
TABELA 260 MERCADO DE NOZES COM SABOR MÉXICO, POR TIPO, 2018-2032 (MIL USD)
TABELA 261 MERCADO DE CASTANHA DO MÉXICO, POR GRAU, 2018-2032 (MIL USD)
TABELA 262 MERCADO DE CASTANHA DO MÉXICO, POR VALIDADE, 2018-2032 (MIL USD)
TABELA 263 MERCADO DE CASTANHA DO MÉXICO, POR CERTIFICAÇÃO, 2018-2032 (MIL USD)
TABELA 264 MERCADO DE CASTANHA DO MÉXICO, POR EMBALAGEM, 2018-2032 (MIL USD)
TABELA 265 SACHÊS PLÁSTICOS NO MERCADO DE NOZES DO MÉXICO, POR TIPO, 2018-2032 (MIL USD)
TABELA 266 MERCADO DE CASTANHA DO MÉXICO, POR TAMANHO DE EMBALAGEM, 2018-2032 (MIL USD)
TABELA 267 MERCADO DE CASTANHA DO MÉXICO, POR FAIXA DE PREÇO, 2018-2032 (MIL USD)
TABELA 268 MERCADO DE CASTANHA DO MÉXICO, POR USO FINAL, 2018-2032 (MIL USD)
TABELA 269 NUTRIÇÃO FUNCIONAL NO MERCADO DE NOZES DO MÉXICO, POR TIPO, 2018-2032 (MIL USD)
TABELA 270 INDÚSTRIA DE BEBIDAS DO MÉXICO NO MERCADO DE NOZES, POR TIPO, 2018-2032 (MIL USD)
TABELA 271 MERCADO DE NOZES CULINÁRIAS DO MÉXICO, POR TIPO, 2018-2032 (MIL USD)
TABELA 272 PRODUTOS DE CUIDADOS PESSOAIS NO MERCADO DE NOZES DO MÉXICO, POR TIPO, 2018-2032 (MIL USD)
TABELA 273 USOS DE BASE BIOLÓGICA E AGROINDUSTRIAIS NO MERCADO DE NOZES NO MÉXICO, POR TIPO, 2018-2032 (MIL USD)
TABELA 274 MERCADO DE RAÇÃO ANIMAL NO MÉXICO, POR TIPO, 2018-2032 (MIL USD)
TABELA 275 MERCADO DE CASTANHA DO MÉXICO, POR CANAL DE DISTRIBUIÇÃO, 2018-2032 (MIL USD)
TABELA 276 MÉXICO B2C NO MERCADO DE NOZES, POR TIPO, 2018-2032 (MIL USD)
TABELA 277 MÉXICO OFFLINE NO MERCADO DE NOZES, POR TIPO, 2018-2032 (MIL USD)
TABELA 278 MÉXICO ONLINE NO MERCADO DE NOZES, POR TIPO, 2018-2032 (MIL USD)
TABELA 279 MERCADO DE CASTANHAS NA EUROPA, POR PAÍS, 2018-2032 (MIL USD)
TABELA 280 MERCADO EUROPEU DE NOZES, POR TIPO DE PRODUTO, 2018-2032 (MIL USD)
TABELA 281 MERCADO DE CASTANHAS NA EUROPA, POR TIPO DE PRODUTO, 2018-2032 (MIL TONELADAS)
TABELA 282 NOZES DA EUROPA NO MERCADO DE NOZES, POR TIPO, 2018-2032 (MIL USD)
TABELA 283 AMIDO-DE-CASTANHO NO MERCADO DE NOZES DA EUROPA, POR AMENDOIM, 2018-2032 (MIL USD)
TABELA 284 NOZES HÍBRIDAS/OUTRAS NA EUROPA NO MERCADO DE NOZES, POR TIPO, 2018-2032 (MIL USD)
TABELA 285 MERCADO DE CASTANHAS NA EUROPA, POR FORMA, 2018-2032 (MIL USD)
TABELA 286 MERCADO EUROPEU DE CASTANHAS, POR NATUREZA, 2018-2032 (MIL USD)
TABELA 287 MERCADO EUROPEU DE CASTANHAS, POR MÉTODO DE PROCESSAMENTO, 2018-2032 (MIL USD)
TABELA 288 MERCADO DE NOZES TORRADAS NA EUROPA, POR TIPO, 2018-2032 (MIL USD)
TABELA 289 MERCADO DE NOZES COM SABOR DA EUROPA, POR TIPO, 2018-2032 (MIL USD)
TABELA 290 MERCADO DE CASTANHAS NA EUROPA, POR GRAU, 2018-2032 (MIL USD)
TABELA 291 MERCADO DE NOZES NA EUROPA, POR VALIDADE, 2018-2032 (MIL USD)
TABELA 292 MERCADO EUROPEU DE CASTANHAS, POR CERTIFICAÇÃO, 2018-2032 (MIL USD)
TABELA 293 MERCADO EUROPEU DE NOZES, POR EMBALAGEM, 2018-2032 (MIL USD)
TABELA 294 MERCADO DE SACOS PLÁSTICOS NA EUROPA, POR TIPO, 2018-2032 (MIL USD)
TABELA 295 MERCADO EUROPEU DE NOZES, POR TAMANHO DE EMBALAGEM, 2018-2032 (MIL USD)
TABELA 296 MERCADO EUROPEU DE CASTANHAS, POR FAIXA DE PREÇO, 2018-2032 (MIL USD)
TABELA 297 MERCADO DE CASTANHAS NA EUROPA, POR USO FINAL, 2018-2032 (MIL USD)
TABELA 298 MERCADO EUROPEU DE NUTRIÇÃO FUNCIONAL NO MERCADO DE NOZES, POR TIPO, 2018-2032 (MIL USD)
TABELA 299 INDÚSTRIA DE BEBIDAS DA EUROPA NO MERCADO DE NOZES, POR TIPO, 2018-2032 (MIL USD)
TABELA 300 MERCADO CULINÁRIO DE NOZES DA EUROPA, POR TIPO, 2018-2032 (MIL USD)
TABELA 301 PRODUTOS DE CUIDADOS PESSOAIS NO MERCADO DE NOZES NA EUROPA, POR TIPO, 2018-2032 (MIL USD)
TABELA 302 USOS DE BASE BIOLÓGICA E AGROINDUSTRIAIS NO MERCADO DE NOZES NA EUROPA, POR TIPO, 2018-2032 (MIL USD)
TABELA 303 MERCADO EUROPEU DE RAÇÃO ANIMAL NO MERCADO DE NOZES, POR TIPO, 2018-2032 (MIL USD)
TABELA 304 MERCADO EUROPEU DE CASTANHAS, POR CANAL DE DISTRIBUIÇÃO, 2018-2032 (MIL USD)
TABELA 305 MERCADO DE NOZES B2C DA EUROPA, POR TIPO, 2018-2032 (MIL USD)
TABELA 306 EUROPA OFFLINE NO MERCADO DE NOZES, POR TIPO, 2018-2032 (MIL USD)
TABELA 307 EUROPA ONLINE NO MERCADO DE NOZES, POR TIPO, 2018-2032 (MIL USD)
TABELA 308 MERCADO DE CASTANHAS DA ALEMANHA, POR TIPO DE PRODUTO, 2018-2032 (MIL USD)
TABELA 309 MERCADO DE CASTANHAS DA ALEMANHA, POR TIPO DE PRODUTO, 2018-2032 (MIL TONELADAS)
TABELA 310 NOZES DA ALEMANHA NO MERCADO DE NOZES, POR TIPO, 2018-2032 (MIL USD)
TABELA 311 AMIDO-AMENDI NO MERCADO DE NOZES DA ALEMANHA, POR AMENDOIM, 2018-2032 (MIL USD)
TABELA 312 ALEMANHA HÍBRIDAS/OUTRAS NO MERCADO DE NOZES, POR TIPO, 2018-2032 (MIL USD)
TABELA 313 MERCADO DE CASTANHAS DA ALEMANHA, POR FORMA, 2018-2032 (MIL USD)
TABELA 314 MERCADO DE CASTANHAS DA ALEMANHA, POR NATUREZA, 2018-2032 (MIL USD)
TABELA 315 MERCADO DE CASTANHAS DA ALEMANHA, POR MÉTODO DE PROCESSAMENTO, 2018-2032 (MIL USD)
TABELA 316 MERCADO DE NOZES TORRADAS NA ALEMANHA, POR TIPO, 2018-2032 (MIL USD)
TABELA 317 MERCADO DE NOZES COM SABOR DA ALEMANHA, POR TIPO, 2018-2032 (MIL USD)
TABELA 318 MERCADO DE CASTANHAS DA ALEMANHA, POR GRAU, 2018-2032 (MIL USD)
TABELA 319 MERCADO DE CASTANHAS DA ALEMANHA, POR VALIDADE, 2018-2032 (MIL USD)
TABELA 320 MERCADO DE CASTANHAS DA ALEMANHA, POR CERTIFICAÇÃO, 2018-2032 (MIL USD)
TABELA 321 MERCADO DE NOZES DA ALEMANHA, POR EMBALAGEM, 2018-2032 (MIL USD)
TABELA 322 ALEMANHA EMBALAGENS PLÁSTICAS NO MERCADO DE NOZES, POR TIPO, 2018-2032 (MIL USD)
TABELA 323 MERCADO DE NOZES DA ALEMANHA, POR TAMANHO DA EMBALAGEM, 2018-2032 (MIL USD)
TABELA 324 MERCADO DE CASTANHAS DA ALEMANHA, POR FAIXA DE PREÇO, 2018-2032 (MIL USD)
TABELA 325 MERCADO DE CASTANHAS DA ALEMANHA, POR USO FINAL, 2018-2032 (MIL USD)
TABELA 326 ALEMANHA NUTRIÇÃO FUNCIONAL NO MERCADO DE NOZES, POR TIPO, 2018-2032 (MIL USD)
TABELA 327 INDÚSTRIA DE BEBIDAS DA ALEMANHA NO MERCADO DE NOZES, POR TIPO, 2018-2032 (MIL USD)
TABELA 328 MERCADO CULINÁRIO DE NOZES DA ALEMANHA, POR TIPO, 2018-2032 (MIL USD)
TABELA 329 PRODUTOS DE CUIDADOS PESSOAIS NO MERCADO DE NOZES DA ALEMANHA, POR TIPO, 2018-2032 (MIL USD)
TABELA 330 USOS DE BASE BIOLÓGICA E AGROINDUSTRIAIS NO MERCADO DE NOZES NA ALEMANHA, POR TIPO, 2018-2032 (MIL USD)
TABELA 331 MERCADO DE RAÇÃO ANIMAL NA ALEMANHA, POR TIPO, 2018-2032 (MIL USD)
TABELA 332 MERCADO DE CASTANHAS DA ALEMANHA, POR CANAL DE DISTRIBUIÇÃO, 2018-2032 (MIL USD)
TABELA 333 ALEMANHA B2C NO MERCADO DE NOZES, POR TIPO, 2018-2032 (MIL USD)
TABELA 334 ALEMANHA OFFLINE NO MERCADO DE NOZES, POR TIPO, 2018-2032 (MIL USD)
TABELA 335 ALEMANHA ONLINE NO MERCADO DE NOZES, POR TIPO, 2018-2032 (MIL USD)
TABELA 336 MERCADO DE CASTANHAS-DO-PARÁ, POR TIPO DE PRODUTO, 2018-2032 (MIL USD)
TABELA 337 MERCADO DE CASTANHAS-DE-PARA-FRANCESA, POR TIPO DE PRODUTO, 2018-2032 (MIL TONELADAS)
TABELA 338 FRANÇA NOZES NO MERCADO DE NOZES, POR TIPO, 2018-2032 (MIL USD)
TABELA 339 FRANÇA AMIDO NO MERCADO DE NOZES, POR AMENDOIM, 2018-2032 (MIL USD)
TABELA 340 FRANÇA HÍBRIDAS/OUTRAS NO MERCADO DE NOZES, POR TIPO, 2018-2032 (MIL USD)
TABELA 341 MERCADO DE CASTANHA-DO-PARÁ, POR FORMA, 2018-2032 (MIL USD)
TABELA 342 MERCADO DE CASTANHA-DO-PARÁ, POR NATUREZA, 2018-2032 (MIL USD)
TABELA 343 MERCADO DE CASTANHA-DO-PARÁ, POR MÉTODO DE PROCESSAMENTO, 2018-2032 (MIL USD)
TABELA 344 FRANÇA TORRA NO MERCADO DE NOZES, POR TIPO, 2018-2032 (USD MIL)
TABELA 345 MERCADO DE NOZES COM SABOR DA FRANÇA, POR TIPO, 2018-2032 (MIL USD)
TABELA 346 MERCADO DE CASTANHAS-DO-PARÁ, POR GRAU, 2018-2032 (MIL USD)
TABELA 347 MERCADO DE CASTANHAS-DO-PARÁ, POR VALIDADE, 2018-2032 (MIL USD)
TABELA 348 MERCADO DE CASTANHA-DO-PARÁ, POR CERTIFICAÇÃO, 2018-2032 (MIL USD)
TABELA 349 MERCADO DE CASTANHAS FRANCESAS, POR EMBALAGEM, 2018-2032 (MIL USD)
TABELA 350 SACHÊS PLÁSTICOS DA FRANÇA NO MERCADO DE NOZES, POR TIPO, 2018-2032 (MIL USD)
TABELA 351 MERCADO DE CASTANHAS FRANCESAS, POR TAMANHO DE EMBALAGEM, 2018-2032 (MIL USD)
TABELA 352 MERCADO DE CASTANHA-DO-PARÁ, POR FAIXA DE PREÇO, 2018-2032 (MIL USD)
TABELA 353 MERCADO DE CASTANHAS-DO-PARÁ, POR USO FINAL, 2018-2032 (MIL USD)
TABELA 354 FRANÇA NUTRIÇÃO FUNCIONAL NO MERCADO DE NOZES, POR TIPO, 2018-2032 (MIL USD)
TABELA 355 INDÚSTRIA DE BEBIDAS DA FRANÇA NO MERCADO DE NOZES, POR TIPO, 2018-2032 (MIL USD)
TABELA 356 MERCADO CULINÁRIO DE NOZES DA FRANÇA, POR TIPO, 2018-2032 (MIL USD)
TABELA 357 PRODUTOS DE CUIDADOS PESSOAIS NO MERCADO DE NOZES DA FRANÇA, POR TIPO, 2018-2032 (MIL USD)
TABELA 358 USOS DE BASE BIOLÓGICA E AGROINDUSTRIAIS NO MERCADO DE NOZES NA FRANÇA, POR TIPO, 2018-2032 (MIL USD)
TABELA 359 MERCADO DE RAÇÃO ANIMAL NA FRANÇA, POR TIPO, 2018-2032 (MIL USD)
TABELA 360 MERCADO DE CASTANHAS FRANCESAS, POR CANAL DE DISTRIBUIÇÃO, 2018-2032 (MIL USD)
TABELA 361 FRANÇA B2C NO MERCADO DE NOZES, POR TIPO, 2018-2032 (MIL USD)
TABELA 362 FRANÇA OFFLINE NO MERCADO DE NOZES, POR TIPO, 2018-2032 (MIL USD)
TABELA 363 FRANÇA ONLINE NO MERCADO DE NOZES, POR TIPO, 2018-2032 (MIL USD)
TABELA 364 MERCADO HOLANDÊS DE NOZES, POR TIPO DE PRODUTO, 2018-2032 (MIL USD)
TABELA 365 MERCADO HOLANDÊS DE NOZES, POR TIPO DE PRODUTO, 2018-2032 (MIL TONELADAS)
TABELA 366 NOZES HOLANDESAS NO MERCADO DE NOZES, POR TIPO, 2018-2032 (MIL USD)
TABELA 367 AMIDO-DE-CASTANHO HOLANDÊS NO MERCADO DE NOZES, POR AMENDOIM, 2018-2032 (MIL USD)
TABELA 368 NOZES HÍBRIDAS/OUTRAS DA HOLANDA NO MERCADO DE NOZES, POR TIPO, 2018-2032 (MIL USD)
TABELA 369 MERCADO HOLANDÊS DE CASTANHAS, POR FORMA, 2018-2032 (MIL USD)
TABELA 370 MERCADO HOLANDÊS DE CASTANHAS, POR NATUREZA, 2018-2032 (MIL USD)
TABELA 371 MERCADO HOLANDÊS DE CASTANHAS, POR MÉTODO DE PROCESSAMENTO, 2018-2032 (MIL USD)
TABELA 372 MERCADO DE NOZES TORRADAS NA HOLANDA, POR TIPO, 2018-2032 (MIL USD)
TABELA 373 NOZES COM SABOR HOLANDÊS NO MERCADO, POR TIPO, 2018-2032 (MIL USD)
TABELA 374 MERCADO HOLANDÊS DE NOZES, POR GRAU, 2018-2032 (MIL USD)
TABELA 375 MERCADO HOLANDÊS DE NOZES, POR VALIDADE, 2018-2032 (MIL USD)
TABELA 376 MERCADO HOLANDÊS DE CASTANHAS, POR CERTIFICAÇÃO, 2018-2032 (MIL USD)
TABELA 377 MERCADO HOLANDÊS DE NOZES, POR EMBALAGEM, 2018-2032 (MIL USD)
TABELA 378 SACOLAS PLÁSTICAS HOLANDESAS NO MERCADO DE NOZES, POR TIPO, 2018-2032 (MIL USD)
TABELA 379 MERCADO HOLANDÊS DE NOZES, POR TAMANHO DE EMBALAGEM, 2018-2032 (MIL USD)
TABELA 380 MERCADO HOLANDÊS DE NOZES, POR FAIXA DE PREÇO, 2018-2032 (MIL USD)
TABELA 381 MERCADO HOLANDÊS DE CASTANHAS, POR USO FINAL, 2018-2032 (MIL USD)
TABELA 382 MERCADO DE NUTRIÇÃO FUNCIONAL DE NOZES NA HOLANDA, POR TIPO, 2018-2032 (MIL USD)
TABELA 383 INDÚSTRIA DE BEBIDAS HOLANDESA NO MERCADO DE NOZES, POR TIPO, 2018-2032 (MIL USD)
TABELA 384 MERCADO DE NOZES CULINÁRIAS HOLANDESAS, POR TIPO, 2018-2032 (MIL USD)
TABELA 385 PRODUTOS DE CUIDADOS PESSOAIS NO MERCADO DE NOZES DA HOLANDA, POR TIPO, 2018-2032 (MIL USD)
TABELA 386 USOS DE BASE BIOLÓGICA E AGROINDUSTRIAIS NO MERCADO DE NOZES NA HOLANDA, POR TIPO, 2018-2032 (MIL USD)
TABELA 387 MERCADO HOLANDÊS DE RAÇÃO ANIMAL NO MERCADO DE NOZES, POR TIPO, 2018-2032 (MIL USD)
TABELA 388 MERCADO HOLANDÊS DE CASTANHAS, POR CANAL DE DISTRIBUIÇÃO, 2018-2032 (MIL USD)
TABELA 389 MERCADO B2C DE NOZES DA HOLANDA, POR TIPO, 2018-2032 (MIL USD)
TABELA 390 HOLANDA OFFLINE NO MERCADO DE NOZES, POR TIPO, 2018-2032 (MIL USD)
TABELA 391 HOLANDA ONLINE NO MERCADO DE NOZES, POR TIPO, 2018-2032 (MIL USD)
TABELA 392 MERCADO DE CASTANHA-DA-ESPANHA, POR TIPO DE PRODUTO, 2018-2032 (MIL USD)
TABELA 393 MERCADO DE CASTANHA-DA-ESPANHA, POR TIPO DE PRODUTO, 2018-2032 (MIL TONELADAS)
TABELA 394 CASTANHAS-DA-ESPANHA NO MERCADO DE NOZES, POR TIPO, 2018-2032 (MIL USD)
TABELA 395 AMIDO-DE-CASTANHO DA ESPANHA NO MERCADO DE CASTANHAS, POR AMENDOIM, 2018-2032 (MIL USD)
TABELA 396 NOZES HÍBRIDAS/OUTRAS NO MERCADO DE NOZES, POR TIPO, 2018-2032 (MIL USD)
TABELA 397 MERCADO DE CASTANHA DA ESPANHA, POR FORMA, 2018-2032 (MIL USD)
TABELA 398 MERCADO DE CASTANHA-DA-ESPANHA, POR NATUREZA, 2018-2032 (MIL USD)
TABELA 399 MERCADO DE CASTANHA-DA-ESPANHA, POR MÉTODO DE PROCESSAMENTO, 2018-2032 (MIL USD)
TABELA 400 ESPANHA TORRADA NO MERCADO DE NOZES, POR TIPO, 2018-2032 (MIL USD)
TABELA 401 MERCADO DE NOZES COM SABOR DA ESPANHA, POR TIPO, 2018-2032 (MIL USD)
TABELA 402 MERCADO DE CASTANHA-DA-ESPANHA, POR GRAU, 2018-2032 (MIL USD)
TABELA 403 MERCADO DE CASTANHA DA ESPANHA, POR VALIDADE, 2018-2032 (MIL USD)
TABELA 404 MERCADO DE CASTANHA DA ESPANHA, POR CERTIFICAÇÃO, 2018-2032 (MIL USD)
TABELA 405 MERCADO DE CASTANHA-DA-ESPANHA, POR EMBALAGEM, 2018-2032 (MIL USD)
TABELA 406 ESPANHA EMBALAGENS PLÁSTICAS NO MERCADO DE NOZES, POR TIPO, 2018-2032 (MIL USD)
TABELA 407 MERCADO DE CASTANHA-DA-ESPANHA, POR TAMANHO DE EMBALAGEM, 2018-2032 (MIL USD)
TABELA 408 MERCADO DE CASTANHA-DA-ESPANHA, POR FAIXA DE PREÇO, 2018-2032 (MIL USD)
TABELA 409 MERCADO DE CASTANHA DA ESPANHA, POR USO FINAL, 2018-2032 (MIL USD)
TABELA 410 NUTRIÇÃO FUNCIONAL NO MERCADO DE NOZES DA ESPANHA, POR TIPO, 2018-2032 (MIL USD)
TABELA 411 INDÚSTRIA DE BEBIDAS DA ESPANHA NO MERCADO DE NOZES, POR TIPO, 2018-2032 (MIL USD)
TABELA 412 MERCADO CULINÁRIO DE NOZES DA ESPANHA, POR TIPO, 2018-2032 (MIL USD)
TABELA 413 PRODUTOS DE CUIDADOS PESSOAIS NO MERCADO DE NOZES DA ESPANHA, POR TIPO, 2018-2032 (MIL USD)
TABELA 414 USOS DE BASE BIOLÓGICA E AGROINDUSTRIAIS NO MERCADO DE NOZES NA ESPANHA, POR TIPO, 2018-2032 (MIL USD)
TABELA 415 MERCADO ESPANHA DE RAÇÃO ANIMAL NO MERCADO DE NOZES, POR TIPO, 2018-2032 (MIL USD)
TABELA 416 MERCADO DE CASTANHA-DA-ESPANHA, POR CANAL DE DISTRIBUIÇÃO, 2018-2032 (MIL USD)
TABELA 417 ESPANHA B2C NO MERCADO DE NOZES, POR TIPO, 2018-2032 (MIL USD)
TABELA 418 ESPANHA OFFLINE NO MERCADO DE NOZES, POR TIPO, 2018-2032 (MIL USD)
TABELA 419 ESPANHA ONLINE NO MERCADO DE NOZES, POR TIPO, 2018-2032 (MIL USD)
TABELA 420 MERCADO DE NOZES DA ITÁLIA, POR TIPO DE PRODUTO, 2018-2032 (MIL USD)
TABELA 421 MERCADO DE NOZES DA ITÁLIA, POR TIPO DE PRODUTO, 2018-2032 (MIL TONELADAS)
TABELA 422 ITÁLIA NOZES NO MERCADO DE NOZES, POR TIPO, 2018-2032 (MIL USD)
TABELA 423 AMIDO-DE-CASTANHO DA ITÁLIA NO MERCADO DE NOZES, POR AMENDOIM, 2018-2032 (MIL USD)
TABELA 424 NOZES HÍBRIDAS/OUTRAS DA ITÁLIA NO MERCADO DE NOZES, POR TIPO, 2018-2032 (MIL USD)
TABELA 425 MERCADO DE NOZES DA ITÁLIA, POR FORMA, 2018-2032 (MIL USD)
TABELA 426 MERCADO DE NOZES DA ITÁLIA, POR NATUREZA, 2018-2032 (MIL USD)
TABELA 427 MERCADO DE NOZES DA ITÁLIA, POR MÉTODO DE PROCESSAMENTO, 2018-2032 (MIL USD)
TABELA 428 MERCADO DE NOZES TORRADAS NA ITÁLIA, POR TIPO, 2018-2032 (MIL USD)
TABELA 429 MERCADO DE NOZES COM SABOR DA ITÁLIA, POR TIPO, 2018-2032 (MIL USD)
TABELA 430 MERCADO DE NOZES DA ITÁLIA, POR GRAU, 2018-2032 (MIL USD)
TABELA 431 MERCADO DE NOZES DA ITÁLIA, POR VALIDADE, 2018-2032 (MIL USD)
TABELA 432 MERCADO DE CASTANHAS DA ITÁLIA, POR CERTIFICAÇÃO, 2018-2032 (MIL USD)
TABELA 433 MERCADO DE NOZES DA ITÁLIA, POR EMBALAGEM, 2018-2032 (MIL USD)
TABELA 434 ITÁLIA SACHÊS PLÁSTICOS NO MERCADO DE NOZES, POR TIPO, 2018-2032 (MIL USD)
TABELA 435 MERCADO DE NOZES DA ITÁLIA, POR TAMANHO DE EMBALAGEM, 2018-2032 (MIL USD)
TABELA 436 MERCADO DE NOZES DA ITÁLIA, POR FAIXA DE PREÇO, 2018-2032 (MIL USD)
TABELA 437 MERCADO DE NOZES DA ITÁLIA, POR USO FINAL, 2018-2032 (MIL USD)
TABELA 438 ITÁLIA NUTRIÇÃO FUNCIONAL NO MERCADO DE NOZES, POR TIPO, 2018-2032 (MIL USD)
TABELA 439 INDÚSTRIA DE BEBIDAS DA ITÁLIA NO MERCADO DE NOZES, POR TIPO, 2018-2032 (MIL USD)
TABELA 440 MERCADO CULINÁRIO DE NOZES DA ITÁLIA, POR TIPO, 2018-2032 (MIL USD)
TABELA 441 PRODUTOS DE CUIDADOS PESSOAIS NO MERCADO DE NOZES DA ITÁLIA, POR TIPO, 2018-2032 (MIL USD)
TABELA 442 USOS DE BASE BIOLÓGICA E AGROINDUSTRIAIS NO MERCADO DE NOZES NA ITÁLIA, POR TIPO, 2018-2032 (MIL USD)
TABELA 443 MERCADO DE RAÇÃO ANIMAL NA ITÁLIA, POR TIPO, 2018-2032 (MIL USD)
TABELA 444 MERCADO DE NOZES DA ITÁLIA, POR CANAL DE DISTRIBUIÇÃO, 2018-2032 (MIL USD)
TABELA 445 ITÁLIA B2C NO MERCADO DE NOZES, POR TIPO, 2018-2032 (MIL USD)
TABELA 446 ITÁLIA OFFLINE NO MERCADO DE NOZES, POR TIPO, 2018-2032 (MIL USD)
TABELA 447 ITÁLIA ONLINE NO MERCADO DE NOZES, POR TIPO, 2018-2032 (MIL USD)
TABELA 448 MERCADO DE NOZES DO REINO UNIDO, POR TIPO DE PRODUTO, 2018-2032 (MIL USD)
TABELA 449 MERCADO DE NOZES DO REINO UNIDO, POR TIPO DE PRODUTO, 2018-2032 (MIL TONELADAS)
TABELA 450 NOZES DO REINO UNIDO NO MERCADO DE NOZES, POR TIPO, 2018-2032 (MIL USD)
TABELA 451 AMIDO-DE-CASTANHO NO MERCADO DE NOZES DO REINO UNIDO, POR AMENDOIM, 2018-2032 (MIL USD)
TABELA 452 NOZES HÍBRIDAS/OUTRAS NO MERCADO DE NOZES DO REINO UNIDO, POR TIPO, 2018-2032 (MIL USD)
TABELA 453 MERCADO DE CASTANHAS DO REINO UNIDO, POR FORMA, 2018-2032 (MIL USD)
TABELA 454 MERCADO DE CASTANHAS DO REINO UNIDO, POR NATUREZA, 2018-2032 (MIL USD)
TABELA 455 MERCADO DE CASTANHAS NO REINO UNIDO, POR MÉTODO DE PROCESSAMENTO, 2018-2032 (MIL USD)
TABELA 456 MERCADO DE NOZES TORRADAS NO REINO UNIDO, POR TIPO, 2018-2032 (MIL USD)
TABELA 457 MERCADO DE NOZES COM SABOR NO REINO UNIDO, POR TIPO, 2018-2032 (MIL USD)
TABELA 458 MERCADO DE NOZES DO REINO UNIDO, POR GRAU, 2018-2032 (MIL USD)
TABELA 459 MERCADO DE NOZES DO REINO UNIDO, POR VALIDADE, 2018-2032 (MIL USD)
TABELA 460 MERCADO DE CASTANHAS DO REINO UNIDO, POR CERTIFICAÇÃO, 2018-2032 (MIL USD)
TABELA 461 MERCADO DE NOZES DO REINO UNIDO, POR EMBALAGEM, 2018-2032 (MIL USD)
TABELA 462 SACOLAS PLÁSTICAS NO MERCADO DE NOZES DO REINO UNIDO, POR TIPO, 2018-2032 (MIL USD)
TABELA 463 MERCADO DE NOZES DO REINO UNIDO, POR TAMANHO DE EMBALAGEM, 2018-2032 (MIL USD)
TABELA 464 MERCADO DE CASTANHAS DO REINO UNIDO, POR FAIXA DE PREÇO, 2018-2032 (MIL USD)
TABELA 465 MERCADO DE CASTANHAS NO REINO UNIDO, POR USO FINAL, 2018-2032 (MIL USD)
TABELA 466 NUTRIÇÃO FUNCIONAL NO MERCADO DE NOZES DO REINO UNIDO, POR TIPO, 2018-2032 (MIL USD)
TABELA 467 INDÚSTRIA DE BEBIDAS DO REINO UNIDO NO MERCADO DE NOZES, POR TIPO, 2018-2032 (MIL USD)
TABELA 468 MERCADO DE NOZES CULINÁRIAS DO REINO UNIDO, POR TIPO, 2018-2032 (MIL USD)
TABELA 469 PRODUTOS DE CUIDADOS PESSOAIS NO MERCADO DE NOZES DO REINO UNIDO, POR TIPO, 2018-2032 (MIL USD)
TABELA 470 USOS DE BASE BIOLÓGICA E AGROINDUSTRIAIS NO MERCADO DE NOZES NO REINO UNIDO, POR TIPO, 2018-2032 (MIL USD)
TABELA 471 MERCADO DE RAÇÃO ANIMAL NO REINO UNIDO, POR TIPO, 2018-2032 (MIL USD)
TABELA 472 MERCADO DE CASTANHAS DO REINO UNIDO, POR CANAL DE DISTRIBUIÇÃO, 2018-2032 (MIL USD)
TABELA 473 MERCADO DE NOZES B2C DO REINO UNIDO, POR TIPO, 2018-2032 (MIL USD)
TABELA 474 REINO UNIDO OFFLINE NO MERCADO DE NOZES, POR TIPO, 2018-2032 (MIL USD)
TABELA 475 REINO UNIDO ONLINE NO MERCADO DE NOZES, POR TIPO, 2018-2032 (MIL USD)
TABELA 476 MERCADO DE CASTANHAS DA POLÔNIA, POR TIPO DE PRODUTO, 2018-2032 (MIL USD)
TABELA 477 MERCADO DE CASTANHAS DA POLÔNIA, POR TIPO DE PRODUTO, 2018-2032 (MIL TONELADAS)
TABELA 478 NOZES DA POLÔNIA NO MERCADO DE NOZES, POR TIPO, 2018-2032 (MIL USD)
TABELA 479 AMIDO DA POLÔNIA NO MERCADO DE NOZES, POR AMENDOIM, 2018-2032 (MIL USD)
TABELA 480 NOZES HÍBRIDAS/OUTRAS DA POLÔNIA NO MERCADO DE NOZES, POR TIPO, 2018-2032 (MIL USD)
TABELA 481 MERCADO DE CASTANHAS DA POLÔNIA, POR FORMA, 2018-2032 (MIL USD)
TABELA 482 MERCADO DE CASTANHAS DA POLÔNIA, POR NATUREZA, 2018-2032 (MIL USD)
TABELA 483 MERCADO DE CASTANHAS DA POLÔNIA, POR MÉTODO DE PROCESSAMENTO, 2018-2032 (MIL USD)
TABELA 484 POLÔNIA TORRA NO MERCADO DE NOZES, POR TIPO, 2018-2032 (MIL USD)
TABELA 485 MERCADO DE NOZES COM SABOR DA POLÔNIA, POR TIPO, 2018-2032 (MIL USD)
TABELA 486 MERCADO DE CASTANHAS DA POLÔNIA, POR GRAU, 2018-2032 (MIL USD)
TABELA 487 MERCADO DE CASTANHAS DA POLÔNIA, POR VALIDADE, 2018-2032 (MIL USD)
TABELA 488 MERCADO DE CASTANHAS DA POLÔNIA, POR CERTIFICAÇÃO, 2018-2032 (MIL USD)
TABELA 489 MERCADO DE CASTANHAS DA POLÔNIA, POR EMBALAGEM, 2018-2032 (MIL USD)
TABELA 490 POLÔNIA EMBALAGENS PLÁSTICAS NO MERCADO DE NOZES, POR TIPO, 2018-2032 (MIL USD)
TABELA 491 MERCADO DE CASTANHAS DA POLÔNIA, POR TAMANHO DE EMBALAGEM, 2018-2032 (MIL USD)
TABELA 492 MERCADO DE CASTANHAS DA POLÔNIA, POR FAIXA DE PREÇO, 2018-2032 (MIL USD)
TABELA 493 MERCADO DE CASTANHAS DA POLÔNIA, POR USO FINAL, 2018-2032 (MIL USD)
TABELA 494 NUTRIÇÃO FUNCIONAL NO MERCADO DE NOZES DA POLÔNIA, POR TIPO, 2018-2032 (MIL USD)
TABELA 495 INDÚSTRIA DE BEBIDAS DA POLÔNIA NO MERCADO DE NOZES, POR TIPO, 2018-2032 (MIL USD)
TABELA 496 MERCADO DE NOZES CULINÁRIAS DA POLÔNIA, POR TIPO, 2018-2032 (MIL USD)
TABELA 497 PRODUTOS DE CUIDADOS PESSOAIS NO MERCADO DE NOZES DA POLÔNIA, POR TIPO, 2018-2032 (MIL USD)
TABELA 498 USOS DE BASE BIOLÓGICA E AGROINDUSTRIAIS NO MERCADO DE NOZES, POR TIPO, 2018-2032 (MIL USD)
TABELA 499 MERCADO DE RAÇÃO ANIMAL NA POLÔNIA, POR TIPO, 2018-2032 (MIL USD)
TABELA 500 MERCADO DE CASTANHAS DA POLÔNIA, POR CANAL DE DISTRIBUIÇÃO, 2018-2032 (MIL USD)
TABELA 501 POLÔNIA B2C NO MERCADO DE NOZES, POR TIPO, 2018-2032 (MIL USD)
TABELA 502 POLÔNIA OFFLINE NO MERCADO DE NOZES, POR TIPO, 2018-2032 (MIL USD)
TABELA 503 POLÔNIA ONLINE NO MERCADO DE NOZES, POR TIPO, 2018-2032 (MIL USD)
TABELA 504 MERCADO DE CASTANHAS DA RÚSSIA, POR TIPO DE PRODUTO, 2018-2032 (MIL USD)
TABELA 505 MERCADO DE CASTANHAS DA RÚSSIA, POR TIPO DE PRODUTO, 2018-2032 (MIL TONELADAS)
TABELA 506 NOZES DA RÚSSIA NO MERCADO DE NOZES, POR TIPO, 2018-2032 (MIL USD)
TABELA 507 AMIDO-DE-CASTANHO DA RÚSSIA NO MERCADO DE NOZES, POR AMENDOIM, 2018-2032 (MIL USD)
TABELA 508 NOZES HÍBRIDAS/OUTRAS DA RÚSSIA NO MERCADO DE NOZES, POR TIPO, 2018-2032 (MIL USD)
TABELA 509 MERCADO DE CASTANHAS DA RÚSSIA, POR FORMA, 2018-2032 (MIL USD)
TABELA 510 MERCADO DE CASTANHAS DA RÚSSIA, POR NATUREZA, 2018-2032 (MIL USD)
TABELA 511 MERCADO DE CASTANHAS DA RÚSSIA, POR MÉTODO DE PROCESSAMENTO, 2018-2032 (MIL USD)
TABELA 512 RÚSSIA TORRADA NO MERCADO DE NOZES, POR TIPO, 2018-2032 (MIL USD)
TABELA 513 NOZES COM SABOR DA RÚSSIA NO MERCADO, POR TIPO, 2018-2032 (MIL USD)
TABELA 514 MERCADO DE CASTANHAS DA RÚSSIA, POR GRAU, 2018-2032 (MIL USD)
TABELA 515 MERCADO DE CASTANHAS DA RÚSSIA, POR VALIDADE, 2018-2032 (MIL USD)
TABELA 516 MERCADO DE CASTANHAS DA RÚSSIA, POR CERTIFICAÇÃO, 2018-2032 (MIL USD)
TABELA 517 MERCADO DE CASTANHAS DA RÚSSIA, POR EMBALAGEM, 2018-2032 (MIL USD)
TABELA 518 SACHÊS PLÁSTICOS DA RÚSSIA NO MERCADO DE NOZES, POR TIPO, 2018-2032 (MIL USD)
TABELA 519 MERCADO DE CASTANHAS DA RÚSSIA, POR TAMANHO DE EMBALAGEM, 2018-2032 (MIL USD)
TABELA 520 MERCADO DE CASTANHAS DA RÚSSIA, POR FAIXA DE PREÇO, 2018-2032 (MIL USD)
TABELA 521 MERCADO DE CASTANHAS DA RÚSSIA, POR USO FINAL, 2018-2032 (MIL USD)
TABELA 522 NUTRIÇÃO FUNCIONAL NO MERCADO DE NOZES DA RÚSSIA, POR TIPO, 2018-2032 (MIL USD)
TABELA 523 INDÚSTRIA DE BEBIDAS DA RÚSSIA NO MERCADO DE NOZES, POR TIPO, 2018-2032 (MIL USD)
TABELA 524 MERCADO CULINÁRIO DE NOZES DA RÚSSIA, POR TIPO, 2018-2032 (MIL USD)
TABELA 525 PRODUTOS DE CUIDADOS PESSOAIS NO MERCADO DE NOZES DA RÚSSIA, POR TIPO, 2018-2032 (MIL USD)
TABELA 526 USOS DE BASE BIOLÓGICA E AGROINDUSTRIAIS NO MERCADO DE NOZES NA RÚSSIA, POR TIPO, 2018-2032 (MIL USD)
TABELA 527 MERCADO DE RAÇÃO ANIMAL NA RÚSSIA PARA NOZES, POR TIPO, 2018-2032 (MIL USD)
TABELA 528 MERCADO DE CASTANHAS DA RÚSSIA, POR CANAL DE DISTRIBUIÇÃO, 2018-2032 (MIL USD)
TABELA 529 RÚSSIA B2C NO MERCADO DE NOZES, POR TIPO, 2018-2032 (MIL USD)
TABELA 530 RÚSSIA OFFLINE NO MERCADO DE NOZES, POR TIPO, 2018-2032 (MIL USD)
TABELA 531 RÚSSIA ONLINE NO MERCADO DE NOZES, POR TIPO, 2018-2032 (MIL USD)
TABELA 532 MERCADO DE CASTANHAS BÉLGICA, POR TIPO DE PRODUTO, 2018-2032 (MIL USD)
TABELA 533 MERCADO DE CASTANHAS BÉLGICA, POR TIPO DE PRODUTO, 2018-2032 (MIL TONELADAS)
TABELA 534 NOZES BÉLGICAS NO MERCADO DE NOZES, POR TIPO, 2018-2032 (MIL USD)
TABELA 535 AMIDO BÉLGICO NO MERCADO DE NOZES, POR AMENDOIM, 2018-2032 (MIL USD)
TABELA 536 NOZES HÍBRIDAS/OUTRAS DA BÉLGICA NO MERCADO DE NOZES, POR TIPO, 2018-2032 (MIL USD)
TABELA 537 MERCADO DE CASTANHAS BÉLGICA, POR FORMA, 2018-2032 (MIL USD)
TABELA 538 MERCADO DE CASTANHAS BÉLGICA, POR NATUREZA, 2018-2032 (MIL USD)
TABELA 539 MERCADO DE CASTANHAS BÉLGICA, POR MÉTODO DE PROCESSAMENTO, 2018-2032 (MIL USD)
TABELA 540 MERCADO BÉLGICA DE NOZES TORRADAS, POR TIPO, 2018-2032 (MIL USD)
TABELA 541 MERCADO DE NOZES COM SABOR BÉLGICO, POR TIPO, 2018-2032 (MIL USD)
TABELA 542 MERCADO DE CASTANHAS BÉLGICA, POR GRAU, 2018-2032 (MIL USD)
TABELA 543 MERCADO DE CASTANHAS BÉLGICA, POR VALIDADE, 2018-2032 (MIL USD)
TABELA 544 MERCADO DE CASTANHAS BÉLGICA, POR CERTIFICAÇÃO, 2018-2032 (MIL USD)
TABELA 545 MERCADO DE CASTANHAS BÉLGICA, POR EMBALAGEM, 2018-2032 (MIL USD)
TABELA 546 BÉLGICA SACHÊS PLÁSTICOS NO MERCADO DE NOZES, POR TIPO, 2018-2032 (MIL USD)
TABELA 547 MERCADO DE NOZES BÉLGICA, POR TAMANHO DE EMBALAGEM, 2018-2032 (MIL USD)
TABELA 548 MERCADO DE CASTANHA BÉLGICA, POR FAIXA DE PREÇO, 2018-2032 (MIL USD)
TABELA 549 MERCADO DE CASTANHAS BÉLGICA, POR USO FINAL, 2018-2032 (MIL USD)
TABELA 550 BÉLGICA NUTRIÇÃO FUNCIONAL NO MERCADO DE NOZES, POR TIPO, 2018-2032 (MIL USD)
TABELA 551 INDÚSTRIA DE BEBIDAS DA BÉLGICA NO MERCADO DE NOZES, POR TIPO, 2018-2032 (MIL USD)
TABELA 552 MERCADO BÉLGICO DE NOZES CULINÁRIAS, POR TIPO, 2018-2032 (MIL USD)
TABELA 553 PRODUTOS DE CUIDADOS PESSOAIS NO MERCADO DE NOZES DA BÉLGICA, POR TIPO, 2018-2032 (MIL USD)
TABELA 554 USOS DE BASE BIOLÓGICA E AGROINDUSTRIAIS NO MERCADO DE NOZES, POR TIPO, 2018-2032 (MIL USD)
TABELA 555 MERCADO BÉLGICO DE RAÇÃO ANIMAL NO MERCADO DE NOZES, POR TIPO, 2018-2032 (MIL USD)
TABELA 556 MERCADO DE CASTANHA BÉLGICA, POR CANAL DE DISTRIBUIÇÃO, 2018-2032 (MIL USD)
TABELA 557 BÉLGICA B2C NO MERCADO DE NOZES, POR TIPO, 2018-2032 (MIL USD)
TABELA 558 BÉLGICA OFFLINE NO MERCADO DE NOZES, POR TIPO, 2018-2032 (MIL USD)
TABELA 559 BÉLGICA ONLINE NO MERCADO DE NOZES, POR TIPO, 2018-2032 (MIL USD)
TABELA 560 MERCADO DE CASTANHAS SUÍÇAS, POR TIPO DE PRODUTO, 2018-2032 (MIL USD)
TABELA 561 MERCADO DE CASTANHAS SUÍÇAS, POR TIPO DE PRODUTO, 2018-2032 (MIL TONELADAS)
TABELA 562 NOZES DA SUÍÇA NO MERCADO DE NOZES, POR TIPO, 2018-2032 (MIL USD)
TABELA 563 AMIDO-DE-CASTANHO DA SUÍÇA NO MERCADO DE NOZES, POR AMENDOIM, 2018-2032 (MIL USD)
TABELA 564 NOZES HÍBRIDAS/OUTRAS DA SUÍÇA NO MERCADO DE NOZES, POR TIPO, 2018-2032 (MIL USD)
TABELA 565 MERCADO DE CASTANHAS DA SUÍÇA, POR FORMA, 2018-2032 (MIL USD)
TABELA 566 MERCADO DE CASTANHAS DA SUÍÇA, POR NATUREZA, 2018-2032 (MIL USD)
TABELA 567 MERCADO DE CASTANHAS DA SUÍÇA, POR MÉTODO DE PROCESSAMENTO, 2018-2032 (MIL USD)
TABELA 568 MERCADO DE NOZES TORRADAS NA SUÍÇA, POR TIPO, 2018-2032 (MIL USD)
TABELA 569 MERCADO DE NOZES COM SABOR DA SUÍÇA, POR TIPO, 2018-2032 (MIL USD)
TABELA 570 MERCADO DE CASTANHAS SUÍÇAS, POR GRAU, 2018-2032 (MIL USD)
TABELA 571 MERCADO DE CASTANHAS SUÍÇAS, POR VALIDADE, 2018-2032 (MIL USD)
TABELA 572 MERCADO DE CASTANHAS SUÍÇAS, POR CERTIFICAÇÃO, 2018-2032 (MIL USD)
TABELA 573 MERCADO DE CASTANHAS SUÍÇAS, POR EMBALAGEM, 2018-2032 (MIL USD)
TABELA 574 SACHÊS PLÁSTICOS NA SUÍÇA NO MERCADO DE NOZES, POR TIPO, 2018-2032 (MIL USD)
TABELA 575 MERCADO DE CASTANHAS SUÍÇAS, POR TAMANHO DE EMBALAGEM, 2018-2032 (MIL USD)
TABELA 576 MERCADO DE CASTANHAS SUÍÇAS, POR FAIXA DE PREÇO, 2018-2032 (MIL USD)
TABELA 577 MERCADO DE CASTANHAS DA SUÍÇA, POR USO FINAL, 2018-2032 (MIL USD)
TABELA 578 MERCADO DE NUTRIÇÃO FUNCIONAL DE NOZES DA SUÍÇA, POR TIPO, 2018-2032 (MIL USD)
TABELA 579 INDÚSTRIA DE BEBIDAS DA SUÍÇA NO MERCADO DE NOZES, POR TIPO, 2018-2032 (MIL USD)
TABELA 580 MERCADO DE NOZES CULINÁRIAS DA SUÍÇA, POR TIPO, 2018-2032 (MIL USD)
TABELA 581 MERCADO DE PRODUTOS DE CUIDADOS PESSOAIS NA SUÍÇA, POR TIPO, 2018-2032 (MIL USD)
TABELA 582 USOS DE BASE BIOLÓGICA E AGROINDUSTRIAIS NO MERCADO DE NOZES NA SUÍÇA, POR TIPO, 2018-2032 (MIL USD)
TABELA 583 MERCADO DE RAÇÃO ANIMAL NA SUÍÇA, POR TIPO, 2018-2032 (MIL USD)
TABELA 584 MERCADO DE CASTANHAS DA SUÍÇA, POR CANAL DE DISTRIBUIÇÃO, 2018-2032 (MIL USD)
TABELA 585 SUÍÇA B2C NO MERCADO DE NOZES, POR TIPO, 2018-2032 (MIL USD)
TABELA 586 SUÍÇA OFFLINE NO MERCADO DE NOZES, POR TIPO, 2018-2032 (MIL USD)
TABELA 587 SUÍÇA ONLINE NO MERCADO DE NOZES, POR TIPO, 2018-2032 (MIL USD)
TABELA 588 MERCADO DE CASTANHA DE PERU, POR TIPO DE PRODUTO, 2018-2032 (MIL USD)
TABELA 589 MERCADO DE CASTANHA DE PERU, POR TIPO DE PRODUTO, 2018-2032 (MIL TONELADAS)
TABELA 590 CASTANHAS DE PERU NO MERCADO DE NOZES, POR TIPO, 2018-2032 (MIL USD)
TABELA 591 AMÊNDOAS DE PERU NO MERCADO DE NOZES, POR AMENDOIM, 2018-2032 (MIL USD)
TABELA 592 NOZES HÍBRIDAS/OUTRAS DE PERU NO MERCADO DE NOZES, POR TIPO, 2018-2032 (MIL USD)
TABELA 593 MERCADO DE CASTANHA DE PERU, POR FORMA, 2018-2032 (MIL USD)
TABELA 594 MERCADO DE CASTANHA DE PERU, POR NATUREZA, 2018-2032 (MIL USD)
TABELA 595 MERCADO DE CASTANHA DE PERU, POR MÉTODO DE PROCESSAMENTO, 2018-2032 (MIL USD)
TABELA 596 PERU ASSADO NO MERCADO DE NOZES, POR TIPO, 2018-2032 (MIL USD)
TABELA 597 MERCADO DE NOZES COM SABOR DE PERU, POR TIPO, 2018-2032 (MIL USD)
TABELA 598 MERCADO DE CASTANHA DE PERU, POR GRAU, 2018-2032 (MIL USD)
TABELA 599 MERCADO DE CASTANHA DE PERU, POR VALIDADE, 2018-2032 (MIL USD)
TABELA 600 MERCADO DE CASTANHA DE PERU, POR CERTIFICAÇÃO, 2018-2032 (MIL USD)
TABELA 601 MERCADO DE CASTANHA DE PERU, POR EMBALAGEM, 2018-2032 (MIL USD)
TABELA 602 SACHÊS PLÁSTICOS DE PERU NO MERCADO DE NOZES, POR TIPO, 2018-2032 (MIL USD)
TABELA 603 MERCADO DE CASTANHAS DE PERU, POR TAMANHO DA EMBALAGEM, 2018-2032 (MIL USD)
TABELA 604 MERCADO DE CASTANHA DE PERU, POR FAIXA DE PREÇO, 2018-2032 (MIL USD)
TABELA 605 MERCADO DE CASTANHA DE PERU, POR USO FINAL, 2018-2032 (MIL USD)
TABELA 606 NUTRIÇÃO FUNCIONAL DO PERU NO MERCADO DE NOZES, POR TIPO, 2018-2032 (MIL USD)
TABELA 607 INDÚSTRIA DE BEBIDAS DE PERU NO MERCADO DE NOZES, POR TIPO, 2018-2032 (MIL USD)
TABELA 608 MERCADO DE NOZES CULINÁRIAS DE PERU, POR TIPO, 2018-2032 (MIL USD)
TABELA 609 PRODUTOS DE CUIDADOS PESSOAIS DA TURQUIA NO MERCADO DE NOZES, POR TIPO, 2018-2032 (MIL USD)
TABELA 610 USOS DE BASE BIOLÓGICA E AGROINDUSTRIAIS DE PERU NO MERCADO DE NOZES, POR TIPO, 2018-2032 (MIL USD)
TABELA 611 RAÇÃO ANIMAL PARA PERU NO MERCADO DE NOZES, POR TIPO, 2018-2032 (MIL USD)
TABELA 612 MERCADO DE CASTANHA DE PERU, POR CANAL DE DISTRIBUIÇÃO, 2018-2032 (MIL USD)
TABELA 613 TURQUIA B2C NO MERCADO DE NOZES, POR TIPO, 2018-2032 (MIL USD)
TABELA 614 TURQUIA OFFLINE NO MERCADO DE NOZES, POR TIPO, 2018-2032 (MIL USD)
TABELA 615 TURQUIA ONLINE NO MERCADO DE NOZES, POR TIPO, 2018-2032 (MIL USD)
TABELA 616 MERCADO DE CASTANHAS DA SUÉCIA, POR TIPO DE PRODUTO, 2018-2032 (MIL USD)
TABELA 617 MERCADO DE CASTANHAS DA SUÉCIA, POR TIPO DE PRODUTO, 2018-2032 (MIL TONELADAS)
TABELA 618 NOZES DA SUÉCIA NO MERCADO DE NOZES, POR TIPO, 2018-2032 (MIL USD)
TABELA 619 AMIDO-DE-AMEIXA DA SUÉCIA NO MERCADO DE NOZES, POR AMENDOIM, 2018-2032 (MIL USD)
TABELA 620 NOZES HÍBRIDAS/OUTRAS DA SUÉCIA NO MERCADO DE NOZES, POR TIPO, 2018-2032 (MIL USD)
TABELA 621 MERCADO DE CASTANHAS DA SUÉCIA, POR FORMA, 2018-2032 (MIL USD)
TABELA 622 MERCADO DE CASTANHAS DA SUÉCIA, POR NATUREZA, 2018-2032 (MIL USD)
TABELA 623 MERCADO DE CASTANHAS DA SUÉCIA, POR MÉTODO DE PROCESSAMENTO, 2018-2032 (MIL USD)
TABELA 624 MERCADO DE NOZES TORRADAS NA SUÉCIA, POR TIPO, 2018-2032 (MIL USD)
TABELA 625 MERCADO DE NOZES COM SABOR DA SUÉCIA, POR TIPO, 2018-2032 (MIL USD)
TABELA 626 MERCADO DE CASTANHAS DA SUÉCIA, POR GRAU, 2018-2032 (MIL USD)
TABELA 627 MERCADO DE CASTANHAS DA SUÉCIA, POR VALIDADE, 2018-2032 (MIL USD)
TABELA 628 MERCADO DE CASTANHAS DA SUÉCIA, POR CERTIFICAÇÃO, 2018-2032 (MIL USD)
TABELA 629 MERCADO DE CASTANHAS DA SUÉCIA, POR EMBALAGEM, 2018-2032 (MIL USD)
TABELA 630 SACHÊS PLÁSTICOS DA SUÉCIA NO MERCADO DE NOZES, POR TIPO, 2018-2032 (MIL USD)
TABELA 631 MERCADO DE CASTANHAS DA SUÉCIA, POR TAMANHO DA EMBALAGEM, 2018-2032 (MIL USD)
TABELA 632 MERCADO DE CASTANHAS DA SUÉCIA, POR FAIXA DE PREÇO, 2018-2032 (MIL USD)
TABELA 633 MERCADO DE CASTANHAS DA SUÉCIA, POR USO FINAL, 2018-2032 (MIL USD)
TABELA 634 MERCADO DE NUTRIÇÃO FUNCIONAL DE NOZES DA SUÉCIA, POR TIPO, 2018-2032 (MIL USD)
TABELA 635 INDÚSTRIA DE BEBIDAS DA SUÉCIA NO MERCADO DE NOZES, POR TIPO, 2018-2032 (MIL USD)
TABELA 636 MERCADO DE NOZES CULINÁRIAS DA SUÉCIA, POR TIPO, 2018-2032 (MIL USD)
TABELA 637 PRODUTOS DE CUIDADOS PESSOAIS NO MERCADO DE NOZES DA SUÉCIA, POR TIPO, 2018-2032 (MIL USD)
TABELA 638 USOS DE BASE BIOLÓGICA E AGROINDUSTRIAIS NO MERCADO DE NOZES DA SUÉCIA, POR TIPO, 2018-2032 (MIL USD)
TABELA 639 MERCADO DE RAÇÃO ANIMAL NA SUÉCIA NO MERCADO DE NOZES, POR TIPO, 2018-2032 (MIL USD)
TABELA 640 MERCADO DE CASTANHAS DA SUÉCIA, POR CANAL DE DISTRIBUIÇÃO, 2018-2032 (MIL USD)
TABELA 641 SUÉCIA B2C NO MERCADO DE NOZES, POR TIPO, 2018-2032 (MIL USD)
TABELA 642 SUÉCIA OFFLINE NO MERCADO DE NOZES, POR TIPO, 2018-2032 (MIL USD)
TABELA 643 SUÉCIA ONLINE NO MERCADO DE NOZES, POR TIPO, 2018-2032 (MIL USD)
TABELA 644 MERCADO DE CASTANHAS DA NORUEGA, POR TIPO DE PRODUTO, 2018-2032 (MIL USD)
TABELA 645 MERCADO DE CASTANHAS DA NORUEGA, POR TIPO DE PRODUTO, 2018-2032 (MIL TONELADAS)
TABELA 646 NOZES DA NORUEGA NO MERCADO DE NOZES, POR TIPO, 2018-2032 (MIL USD)
TABELA 647 AMIDO-AMEndoim da Noruega no mercado de nozes, por amendoim, 2018-2032 (mil dólares americanos)
TABELA 648 NOZES HÍBRIDAS/OUTRAS DA NORUEGA NO MERCADO DE NOZES, POR TIPO, 2018-2032 (MIL USD)
TABELA 649 MERCADO DE CASTANHAS DA NORUEGA, POR FORMA, 2018-2032 (MIL USD)
TABELA 650 MERCADO DE CASTANHAS DA NORUEGA, POR NATUREZA, 2018-2032 (MIL USD)
TABELA 651 MERCADO DE CASTANHAS DA NORUEGA, POR MÉTODO DE PROCESSAMENTO, 2018-2032 (MIL USD)
TABELA 652 NORUEGA TORRADA NO MERCADO DE NOZES, POR TIPO, 2018-2032 (MIL USD)
TABELA 653 NO MERCADO DE NOZES COM SABOR DA NORUEGA, POR TIPO, 2018-2032 (MIL USD)
TABELA 654 MERCADO DE CASTANHAS DA NORUEGA, POR GRAU, 2018-2032 (MIL USD)
TABELA 655 MERCADO DE CASTANHAS DA NORUEGA, POR VALIDADE, 2018-2032 (MIL USD)
TABELA 656 MERCADO DE CASTANHAS DA NORUEGA, POR CERTIFICAÇÃO, 2018-2032 (MIL USD)
TABELA 657 MERCADO DE CASTANHAS DA NORUEGA, POR EMBALAGEM, 2018-2032 (MIL USD)
TABELA 658 SACHÊS PLÁSTICOS DA NORUEGA NO MERCADO DE NOZES, POR TIPO, 2018-2032 (MIL USD)
TABELA 659 MERCADO DE NOZES DA NORUEGA, POR TAMANHO DA EMBALAGEM, 2018-2032 (MIL USD)
TABELA 660 MERCADO DE CASTANHAS DA NORUEGA, POR FAIXA DE PREÇO, 2018-2032 (MIL USD)
TABELA 661 MERCADO DE CASTANHAS DA NORUEGA, POR USO FINAL, 2018-2032 (MIL USD)
TABELA 662 NUTRIÇÃO FUNCIONAL NO MERCADO DE NOZES DA NORUEGA, POR TIPO, 2018-2032 (MIL USD)
TABELA 663 INDÚSTRIA DE BEBIDAS DA NORUEGA NO MERCADO DE NOZES, POR TIPO, 2018-2032 (MIL USD)
TABELA 664 MERCADO CULINÁRIO DE NOZES DA NORUEGA, POR TIPO, 2018-2032 (MIL USD)
TABELA 665 PRODUTOS DE CUIDADOS PESSOAIS NO MERCADO DE NOZES DA NORUEGA, POR TIPO, 2018-2032 (MIL USD)
TABELA 666 USOS DE BASE BIOLÓGICA E AGROINDUSTRIAIS NO MERCADO DE NOZES DA NORUEGA, POR TIPO, 2018-2032 (MIL USD)
TABELA 667 MERCADO DE RAÇÃO ANIMAL DA NORUEGA NO MERCADO DE NOZES, POR TIPO, 2018-2032 (MIL USD)
TABELA 668 MERCADO DE CASTANHAS DA NORUEGA, POR CANAL DE DISTRIBUIÇÃO, 2018-2032 (MIL USD)
TABELA 669 NORUEGA B2C NO MERCADO DE NOZES, POR TIPO, 2018-2032 (MIL USD)
TABELA 670 NORUEGA OFFLINE NO MERCADO DE NOZES, POR TIPO, 2018-2032 (MIL USD)
TABELA 671 NORUEGA ONLINE NO MERCADO DE NOZES, POR TIPO, 2018-2032 (MIL USD)
TABELA 672 MERCADO DE NOZES DA DINAMARCA, POR TIPO DE PRODUTO, 2018-2032 (MIL USD)
TABELA 673 MERCADO DE NOZES DA DINAMARCA, POR TIPO DE PRODUTO, 2018-2032 (MIL TONELADAS)
TABELA 674 NOZES DA DINAMARCA NO MERCADO DE NOZES, POR TIPO, 2018-2032 (MIL USD)
TABELA 675 AMIDO-DE-CASTANHO DA DINAMARCA NO MERCADO DE NOZES, POR AMENDOIM, 2018-2032 (MIL USD)
TABELA 676 NOZES HÍBRIDAS/OUTRAS DA DINAMARCA NO MERCADO DE NOZES, POR TIPO, 2018-2032 (MIL USD)
TABELA 677 MERCADO DE NOZES DA DINAMARCA, POR FORMA, 2018-2032 (MIL USD)
TABELA 678 MERCADO DE NOZES DA DINAMARCA, POR NATUREZA, 2018-2032 (MIL USD)
TABELA 679 MERCADO DE CASTANHAS DA DINAMARCA, POR MÉTODO DE PROCESSAMENTO, 2018-2032 (MIL USD)
TABELA 680 DINAMARCA TORRADA NO MERCADO DE NOZES, POR TIPO, 2018-2032 (MIL USD)
TABELA 681 MERCADO DE NOZES COM SABOR DA DINAMARCA, POR TIPO, 2018-2032 (MIL USD)
TABELA 682 MERCADO DE NOZES DA DINAMARCA, POR GRAU, 2018-2032 (MIL USD)
TABELA 683 MERCADO DE NOZES DA DINAMARCA, POR VALIDADE, 2018-2032 (MIL USD)
TABELA 684 MERCADO DE NOZES DA DINAMARCA, POR CERTIFICAÇÃO, 2018-2032 (MIL USD)
TABELA 685 MERCADO DE NOZES DA DINAMARCA, POR EMBALAGEM, 2018-2032 (MIL USD)
TABELA 686 SACOLAS PLÁSTICAS DA DINAMARCA NO MERCADO DE NOZES, POR TIPO, 2018-2032 (MIL USD)
TABELA 687 MERCADO DE NOZES DA DINAMARCA, POR TAMANHO DA EMBALAGEM, 2018-2032 (MIL USD)
TABELA 688 MERCADO DE NOZES DA DINAMARCA, POR FAIXA DE PREÇO, 2018-2032 (MIL USD)
TABELA 689 MERCADO DE NOZES DA DINAMARCA, POR USO FINAL, 2018-2032 (MIL USD)
TABELA 690 NUTRIÇÃO FUNCIONAL NO MERCADO DE NOZES DA DINAMARCA, POR TIPO, 2018-2032 (MIL USD)
TABELA 691 INDÚSTRIA DE BEBIDAS DA DINAMARCA NO MERCADO DE NOZES, POR TIPO, 2018-2032 (MIL USD)
TABELA 692 MERCADO DE NOZES CULINÁRIAS DA DINAMARCA, POR TIPO, 2018-2032 (MIL USD)
TABELA 693 PRODUTOS DE CUIDADOS PESSOAIS NO MERCADO DE NOZES DA DINAMARCA, POR TIPO, 2018-2032 (MIL USD)
TABELA 694 USOS DE BASE BIOLÓGICA E AGROINDUSTRIAIS NO MERCADO DE NOZES DA DINAMARCA, POR TIPO, 2018-2032 (MIL USD)
TABELA 695 MERCADO DE RAÇÃO ANIMAL DA DINAMARCA NO MERCADO DE NOZES, POR TIPO, 2018-2032 (MIL USD)
TABELA 696 MERCADO DE CASTANHAS DA DINAMARCA, POR CANAL DE DISTRIBUIÇÃO, 2018-2032 (MIL USD)
TABELA 697 DINAMARCA B2C NO MERCADO DE NOZES, POR TIPO, 2018-2032 (MIL USD)
TABELA 698 DINAMARCA OFFLINE NO MERCADO DE NOZES, POR TIPO, 2018-2032 (MIL USD)
TABELA 699 DINAMARCA ONLINE NO MERCADO DE NOZES, POR TIPO, 2018-2032 (MIL USD)
TABELA 700 MERCADO DE NOZES DA FINLÂNDIA, POR TIPO DE PRODUTO, 2018-2032 (MIL USD)
TABELA 701 MERCADO DE CASTANHAS DA FINLÂNDIA, POR TIPO DE PRODUTO, 2018-2032 (MIL TONELADAS)
TABELA 702 NOZES DA FINLÂNDIA NO MERCADO DE NOZES, POR TIPO, 2018-2032 (MIL USD)
TABELA 703 AMIDO-DE-CASTANHO DA FINLÂNDIA NO MERCADO DE NOZES, POR AMENDOIM, 2018-2032 (MIL USD)
TABELA 704 NOZES HÍBRIDAS/OUTRAS DA FINLÂNDIA NO MERCADO DE NOZES, POR TIPO, 2018-2032 (MIL USD)
TABELA 705 MERCADO DE CASTANHAS DA FINLÂNDIA, POR FORMA, 2018-2032 (MIL USD)
TABELA 706 MERCADO DE CASTANHAS DA FINLÂNDIA, POR NATUREZA, 2018-2032 (MIL USD)
TABELA 707 MERCADO DE CASTANHAS DA FINLÂNDIA, POR MÉTODO DE PROCESSAMENTO, 2018-2032 (MIL USD)
TABELA 708 MERCADO DE NOZES TORRADAS NA FINLÂNDIA, POR TIPO, 2018-2032 (MIL USD)
TABELA 709 MERCADO DE NOZES COM SABOR DA FINLÂNDIA, POR TIPO, 2018-2032 (MIL USD)
TABELA 710 MERCADO DE CASTANHAS DA FINLÂNDIA, POR GRAU, 2018-2032 (MIL USD)
TABELA 711 MERCADO DE NOZES DA FINLÂNDIA, POR VALIDADE, 2018-2032 (MIL USD)
TABELA 712 MERCADO DE CASTANHAS DA FINLÂNDIA, POR CERTIFICAÇÃO, 2018-2032 (MIL USD)
TABELA 713 MERCADO DE NOZES DA FINLÂNDIA, POR EMBALAGEM, 2018-2032 (MIL USD)
TABELA 714 EMBALAGENS PLÁSTICAS DA FINLÂNDIA NO MERCADO DE NOZES, POR TIPO, 2018-2032 (MIL USD)
TABELA 715 MERCADO DE NOZES DA FINLÂNDIA, POR TAMANHO DA EMBALAGEM, 2018-2032 (MIL USD)
TABELA 716 MERCADO DE CASTANHAS DA FINLÂNDIA, POR FAIXA DE PREÇO, 2018-2032 (MIL USD)
TABELA 717 MERCADO DE CASTANHAS DA FINLÂNDIA, POR USO FINAL, 2018-2032 (MIL USD)
TABELA 718 NUTRIÇÃO FUNCIONAL NO MERCADO DE NOZES DA FINLÂNDIA, POR TIPO, 2018-2032 (MIL USD)
TABELA 719 INDÚSTRIA DE BEBIDAS DA FINLÂNDIA NO MERCADO DE NOZES, POR TIPO, 2018-2032 (MIL USD)
TABELA 720 MERCADO DE NOZES CULINÁRIAS DA FINLÂNDIA, POR TIPO, 2018-2032 (MIL USD)
TABELA 721 PRODUTOS DE CUIDADOS PESSOAIS NO MERCADO DE NOZES DA FINLÂNDIA, POR TIPO, 2018-2032 (MIL USD)
TABELA 722 USOS DE BASE BIOLÓGICA E AGROINDUSTRIAIS NO MERCADO DE NOZES NA FINLÂNDIA, POR TIPO, 2018-2032 (MIL USD)
TABELA 723 MERCADO DE RAÇÃO ANIMAL NA FINLÂNDIA NO MERCADO DE NOZES, POR TIPO, 2018-2032 (MIL USD)
TABELA 724 MERCADO DE CASTANHAS DA FINLÂNDIA, POR CANAL DE DISTRIBUIÇÃO, 2018-2032 (MIL USD)
TABELA 725 FINLÂNDIA B2C NO MERCADO DE NOZES, POR TIPO, 2018-2032 (MIL USD)
TABELA 726 FINLÂNDIA OFFLINE NO MERCADO DE NOZES, POR TIPO, 2018-2032 (MIL USD)
TABELA 727 FINLÂNDIA ONLINE NO MERCADO DE NOZES, POR TIPO, 2018-2032 (MIL USD)
TABELA 728 MERCADO DE NOZES DO RESTO DA EUROPA, POR TIPO DE PRODUTO, 2018-2032 (MIL USD)
TABELA 729 MERCADO DE NOZES DO RESTO DA EUROPA, POR TIPO DE PRODUTO, 2018-2032 (MIL TONELADAS)
TABELA 730 MERCADO DE CASTANHAS DA ÁSIA-PACÍFICO, POR PAÍS, 2018-2032 (MIL USD)
TABELA 731 MERCADO DE CASTANHAS DA ÁSIA-PACÍFICO, POR TIPO DE PRODUTO, 2018-2032 (MIL USD)
TABELA 732 MERCADO DE CASTANHAS DA ÁSIA-PACÍFICO, POR TIPO DE PRODUTO, 2018-2032 (MIL TONELADAS)
TABELA 733 NOZES DA ÁSIA-PACÍFICO NO MERCADO DE NOZES, POR TIPO, 2018-2032 (MIL USD)
TABELA 734 AMIDO-AMEndoim na região Ásia-Pacífico no mercado de nozes, por amendoim, 2018-2032 (milhares de dólares americanos)
TABELA 735 NOZES HÍBRIDAS/OUTRAS DA ÁSIA-PACÍFICO NO MERCADO DE NOZES, POR TIPO, 2018-2032 (MIL USD)
TABELA 736 MERCADO DE CASTANHAS DA ÁSIA-PACÍFICO, POR FORMA, 2018-2032 (MIL USD)
TABELA 737 MERCADO DE CASTANHAS DA ÁSIA-PACÍFICO, POR NATUREZA, 2018-2032 (MIL USD)
TABELA 738 MERCADO DE CASTANHAS DA ÁSIA-PACÍFICO, POR MÉTODO DE PROCESSAMENTO, 2018-2032 (MIL USD)
TABELA 739 MERCADO DE NOZES TORRADAS NA ÁSIA-PACÍFICO, POR TIPO, 2018-2032 (MIL USD)
TABELA 740 MERCADO DE NOZES COM SABOR DA ÁSIA-PACÍFICO, POR TIPO, 2018-2032 (MIL USD)
TABELA 741 MERCADO DE CASTANHAS DA ÁSIA-PACÍFICO, POR GRAU, 2018-2032 (MIL USD)
TABELA 742 MERCADO DE CASTANHAS DA ÁSIA-PACÍFICO, POR VALIDADE, 2018-2032 (MIL USD)
TABELA 743 MERCADO DE CASTANHAS DA ÁSIA-PACÍFICO, POR CERTIFICAÇÃO, 2018-2032 (MIL USD)
TABELA 744 MERCADO DE CASTANHAS DA ÁSIA-PACÍFICO, POR EMBALAGEM, 2018-2032 (MIL USD)
TABELA 745 SACHÊS PLÁSTICOS NO MERCADO DE NOZES DA ÁSIA-PACÍFICO, POR TIPO, 2018-2032 (MIL USD)
TABELA 746 MERCADO DE NOZES DA ÁSIA-PACÍFICO, POR TAMANHO DE EMBALAGEM, 2018-2032 (MIL USD)
TABELA 747 MERCADO DE CASTANHAS DA ÁSIA-PACÍFICO, POR FAIXA DE PREÇO, 2018-2032 (MIL USD)
TABELA 748 MERCADO DE CASTANHAS DA ÁSIA-PACÍFICO, POR USO FINAL, 2018-2032 (MIL USD)
TABELA 749 NUTRIÇÃO FUNCIONAL NO MERCADO DE NOZES DA ÁSIA-PACÍFICO, POR TIPO, 2018-2032 (MIL USD)
TABELA 750 INDÚSTRIA DE BEBIDAS DA ÁSIA-PACÍFICO NO MERCADO DE NOZES, POR TIPO, 2018-2032 (MIL USD)
TABELA 751 MERCADO DE NOZES NA ÁSIA-PACÍFICO, POR TIPO, 2018-2032 (MIL USD)
TABELA 752 PRODUTOS DE CUIDADOS PESSOAIS NO MERCADO DE NOZES DA ÁSIA-PACÍFICO, POR TIPO, 2018-2032 (MIL USD)
TABELA 753 USOS DE BASE BIOLÓGICA E AGROINDUSTRIAIS NO MERCADO DE NOZES NA ÁSIA-PACÍFICO, POR TIPO, 2018-2032 (MIL USD)
TABELA 754 MERCADO DE RAÇÃO ANIMAL NA ÁSIA-PACÍFICO, POR TIPO, 2018-2032 (MIL USD)
TABELA 755 MERCADO DE CASTANHAS DA ÁSIA-PACÍFICO, POR CANAL DE DISTRIBUIÇÃO, 2018-2032 (MIL USD)
TABELA 756 MERCADO DE NOZES B2C DA ÁSIA-PACÍFICO, POR TIPO, 2018-2032 (MIL USD)
TABELA 757 ÁSIA-PACÍFICO OFFLINE NO MERCADO DE NOZES, POR TIPO, 2018-2032 (MIL USD)
TABELA 758 ÁSIA-PACÍFICO ONLINE NO MERCADO DE NOZES, POR TIPO, 2018-2032 (MIL USD)
TABELA 759 MERCADO DE CASTANHA DA CHINA, POR TIPO DE PRODUTO, 2018-2032 (MIL USD)
TABELA 760 MERCADO DE CASTANHA DA CHINA, POR TIPO DE PRODUTO, 2018-2032 (MIL TONELADAS)
TABELA 761 CASTANHAS DA CHINA NO MERCADO DE NOZES, POR TIPO, 2018-2032 (MIL USD)
TABELA 762 AMIDO-DA-CHINA NO MERCADO DE NOZES, POR AMENDOIM, 2018-2032 (MIL USD)
TABELA 763 NOZES HÍBRIDAS/OUTRAS DA CHINA NO MERCADO DE NOZES, POR TIPO, 2018-2032 (MIL USD)
TABELA 764 MERCADO DE CASTANHA DA CHINA, POR FORMA, 2018-2032 (MIL USD)
TABELA 765 MERCADO DE CASTANHA DA CHINA, POR NATUREZA, 2018-2032 (MIL USD)
TABELA 766 MERCADO DE CASTANHA DA CHINA, POR MÉTODO DE PROCESSAMENTO, 2018-2032 (MIL USD)
TABELA 767 MERCADO DE NOZES TORRADAS DA CHINA, POR TIPO, 2018-2032 (MIL USD)
TABELA 768 MERCADO DE NOZES COM SABOR CHINÊS, POR TIPO, 2018-2032 (MIL USD)
TABELA 769 MERCADO DE CASTANHA DA CHINA, POR GRAU, 2018-2032 (MIL USD)
TABELA 770 MERCADO DE CASTANHAS DA CHINA, POR VALIDADE, 2018-2032 (MIL USD)
TABELA 771 MERCADO DE CASTANHA DA CHINA, POR CERTIFICAÇÃO, 2018-2032 (MIL USD)
TABELA 772 MERCADO DE CASTANHA DA CHINA, POR EMBALAGEM, 2018-2032 (MIL USD)
TABELA 773 - MERCADO DE SACOS PLÁSTICOS DA CHINA NO MERCADO DE NOZES, POR TIPO, 2018-2032 (MIL USD)
TABELA 774 MERCADO DE CASTANHAS DA CHINA, POR TAMANHO DE EMBALAGEM, 2018-2032 (MIL USD)
TABELA 775 MERCADO DE CASTANHA DA CHINA, POR FAIXA DE PREÇO, 2018-2032 (MIL USD)
TABELA 776 MERCADO DE CASTANHA DA CHINA, POR USO FINAL, 2018-2032 (MIL USD)
TABELA 777 NUTRIÇÃO FUNCIONAL NO MERCADO DE NOZES DA CHINA, POR TIPO, 2018-2032 (MIL USD)
TABELA 778 INDÚSTRIA DE BEBIDAS DA CHINA NO MERCADO DE NOZES, POR TIPO, 2018-2032 (MIL USD)
TABELA 779 MERCADO DE NOZES DA CULINÁRIA CHINA, POR TIPO, 2018-2032 (MIL USD)
TABELA 780 PRODUTOS DE CUIDADOS PESSOAIS NO MERCADO DE NOZES DA CHINA, POR TIPO, 2018-2032 (MIL USD)
TABELA 781 USOS DE BASE BIOLÓGICA E AGROINDUSTRIAIS NO MERCADO DE NOZES DA CHINA, POR TIPO, 2018-2032 (MIL USD)
TABELA 782 MERCADO DE RAÇÃO ANIMAL NA CHINA, POR TIPO, 2018-2032 (MIL USD)
TABELA 783 MERCADO DE CASTANHA DA CHINA, POR CANAL DE DISTRIBUIÇÃO, 2018-2032 (MIL USD)
TABELA 784 CHINA B2C NO MERCADO DE NOZES, POR TIPO, 2018-2032 (MIL USD)
TABELA 785 CHINA OFFLINE NO MERCADO DE NOZES, POR TIPO, 2018-2032 (MIL USD)
TABELA 786 CHINA ONLINE NO MERCADO DE NOZES, POR TIPO, 2018-2032 (MIL USD)
TABELA 787 MERCADO DE CASTANHA DA ÍNDIA, POR TIPO DE PRODUTO, 2018-2032 (MIL USD)
TABELA 788 MERCADO DE CASTANHA DA ÍNDIA, POR TIPO DE PRODUTO, 2018-2032 (MIL TONELADAS)
TABELA 789 NOZES DA ÍNDIA NO MERCADO DE NOZES, POR TIPO, 2018-2032 (MIL USD)
TABELA 790 AMIDO-DE-AMEIXA DA ÍNDIA NO MERCADO DE NOZES, POR AMENDOIM, 2018-2032 (MIL USD)
TABELA 791 ÍNDIA HÍBRIDAS/OUTRAS NOZES NO MERCADO DE NOZES, POR TIPO, 2018-2032 (MIL USD)
TABELA 792 MERCADO DE CASTANHA DA ÍNDIA, POR FORMA, 2018-2032 (MIL USD)
TABELA 793 MERCADO DE CASTANHA DA ÍNDIA, POR NATUREZA, 2018-2032 (MIL USD)
TABELA 794 MERCADO DE CASTANHA DA ÍNDIA, POR MÉTODO DE PROCESSAMENTO, 2018-2032 (MIL USD)
TABELA 795 MERCADO DE NOZES TORRADAS DA ÍNDIA, POR TIPO, 2018-2032 (MIL USD)
TABELA 796 MERCADO DE NOZES COM SABOR DA ÍNDIA, POR TIPO, 2018-2032 (MIL USD)
TABELA 797 MERCADO DE CASTANHA DA ÍNDIA, POR GRAU, 2018-2032 (MIL USD)
TABELA 798 MERCADO DE CASTANHA DA ÍNDIA, POR VALIDADE, 2018-2032 (MIL USD)
TABELA 799 MERCADO DE CASTANHA DA ÍNDIA, POR CERTIFICAÇÃO, 2018-2032 (MIL USD)
TABELA 800 MERCADO DE CASTANHA DA ÍNDIA, POR EMBALAGEM, 2018-2032 (MIL USD)
TABELA 801 SACOLAS PLÁSTICAS NO MERCADO DE NOZES DA ÍNDIA, POR TIPO, 2018-2032 (MIL USD)
TABELA 802 MERCADO DE CASTANHA DA ÍNDIA, POR TAMANHO DA EMBALAGEM, 2018-2032 (MIL USD)
TABELA 803 MERCADO DE CASTANHA DA ÍNDIA, POR FAIXA DE PREÇO, 2018-2032 (MIL USD)
TABELA 804 MERCADO DE CASTANHA DA ÍNDIA, POR USO FINAL, 2018-2032 (MIL USD)
TABELA 805 NUTRIÇÃO FUNCIONAL NO MERCADO DE NOZES DA ÍNDIA, POR TIPO, 2018-2032 (MIL USD)
TABELA 806 INDÚSTRIA DE BEBIDAS DA ÍNDIA NO MERCADO DE NOZES, POR TIPO, 2018-2032 (MIL USD)
TABELA 807 MERCADO DE NOZES CULINÁRIAS DA ÍNDIA, POR TIPO, 2018-2032 (MIL USD)
TABELA 808 PRODUTOS DE CUIDADOS PESSOAIS NO MERCADO DE NOZES DA ÍNDIA, POR TIPO, 2018-2032 (MIL USD)
TABELA 809 USOS DE BASE BIOLÓGICA E AGROINDUSTRIAIS NO MERCADO DE NOZES DA ÍNDIA, POR TIPO, 2018-2032 (MIL USD)
TABELA 810 MERCADO DE RAÇÃO ANIMAL NA ÍNDIA, POR TIPO, 2018-2032 (MIL USD)
TABELA 811 MERCADO DE CASTANHA DA ÍNDIA, POR CANAL DE DISTRIBUIÇÃO, 2018-2032 (MIL USD)
TABELA 812 ÍNDIA B2C NO MERCADO DE NOZES, POR TIPO, 2018-2032 (MIL USD)
TABELA 813 ÍNDIA OFFLINE NO MERCADO DE NOZES, POR TIPO, 2018-2032 (MIL USD)
TABELA 814 ÍNDIA ONLINE NO MERCADO DE NOZES, POR TIPO, 2018-2032 (MIL USD)
TABELA 815 MERCADO DE CASTANHAS DO JAPÃO, POR TIPO DE PRODUTO, 2018-2032 (MIL USD)
TABELA 816 MERCADO DE CASTANHAS DO JAPÃO, POR TIPO DE PRODUTO, 2018-2032 (MIL TONELADAS)
TABELA 817 NOZES DO JAPÃO NO MERCADO DE NOZES, POR TIPO, 2018-2032 (MIL USD)
TABELA 818 AMIDO-DO-JAPÃO NO MERCADO DE NOZES, POR AMENDOIM, 2018-2032 (MIL USD)
TABELA 819 NOZES HÍBRIDAS/OUTRAS DO JAPÃO NO MERCADO DE NOZES, POR TIPO, 2018-2032 (MIL USD)
TABELA 820 MERCADO DE CASTANHAS DO JAPÃO, POR FORMA, 2018-2032 (MIL USD)
TABELA 821 MERCADO DE CASTANHAS DO JAPÃO, POR NATUREZA, 2018-2032 (MIL USD)
TABELA 822 MERCADO DE CASTANHAS DO JAPÃO, POR MÉTODO DE PROCESSAMENTO, 2018-2032 (MIL USD)
TABELA 823 MERCADO DE NOZES TORRADAS NO JAPÃO, POR TIPO, 2018-2032 (MIL USD)
TABELA 824 MERCADO DE NOZES COM SABOR JAPÃO, POR TIPO, 2018-2032 (MIL USD)
TABELA 825 MERCADO DE CASTANHAS DO JAPÃO, POR GRAU, 2018-2032 (MIL USD)
TABELA 826 MERCADO DE CASTANHAS DO JAPÃO, POR VALIDADE, 2018-2032 (MIL USD)
TABELA 827 MERCADO DE CASTANHAS DO JAPÃO, POR CERTIFICAÇÃO, 2018-2032 (MIL USD)
TABELA 828 MERCADO DE CASTANHAS DO JAPÃO, POR EMBALAGEM, 2018-2032 (MIL USD)
TABELA 829 SACOLAS PLÁSTICAS NO MERCADO DE NOZES DO JAPÃO, POR TIPO, 2018-2032 (MIL USD)
TABELA 830 MERCADO DE NOZES DO JAPÃO, POR TAMANHO DA EMBALAGEM, 2018-2032 (MIL USD)
TABELA 831 MERCADO DE CASTANHAS DO JAPÃO, POR FAIXA DE PREÇO, 2018-2032 (MIL USD)
TABELA 832 MERCADO DE CASTANHAS DO JAPÃO, POR USO FINAL, 2018-2032 (MIL USD)
TABELA 833 NUTRIÇÃO FUNCIONAL NO MERCADO DE NOZES DO JAPÃO, POR TIPO, 2018-2032 (MIL USD)
TABELA 834 INDÚSTRIA DE BEBIDAS DO JAPÃO NO MERCADO DE NOZES, POR TIPO, 2018-2032 (MIL USD)
TABELA 835 MERCADO DE NOZES CULINÁRIAS DO JAPÃO, POR TIPO, 2018-2032 (MIL USD)
TABELA 836 PRODUTOS DE CUIDADOS PESSOAIS NO MERCADO DE NOZES DO JAPÃO, POR TIPO, 2018-2032 (MIL USD)
TABELA 837 USOS DE BASE BIOLÓGICA E AGROINDUSTRIAIS NO MERCADO DE NOZES NO JAPÃO, POR TIPO, 2018-2032 (MIL USD)
TABELA 838 MERCADO DE RAÇÃO ANIMAL NO JAPÃO, POR TIPO, 2018-2032 (MIL USD)
TABELA 839 MERCADO DE CASTANHAS DO JAPÃO, POR CANAL DE DISTRIBUIÇÃO, 2018-2032 (MIL USD)
TABELA 840 JAPÃO B2C NO MERCADO DE NOZES, POR TIPO, 2018-2032 (MIL USD)
TABELA 841 JAPÃO OFFLINE NO MERCADO DE NOZES, POR TIPO, 2018-2032 (MIL USD)
TABELA 842 JAPÃO ONLINE NO MERCADO DE NOZES, POR TIPO, 2018-2032 (MIL USD)
TABELA 843 MERCADO DE NOZES DA COREIA DO SUL, POR TIPO DE PRODUTO, 2018-2032 (MIL USD)
TABELA 844 MERCADO DE NOZES DA COREIA DO SUL, POR TIPO DE PRODUTO, 2018-2032 (MIL TONELADAS)
TABELA 845 NOZES DA COREIA DO SUL NO MERCADO DE NOZES, POR TIPO, 2018-2032 (MIL USD)
TABELA 846 AMIDO-DE-CASTANHO DA COREIA DO SUL NO MERCADO DE NOZES, POR AMENDOIM, 2018-2032 (MIL USD)
TABELA 847 COREIA DO SUL: HÍBRIDAS/OUTRAS NO MERCADO DE NOZES, POR TIPO, 2018-2032 (MIL USD)
TABELA 848 MERCADO DE CASTANHAS DA COREIA DO SUL, POR FORMA, 2018-2032 (MIL USD)
TABELA 849 MERCADO DE CASTANHAS DA COREIA DO SUL, POR NATUREZA, 2018-2032 (MIL USD)
TABELA 850 MERCADO DE CASTANHAS DA COREIA DO SUL, POR MÉTODO DE PROCESSAMENTO, 2018-2032 (MIL USD)
TABELA 851 COREIA DO SUL - MERCADO DE NOZES TORRADAS, POR TIPO, 2018-2032 (MIL USD)
TABELA 852 MERCADO DE NOZES COM SABOR DA COREIA DO SUL, POR TIPO, 2018-2032 (MIL USD)
TABELA 853 MERCADO DE NOZES DA COREIA DO SUL, POR GRAU, 2018-2032 (MIL USD)
TABELA 854 MERCADO DE NOZES DA COREIA DO SUL, POR VALIDADE, 2018-2032 (MIL USD)
TABELA 855 MERCADO DE CASTANHAS DA COREIA DO SUL, POR CERTIFICAÇÃO, 2018-2032 (MIL USD)
TABELA 856 MERCADO DE NOZES DA COREIA DO SUL, POR EMBALAGEM, 2018-2032 (MIL USD)
TABELA 857 SACOLAS PLÁSTICAS NO MERCADO DE NOZES DA COREIA DO SUL, POR TIPO, 2018-2032 (MIL USD)
TABELA 858 MERCADO DE NOZES DA COREIA DO SUL, POR TAMANHO DA EMBALAGEM, 2018-2032 (MIL USD)
TABELA 859 MERCADO DE CASTANHAS DA COREIA DO SUL, POR FAIXA DE PREÇO, 2018-2032 (MIL USD)
TABELA 860 MERCADO DE CASTANHAS DA COREIA DO SUL, POR USO FINAL, 2018-2032 (MIL USD)
TABELA 861 NUTRIÇÃO FUNCIONAL NO MERCADO DE NOZES DA COREIA DO SUL, POR TIPO, 2018-2032 (MIL USD)
TABELA 862 INDÚSTRIA DE BEBIDAS DA COREIA DO SUL NO MERCADO DE NOZES, POR TIPO, 2018-2032 (MIL USD)
TABELA 863 MERCADO DE NOZES CULINÁRIAS DA COREIA DO SUL, POR TIPO, 2018-2032 (MIL USD)
TABELA 864 PRODUTOS DE CUIDADOS PESSOAIS NO MERCADO DE NOZES DA COREIA DO SUL, POR TIPO, 2018-2032 (MIL USD)
TABELA 865 USOS DE BASE BIOLÓGICA E AGROINDUSTRIAIS NO MERCADO DE NOZES DA COREIA DO SUL, POR TIPO, 2018-2032 (MIL USD)
TABELA 866 MERCADO DE RAÇÃO ANIMAL NA COREIA DO SUL, POR TIPO, 2018-2032 (MIL USD)
TABELA 867 MERCADO DE CASTANHAS DA COREIA DO SUL, POR CANAL DE DISTRIBUIÇÃO, 2018-2032 (MIL USD)
TABELA 868 COREIA DO SUL B2C NO MERCADO DE NOZES, POR TIPO, 2018-2032 (MIL USD)
TABELA 869 COREIA DO SUL OFFLINE NO MERCADO DE NOZES, POR TIPO, 2018-2032 (MIL USD)
TABELA 870 COREIA DO SUL ONLINE NO MERCADO DE NOZES, POR TIPO, 2018-2032 (MIL USD)
TABELA 871 MERCADO DE NOZES DA AUSTRÁLIA, POR TIPO DE PRODUTO, 2018-2032 (MIL USD)
TABELA 872 MERCADO DE NOZES DA AUSTRÁLIA, POR TIPO DE PRODUTO, 2018-2032 (MIL TONELADAS)
TABELA 873 NOZES DA AUSTRÁLIA NO MERCADO DE NOZES, POR TIPO, 2018-2032 (MIL USD)
TABELA 874 AMIDO-AMEndoim na Austrália no mercado de nozes, por amendoim, 2018-2032 (milhares de dólares americanos)
TABELA 875 NOZES HÍBRIDAS/OUTRAS DA AUSTRÁLIA NO MERCADO DE NOZES, POR TIPO, 2018-2032 (MIL USD)
TABELA 876 MERCADO DE NOZES DA AUSTRÁLIA, POR FORMA, 2018-2032 (MIL USD)
TABELA 877 MERCADO DE NOZES DA AUSTRÁLIA, POR NATUREZA, 2018-2032 (MIL USD)
TABELA 878 MERCADO DE CASTANHAS DA AUSTRÁLIA, POR MÉTODO DE PROCESSAMENTO, 2018-2032 (MIL USD)
TABELA 879 MERCADO DE NOZES TORRADAS NA AUSTRÁLIA, POR TIPO, 2018-2032 (MIL USD)
TABELA 880 MERCADO DE NOZES COM SABOR AUSTRÁLIA, POR TIPO, 2018-2032 (MIL USD)
TABELA 881 MERCADO DE NOZES DA AUSTRÁLIA, POR GRAU, 2018-2032 (MIL USD)
TABELA 882 MERCADO DE NOZES DA AUSTRÁLIA, POR VALIDADE, 2018-2032 (MIL USD)
TABELA 883 MERCADO DE CASTANHAS DA AUSTRÁLIA, POR CERTIFICAÇÃO, 2018-2032 (MIL USD)
TABELA 884 MERCADO DE NOZES DA AUSTRÁLIA, POR EMBALAGEM, 2018-2032 (MIL USD)
TABELA 885 SACOLAS PLÁSTICAS NO MERCADO DE NOZES DA AUSTRÁLIA, POR TIPO, 2018-2032 (MIL USD)
TABELA 886 MERCADO DE NOZES DA AUSTRÁLIA, POR TAMANHO DE EMBALAGEM, 2018-2032 (MIL USD)
TABELA 887 MERCADO DE NOZES DA AUSTRÁLIA, POR FAIXA DE PREÇO, 2018-2032 (MIL USD)
TABELA 888 MERCADO DE NOZES DA AUSTRÁLIA, POR USO FINAL, 2018-2032 (MIL USD)
TABELA 889 NUTRIÇÃO FUNCIONAL NO MERCADO DE NOZES DA AUSTRÁLIA, POR TIPO, 2018-2032 (MIL USD)
TABELA 890 INDÚSTRIA DE BEBIDAS DA AUSTRÁLIA NO MERCADO DE NOZES, POR TIPO, 2018-2032 (MIL USD)
TABELA 891 MERCADO CULINÁRIO DE NOZES DA AUSTRÁLIA, POR TIPO, 2018-2032 (MIL USD)
TABELA 892 PRODUTOS DE CUIDADOS PESSOAIS NO MERCADO DE NOZES DA AUSTRÁLIA, POR TIPO, 2018-2032 (MIL USD)
TABELA 893 USOS DE BASE BIOLÓGICA E AGROINDUSTRIAIS NO MERCADO DE NOZES NA AUSTRÁLIA, POR TIPO, 2018-2032 (MIL USD)
TABELA 894 MERCADO DE RAÇÃO ANIMAL NA AUSTRÁLIA, POR TIPO, 2018-2032 (MIL USD)
TABELA 895 MERCADO DE CASTANHAS DA AUSTRÁLIA, POR CANAL DE DISTRIBUIÇÃO, 2018-2032 (MIL USD)
TABELA 896 AUSTRÁLIA B2C NO MERCADO DE NOZES, POR TIPO, 2018-2032 (MIL USD)
TABELA 897 AUSTRÁLIA OFFLINE NO MERCADO DE NOZES, POR TIPO, 2018-2032 (MIL USD)
TABELA 898 AUSTRÁLIA ONLINE NO MERCADO DE NOZES, POR TIPO, 2018-2032 (MIL USD)
TABELA 899 MERCADO DE NOZES DA MALÁSIA, POR TIPO DE PRODUTO, 2018-2032 (MIL USD)
TABELA 900 MERCADO DE CASTANHAS DA MALÁSIA, POR TIPO DE PRODUTO, 2018-2032 (MIL TONELADAS)
TABELA 901 NOZES DA MALÁSIA NO MERCADO DE NOZES, POR TIPO, 2018-2032 (MIL USD)
TABELA 902 AMIDO DA MALÁSIA NO MERCADO DE NOZES, POR AMENDOIM, 2018-2032 (MIL USD)
TABELA 903 NOZES HÍBRIDAS/OUTRAS DA MALÁSIA NO MERCADO DE NOZES, POR TIPO, 2018-2032 (MIL USD)
TABELA 904 MERCADO DE CASTANHAS DA MALÁSIA, POR FORMA, 2018-2032 (MIL USD)
TABELA 905 MERCADO DE CASTANHAS DA MALÁSIA, POR NATUREZA, 2018-2032 (MIL USD)
TABELA 906 MERCADO DE CASTANHAS DA MALÁSIA, POR MÉTODO DE PROCESSAMENTO, 2018-2032 (MIL USD)
TABELA 907 MERCADO DE NOZES TORRADAS NA MALÁSIA, POR TIPO, 2018-2032 (MIL USD)
TABELA 908 MERCADO DE NOZES COM SABOR DA MALÁSIA, POR TIPO, 2018-2032 (MIL USD)
TABELA 909 MERCADO DE CASTANHAS DA MALÁSIA, POR GRAU, 2018-2032 (MIL USD)
TABELA 910 MERCADO DE CASTANHAS DA MALÁSIA, POR VALIDADE, 2018-2032 (MIL USD)
TABELA 911 MERCADO DE CASTANHAS DA MALÁSIA, POR CERTIFICAÇÃO, 2018-2032 (MIL USD)
TABELA 912 MERCADO DE CASTANHAS DA MALÁSIA, POR EMBALAGEM, 2018-2032 (MIL USD)
TABELA 913 SACHÊS PLÁSTICOS DA MALÁSIA NO MERCADO DE NOZES, POR TIPO, 2018-2032 (MIL USD)
TABELA 914 MERCADO DE NOZES DA MALÁSIA, POR TAMANHO DE EMBALAGEM, 2018-2032 (MIL USD)
TABELA 915 MERCADO DE CASTANHAS DA MALÁSIA, POR FAIXA DE PREÇO, 2018-2032 (MIL USD)
TABELA 916 MERCADO DE CASTANHAS DA MALÁSIA, POR USO FINAL, 2018-2032 (MIL USD)
TABELA 917 NUTRIÇÃO FUNCIONAL NO MERCADO DE NOZES DA MALÁSIA, POR TIPO, 2018-2032 (MIL USD)
TABELA 918 INDÚSTRIA DE BEBIDAS DA MALÁSIA NO MERCADO DE NOZES, POR TIPO, 2018-2032 (MIL USD)
TABELA 919 MERCADO DE NOZES CULINÁRIAS DA MALÁSIA, POR TIPO, 2018-2032 (MIL USD)
TABELA 920 PRODUTOS DE CUIDADOS PESSOAIS NO MERCADO DE NOZES DA MALÁSIA, POR TIPO, 2018-2032 (MIL USD)
TABELA 921 USOS DE BASE BIOLÓGICA E AGROINDUSTRIAIS NO MERCADO DE NOZES DA MALÁSIA, POR TIPO, 2018-2032 (MIL USD)
TABELA 922 MERCADO DE RAÇÃO ANIMAL NA MALÁSIA, POR TIPO, 2018-2032 (MIL USD)
TABELA 923 MERCADO DE CASTANHAS DA MALÁSIA, POR CANAL DE DISTRIBUIÇÃO, 2018-2032 (MIL USD)
TABELA 924 MERCADO DE NOZES B2C DA MALÁSIA, POR TIPO, 2018-2032 (MIL USD)
TABELA 925 MALÁSIA OFFLINE NO MERCADO DE NOZES, POR TIPO, 2018-2032 (MIL USD)
TABELA 926 MALÁSIA ONLINE NO MERCADO DE NOZES, POR TIPO, 2018-2032 (MIL USD)
TABELA 927 MERCADO DE CASTANHAS DA INDONÉSIA, POR TIPO DE PRODUTO, 2018-2032 (MIL USD)
TABELA 928 MERCADO DE CASTANHAS DA INDONÉSIA, POR TIPO DE PRODUTO, 2018-2032 (MIL TONELADAS)
TABELA 929 NOZES DA INDONÉSIA NO MERCADO DE NOZES, POR TIPO, 2018-2032 (MIL USD)
TABELA 930 AMIDO DA INDONÉSIA NO MERCADO DE NOZES, POR AMENDOIM, 2018-2032 (MIL USD)
TABELA 931 NOZES HÍBRIDAS/OUTRAS DA INDONÉSIA NO MERCADO DE NOZES, POR TIPO, 2018-2032 (MIL USD)
TABELA 932 MERCADO DE CASTANHAS DA INDONÉSIA, POR FORMA, 2018-2032 (MIL USD)
TABELA 933 MERCADO DE CASTANHAS DA INDONÉSIA, POR NATUREZA, 2018-2032 (MIL USD)
TABELA 934 MERCADO DE CASTANHAS DA INDONÉSIA, POR MÉTODO DE PROCESSAMENTO, 2018-2032 (MIL USD)
TABELA 935 MERCADO DE NOZES TORRADAS NA INDONÉSIA, POR TIPO, 2018-2032 (MIL USD)
TABELA 936 MERCADO DE NOZES COM SABOR DA INDONÉSIA, POR TIPO, 2018-2032 (MIL USD)
TABELA 937 MERCADO DE CASTANHAS DA INDONÉSIA, POR GRAU, 2018-2032 (MIL USD)
TABELA 938 MERCADO DE NOZES DA INDONÉSIA, POR VALIDADE, 2018-2032 (MIL USD)
TABELA 939 MERCADO DE CASTANHAS DA INDONÉSIA, POR CERTIFICAÇÃO, 2018-2032 (MIL USD)
TABELA 940 MERCADO DE NOZES DA INDONÉSIA, POR EMBALAGEM, 2018-2032 (MIL USD)
TABELA 941 SACOLAS PLÁSTICAS NO MERCADO DE NOZES DA INDONÉSIA, POR TIPO, 2018-2032 (MIL USD)
TABELA 942 MERCADO DE NOZES DA INDONÉSIA, POR TAMANHO DA EMBALAGEM, 2018-2032 (MIL USD)
TABELA 943 MERCADO DE CASTANHAS DA INDONÉSIA, POR FAIXA DE PREÇO, 2018-2032 (MIL USD)
TABELA 944 MERCADO DE CASTANHAS DA INDONÉSIA, POR USO FINAL, 2018-2032 (MIL USD)
TABELA 945 NUTRIÇÃO FUNCIONAL NO MERCADO DE NOZES DA INDONÉSIA, POR TIPO, 2018-2032 (MIL USD)
TABELA 946 INDÚSTRIA DE BEBIDAS DA INDONÉSIA NO MERCADO DE NOZES, POR TIPO, 2018-2032 (MIL USD)
TABELA 947 MERCADO DE NOZES CULINÁRIAS DA INDONÉSIA, POR TIPO, 2018-2032 (MIL USD)
TABELA 948 PRODUTOS DE CUIDADOS PESSOAIS NO MERCADO DE NOZES DA INDONÉSIA, POR TIPO, 2018-2032 (MIL USD)
TABELA 949 USOS DE BASE BIOLÓGICA E AGROINDUSTRIAIS NO MERCADO DE NOZES NA INDONÉSIA, POR TIPO, 2018-2032 (MIL USD)
TABELA 950 MERCADO DE RAÇÃO ANIMAL NA INDONÉSIA, POR TIPO, 2018-2032 (MIL USD)
TABELA 951 MERCADO DE CASTANHAS DA INDONÉSIA, POR CANAL DE DISTRIBUIÇÃO, 2018-2032 (MIL USD)
TABELA 952 INDONÉSIA B2C NO MERCADO DE NOZES, POR TIPO, 2018-2032 (MIL USD)
TABELA 953 INDONÉSIA OFFLINE NO MERCADO DE NOZES, POR TIPO, 2018-2032 (MIL USD)
TABELA 954 INDONÉSIA ONLINE NO MERCADO DE NOZES, POR TIPO, 2018-2032 (MIL USD)
TABELA 955 MERCADO DE CASTANHAS DA TAILÂNDIA, POR TIPO DE PRODUTO, 2018-2032 (MIL USD)
TABELA 956 MERCADO DE CASTANHAS DA TAILÂNDIA, POR TIPO DE PRODUTO, 2018-2032 (MIL TONELADAS)
TABELA 957 NOZES DA TAILÂNDIA NO MERCADO DE NOZES, POR TIPO, 2018-2032 (MIL USD)
TABELA 958 AMIDO DA TAILÂNDIA NO MERCADO DE NOZES, POR AMENDOIM, 2018-2032 (MIL USD)
TABELA 959 NOZES HÍBRIDAS/OUTRAS DA TAILÂNDIA NO MERCADO DE NOZES, POR TIPO, 2018-2032 (MIL USD)
TABELA 960 MERCADO DE CASTANHAS DA TAILÂNDIA, POR FORMA, 2018-2032 (MIL USD)
TABELA 961 MERCADO DE CASTANHAS DA TAILÂNDIA, POR NATUREZA, 2018-2032 (MIL USD)
TABELA 962 MERCADO DE CASTANHAS DA TAILÂNDIA, POR MÉTODO DE PROCESSAMENTO, 2018-2032 (MIL USD)
TABELA 963 TAILÂNDIA TORRADA NO MERCADO DE NOZES, POR TIPO, 2018-2032 (MIL USD)
TABELA 964 MERCADO DE NOZES COM SABOR DA TAILÂNDIA, POR TIPO, 2018-2032 (MIL USD)
TABELA 965 MERCADO DE CASTANHAS DA TAILÂNDIA, POR GRAU, 2018-2032 (MIL USD)
TABELA 966 MERCADO DE NOZES DA TAILÂNDIA, POR VALIDADE, 2018-2032 (MIL USD)
TABELA 967 MERCADO DE CASTANHAS DA TAILÂNDIA, POR CERTIFICAÇÃO, 2018-2032 (MIL USD)
TABELA 968 MERCADO DE NOZES DA TAILÂNDIA, POR EMBALAGEM, 2018-2032 (MIL USD)
TABELA 969 SACHÊS PLÁSTICOS DA TAILÂNDIA NO MERCADO DE NOZES, POR TIPO, 2018-2032 (MIL USD)
TABELA 970 MERCADO DE NOZES DA TAILÂNDIA, POR TAMANHO DA EMBALAGEM, 2018-2032 (MIL USD)
TABELA 971 MERCADO DE CASTANHAS DA TAILÂNDIA, POR FAIXA DE PREÇO, 2018-2032 (MIL USD)
TABELA 972 MERCADO DE CASTANHAS DA TAILÂNDIA, POR USO FINAL, 2018-2032 (MIL USD)
TABELA 973 NUTRIÇÃO FUNCIONAL NO MERCADO DE NOZES DA TAILÂNDIA, POR TIPO, 2018-2032 (MIL USD)
TABELA 974 INDÚSTRIA DE BEBIDAS DA TAILÂNDIA NO MERCADO DE NOZES, POR TIPO, 2018-2032 (MIL USD)
TABELA 975 MERCADO DE NOZES CULINÁRIAS DA TAILÂNDIA, POR TIPO, 2018-2032 (MIL USD)
TABELA 976 PRODUTOS DE CUIDADOS PESSOAIS NO MERCADO DE NOZES DA TAILÂNDIA, POR TIPO, 2018-2032 (MIL USD)
TABELA 977 USOS DE BASE BIOLÓGICA E AGROINDUSTRIAIS NO MERCADO DE NOZES DA TAILÂNDIA, POR TIPO, 2018-2032 (MIL USD)
TABELA 978 MERCADO DE RAÇÃO ANIMAL NA TAILÂNDIA PARA NOZES, POR TIPO, 2018-2032 (MIL USD)
TABELA 979 MERCADO DE CASTANHAS DA TAILÂNDIA, POR CANAL DE DISTRIBUIÇÃO, 2018-2032 (MIL USD)
TABELA 980 TAILÂNDIA B2C NO MERCADO DE NOZES, POR TIPO, 2018-2032 (MIL USD)
TABELA 981 TAILÂNDIA OFFLINE NO MERCADO DE NOZES, POR TIPO, 2018-2032 (MIL USD)
TABELA 982 TAILÂNDIA ONLINE NO MERCADO DE NOZES, POR TIPO, 2018-2032 (MIL USD)
TABELA 983 MERCADO DE NOZES DAS FILIPINAS, POR TIPO DE PRODUTO, 2018-2032 (MIL USD)
TABELA 984 MERCADO DE NOZES DAS FILIPINAS, POR TIPO DE PRODUTO, 2018-2032 (MIL TONELADAS)
TABELA 985 NOZES DAS FILIPINAS NO MERCADO DE NOZES, POR TIPO, 2018-2032 (MIL USD)
TABELA 986 AMIDO-DAS-FILIPINAS NO MERCADO DE NOZES, POR AMENDOIM, 2018-2032 (MIL USD)
TABELA 987 FILIPINAS HÍBRIDAS/OUTRAS NO MERCADO DE NOZES, POR TIPO, 2018-2032 (MIL USD)
TABELA 988 MERCADO DE NOZES DAS FILIPINAS, POR FORMA, 2018-2032 (MIL USD)
TABELA 989 MERCADO DE NOZES DAS FILIPINAS, POR NATUREZA, 2018-2032 (MIL USD)
TABELA 990 MERCADO DE NOZES DAS FILIPINAS, POR MÉTODO DE PROCESSAMENTO, 2018-2032 (MIL USD)
TABELA 991 FILIPINAS TORRADA NO MERCADO DE NOZES, POR TIPO, 2018-2032 (MIL USD)
TABELA 992 MERCADO DE NOZES COM SABOR DAS FILIPINAS, POR TIPO, 2018-2032 (MIL USD)
TABELA 993 MERCADO DE NOZES DAS FILIPINAS, POR GRAU, 2018-2032 (MIL USD)
TABELA 994 MERCADO DE NOZES DAS FILIPINAS, POR VALIDADE, 2018-2032 (MIL USD)
TABELA 995 MERCADO DE NOZES DAS FILIPINAS, POR CERTIFICAÇÃO, 2018-2032 (MIL USD)
TABELA 996 MERCADO DE NOZES DAS FILIPINAS, POR EMBALAGEM, 2018-2032 (MIL USD)
TABELA 997 MERCADO DE SACOS PLÁSTICOS DE NOZES NAS FILIPINAS, POR TIPO, 2018-2032 (MIL USD)
TABELA 998 MERCADO DE NOZES DAS FILIPINAS, POR TAMANHO DA EMBALAGEM, 2018-2032 (MIL USD)
TABELA 999 MERCADO DE NOZES DAS FILIPINAS, POR FAIXA DE PREÇO, 2018-2032 (MIL USD)
TABELA 1000 MERCADO DE NOZES DAS FILIPINAS, POR USO FINAL, 2018-2032 (MIL USD)
TABELA 1001 NUTRIÇÃO FUNCIONAL NAS FILIPINAS NO MERCADO DE NOZES, POR TIPO, 2018-2032 (MIL USD)
TABELA 1002 INDÚSTRIA DE BEBIDAS DAS FILIPINAS NO MERCADO DE NOZES, POR TIPO, 2018-2032 (MIL USD)
TABELA 1003 MERCADO CULINÁRIO DE NOZES DAS FILIPINAS, POR TIPO, 2018-2032 (MIL USD)
TABELA 1004 PRODUTOS DE CUIDADOS PESSOAIS NAS FILIPINAS NO MERCADO DE NOZES, POR TIPO, 2018-2032 (MIL USD)
TABELA 1005 USOS DE BASE BIOLÓGICA E AGROINDUSTRIAIS NO MERCADO DE NOZES NAS FILIPINAS, POR TIPO, 2018-2032 (MIL USD)
TABELA 1006 MERCADO DE RAÇÃO ANIMAL NAS FILIPINAS PARA NOZES, POR TIPO, 2018-2032 (MIL USD)
TABELA 1007 MERCADO DE NOZES DAS FILIPINAS, POR CANAL DE DISTRIBUIÇÃO, 2018-2032 (MIL USD)
TABELA 1008 FILIPINAS B2C NO MERCADO DE NOZES, POR TIPO, 2018-2032 (MIL USD)
TABELA 1009 FILIPINAS OFFLINE NO MERCADO DE NOZES, POR TIPO, 2018-2032 (MIL USD)
TABELA 1010 FILIPINAS ONLINE NO MERCADO DE NOZES, POR TIPO, 2018-2032 (MIL USD)
TABELA 1011 MERCADO DE NOZES DE SINGAPURA, POR TIPO DE PRODUTO, 2018-2032 (MIL USD)
TABELA 1012 MERCADO DE NOZES DE SINGAPURA, POR TIPO DE PRODUTO, 2018-2032 (MIL TONELADAS)
TABELA 1013 NOZES DE CINGAPURA NO MERCADO DE NOZES, POR TIPO, 2018-2032 (MIL USD)
TABELA 1014 AMIDO DE SINGAPURA NO MERCADO DE NOZES, POR AMENDOIM, 2018-2032 (MIL USD)
TABELA 1015 NOZES HÍBRIDAS/OUTRAS DE SINGAPURA NO MERCADO DE NOZES, POR TIPO, 2018-2032 (MIL USD)
TABELA 1016 MERCADO DE NOZES DE SINGAPURA, POR FORMA, 2018-2032 (MIL USD)
TABELA 1017 MERCADO DE CASTANHAS DE SINGAPURA, POR NATUREZA, 2018-2032 (MIL USD)
TABELA 1018 MERCADO DE CASTANHAS DE SINGAPURA, POR MÉTODO DE PROCESSAMENTO, 2018-2032 (MIL USD)
TABELA 1019 MERCADO DE NOZES TORRADAS EM SINGAPURA, POR TIPO, 2018-2032 (MIL USD)
TABELA 1020 MERCADO DE NOZES COM SABOR DE SINGAPURA, POR TIPO, 2018-2032 (MIL USD)
TABELA 1021 MERCADO DE NOZES DE SINGAPURA, POR GRAU, 2018-2032 (MIL USD)
TABELA 1022 MERCADO DE NOZES DE SINGAPURA, POR VALIDADE, 2018-2032 (MIL USD)
TABELA 1023 MERCADO DE CASTANHAS DE SINGAPURA, POR CERTIFICAÇÃO, 2018-2032 (MIL USD)
TABELA 1024 MERCADO DE NOZES DE SINGAPURA, POR EMBALAGEM, 2018-2032 (MIL USD)
TABELA 1025 SACHÊS PLÁSTICOS DE SINGAPURA NO MERCADO DE NOZES, POR TIPO, 2018-2032 (MIL USD)
TABELA 1026 MERCADO DE NOZES DE SINGAPURA, POR TAMANHO DE EMBALAGEM, 2018-2032 (MIL USD)
TABELA 1027 MERCADO DE NOZES DE SINGAPURA, POR FAIXA DE PREÇO, 2018-2032 (MIL USD)
TABELA 1028 MERCADO DE NOZES DE SINGAPURA, POR USO FINAL, 2018-2032 (MIL USD)
TABELA 1029 NUTRIÇÃO FUNCIONAL NO MERCADO DE NOZES DE SINGAPURA, POR TIPO, 2018-2032 (MIL USD)
TABELA 1030 INDÚSTRIA DE BEBIDAS DE SINGAPURA NO MERCADO DE NOZES, POR TIPO, 2018-2032 (MIL USD)
TABELA 1031 MERCADO CULINÁRIO DE NOZES DE SINGAPURA, POR TIPO, 2018-2032 (MIL USD)
TABELA 1032 PRODUTOS DE CUIDADOS PESSOAIS NO MERCADO DE NOZES DE SINGAPURA, POR TIPO, 2018-2032 (MIL USD)
TABELA 1033 USOS DE BASE BIOLÓGICA E AGROINDUSTRIAIS NO MERCADO DE NOZES EM SINGAPURA, POR TIPO, 2018-2032 (MIL USD)
TABELA 1034 MERCADO DE RAÇÃO ANIMAL DE SINGAPURA NO MERCADO DE NOZES, POR TIPO, 2018-2032 (MIL USD)
TABELA 1035 MERCADO DE CASTANHAS DE SINGAPURA, POR CANAL DE DISTRIBUIÇÃO, 2018-2032 (MIL USD)
TABELA 1036 SINGAPURA B2C NO MERCADO DE NOZES, POR TIPO, 2018-2032 (MIL USD)
TABELA 1037 SINGAPURA OFFLINE NO MERCADO DE NOZES, POR TIPO, 2018-2032 (MIL USD)
TABELA 1038 SINGAPURA ONLINE NO MERCADO DE NOZES, POR TIPO, 2018-2032 (MIL USD)
TABELA 1039 MERCADO DE NOZES DE HONG KONG, POR TIPO DE PRODUTO, 2018-2032 (MIL USD)
TABELA 1040 MERCADO DE NOZES DE HONG KONG, POR TIPO DE PRODUTO, 2018-2032 (MIL TONELADAS)
TABELA 1041 NOZES DE HONG KONG NO MERCADO DE NOZES, POR TIPO, 2018-2032 (MIL USD)
TABELA 1042 AMIDO DE HONG KONG NO MERCADO DE NOZES, POR AMENDOIM, 2018-2032 (MIL USD)
TABELA 1043 HÍBRIDAS/OUTRAS NOZES DE HONG KONG NO MERCADO DE NOZES, POR TIPO, 2018-2032 (MIL USD)
TABELA 1044 MERCADO DE NOZES DE HONG KONG, POR FORMA, 2018-2032 (MIL USD)
TABELA 1045 MERCADO DE NOZES DE HONG KONG, POR NATUREZA, 2018-2032 (MIL USD)
TABELA 1046 MERCADO DE NOZES DE HONG KONG, POR MÉTODO DE PROCESSAMENTO, 2018-2032 (MIL USD)
TABELA 1047 MERCADO DE NOZES TORRADAS EM HONG KONG, POR TIPO, 2018-2032 (MIL USD)
TABELA 1048 MERCADO DE NOZES COM SABOR DE HONG KONG, POR TIPO, 2018-2032 (MIL USD)
TABELA 1049 MERCADO DE NOZES DE HONG KONG, POR GRAU, 2018-2032 (MIL USD)
TABELA 1050 MERCADO DE NOZES DE HONG KONG, POR VALIDADE, 2018-2032 (MIL USD)
TABELA 1051 MERCADO DE NOZES DE HONG KONG, POR CERTIFICAÇÃO, 2018-2032 (MIL USD)
TABELA 1052 MERCADO DE NOZES DE HONG KONG, POR EMBALAGEM, 2018-2032 (MIL USD)
TABELA 1053 SACHÊS PLÁSTICOS DE HONG KONG NO MERCADO DE NOZES, POR TIPO, 2018-2032 (MIL USD)
TABELA 1054 MERCADO DE NOZES DE HONG KONG, POR TAMANHO DE EMBALAGEM, 2018-2032 (MIL USD)
TABELA 1055 MERCADO DE NOZES DE HONG KONG, POR FAIXA DE PREÇO, 2018-2032 (MIL USD)
TABELA 1056 MERCADO DE NOZES DE HONG KONG, POR USO FINAL, 2018-2032 (MIL USD)
TABELA 1057 NUTRIÇÃO FUNCIONAL NO MERCADO DE NOZES DE HONG KONG, POR TIPO, 2018-2032 (MIL USD)
TABELA 1058 INDÚSTRIA DE BEBIDAS DE HONG KONG NO MERCADO DE NOZES, POR TIPO, 2018-2032 (MIL USD)
TABELA 1059 MERCADO DE NOZES CULINÁRIAS DE HONG KONG, POR TIPO, 2018-2032 (MIL USD)
TABELA 1060 PRODUTOS DE CUIDADOS PESSOAIS NO MERCADO DE NOZES DE HONG KONG, POR TIPO, 2018-2032 (MIL USD)
TABELA 1061 USOS DE BASE BIOLÓGICA E AGROINDUSTRIAIS NO MERCADO DE NOZES EM HONG KONG, POR TIPO, 2018-2032 (MIL USD)
TABELA 1062 MERCADO DE RAÇÃO ANIMAL EM HONG KONG, POR TIPO, 2018-2032 (MIL USD)
TABELA 1063 MERCADO DE NOZES DE HONG KONG, POR CANAL DE DISTRIBUIÇÃO, 2018-2032 (MIL USD)
TABELA 1064 HONG KONG B2C NO MERCADO DE NOZES, POR TIPO, 2018-2032 (MIL USD)
TABELA 1065 HONG KONG OFFLINE NO MERCADO DE NOZES, POR TIPO, 2018-2032 (MIL USD)
TABELA 1066 HONG KONG ONLINE NO MERCADO DE NOZES, POR TIPO, 2018-2032 (MIL USD)
TABELA 1067 MERCADO DE CASTANHAS DA NOVA ZELÂNDIA, POR TIPO DE PRODUTO, 2018-2032 (MIL USD)
TABELA 1068 MERCADO DE CASTANHAS DA NOVA ZELÂNDIA, POR TIPO DE PRODUTO, 2018-2032 (MIL TONELADAS)
TABELA 1069 NOZES DA NOVA ZELÂNDIA NO MERCADO DE NOZES, POR TIPO, 2018-2032 (MIL USD)
TABELA 1070 AMIDO-DE-CASTANHO DA NOVA ZELÂNDIA NO MERCADO DE NOZES, POR AMENDOIM, 2018-2032 (MIL USD)
TABELA 1071 NOZES HÍBRIDAS/OUTRAS DA NOVA ZELÂNDIA NO MERCADO DE NOZES, POR TIPO, 2018-2032 (MIL USD)
TABELA 1072 MERCADO DE CASTANHAS DA NOVA ZELÂNDIA, POR FORMA, 2018-2032 (MIL USD)
TABELA 1073 MERCADO DE CASTANHAS DA NOVA ZELÂNDIA, POR NATUREZA, 2018-2032 (MIL USD)
TABELA 1074 MERCADO DE CASTANHAS DA NOVA ZELÂNDIA, POR MÉTODO DE PROCESSAMENTO, 2018-2032 (MIL USD)
TABELA 1075 MERCADO DE NOZES TORRADAS NA NOVA ZELÂNDIA, POR TIPO, 2018-2032 (MIL USD)
TABELA 1076 MERCADO DE NOZES COM SABOR DA NOVA ZELÂNDIA, POR TIPO, 2018-2032 (MIL USD)
TABELA 1077 MERCADO DE CASTANHAS DA NOVA ZELÂNDIA, POR GRAU, 2018-2032 (MIL USD)
TABELA 1078 MERCADO DE CASTANHAS DA NOVA ZELÂNDIA, POR VALIDADE, 2018-2032 (MIL USD)
TABELA 1079 MERCADO DE CASTANHAS DA NOVA ZELÂNDIA, POR CERTIFICAÇÃO, 2018-2032 (MIL USD)
TABELA 1080 MERCADO DE CASTANHAS DA NOVA ZELÂNDIA, POR EMBALAGEM, 2018-2032 (MIL USD)
TABELA 1081 SACHÊS PLÁSTICOS DA NOVA ZELÂNDIA NO MERCADO DE NOZES, POR TIPO, 2018-2032 (MIL USD)
TABELA 1082 MERCADO DE NOZES DA NOVA ZELÂNDIA, POR TAMANHO DA EMBALAGEM, 2018-2032 (MIL USD)
TABELA 1083 MERCADO DE CASTANHAS DA NOVA ZELÂNDIA, POR FAIXA DE PREÇO, 2018-2032 (MIL USD)
TABELA 1084 MERCADO DE CASTANHAS DA NOVA ZELÂNDIA, POR USO FINAL, 2018-2032 (MIL USD)
TABELA 1085 NUTRIÇÃO FUNCIONAL NO MERCADO DE NOZES DA NOVA ZELÂNDIA, POR TIPO, 2018-2032 (MIL USD)
TABELA 1086 INDÚSTRIA DE BEBIDAS DA NOVA ZELÂNDIA NO MERCADO DE NOZES, POR TIPO, 2018-2032 (MIL USD)
TABELA 1087 MERCADO DE NOZES CULINÁRIAS DA NOVA ZELÂNDIA, POR TIPO, 2018-2032 (MIL USD)
TABELA 1088 PRODUTOS DE CUIDADOS PESSOAIS NO MERCADO DE NOZES DA NOVA ZELÂNDIA, POR TIPO, 2018-2032 (MIL USD)
TABELA 1089 USOS DE BASE BIOLÓGICA E AGROINDUSTRIAIS NO MERCADO DE NOZES NA NOVA ZELÂNDIA, POR TIPO, 2018-2032 (MIL USD)
TABELA 1090 MERCADO DE RAÇÃO ANIMAL NA NOVA ZELÂNDIA, POR TIPO, 2018-2032 (MIL USD)
TABELA 1091 MERCADO DE CASTANHAS DA NOVA ZELÂNDIA, POR CANAL DE DISTRIBUIÇÃO, 2018-2032 (MIL USD)
TABELA 1092 NOVA ZELÂNDIA B2C NO MERCADO DE NOZES, POR TIPO, 2018-2032 (MIL USD)
TABELA 1093 NOVA ZELÂNDIA OFFLINE NO MERCADO DE NOZES, POR TIPO, 2018-2032 (MIL USD)
TABELA 1094 NOVA ZELÂNDIA ONLINE NO MERCADO DE NOZES, POR TIPO, 2018-2032 (MIL USD)
TABELA 1095 MERCADO DE NOZES DE TAIWAN, POR TIPO DE PRODUTO, 2018-2032 (MIL USD)
TABELA 1096 MERCADO DE NOZES DE TAIWAN, POR TIPO DE PRODUTO, 2018-2032 (MIL TONELADAS)
TABELA 1097 NOZES DE TAIWAN NO MERCADO DE NOZES, POR TIPO, 2018-2032 (MIL USD)
TABELA 1098 AMIDO DE TAIWAN NO MERCADO DE NOZES, POR AMENDOIM, 2018-2032 (MIL USD)
TABELA 1099 NOZES HÍBRIDAS/OUTRAS DE TAIWAN NO MERCADO DE NOZES, POR TIPO, 2018-2032 (MIL USD)
TABELA 1100 MERCADO DE NOZES DE TAIWAN, POR FORMA, 2018-2032 (MIL USD)
TABELA 1101 MERCADO DE NOZES DE TAIWAN, POR NATUREZA, 2018-2032 (MIL USD)
TABELA 1102 MERCADO DE NOZES DE TAIWAN, POR MÉTODO DE PROCESSAMENTO, 2018-2032 (MIL USD)
TABELA 1103 MERCADO DE NOZES TORRADAS EM TAIWAN, POR TIPO, 2018-2032 (MIL USD)
TABELA 1104 NOZES COM SABOR DE TAIWAN NO MERCADO, POR TIPO, 2018-2032 (MIL USD)
TABELA 1105 MERCADO DE NOZES DE TAIWAN, POR GRAU, 2018-2032 (MIL USD)
TABELA 1106 MERCADO DE NOZES DE TAIWAN, POR VALIDADE, 2018-2032 (MIL USD)
TABELA 1107 MERCADO DE NOZES DE TAIWAN, POR CERTIFICAÇÃO, 2018-2032 (MIL USD)
TABELA 1108 MERCADO DE NOZES DE TAIWAN, POR EMBALAGEM, 2018-2032 (MIL USD)
TABELA 1109 SACHÊS PLÁSTICOS DE TAIWAN NO MERCADO DE NOZES, POR TIPO, 2018-2032 (MIL USD)
TABELA 1110 MERCADO DE NOZES DE TAIWAN, POR TAMANHO DE EMBALAGEM, 2018-2032 (MIL USD)
TABELA 1111 MERCADO DE NOZES DE TAIWAN, POR FAIXA DE PREÇO, 2018-2032 (MIL USD)
TABELA 1112 MERCADO DE NOZES DE TAIWAN, POR USO FINAL, 2018-2032 (MIL USD)
TABELA 1113 NUTRIÇÃO FUNCIONAL NO MERCADO DE NOZES DE TAIWAN, POR TIPO, 2018-2032 (MIL USD)
TABELA 1114 INDÚSTRIA DE BEBIDAS DE TAIWAN NO MERCADO DE NOZES, POR TIPO, 2018-2032 (MIL USD)
TABELA 1115 MERCADO DE NOZES CULINÁRIAS DE TAIWAN, POR TIPO, 2018-2032 (MIL USD)
TABELA 1116 PRODUTOS DE CUIDADOS PESSOAIS DE TAIWAN NO MERCADO DE NOZES, POR TIPO, 2018-2032 (MIL USD)
TABELA 1117 USOS DE BASE BIOLÓGICA E AGROINDUSTRIAIS NO MERCADO DE NOZES DE TAIWAN, POR TIPO, 2018-2032 (MIL USD)
TABELA 1118 MERCADO DE RAÇÃO ANIMAL DE TAIWAN PARA NOZES, POR TIPO, 2018-2032 (MIL USD)
TABELA 1119 MERCADO DE NOZES DE TAIWAN, POR CANAL DE DISTRIBUIÇÃO, 2018-2032 (MIL USD)
TABELA 1120 TAIWAN B2C NO MERCADO DE NOZES, POR TIPO, 2018-2032 (MIL USD)
TABELA 1121 TAIWAN OFFLINE NO MERCADO DE NOZES, POR TIPO, 2018-2032 (MIL USD)
TABELA 1122 TAIWAN ONLINE NO MERCADO DE NOZES, POR TIPO, 2018-2032 (MIL USD)
TABELA 1123 RESTANTE DO MERCADO DE CASTANHAS DA ÁSIA-PACÍFICO, POR TIPO DE PRODUTO, 2018-2032 (MIL USD)
TABELA 1124 RESTANTE DO MERCADO DE CASTANHAS DA ÁSIA-PACÍFICO, POR TIPO DE PRODUTO, 2018-2032 (MIL TONELADAS)
TABELA 1125 MERCADO DE CASTANHAS DO ORIENTE MÉDIO E ÁFRICA, POR PAÍS, 2018-2032 (MIL USD)
TABELA 1126 MERCADO DE CASTANHAS DO ORIENTE MÉDIO E ÁFRICA, POR TIPO DE PRODUTO, 2018-2032 (MIL USD)
TABELA 1127 MERCADO DE CASTANHAS DO ORIENTE MÉDIO E ÁFRICA, POR TIPO DE PRODUTO, 2018-2032 (MIL TONELADAS)
TABELA 1128 NOZES DO ORIENTE MÉDIO E ÁFRICA NO MERCADO DE NOZES, POR TIPO, 2018-2032 (MIL USD)
TABELA 1129 CASTANHAS-DO-MAR DO ORIENTE MÉDIO E ÁFRICA NO MERCADO DE NOZES, POR AMENDOIM, 2018-2032 (MIL USD)
TABELA 1130 NOZES HÍBRIDAS/OUTRAS DO ORIENTE MÉDIO E ÁFRICA NO MERCADO DE NOZES, POR TIPO, 2018-2032 (MIL USD)
TABELA 1131 MERCADO DE CASTANHAS DO ORIENTE MÉDIO E ÁFRICA, POR FORMA, 2018-2032 (MIL USD)
TABELA 1132 MERCADO DE CASTANHAS DO ORIENTE MÉDIO E ÁFRICA, POR NATUREZA, 2018-2032 (MIL USD)
TABELA 1133 MERCADO DE CASTANHAS DO ORIENTE MÉDIO E ÁFRICA, POR MÉTODO DE PROCESSAMENTO, 2018-2032 (MIL USD)
TABELA 1134 MERCADO DE NOZES TORRADAS NO ORIENTE MÉDIO E ÁFRICA, POR TIPO, 2018-2032 (MIL USD)
TABELA 1135 MERCADO DE NOZES COM SABOR NO ORIENTE MÉDIO E ÁFRICA, POR TIPO, 2018-2032 (MIL USD)
TABELA 1136 MERCADO DE CASTANHAS DO ORIENTE MÉDIO E ÁFRICA, POR GRAU, 2018-2032 (MIL USD)
TABELA 1137 MERCADO DE CASTANHAS DO ORIENTE MÉDIO E ÁFRICA, POR VALIDADE, 2018-2032 (MIL USD)
TABELA 1138 MERCADO DE CASTANHAS DO ORIENTE MÉDIO E ÁFRICA, POR CERTIFICAÇÃO, 2018-2032 (MIL USD)
TABELA 1139 MERCADO DE CASTANHAS DO ORIENTE MÉDIO E ÁFRICA, POR EMBALAGEM, 2018-2032 (MIL USD)
TABELA 1140 SACHÊS PLÁSTICOS NO MERCADO DE NOZES DO ORIENTE MÉDIO E ÁFRICA, POR TIPO, 2018-2032 (MIL USD)
TABELA 1141 MERCADO DE NOZES DO ORIENTE MÉDIO E ÁFRICA, POR TAMANHO DA EMBALAGEM, 2018-2032 (MIL USD)
TABELA 1142 MERCADO DE CASTANHAS DO ORIENTE MÉDIO E ÁFRICA, POR FAIXA DE PREÇO, 2018-2032 (MIL USD)
TABELA 1143 MERCADO DE CASTANHAS NO ORIENTE MÉDIO E ÁFRICA, POR USO FINAL, 2018-2032 (MIL USD)
TABELA 1144 NUTRIÇÃO FUNCIONAL NO MERCADO DE NOZES NO ORIENTE MÉDIO E ÁFRICA, POR TIPO, 2018-2032 (MIL USD)
TABELA 1145 INDÚSTRIA DE BEBIDAS DO ORIENTE MÉDIO E ÁFRICA NO MERCADO DE NOZES, POR TIPO, 2018-2032 (MIL USD)
TABELA 1146 MERCADO DE NOZES CULINÁRIAS DO ORIENTE MÉDIO E ÁFRICA, POR TIPO, 2018-2032 (MIL USD)
TABELA 1147 PRODUTOS DE CUIDADOS PESSOAIS NO MERCADO DE NOZES NO ORIENTE MÉDIO E ÁFRICA, POR TIPO, 2018-2032 (MIL USD)
TABELA 1148 USOS DE BASE BIOLÓGICA E AGROINDUSTRIAIS NO MERCADO DE NOZES NO ORIENTE MÉDIO E ÁFRICA, POR TIPO, 2018-2032 (MIL USD)
TABELA 1149 MERCADO DE RAÇÃO ANIMAL NO ORIENTE MÉDIO E ÁFRICA, POR TIPO, 2018-2032 (MIL USD)
TABELA 1150 MERCADO DE CASTANHAS DO ORIENTE MÉDIO E ÁFRICA, POR CANAL DE DISTRIBUIÇÃO, 2018-2032 (MIL USD)
TABELA 1151 ORIENTE MÉDIO E ÁFRICA B2C NO MERCADO DE NOZES, POR TIPO, 2018-2032 (MIL USD)
TABELA 1152 ORIENTE MÉDIO E ÁFRICA OFFLINE NO MERCADO DE NOZES, POR TIPO, 2018-2032 (MIL USD)
TABELA 1153 ORIENTE MÉDIO E ÁFRICA ONLINE NO MERCADO DE NOZES, POR TIPO, 2018-2032 (MIL USD)
TABELA 1154 MERCADO DE NOZES DOS EAU, POR TIPO DE PRODUTO, 2018-2032 (MIL USD)
TABELA 1155 MERCADO DE NOZES DOS EAU, POR TIPO DE PRODUTO, 2018-2032 (MIL TONELADAS)
TABELA 1156 NOZES DOS EAU NO MERCADO DE NOZES, POR TIPO, 2018-2032 (MIL USD)
TABELA 1157 AMIDO-AMEndoim dos Emirados Árabes Unidos no mercado de nozes, por amendoim, 2018-2032 (milhares de dólares americanos)
TABELA 1158 NOZES HÍBRIDAS/OUTRAS NO MERCADO DE NOZES DOS EAU, POR TIPO, 2018-2032 (MIL USD)
TABELA 1159 MERCADO DE CASTANHAS DOS EAU, POR FORMA, 2018-2032 (MIL USD)
TABELA 1160 MERCADO DE NOZES DOS EAU, POR NATUREZA, 2018-2032 (MIL USD)
TABELA 1161 MERCADO DE CASTANHAS DOS EAU, POR MÉTODO DE PROCESSAMENTO, 2018-2032 (MIL USD)
TABELA 1162 MERCADO DE NOZES TORRADAS NOS EAU, POR TIPO, 2018-2032 (MIL USD)
TABELA 1163 MERCADO DE NOZES COM SABOR DOS EAU, POR TIPO, 2018-2032 (MIL USD)
TABELA 1164 MERCADO DE NOZES DOS EAU, POR GRAU, 2018-2032 (MIL USD)
TABELA 1165 MERCADO DE NOZES DOS EAU, POR VALIDADE, 2018-2032 (MIL USD)
TABELA 1166 MERCADO DE CASTANHAS DOS EAU, POR CERTIFICAÇÃO, 2018-2032 (MIL USD)
TABELA 1167 MERCADO DE NOZES DOS EAU, POR EMBALAGEM, 2018-2032 (MIL USD)
TABELA 1168 SACOLAS PLÁSTICAS DOS EAU NO MERCADO DE NOZES, POR TIPO, 2018-2032 (MIL USD)
TABELA 1169 MERCADO DE NOZES DOS EAU, POR TAMANHO DE EMBALAGEM, 2018-2032 (MIL USD)
TABELA 1170 MERCADO DE CASTANHAS DOS EAU, POR FAIXA DE PREÇO, 2018-2032 (MIL USD)
TABELA 1171 MERCADO DE CASTANHAS DOS EAU, POR USO FINAL, 2018-2032 (MIL USD)
TABELA 1172 NUTRIÇÃO FUNCIONAL NO MERCADO DE NOZES DOS EAU, POR TIPO, 2018-2032 (MIL USD)
TABELA 1173 INDÚSTRIA DE BEBIDAS DOS EAU NO MERCADO DE NOZES, POR TIPO, 2018-2032 (MIL USD)
TABELA 1174 MERCADO DE NOZES CULINÁRIAS DOS EAU, POR TIPO, 2018-2032 (MIL USD)
TABELA 1175 PRODUTOS DE CUIDADOS PESSOAIS NO MERCADO DE NOZES NOS EAU, POR TIPO, 2018-2032 (MIL USD)
TABELA 1176 USOS DE BASE BIOLÓGICA E AGROINDUSTRIAIS NO MERCADO DE NOZES NOS EAU, POR TIPO, 2018-2032 (MIL USD)
TABELA 1177 MERCADO DE RAÇÃO ANIMAL NOS EAU, POR TIPO, 2018-2032 (MIL USD)
TABELA 1178 MERCADO DE CASTANHAS DOS EAU, POR CANAL DE DISTRIBUIÇÃO, 2018-2032 (MIL USD)
TABELA 1179 EAU B2C NO MERCADO DE NOZES, POR TIPO, 2018-2032 (MIL USD)
TABELA 1180 EAU OFFLINE NO MERCADO DE NOZES, POR TIPO, 2018-2032 (MIL USD)
TABELA 1181 EAU ONLINE NO MERCADO DE NOZES, POR TIPO, 2018-2032 (MIL USD)
TABELA 1182 MERCADO DE CASTANHAS DA ARÁBIA SAUDITA, POR TIPO DE PRODUTO, 2018-2032 (MIL USD)
TABELA 1183 MERCADO DE CASTANHAS DA ARÁBIA SAUDITA, POR TIPO DE PRODUTO, 2018-2032 (MIL TONELADAS)
TABELA 1184 NOZES DA ARÁBIA SAUDITA NO MERCADO DE NOZES, POR TIPO, 2018-2032 (MIL USD)
TABELA 1185 AMIDO DA ARÁBIA SAUDITA NO MERCADO DE NOZES, POR AMENDOIM, 2018-2032 (MIL USD)
TABELA 1186 NOZES HÍBRIDAS/OUTRAS DA ARÁBIA SAUDITA NO MERCADO DE NOZES, POR TIPO, 2018-2032 (MIL USD)
TABELA 1187 MERCADO DE CASTANHAS DA ARÁBIA SAUDITA, POR FORMA, 2018-2032 (MIL USD)
TABELA 1188 MERCADO DE CASTANHAS DA ARÁBIA SAUDITA, POR NATUREZA, 2018-2032 (MIL USD)
TABELA 1189 MERCADO DE CASTANHAS DA ARÁBIA SAUDITA, POR MÉTODO DE PROCESSAMENTO, 2018-2032 (MIL USD)
TABELA 1190 ARÁBIA SAUDITA TORRADA NO MERCADO DE NOZES, POR TIPO, 2018-2032 (MIL USD)
TABELA 1191 MERCADO DE NOZES COM SABOR DA ARÁBIA SAUDITA, POR TIPO, 2018-2032 (MIL USD)
TABELA 1192 MERCADO DE CASTANHAS DA ARÁBIA SAUDITA, POR GRAU, 2018-2032 (MIL USD)
TABELA 1193 MERCADO DE CASTANHAS DA ARÁBIA SAUDITA, POR VALIDADE, 2018-2032 (MIL USD)
TABELA 1194 MERCADO DE CASTANHAS DA ARÁBIA SAUDITA, POR CERTIFICAÇÃO, 2018-2032 (MIL USD)
TABELA 1195 MERCADO DE CASTANHAS DA ARÁBIA SAUDITA, POR EMBALAGEM, 2018-2032 (MIL USD)
TABELA 1196 SACHÊS PLÁSTICOS NO MERCADO DE NOZES DA ARÁBIA SAUDITA, POR TIPO, 2018-2032 (MIL USD)
TABELA 1197 MERCADO DE CASTANHAS DA ARÁBIA SAUDITA, POR TAMANHO DE EMBALAGEM, 2018-2032 (MIL USD)
TABELA 1198 MERCADO DE CASTANHAS DA ARÁBIA SAUDITA, POR FAIXA DE PREÇO, 2018-2032 (MIL USD)
TABELA 1199 MERCADO DE CASTANHAS DA ARÁBIA SAUDITA, POR USO FINAL, 2018-2032 (MIL USD)
TABELA 1200 NUTRIÇÃO FUNCIONAL NO MERCADO DE NOZES DA ARÁBIA SAUDITA, POR TIPO, 2018-2032 (MIL USD)
TABELA 1201 INDÚSTRIA DE BEBIDAS DA ARÁBIA SAUDITA NO MERCADO DE NOZES, POR TIPO, 2018-2032 (MIL USD)
TABELA 1202 MERCADO DE NOZES CULINÁRIAS DA ARÁBIA SAUDITA, POR TIPO, 2018-2032 (MIL USD)
TABELA 1203 PRODUTOS DE CUIDADOS PESSOAIS NO MERCADO DE NOZES DA ARÁBIA SAUDITA, POR TIPO, 2018-2032 (MIL USD)
TABELA 1204 USOS DE BASE BIOLÓGICA E AGROINDUSTRIAIS NO MERCADO DE NOZES DA ARÁBIA SAUDITA, POR TIPO, 2018-2032 (MIL USD)
TABELA 1205 MERCADO DE RAÇÃO ANIMAL NA ARÁBIA SAUDITA, POR TIPO, 2018-2032 (MIL USD)
TABELA 1206 MERCADO DE CASTANHAS DA ARÁBIA SAUDITA, POR CANAL DE DISTRIBUIÇÃO, 2018-2032 (MIL USD)
TABELA 1207 ARÁBIA SAUDITA B2C NO MERCADO DE NOZES, POR TIPO, 2018-2032 (MIL USD)
TABELA 1208 ARÁBIA SAUDITA OFFLINE NO MERCADO DE NOZES, POR TIPO, 2018-2032 (MIL USD)
TABELA 1209 ARÁBIA SAUDITA ONLINE NO MERCADO DE NOZES, POR TIPO, 2018-2032 (MIL USD)
TABELA 1210 MERCADO DE CASTANHAS DO EGITO, POR TIPO DE PRODUTO, 2018-2032 (MIL USD)
TABELA 1211 MERCADO DE CASTANHAS DO EGITO, POR TIPO DE PRODUTO, 2018-2032 (MIL TONELADAS)
TABELA 1212 NOZES DO EGITO NO MERCADO DE NOZES, POR TIPO, 2018-2032 (MIL USD)
TABELA 1213 AMÊNDOAS EGITAS NO MERCADO DE NOZES, POR AMENDOIM, 2018-2032 (MIL USD)
TABELA 1214 NOZES HÍBRIDAS/OUTRAS DO EGITO NO MERCADO DE NOZES, POR TIPO, 2018-2032 (MIL USD)
TABELA 1215 MERCADO DE CASTANHAS DO EGITO, POR FORMA, 2018-2032 (MIL USD)
TABELA 1216 MERCADO DE CASTANHAS DO EGITO, POR NATUREZA, 2018-2032 (MIL USD)
TABELA 1217 MERCADO DE CASTANHAS DO EGITO, POR MÉTODO DE PROCESSAMENTO, 2018-2032 (MIL USD)
TABELA 1218 EGITO TORRADO NO MERCADO DE NOZES, POR TIPO, 2018-2032 (USD MIL)
TABELA 1219 MERCADO DE NOZES COM SABOR DO EGITO, POR TIPO, 2018-2032 (MIL USD)
TABELA 1220 MERCADO DE CASTANHAS DO EGITO, POR GRAU, 2018-2032 (MIL USD)
TABELA 1221 MERCADO DE CASTANHAS DO EGITO, POR VALIDADE, 2018-2032 (MIL USD)
TABELA 1222 MERCADO DE CASTANHAS DO EGITO, POR CERTIFICAÇÃO, 2018-2032 (MIL USD)
TABELA 1223 MERCADO DE CASTANHAS DO EGITO, POR EMBALAGEM, 2018-2032 (MIL USD)
TABELA 1224 SACOLAS PLÁSTICAS NO MERCADO DE NOZES DO EGITO, POR TIPO, 2018-2032 (MIL USD)
TABELA 1225 MERCADO DE CASTANHAS DO EGITO, POR TAMANHO DA EMBALAGEM, 2018-2032 (MIL USD)
TABELA 1226 MERCADO DE CASTANHAS DO EGITO, POR FAIXA DE PREÇO, 2018-2032 (MIL USD)
TABELA 1227 MERCADO DE CASTANHAS DO EGITO, POR USO FINAL, 2018-2032 (MIL USD)
TABELA 1228 NUTRIÇÃO FUNCIONAL NO MERCADO DE NOZES DO EGITO, POR TIPO, 2018-2032 (MIL USD)
TABELA 1229 INDÚSTRIA DE BEBIDAS DO EGITO NO MERCADO DE NOZES, POR TIPO, 2018-2032 (MIL USD)
TABELA 1230 MERCADO CULINÁRIO DE NOZES DO EGITO, POR TIPO, 2018-2032 (MIL USD)
TABELA 1231 PRODUTOS DE CUIDADOS PESSOAIS NO MERCADO DE NOZES DO EGITO, POR TIPO, 2018-2032 (MIL USD)
TABELA 1232 USOS DE BASE BIOLÓGICA E AGROINDUSTRIAIS NO MERCADO DE NOZES, POR TIPO, 2018-2032 (MIL USD)
TABELA 1233 MERCADO DE RAÇÃO ANIMAL NO EGITO, POR TIPO, 2018-2032 (MIL USD)
TABELA 1234 MERCADO DE CASTANHAS DO EGITO, POR CANAL DE DISTRIBUIÇÃO, 2018-2032 (MIL USD)
TABELA 1235 EGITO B2C NO MERCADO DE NOZES, POR TIPO, 2018-2032 (MIL USD)
TABELA 1236 EGITO OFFLINE NO MERCADO DE NOZES, POR TIPO, 2018-2032 (MIL USD)
TABELA 1237 EGITO ONLINE NO MERCADO DE NOZES, POR TIPO, 2018-2032 (MIL USD)
TABELA 1238 MERCADO DE CASTANHAS DA ÁFRICA DO SUL, POR TIPO DE PRODUTO, 2018-2032 (MIL USD)
TABELA 1239 MERCADO DE CASTANHAS DA ÁFRICA DO SUL, POR TIPO DE PRODUTO, 2018-2032 (MIL TONELADAS)
TABELA 1240 NOZES DA ÁFRICA DO SUL NO MERCADO DE NOZES, POR TIPO, 2018-2032 (MIL USD)
TABELA 1241 AMIDO-DE-CASTANHO DA ÁFRICA DO SUL NO MERCADO DE NOZES, POR AMENDOIM, 2018-2032 (MIL USD)
TABELA 1242 NOZES HÍBRIDAS/OUTRAS DA ÁFRICA DO SUL NO MERCADO DE NOZES, POR TIPO, 2018-2032 (MIL USD)
TABELA 1243 MERCADO DE CASTANHAS DA ÁFRICA DO SUL, POR FORMA, 2018-2032 (MIL USD)
TABELA 1244 MERCADO DE CASTANHAS DA ÁFRICA DO SUL, POR NATUREZA, 2018-2032 (MIL USD)
TABELA 1245 MERCADO DE CASTANHAS DA ÁFRICA DO SUL, POR MÉTODO DE PROCESSAMENTO, 2018-2032 (MIL USD)
TABELA 1246 MERCADO DE NOZES TORRADAS NA ÁFRICA DO SUL, POR TIPO, 2018-2032 (MIL USD)
TABELA 1247 MERCADO DE NOZES COM SABOR DA ÁFRICA DO SUL, POR TIPO, 2018-2032 (MIL USD)
TABELA 1248 MERCADO DE CASTANHAS DA ÁFRICA DO SUL, POR GRAU, 2018-2032 (MIL USD)
TABELA 1249 MERCADO DE CASTANHAS DA ÁFRICA DO SUL, POR VALIDADE, 2018-2032 (MIL USD)
TABELA 1250 MERCADO DE CASTANHAS DA ÁFRICA DO SUL, POR CERTIFICAÇÃO, 2018-2032 (MIL USD)
TABELA 1251 MERCADO DE CASTANHAS DA ÁFRICA DO SUL, POR EMBALAGEM, 2018-2032 (MIL USD)
TABELA 1252 SACHÊS PLÁSTICOS NO MERCADO DE NOZES DA ÁFRICA DO SUL, POR TIPO, 2018-2032 (MIL USD)
TABELA 1253 MERCADO DE NOZES DA ÁFRICA DO SUL, POR TAMANHO DA EMBALAGEM, 2018-2032 (MIL USD)
TABELA 1254 MERCADO DE CASTANHAS DA ÁFRICA DO SUL, POR FAIXA DE PREÇO, 2018-2032 (MIL USD)
TABELA 1255 MERCADO DE CASTANHAS DA ÁFRICA DO SUL, POR USO FINAL, 2018-2032 (MIL USD)
TABELA 1256 MERCADO DE NUTRIÇÃO FUNCIONAL DE NOZES NA ÁFRICA DO SUL, POR TIPO, 2018-2032 (MIL USD)
TABELA 1257 INDÚSTRIA DE BEBIDAS DA ÁFRICA DO SUL NO MERCADO DE NOZES, POR TIPO, 2018-2032 (MIL USD)
TABELA 1258 MERCADO DE NOZES CULINÁRIAS DA ÁFRICA DO SUL, POR TIPO, 2018-2032 (MIL USD)
TABELA 1259 PRODUTOS DE CUIDADOS PESSOAIS NO MERCADO DE NOZES DA ÁFRICA DO SUL, POR TIPO, 2018-2032 (MIL USD)
TABELA 1260 USOS DE BASE BIOLÓGICA E AGROINDUSTRIAIS NO MERCADO DE NOZES DA ÁFRICA DO SUL, POR TIPO, 2018-2032 (MIL USD)
TABELA 1261 MERCADO DE RAÇÃO ANIMAL NA ÁFRICA DO SUL, POR TIPO, 2018-2032 (MIL USD)
TABELA 1262 MERCADO DE CASTANHAS DA ÁFRICA DO SUL, POR CANAL DE DISTRIBUIÇÃO, 2018-2032 (MIL USD)
TABELA 1263 ÁFRICA DO SUL B2C NO MERCADO DE NOZES, POR TIPO, 2018-2032 (MIL USD)
TABELA 1264 ÁFRICA DO SUL OFFLINE NO MERCADO DE NOZES, POR TIPO, 2018-2032 (MIL USD)
TABELA 1265 ÁFRICA DO SUL ONLINE NO MERCADO DE NOZES, POR TIPO, 2018-2032 (MIL USD)
TABELA 1266 MERCADO DE CASTANHAS DE ISRAEL, POR TIPO DE PRODUTO, 2018-2032 (MIL USD)
TABELA 1267 MERCADO DE CASTANHAS DE ISRAEL, POR TIPO DE PRODUTO, 2018-2032 (MIL TONELADAS)
TABELA 1268 NOZES DE ISRAEL NO MERCADO DE NOZES, POR TIPO, 2018-2032 (MIL USD)
TABELA 1269 AMIDO DE ISRAEL NO MERCADO DE NOZES, POR AMENDOIM, 2018-2032 (MIL USD)
TABELA 1270 NOZES HÍBRIDAS/OUTRAS DE ISRAEL NO MERCADO DE NOZES, POR TIPO, 2018-2032 (MIL USD)
TABELA 1271 MERCADO DE NOZES DE ISRAEL, POR FORMA, 2018-2032 (MIL USD)
TABELA 1272 MERCADO DE NOZES DE ISRAEL, POR NATUREZA, 2018-2032 (MIL USD)
TABELA 1273 MERCADO DE CASTANHAS DE ISRAEL, POR MÉTODO DE PROCESSAMENTO, 2018-2032 (MIL USD)
TABELA 1274 ISRAEL TORRA NO MERCADO DE NOZES, POR TIPO, 2018-2032 (USD MIL)
TABELA 1275 NOZES COM SABOR ISRAEL NO MERCADO, POR TIPO, 2018-2032 (MIL USD)
TABELA 1276 MERCADO DE NOZES DE ISRAEL, POR GRAU, 2018-2032 (MIL USD)
TABELA 1277 MERCADO DE CASTANHAS DE ISRAEL, POR VALIDADE, 2018-2032 (MIL USD)
TABELA 1278 MERCADO DE CASTANHAS DE ISRAEL, POR CERTIFICAÇÃO, 2018-2032 (MIL USD)
TABELA 1279 MERCADO DE CASTANHAS DE ISRAEL, POR EMBALAGEM, 2018-2032 (MIL USD)
TABELA 1280 SACHÊS PLÁSTICOS DE ISRAEL NO MERCADO DE NOZES, POR TIPO, 2018-2032 (MIL USD)
TABELA 1281 MERCADO DE CASTANHAS DE ISRAEL, POR TAMANHO DE EMBALAGEM, 2018-2032 (MIL USD)
TABELA 1282 MERCADO DE CASTANHAS DE ISRAEL, POR FAIXA DE PREÇO, 2018-2032 (MIL USD)
TABELA 1283 MERCADO DE CASTANHAS DE ISRAEL, POR USO FINAL, 2018-2032 (MIL USD)
TABELA 1284 NUTRIÇÃO FUNCIONAL DE ISRAEL NO MERCADO DE NOZES, POR TIPO, 2018-2032 (MIL USD)
TABELA 1285 INDÚSTRIA DE BEBIDAS DE ISRAEL NO MERCADO DE NOZES, POR TIPO, 2018-2032 (MIL USD)
TABELA 1286 MERCADO DE NOZES CULINÁRIAS DE ISRAEL, POR TIPO, 2018-2032 (MIL USD)
TABELA 1287 PRODUTOS DE CUIDADOS PESSOAIS DE ISRAEL NO MERCADO DE NOZES, POR TIPO, 2018-2032 (MIL USD)
TABELA 1288 USOS DE BASE BIOLÓGICA E AGROINDUSTRIAIS DE ISRAEL NO MERCADO DE NOZES, POR TIPO, 2018-2032 (MIL USD)
TABELA 1289 MERCADO DE RAÇÃO ANIMAL DE ISRAEL NO MERCADO DE NOZES, POR TIPO, 2018-2032 (MIL USD)
TABELA 1290 MERCADO DE CASTANHAS DE ISRAEL, POR CANAL DE DISTRIBUIÇÃO, 2018-2032 (MIL USD)
TABELA 1291 ISRAEL B2C NO MERCADO DE NOZES, POR TIPO, 2018-2032 (MIL USD)
TABELA 1292 ISRAEL OFFLINE NO MERCADO DE NOZES, POR TIPO, 2018-2032 (USD MIL)
TABELA 1293 ISRAEL ONLINE NO MERCADO DE NOZES, POR TIPO, 2018-2032 (MIL USD)
TABELA 1294 MERCADO DE NOZES DO KUWAIT, POR TIPO DE PRODUTO, 2018-2032 (MIL USD)
TABELA 1295 MERCADO DE NOZES DO KUWAIT, POR TIPO DE PRODUTO, 2018-2032 (MIL TONELADAS)
TABELA 1296 NOZES DO KUWAIT NO MERCADO DE NOZES, POR TIPO, 2018-2032 (MIL USD)
TABELA 1297 AMIDO DO KUWAIT NO MERCADO DE NOZES, POR AMENDOIM, 2018-2032 (MIL USD)
TABELA 1298 NOZES HÍBRIDAS/OUTRAS DO KUWAIT NO MERCADO DE NOZES, POR TIPO, 2018-2032 (MIL USD)
TABELA 1299 MERCADO DE NOZES DO KUWAIT, POR FORMA, 2018-2032 (MIL USD)
TABELA 1300 MERCADO DE NOZES DO KUWAIT, POR NATUREZA, 2018-2032 (MIL USD)
TABELA 1301 MERCADO DE CASTANHAS DO KUWAIT, POR MÉTODO DE PROCESSAMENTO, 2018-2032 (MIL USD)
TABELA 1302 MERCADO DE NOZES TORRADAS DO KUWAIT, POR TIPO, 2018-2032 (MIL USD)
TABELA 1303 SABOR KUWAIT NO MERCADO DE NOZES, POR TIPO, 2018-2032 (MIL USD)
TABELA 1304 MERCADO DE NOZES DO KUWAIT, POR GRAU, 2018-2032 (MIL USD)
TABELA 1305 MERCADO DE NOZES DO KUWAIT, POR VALIDADE, 2018-2032 (MIL USD)
TABELA 1306 MERCADO DE NOZES DO KUWAIT, POR CERTIFICAÇÃO, 2018-2032 (MIL USD)
TABELA 1307 MERCADO DE NOZES DO KUWAIT, POR EMBALAGEM, 2018-2032 (MIL USD)
TABELA 1308 SACOLAS PLÁSTICAS DO KUWAIT NO MERCADO DE NOZES, POR TIPO, 2018-2032 (MIL USD)
TABELA 1309 MERCADO DE NOZES DO KUWAIT, POR TAMANHO DA EMBALAGEM, 2018-2032 (MIL USD)
TABELA 1310 MERCADO DE NOZES DO KUWAIT, POR FAIXA DE PREÇO, 2018-2032 (MIL USD)
TABELA 1311 MERCADO DE NOZES DO KUWAIT, POR USO FINAL, 2018-2032 (MIL USD)
TABELA 1312 NUTRIÇÃO FUNCIONAL NO MERCADO DE NOZES DO KUWAIT, POR TIPO, 2018-2032 (MIL USD)
TABELA 1313 INDÚSTRIA DE BEBIDAS DO KUWAIT NO MERCADO DE NOZES, POR TIPO, 2018-2032 (MIL USD)
TABELA 1314 MERCADO DE NOZES CULINÁRIAS DO KUWAIT, POR TIPO, 2018-2032 (MIL USD)
TABELA 1315 PRODUTOS DE CUIDADOS PESSOAIS NO MERCADO DE NOZES DO KUWAIT, POR TIPO, 2018-2032 (MIL USD)
TABELA 1316 USOS DE BASE BIOLÓGICA E AGROINDUSTRIAIS NO MERCADO DE NOZES DO KUWAIT, POR TIPO, 2018-2032 (MIL USD)
TABELA 1317 MERCADO DE RAÇÃO ANIMAL NO KUWAIT, POR TIPO, 2018-2032 (MIL USD)
TABELA 1318 MERCADO DE NOZES DO KUWAIT, POR CANAL DE DISTRIBUIÇÃO, 2018-2032 (MIL USD)
TABELA 1319 KUWAIT B2C NO MERCADO DE NOZES, POR TIPO, 2018-2032 (MIL USD)
TABELA 1320 KUWAIT OFFLINE NO MERCADO DE NOZES, POR TIPO, 2018-2032 (MIL USD)
TABELA 1321 KUWAIT ONLINE NO MERCADO DE NOZES, POR TIPO, 2018-2032 (MIL USD)
TABELA 1322 MERCADO DE CASTANHAS DE OMÃ, POR TIPO DE PRODUTO, 2018-2032 (MIL USD)
TABELA 1323 MERCADO DE CASTANHAS DE OMÃ, POR TIPO DE PRODUTO, 2018-2032 (MIL TONELADAS)
TABELA 1324 NOZES DE OMAN NO MERCADO DE NOZES, POR TIPO, 2018-2032 (MIL USD)
TABELA 1325 AMIDO DE OMAN NO MERCADO DE NOZES, POR AMENDOIM, 2018-2032 (MIL USD)
TABELA 1326 NOZES HÍBRIDAS/OUTRAS DE OMÃ NO MERCADO DE NOZES, POR TIPO, 2018-2032 (MIL USD)
TABELA 1327 MERCADO DE CASTANHAS DE OMÃ, POR FORMA, 2018-2032 (MIL USD)
TABELA 1328 MERCADO DE CASTANHAS DE OMÃ, POR NATUREZA, 2018-2032 (MIL USD)
TABELA 1329 MERCADO DE CASTANHAS DE OMÃ, POR MÉTODO DE PROCESSAMENTO, 2018-2032 (MIL USD)
TABELA 1330 MERCADO DE NOZES TORRADAS EM OMÃ, POR TIPO, 2018-2032 (MIL USD)
TABELA 1331 MERCADO DE NOZES COM SABOR DE OMÃ, POR TIPO, 2018-2032 (MIL USD)
TABELA 1332 MERCADO DE CASTANHAS DE OMÃ, POR GRAU, 2018-2032 (MIL USD)
TABELA 1333 MERCADO DE CASTANHAS DE OMÃ, POR VALIDADE, 2018-2032 (MIL USD)
TABELA 1334 MERCADO DE CASTANHAS DE OMÃ, POR CERTIFICAÇÃO, 2018-2032 (MIL USD)
TABELA 1335 MERCADO DE CASTANHAS DE OMÃ, POR EMBALAGEM, 2018-2032 (MIL USD)
TABELA 1336 SACOLAS PLÁSTICAS NO MERCADO DE NOZES DE OMÃ, POR TIPO, 2018-2032 (MIL USD)
TABELA 1337 MERCADO DE NOZES DE OMÃ, POR TAMANHO DE EMBALAGEM, 2018-2032 (MIL USD)
TABELA 1338 MERCADO DE CASTANHAS DE OMÃ, POR FAIXA DE PREÇO, 2018-2032 (MIL USD)
TABELA 1339 MERCADO DE CASTANHAS DE OMÃ, POR USO FINAL, 2018-2032 (MIL USD)
TABELA 1340 NUTRIÇÃO FUNCIONAL NO MERCADO DE NOZES DE OMÃ, POR TIPO, 2018-2032 (MIL USD)
TABELA 1341 INDÚSTRIA DE BEBIDAS DE OMÃ NO MERCADO DE NOZES, POR TIPO, 2018-2032 (MIL USD)
TABELA 1342 MERCADO DE NOZES CULINÁRIAS DE OMÃ, POR TIPO, 2018-2032 (MIL USD)
TABELA 1343 PRODUTOS DE CUIDADOS PESSOAIS NO MERCADO DE NOZES DE OMÃ, POR TIPO, 2018-2032 (MIL USD)
TABELA 1344 USOS DE BASE BIOLÓGICA E AGROINDUSTRIAIS NO MERCADO DE NOZES DE OMÃ, POR TIPO, 2018-2032 (MIL USD)
TABELA 1345 MERCADO DE RAÇÃO ANIMAL EM NOZES DE OMÃ, POR TIPO, 2018-2032 (MIL USD)
TABELA 1346 MERCADO DE CASTANHAS DE OMÃ, POR CANAL DE DISTRIBUIÇÃO, 2018-2032 (MIL USD)
TABELA 1347 OMÃ B2C NO MERCADO DE NOZES, POR TIPO, 2018-2032 (MIL USD)
TABELA 1348 OMÃ OFFLINE NO MERCADO DE NOZES, POR TIPO, 2018-2032 (MIL USD)
TABELA 1349 OMÃ ONLINE NO MERCADO DE NOZES, POR TIPO, 2018-2032 (MIL USD)
TABELA 1350 MERCADO DE NOZES DO BAHREIN, POR TIPO DE PRODUTO, 2018-2032 (MIL USD)
TABELA 1351 MERCADO DE NOZES DO BAHREIN, POR TIPO DE PRODUTO, 2018-2032 (MIL TONELADAS)
TABELA 1352 NOZES DO BAHREIN NO MERCADO DE NOZES, POR TIPO, 2018-2032 (MIL USD)
TABELA 1353 AMIDO DO BAHREIN NO MERCADO DE NOZES, POR AMENDOIM, 2018-2032 (MIL USD)
TABELA 1354 NOZES HÍBRIDAS/OUTRAS DO BAHREIN NO MERCADO DE NOZES, POR TIPO, 2018-2032 (MIL USD)
TABELA 1355 MERCADO DE NOZES DO BAHREIN, POR FORMA, 2018-2032 (MIL USD)
TABELA 1356 MERCADO DE NOZES DO BAHREIN, POR NATUREZA, 2018-2032 (MIL USD)
TABELA 1357 MERCADO DE NOZES DO BAHREIN, POR MÉTODO DE PROCESSAMENTO, 2018-2032 (MIL USD)
TABELA 1358 MERCADO DE NOZES TORRADAS NO BAHREIN, POR TIPO, 2018-2032 (MIL USD)
TABELA 1359 MERCADO DE NOZES COM SABOR DO BAHREIN, POR TIPO, 2018-2032 (MIL USD)
TABELA 1360 MERCADO DE NOZES DO BAHREIN, POR GRAU, 2018-2032 (MIL USD)
TABELA 1361 MERCADO DE NOZES DO BAHREIN, POR VALIDADE, 2018-2032 (MIL USD)
TABELA 1362 MERCADO DE NOZES DO BAHREIN, POR CERTIFICAÇÃO, 2018-2032 (MIL USD)
TABELA 1363 MERCADO DE NOZES DO BAHREIN, POR EMBALAGEM, 2018-2032 (MIL USD)
TABELA 1364 SACOLAS PLÁSTICAS NO MERCADO DE NOZES DO BAHREIN, POR TIPO, 2018-2032 (MIL USD)
TABELA 1365 MERCADO DE NOZES DO BAHREIN, POR TAMANHO DA EMBALAGEM, 2018-2032 (MIL USD)
TABELA 1366 MERCADO DE NOZES DO BAHREIN, POR FAIXA DE PREÇO, 2018-2032 (MIL USD)
TABELA 1367 MERCADO DE NOZES DO BAHREIN, POR USO FINAL, 2018-2032 (MIL USD)
TABELA 1368 NUTRIÇÃO FUNCIONAL NO MERCADO DE NOZES DO BAHREIN, POR TIPO, 2018-2032 (MIL USD)
TABELA 1369 INDÚSTRIA DE BEBIDAS DO BAHREIN NO MERCADO DE NOZES, POR TIPO, 2018-2032 (MIL USD)
TABELA 1370 MERCADO DE NOZES CULINÁRIAS DO BAHREIN, POR TIPO, 2018-2032 (MIL USD)
TABELA 1371 PRODUTOS DE CUIDADOS PESSOAIS NO MERCADO DE NOZES DO BAHREIN, POR TIPO, 2018-2032 (MIL USD)
TABELA 1372 USOS DE BASE BIOLÓGICA E AGROINDUSTRIAIS NO MERCADO DE NOZES NO BAHREIN, POR TIPO, 2018-2032 (MIL USD)
TABELA 1373 MERCADO DE RAÇÃO ANIMAL NO BAHREIN, POR TIPO, 2018-2032 (MIL USD)
TABELA 1374 MERCADO DE NOZES DO BAHREIN, POR CANAL DE DISTRIBUIÇÃO, 2018-2032 (MIL USD)
TABELA 1375 BAHREIN B2C NO MERCADO DE NOZES, POR TIPO, 2018-2032 (MIL USD)
TABELA 1376 BAHREIN OFFLINE NO MERCADO DE NOZES, POR TIPO, 2018-2032 (MIL USD)
TABELA 1377 BAHREIN ONLINE NO MERCADO DE NOZES, POR TIPO, 2018-2032 (MIL USD)
TABELA 1378 MERCADO DE CASTANHAS DO CATAR, POR TIPO DE PRODUTO, 2018-2032 (MIL USD)
TABELA 1379 MERCADO DE CASTANHAS DO CATAR, POR TIPO DE PRODUTO, 2018-2032 (MIL TONELADAS)
TABELA 1380 NOZES DO CATAR NO MERCADO DE NOZES, POR TIPO, 2018-2032 (MIL USD)
TABELA 1381 AMIDO-DE-CASTANHA DO CATAR NO MERCADO DE CASTANHAS, POR AMENDOIM, 2018-2032 (MIL USD)
TABELA 1382 NOZES HÍBRIDAS/OUTRAS DO CATAR NO MERCADO DE NOZES, POR TIPO, 2018-2032 (MIL USD)
TABELA 1383 MERCADO DE CASTANHAS DO CATAR, POR FORMA, 2018-2032 (MIL USD)
TABELA 1384 MERCADO DE CASTANHAS DO CATAR, POR NATUREZA, 2018-2032 (MIL USD)
TABELA 1385 MERCADO DE CASTANHAS DO CATAR, POR MÉTODO DE PROCESSAMENTO, 2018-2032 (MIL USD)
TABELA 1386 MERCADO DE NOZES TORRADAS NO CATAR, POR TIPO, 2018-2032 (MIL USD)
TABELA 1387 NOZES COM SABOR DO CATAR NO MERCADO, POR TIPO, 2018-2032 (MIL USD)
TABELA 1388 MERCADO DE CASTANHAS DO CATAR, POR GRAU, 2018-2032 (MIL USD)
TABELA 1389 MERCADO DE CASTANHAS DO CATAR, POR VALIDADE, 2018-2032 (MIL USD)
TABELA 1390 MERCADO DE CASTANHAS DO CATAR, POR CERTIFICAÇÃO, 2018-2032 (MIL USD)
TABELA 1391 MERCADO DE CASTANHAS DO CATAR, POR EMBALAGEM, 2018-2032 (MIL USD)
TABELA 1392 SACHÊS PLÁSTICOS NO MERCADO DE NOZES DO CATAR, POR TIPO, 2018-2032 (MIL USD)
TABELA 1393 MERCADO DE CASTANHAS DO CATAR, POR TAMANHO DA EMBALAGEM, 2018-2032 (MIL USD)
TABELA 1394 MERCADO DE CASTANHAS DO CATAR, POR FAIXA DE PREÇO, 2018-2032 (MIL USD)
TABELA 1395 MERCADO DE CASTANHAS DO CATAR, POR USO FINAL, 2018-2032 (MIL USD)
TABELA 1396 NUTRIÇÃO FUNCIONAL NO MERCADO DE NOZES DO CATAR, POR TIPO, 2018-2032 (MIL USD)
TABELA 1397 INDÚSTRIA DE BEBIDAS DO CATAR NO MERCADO DE NOZES, POR TIPO, 2018-2032 (MIL USD)
TABELA 1398 MERCADO DE NOZES CULINÁRIAS DO CATAR, POR TIPO, 2018-2032 (MIL USD)
TABELA 1399 PRODUTOS DE CUIDADOS PESSOAIS NO MERCADO DE NOZES DO CATAR, POR TIPO, 2018-2032 (MIL USD)
TABELA 1400 USOS DE BASE BIOLÓGICA E AGROINDUSTRIAIS NO MERCADO DE NOZES DO CATAR, POR TIPO, 2018-2032 (MIL USD)
TABELA 1401 MERCADO DE RAÇÃO ANIMAL NO CATAR, POR TIPO, 2018-2032 (MIL USD)
TABELA 1402 MERCADO DE CASTANHAS DO CATAR, POR CANAL DE DISTRIBUIÇÃO, 2018-2032 (MIL USD)
TABELA 1403 MERCADO DE NOZES B2C DO CATAR, POR TIPO, 2018-2032 (MIL USD)
TABELA 1404 QATAR OFFLINE NO MERCADO DE NOZES, POR TIPO, 2018-2032 (MIL USD)
TABELA 1405 QATAR ONLINE NO MERCADO DE NOZES, POR TIPO, 2018-2032 (MIL USD)
TABELA 1406 RESTANTE DO MERCADO DE CASTANHAS DO ORIENTE MÉDIO E ÁFRICA, POR TIPO DE PRODUTO, 2018-2032 (MIL USD)
TABELA 1407 RESTANTE DO MERCADO DE CASTANHAS DO ORIENTE MÉDIO E ÁFRICA, POR TIPO DE PRODUTO, 2018-2032 (MIL TONELADAS)
TABELA 1408 MERCADO DE CASTANHAS DA AMÉRICA DO SUL, POR PAÍS, 2018-2032 (MIL USD)
TABELA 1409 MERCADO DE CASTANHAS DA AMÉRICA DO SUL, POR TIPO DE PRODUTO, 2018-2032 (MIL USD)
TABELA 1410 MERCADO DE CASTANHAS DA AMÉRICA DO SUL, POR TIPO DE PRODUTO, 2018-2032 (MIL TONELADAS)
TABELA 1411 NOZES DA AMÉRICA DO SUL NO MERCADO DE NOZES, POR TIPO, 2018-2032 (MIL USD)
TABELA 1412 AMÉRICA DO SUL - AMÊNDOAS NO MERCADO DE CASTANHAS, POR AMENDOIM, 2018-2032 (MIL USD)
TABELA 1413 AMÉRICA DO SUL HÍBRIDAS/OUTRAS NO MERCADO DE NOZES, POR TIPO, 2018-2032 (MIL USD)
TABELA 1414 MERCADO DE CASTANHAS DA AMÉRICA DO SUL, POR FORMA, 2018-2032 (MIL USD)
TABELA 1415 MERCADO DE CASTANHAS DA AMÉRICA DO SUL, POR NATUREZA, 2018-2032 (MIL USD)
TABELA 1416 MERCADO DE CASTANHAS DA AMÉRICA DO SUL, POR MÉTODO DE PROCESSAMENTO, 2018-2032 (MIL USD)
TABELA 1417 MERCADO DE NOZES TORRADAS NA AMÉRICA DO SUL, POR TIPO, 2018-2032 (USD MIL)
TABELA 1418 MERCADO DE NOZES COM SABOR DA AMÉRICA DO SUL, POR TIPO, 2018-2032 (MIL USD)
TABELA 1419 MERCADO DE CASTANHAS DA AMÉRICA DO SUL, POR GRAU, 2018-2032 (MIL USD)
TABELA 1420 MERCADO DE CASTANHAS DA AMÉRICA DO SUL, POR VALIDADE, 2018-2032 (MIL USD)
TABELA 1421 MERCADO DE CASTANHAS DA AMÉRICA DO SUL, POR CERTIFICAÇÃO, 2018-2032 (MIL USD)
TABELA 1422 MERCADO DE CASTANHAS DA AMÉRICA DO SUL, POR EMBALAGEM, 2018-2032 (MIL USD)
TABELA 1423 MERCADO DE SACOS PLÁSTICOS DE NOZES NA AMÉRICA DO SUL, POR TIPO, 2018-2032 (MIL USD)
TABELA 1424 MERCADO DE CASTANHAS DA AMÉRICA DO SUL, POR TAMANHO DA EMBALAGEM, 2018-2032 (MIL USD)
TABELA 1425 MERCADO DE CASTANHAS DA AMÉRICA DO SUL, POR FAIXA DE PREÇO, 2018-2032 (USD MIL)
TABELA 1426 MERCADO DE CASTANHAS DA AMÉRICA DO SUL, POR USO FINAL, 2018-2032 (MIL USD)
TABELA 1427 MERCADO DE NUTRIÇÃO FUNCIONAL DE NOZES NA AMÉRICA DO SUL, POR TIPO, 2018-2032 (MIL USD)
TABELA 1428 INDÚSTRIA DE BEBIDAS DA AMÉRICA DO SUL NO MERCADO DE NOZES, POR TIPO, 2018-2032 (MIL USD)
TABELA 1429 MERCADO DE NOZES CULINÁRIAS DA AMÉRICA DO SUL, POR TIPO, 2018-2032 (MIL USD)
TABELA 1430 MERCADO DE PRODUTOS DE CUIDADOS PESSOAIS NA AMÉRICA DO SUL, POR TIPO, 2018-2032 (MIL USD)
TABELA 1431 USOS DE BASE BIOLÓGICA E AGROINDUSTRIAIS NO MERCADO DE NOZES NA AMÉRICA DO SUL, POR TIPO, 2018-2032 (MIL USD)
TABELA 1432 MERCADO DE RAÇÃO ANIMAL NA AMÉRICA DO SUL, POR TIPO, 2018-2032 (MIL USD)
TABELA 1433 MERCADO DE CASTANHAS DA AMÉRICA DO SUL, POR CANAL DE DISTRIBUIÇÃO, 2018-2032 (MIL USD)
TABELA 1434 MERCADO DE NOZES B2C DA AMÉRICA DO SUL, POR TIPO, 2018-2032 (MIL USD)
TABELA 1435 AMÉRICA DO SUL OFFLINE NO MERCADO DE NOZES, POR TIPO, 2018-2032 (USD MIL)
TABELA 1436 AMÉRICA DO SUL ONLINE NO MERCADO DE NOZES, POR TIPO, 2018-2032 (USD MIL)
TABELA 1437 MERCADO DE CASTANHA-DO-PARÁ, POR TIPO DE PRODUTO, 2018-2032 (MIL USD)
TABELA 1438 MERCADO DE CASTANHA-DO-PARÁ, POR TIPO DE PRODUTO, 2018-2032 (MIL TONELADAS)
TABELA 1439 CASTANHAS DO PARÁ NO MERCADO DE CASTANHAS, POR TIPO, 2018-2032 (USD MIL)
TABELA 1440 AMÊNDOAS NO MERCADO DE CASTANHAS, POR AMENDOIM, 2018-2032 (USD MIL)
TABELA 1441 CASTANHAS HÍBRIDAS/OUTRAS NO MERCADO DE CASTANHAS, POR TIPO, 2018-2032 (USD MIL)
TABELA 1442 MERCADO DE CASTANHA-DO-PARÁ, POR FORMA, 2018-2032 (USD MIL)
TABELA 1443 MERCADO DE CASTANHA-DO-PARÁ, POR NATUREZA, 2018-2032 (USD MIL)
TABELA 1444 MERCADO DE CASTANHA-DO-PARÁ, POR MÉTODO DE PROCESSAMENTO, 2018-2032 (USD MIL)
TABELA 1445 MERCADO BRASILEIRO DE CASTANHAS TORRADAS, POR TIPO, 2018-2032 (USD MIL)
TABELA 1446 MERCADO DE NOZES COM SABOR BRASIL, POR TIPO, 2018-2032 (USD MIL)
TABELA 1447 MERCADO DE CASTANHA-DO-PARÁ, POR GRAU, 2018-2032 (MIL USD)
TABELA 1448 MERCADO DE CASTANHA-DO-PARÁ, POR VALIDADE, 2018-2032 (USD MIL)
TABELA 1449 MERCADO DE CASTANHA-DO-PARÁ, POR CERTIFICAÇÃO, 2018-2032 (USD MIL)
TABELA 1450 MERCADO DE CASTANHA-DO-PARÁ, POR EMBALAGEM, 2018-2032 (USD MIL)
TABELA 1451 MERCADO BRASILEIRO DE EMBALAGENS PLÁSTICAS DE CASTANHAS, POR TIPO, 2018-2032 (USD MIL)
TABELA 1452 MERCADO DE CASTANHA-DO-PARÁ, POR TAMANHO DE EMBALAGEM, 2018-2032 (USD MIL)
TABELA 1453 MERCADO DE CASTANHA-DO-PARÁ, POR FAIXA DE PREÇO, 2018-2032 (USD MIL)
TABELA 1454 MERCADO DE CASTANHA-DO-PARÁ, POR USO FINAL, 2018-2032 (MIL USD)
TABELA 1455 NUTRIÇÃO FUNCIONAL NO MERCADO DE NOZES NO BRASIL, POR TIPO, 2018-2032 (USD MIL)
TABELA 1456 INDÚSTRIA DE BEBIDAS NO BRASIL NO MERCADO DE NOZES, POR TIPO, 2018-2032 (USD MIL)
TABELA 1457 MERCADO CULINÁRIO BRASILEIRO DE NOZES, POR TIPO, 2018-2032 (USD MIL)
TABELA 1458 MERCADO BRASILEIRO DE PRODUTOS DE CUIDADOS PESSOAIS NO MERCADO DE NOZES, POR TIPO, 2018-2032 (USD MIL)
TABELA 1459 USOS DE BASE BIOLÓGICA E AGROINDUSTRIAIS NO MERCADO DE CASTANHAS, POR TIPO, 2018-2032 (MIL USD)
TABELA 1460 MERCADO BRASILEIRO DE RAÇÃO ANIMAL EM CASTANHAS, POR TIPO, 2018-2032 (USD MIL)
TABELA 1461 MERCADO DE CASTANHA-DO-PARÁ, POR CANAL DE DISTRIBUIÇÃO, 2018-2032 (USD MIL)
TABELA 1462 BRASIL B2C NO MERCADO DE CASTANHAS, POR TIPO, 2018-2032 (USD MIL)
TABELA 1463 BRASIL OFFLINE NO MERCADO DE CASTANHAS, POR TIPO, 2018-2032 (USD MIL)
TABELA 1464 BRASIL ONLINE NO MERCADO DE CASTANHAS, POR TIPO, 2018-2032 (USD MIL)
TABELA 1465 MERCADO DE CASTANHA DO PIMENTÃO, POR TIPO DE PRODUTO, 2018-2032 (MIL USD)
TABELA 1466 MERCADO DE CASTANHA DO PIMENTÃO, POR TIPO DE PRODUTO, 2018-2032 (MIL TONELADAS)
TABELA 1467 CASTANHAS DO CHILE NO MERCADO DE CASTANHAS, POR TIPO, 2018-2032 (MIL USD)
TABELA 1468 AMIDO-DO-CHILE NO MERCADO DE NOZES, POR AMENDOIM, 2018-2032 (MIL USD)
TABELA 1469 NOZES HÍBRIDAS/OUTRAS DO CHILE NO MERCADO DE NOZES, POR TIPO, 2018-2032 (MIL USD)
TABELA 1470 MERCADO DE CASTANHA DO PIMENTÃO, POR FORMA, 2018-2032 (MIL USD)
TABELA 1471 MERCADO DE CASTANHA DO PIMENTÃO, POR NATUREZA, 2018-2032 (MIL USD)
TABELA 1472 MERCADO DE CASTANHA DO PIMENTÃO, POR MÉTODO DE PROCESSAMENTO, 2018-2032 (MIL USD)
TABELA 1473 MERCADO DE NOZES TORRADAS NO CHILE, POR TIPO, 2018-2032 (MIL USD)
TABELA 1474 NO MERCADO DE NOZES COM SABOR DE PIMENTA, POR TIPO, 2018-2032 (MIL USD)
TABELA 1475 MERCADO DE CASTANHA DO PIMENTÃO, POR GRAU, 2018-2032 (MIL USD)
TABELA 1476 MERCADO DE CASTANHA DO PIMENTÃO, POR VALIDADE, 2018-2032 (MIL USD)
TABELA 1477 MERCADO DE CASTANHA DO PIMENTÃO, POR CERTIFICAÇÃO, 2018-2032 (MIL USD)
TABELA 1478 MERCADO DE CASTANHA DO PIMENTÃO, POR EMBALAGEM, 2018-2032 (MIL USD)
TABELA 1479 SACHÊS PLÁSTICOS DO CHILE NO MERCADO DE NOZES, POR TIPO, 2018-2032 (MIL USD)
TABELA 1480 MERCADO DE CASTANHA DO PIMENTÃO, POR TAMANHO DA EMBALAGEM, 2018-2032 (MIL USD)
TABELA 1481 MERCADO DE CASTANHA DO PIMENTÃO, POR FAIXA DE PREÇO, 2018-2032 (MIL USD)
TABELA 1482 MERCADO DE CASTANHA DO PIMENTÃO, POR USO FINAL, 2018-2032 (MIL USD)
TABELA 1483 NUTRIÇÃO FUNCIONAL NO MERCADO DE NOZES DO CHILE, POR TIPO, 2018-2032 (MIL USD)
TABELA 1484 INDÚSTRIA DE BEBIDAS DO CHILE NO MERCADO DE NOZES, POR TIPO, 2018-2032 (MIL USD)
TABELA 1485 CULINÁRIA CHILENA NO MERCADO DE NOZES, POR TIPO, 2018-2032 (MIL USD)
TABELA 1486 PRODUTOS DE CUIDADOS PESSOAIS NO MERCADO DE NOZES DO CHILE, POR TIPO, 2018-2032 (MIL USD)
TABELA 1487 USOS DE BASE BIOLÓGICA E AGROINDUSTRIAIS NO MERCADO DE NOZES, POR TIPO, 2018-2032 (MIL USD)
TABELA 1488 MERCADO DE RAÇÃO ANIMAL NO CHILE, POR TIPO, 2018-2032 (MIL USD)
TABELA 1489 MERCADO DE CASTANHA DO PIMENTÃO, POR CANAL DE DISTRIBUIÇÃO, 2018-2032 (MIL USD)
TABELA 1490 CHILE B2C NO MERCADO DE NOZES, POR TIPO, 2018-2032 (USD MIL)
TABELA 1491 CHILE OFFLINE NO MERCADO DE NOZES, POR TIPO, 2018-2032 (USD MIL)
TABELA 1492 CHILE ONLINE NO MERCADO DE NOZES, POR TIPO, 2018-2032 (USD MIL)
TABELA 1493 MERCADO DE CASTANHAS ARGENTINAS, POR TIPO DE PRODUTO, 2018-2032 (MIL USD)
TABELA 1494 MERCADO ARGENTINO DE CASTANHAS, POR TIPO DE PRODUTO, 2018-2032 (MIL TONELADAS)
TABELA 1495 NOZES ARGENTINAS NO MERCADO DE NOZES, POR TIPO, 2018-2032 (MIL USD)
TABELA 1496 ARGENTINA AMIDO NO MERCADO DE CASTANHAS, POR AMENDOIM, 2018-2032 (USD MIL)
TABELA 1497 ARGENTINA HÍBRIDAS/OUTRAS NO MERCADO DE NOZES, POR TIPO, 2018-2032 (MIL USD)
TABELA 1498 MERCADO DE CASTANHAS ARGENTINAS, POR FORMA, 2018-2032 (MIL USD)
TABELA 1499 MERCADO DE CASTANHAS ARGENTINAS, POR NATUREZA, 2018-2032 (MIL USD)
TABELA 1500 MERCADO DE CASTANHAS ARGENTINAS, POR MÉTODO DE PROCESSAMENTO, 2018-2032 (MIL USD)
TABELA 1501 ARGENTINA TORRADA NO MERCADO DE NOZES, POR TIPO, 2018-2032 (USD MIL)
TABELA 1502 MERCADO DE NOZES COM SABOR ARGENTINO, POR TIPO, 2018-2032 (USD MIL)
TABELA 1503 MERCADO DE CASTANHAS ARGENTINAS, POR GRAU, 2018-2032 (MIL USD)
TABELA 1504 MERCADO DE CASTANHAS ARGENTINAS, POR VALIDADE, 2018-2032 (MIL USD)
TABELA 1505 MERCADO DE CASTANHAS ARGENTINAS, POR CERTIFICAÇÃO, 2018-2032 (MIL USD)
TABELA 1506 MERCADO DE CASTANHAS ARGENTINAS, POR EMBALAGEM, 2018-2032 (MIL USD)
TABELA 1507 MERCADO DE SACOS PLÁSTICOS DE NOZES DA ARGENTINA, POR TIPO, 2018-2032 (MIL USD)
TABELA 1508 MERCADO ARGENTINO DE CASTANHAS, POR TAMANHO DE EMBALAGEM, 2018-2032 (MIL USD)
TABELA 1509 MERCADO DE CASTANHAS ARGENTINAS, POR FAIXA DE PREÇO, 2018-2032 (MIL USD)
TABELA 1510 MERCADO DE CASTANHAS ARGENTINAS, POR USO FINAL, 2018-2032 (MIL USD)
TABELA 1511 NUTRIÇÃO FUNCIONAL ARGENTINA NO MERCADO DE NOZES, POR TIPO, 2018-2032 (MIL USD)
TABELA 1512 INDÚSTRIA DE BEBIDAS ARGENTINA NO MERCADO DE NOZES, POR TIPO, 2018-2032 (USD MIL)
TABELA 1513 MERCADO CULINÁRIO ARGENTINO DE NOZES, POR TIPO, 2018-2032 (USD MIL)
TABELA 1514 MERCADO DE PRODUTOS DE CUIDADOS PESSOAIS NA ARGENTINA, POR TIPO, 2018-2032 (MIL USD)
TABELA 1515 USOS DE BASE BIOLÓGICA E AGROINDUSTRIAIS NO MERCADO DE NOZES DA ARGENTINA, POR TIPO, 2018-2032 (MIL USD)
TABELA 1516 MERCADO ARGENTINO DE RAÇÃO ANIMAL EM CASTANHAS, POR TIPO, 2018-2032 (USD MIL)
TABELA 1517 MERCADO DE CASTANHAS ARGENTINAS, POR CANAL DE DISTRIBUIÇÃO, 2018-2032 (MIL USD)
TABELA 1518 ARGENTINA B2C NO MERCADO DE NOZES, POR TIPO, 2018-2032 (USD MIL)
TABELA 1519 ARGENTINA OFFLINE NO MERCADO DE NOZES, POR TIPO, 2018-2032 (USD MIL)
TABELA 1520 ARGENTINA ONLINE NO MERCADO DE NOZES, POR TIPO, 2018-2032 (USD MIL)
TABELA 1521 MERCADO DE CASTANHA DO PERU, POR TIPO DE PRODUTO, 2018-2032 (MIL USD)
TABELA 1522 MERCADO DE CASTANHA DO PERU, POR TIPO DE PRODUTO, 2018-2032 (MIL TONELADAS)
TABELA 1523 CASTANHAS DO PERU NO MERCADO DE CASTANHAS, POR TIPO, 2018-2032 (MIL USD)
TABELA 1524 AMIDO DO PERU NO MERCADO DE CASTANHAS, POR AMENDOIM, 2018-2032 (MIL USD)
TABELA 1525 PERU HÍBRIDO/OUTRAS NOZES NO MERCADO DE NOZES, POR TIPO, 2018-2032 (MIL USD)
TABELA 1526 MERCADO DE CASTANHA DO PERU, POR FORMA, 2018-2032 (MIL USD)
TABELA 1527 MERCADO DE CASTANHA DO PERU, POR NATUREZA, 2018-2032 (MIL USD)
TABELA 1528 MERCADO DE CASTANHA DO PERU, POR MÉTODO DE PROCESSAMENTO, 2018-2032 (MIL USD)
TABELA 1529 PERU TORRADO NO MERCADO DE NOZES, POR TIPO, 2018-2032 (USD MIL)
TABELA 1530 MERCADO DE NOZES COM SABOR DO PERU, POR TIPO, 2018-2032 (USD MIL)
TABELA 1531 MERCADO DE CASTANHA DO PERU, POR GRAU, 2018-2032 (MIL USD)
TABELA 1532 MERCADO DE CASTANHA DO PERU, POR VALIDADE, 2018-2032 (MIL USD)
TABELA 1533 MERCADO DE CASTANHA DO PERU, POR CERTIFICAÇÃO, 2018-2032 (MIL USD)
TABELA 1534 MERCADO DE CASTANHA DO PERU, POR EMBALAGEM, 2018-2032 (MIL USD)
TABELA 1535 PERU EMBALAGENS PLÁSTICAS NO MERCADO DE NOZES, POR TIPO, 2018-2032 (USD MIL)
TABELA 1536 MERCADO DE CASTANHA DO PERU, POR TAMANHO DA EMBALAGEM, 2018-2032 (MIL USD)
TABELA 1537 MERCADO DE CASTANHA DO PERU, POR FAIXA DE PREÇO, 2018-2032 (MIL USD)
TABELA 1538 MERCADO DE CASTANHA DO PERU, POR USO FINAL, 2018-2032 (MIL USD)
TABELA 1539 PERU NUTRIÇÃO FUNCIONAL NO MERCADO DE NOZES, POR TIPO, 2018-2032 (MIL USD)
TABELA 1540 INDÚSTRIA DE BEBIDAS DO PERU NO MERCADO DE NOZES, POR TIPO, 2018-2032 (MIL USD)
TABELA 1541 MERCADO CULINÁRIO DE NOZES DO PERU, POR TIPO, 2018-2032 (MIL USD)
TABELA 1542 PRODUTOS DE CUIDADOS PESSOAIS NO MERCADO DE NOZES NO PERU, POR TIPO, 2018-2032 (MIL USD)
TABELA 1543 USOS DE BASE BIOLÓGICA E AGROINDUSTRIAIS NO MERCADO DE NOZES NO PERU, POR TIPO, 2018-2032 (MIL USD)
TABELA 1544 MERCADO DE RAÇÃO ANIMAL NO PERU, POR TIPO, 2018-2032 (MIL USD)
TABELA 1545 MERCADO DE CASTANHA DO PERU, POR CANAL DE DISTRIBUIÇÃO, 2018-2032 (MIL USD)
TABELA 1546 PERU B2C NO MERCADO DE NOZES, POR TIPO, 2018-2032 (MIL USD)
TABELA 1547 PERU OFFLINE NO MERCADO DE CASTANHAS, POR TIPO, 2018-2032 (USD MIL)
TABELA 1548 PERU ONLINE NO MERCADO DE NOZES, POR TIPO, 2018-2032 (USD MIL)
TABELA 1549 MERCADO DE CASTANHA-DA-COLÔMBIA, POR TIPO DE PRODUTO, 2018-2032 (MIL USD)
TABELA 1550 MERCADO DE CASTANHA-DA-COLÔMBIA, POR TIPO DE PRODUTO, 2018-2032 (MIL TONELADAS)
TABELA 1551 NOZES DA COLÔMBIA NO MERCADO DE NOZES, POR TIPO, 2018-2032 (MIL USD)
TABELA 1552 AMIDO-DA-COLÔMBIA NO MERCADO DE NOZES, POR AMENDOIM, 2018-2032 (MIL USD)
TABELA 1553 NOZES HÍBRIDAS/OUTRAS DA COLÔMBIA NO MERCADO DE NOZES, POR TIPO, 2018-2032 (MIL USD)
TABELA 1554 MERCADO DE CASTANHA-DA-COLÔMBIA, POR FORMA, 2018-2032 (MIL USD)
TABELA 1555 MERCADO DE CASTANHA DA COLÔMBIA, POR NATUREZA, 2018-2032 (MIL USD)
TABELA 1556 MERCADO DE CASTANHA-DA-COLÔMBIA, POR MÉTODO DE PROCESSAMENTO, 2018-2032 (MIL USD)
TABELA 1557 COLÔMBIA TORRADA NO MERCADO DE NOZES, POR TIPO, 2018-2032 (USD MIL)
TABELA 1558 MERCADO DE NOZES COM SABOR COLÔMBIA, POR TIPO, 2018-2032 (MIL USD)
TABELA 1559 MERCADO DE CASTANHA-DA-COLÔMBIA, POR GRAU, 2018-2032 (MIL USD)
TABELA 1560 MERCADO DE CASTANHA-DA-COLÔMBIA, POR VALIDADE, 2018-2032 (MIL USD)
TABELA 1561 MERCADO DE CASTANHA-DA-COLÔMBIA, POR CERTIFICAÇÃO, 2018-2032 (MIL USD)
TABELA 1562 MERCADO DE CASTANHAS DA COLÔMBIA, POR EMBALAGEM, 2018-2032 (MIL USD)
TABELA 1563 COLÔMBIA EMBALAGENS PLÁSTICAS NO MERCADO DE NOZES, POR TIPO, 2018-2032 (USD MIL)
TABELA 1564 MERCADO DE CASTANHAS DA COLÔMBIA, POR TAMANHO DA EMBALAGEM, 2018-2032 (MIL USD)
TABELA 1565 MERCADO DE CASTANHA-DA-COLÔMBIA, POR FAIXA DE PREÇO, 2018-2032 (MIL USD)
TABELA 1566 MERCADO DE CASTANHA-DA-COLÔMBIA, POR USO FINAL, 2018-2032 (MIL USD)
TABELA 1567 NUTRIÇÃO FUNCIONAL NO MERCADO DE NOZES DA COLÔMBIA, POR TIPO, 2018-2032 (MIL USD)
TABELA 1568 INDÚSTRIA DE BEBIDAS DA COLÔMBIA NO MERCADO DE NOZES, POR TIPO, 2018-2032 (MIL USD)
TABELA 1569 MERCADO CULINÁRIO DE NOZES DA COLÔMBIA, POR TIPO, 2018-2032 (MIL USD)
TABELA 1570 MERCADO DE PRODUTOS DE CUIDADOS PESSOAIS NA COLÔMBIA, POR TIPO, 2018-2032 (MIL USD)
TABELA 1571 USOS DE BASE BIOLÓGICA E AGROINDUSTRIAIS NO MERCADO DE NOZES, POR TIPO, 2018-2032 (MIL USD)
TABELA 1572 MERCADO DE RAÇÃO ANIMAL NA COLÔMBIA, POR TIPO, 2018-2032 (MIL USD)
TABELA 1573 MERCADO DE CASTANHA-DA-COLÔMBIA, POR CANAL DE DISTRIBUIÇÃO, 2018-2032 (MIL USD)
TABELA 1574 COLÔMBIA B2C NO MERCADO DE NOZES, POR TIPO, 2018-2032 (MIL USD)
TABELA 1575 COLÔMBIA OFFLINE NO MERCADO DE NOZES, POR TIPO, 2018-2032 (USD MIL)
TABELA 1576 COLÔMBIA ONLINE NO MERCADO DE NOZES, POR TIPO, 2018-2032 (USD MIL)
TABELA 1577 MERCADO DE CASTANHA DA BOLÍVIA, POR TIPO DE PRODUTO, 2018-2032 (MIL USD)
TABELA 1578 MERCADO DE CASTANHA DA BOLÍVIA, POR TIPO DE PRODUTO, 2018-2032 (MIL TONELADAS)
TABELA 1579 NOZES DA BOLÍVIA NO MERCADO DE NOZES, POR TIPO, 2018-2032 (MIL USD)
TABELA 1580 AMIDO DA BOLÍVIA NO MERCADO DE CASTANHAS, POR AMENDOIM, 2018-2032 (MIL USD)
TABELA 1581 NOZES HÍBRIDAS/OUTRAS DA BOLÍVIA NO MERCADO DE NOZES, POR TIPO, 2018-2032 (MIL USD)
TABELA 1582 MERCADO DE CASTANHA DA BOLÍVIA, POR FORMA, 2018-2032 (MIL USD)
TABELA 1583 MERCADO DE CASTANHA DA BOLÍVIA, POR NATUREZA, 2018-2032 (MIL USD)
TABELA 1584 MERCADO DE CASTANHA DA BOLÍVIA, POR MÉTODO DE PROCESSAMENTO, 2018-2032 (MIL USD)
TABELA 1585 MERCADO DE CASTANHAS TORRADAS DA BOLÍVIA, POR TIPO, 2018-2032 (USD MIL)
TABELA 1586 MERCADO DE NOZES COM SABOR DA BOLÍVIA, POR TIPO, 2018-2032 (MIL USD)
TABELA 1587 MERCADO DE CASTANHA DA BOLÍVIA, POR GRAU, 2018-2032 (MIL USD)
TABELA 1588 MERCADO DE CASTANHA DA BOLÍVIA, POR VALIDADE, 2018-2032 (MIL USD)
TABELA 1589 MERCADO DE CASTANHA DA BOLÍVIA, POR CERTIFICAÇÃO, 2018-2032 (MIL USD)
TABELA 1590 MERCADO DE CASTANHAS DA BOLÍVIA, POR EMBALAGEM, 2018-2032 (MIL USD)
TABELA 1591 BOLÍVIA EMBALAGENS PLÁSTICAS NO MERCADO DE NOZES, POR TIPO, 2018-2032 (MIL USD)
TABELA 1592 MERCADO DE CASTANHAS DA BOLÍVIA, POR TAMANHO DA EMBALAGEM, 2018-2032 (MIL USD)
TABELA 1593 MERCADO DE CASTANHA DA BOLÍVIA, POR FAIXA DE PREÇO, 2018-2032 (MIL USD)
TABELA 1594 MERCADO DE CASTANHA DA BOLÍVIA, POR USO FINAL, 2018-2032 (MIL USD)
TABELA 1595 BOLÍVIA NUTRIÇÃO FUNCIONAL NO MERCADO DE NOZES, POR TIPO, 2018-2032 (MIL USD)
TABELA 1596 INDÚSTRIA DE BEBIDAS DA BOLÍVIA NO MERCADO DE NOZES, POR TIPO, 2018-2032 (MIL USD)
TABELA 1597 MERCADO CULINÁRIO DE NOZES DA BOLÍVIA, POR TIPO, 2018-2032 (MIL USD)
TABELA 1598 PRODUTOS DE CUIDADOS PESSOAIS NO MERCADO DE NOZES DA BOLÍVIA, POR TIPO, 2018-2032 (MIL USD)
TABELA 1599 USOS DE BASE BIOLÓGICA E AGROINDUSTRIAIS NO MERCADO DE NOZES DA BOLÍVIA, POR TIPO, 2018-2032 (MIL USD)
TABELA 1600 MERCADO DE RAÇÃO ANIMAL NA BOLÍVIA, POR TIPO, 2018-2032 (MIL USD)
TABELA 1601 MERCADO DE CASTANHA DA BOLÍVIA, POR CANAL DE DISTRIBUIÇÃO, 2018-2032 (MIL USD)
TABELA 1602 BOLÍVIA B2C NO MERCADO DE NOZES, POR TIPO, 2018-2032 (MIL USD)
TABELA 1603 BOLÍVIA OFFLINE NO MERCADO DE NOZES, POR TIPO, 2018-2032 (USD MIL)
TABELA 1604 BOLÍVIA ONLINE NO MERCADO DE NOZES, POR TIPO, 2018-2032 (USD MIL)
TABELA 1605 MERCADO DE CASTANHAS DO EQUADOR, POR TIPO DE PRODUTO, 2018-2032 (MIL USD)
TABELA 1606 MERCADO DE CASTANHAS DO EQUADOR, POR TIPO DE PRODUTO, 2018-2032 (MIL TONELADAS)
TABELA 1607 NOZES DO EQUADOR NO MERCADO DE NOZES, POR TIPO, 2018-2032 (MIL USD)
TABELA 1608 AMIDO DO EQUADOR NO MERCADO DE NOZES, POR AMENDOIM, 2018-2032 (MIL USD)
TABELA 1609 NOZES HÍBRIDAS/OUTRAS DO EQUADOR NO MERCADO DE NOZES, POR TIPO, 2018-2032 (MIL USD)
TABELA 1610 MERCADO DE CASTANHAS DO EQUADOR, POR FORMA, 2018-2032 (MIL USD)
TABELA 1611 MERCADO DE CASTANHAS DO EQUADOR, POR NATUREZA, 2018-2032 (MIL USD)
TABELA 1612 MERCADO DE CASTANHAS DO EQUADOR, POR MÉTODO DE PROCESSAMENTO, 2018-2032 (MIL USD)
TABELA 1613 MERCADO DE NOZES TORRADAS NO EQUADOR, POR TIPO, 2018-2032 (MIL USD)
TABELA 1614 MERCADO DE NOZES COM SABOR DO EQUADOR, POR TIPO, 2018-2032 (MIL USD)
TABELA 1615 MERCADO DE CASTANHAS DO EQUADOR, POR GRAU, 2018-2032 (MIL USD)
TABELA 1616 MERCADO DE CASTANHAS DO EQUADOR, POR VALIDADE, 2018-2032 (MIL USD)
TABELA 1617 MERCADO DE CASTANHAS DO EQUADOR, POR CERTIFICAÇÃO, 2018-2032 (MIL USD)
TABELA 1618 MERCADO DE CASTANHAS DO EQUADOR, POR EMBALAGEM, 2018-2032 (MIL USD)
TABELA 1619 SACHÊS PLÁSTICOS NO MERCADO DE NOZES DO EQUADOR, POR TIPO, 2018-2032 (MIL USD)
TABELA 1620 MERCADO DE CASTANHAS DO EQUADOR, POR TAMANHO DA EMBALAGEM, 2018-2032 (MIL USD)
TABELA 1621 MERCADO DE CASTANHAS DO EQUADOR, POR FAIXA DE PREÇO, 2018-2032 (MIL USD)
TABELA 1622 MERCADO DE CASTANHAS DO EQUADOR, POR USO FINAL, 2018-2032 (MIL USD)
TABELA 1623 NUTRIÇÃO FUNCIONAL NO MERCADO DE NOZES DO EQUADOR, POR TIPO, 2018-2032 (MIL USD)
TABELA 1624 INDÚSTRIA DE BEBIDAS DO EQUADOR NO MERCADO DE NOZES, POR TIPO, 2018-2032 (MIL USD)
TABELA 1625 MERCADO CULINÁRIO DE NOZES DO EQUADOR, POR TIPO, 2018-2032 (MIL USD)
TABELA 1626 MERCADO DE PRODUTOS DE CUIDADOS PESSOAIS NO EQUADOR, POR TIPO, 2018-2032 (MIL USD)
TABELA 1627 USOS DE BASE BIOLÓGICA E AGROINDUSTRIAIS NO MERCADO DE NOZES NO EQUADOR, POR TIPO, 2018-2032 (MIL USD)
TABELA 1628 MERCADO DE RAÇÃO ANIMAL NO EQUADOR, POR TIPO, 2018-2032 (MIL USD)
TABELA 1629 MERCADO DE CASTANHAS DO EQUADOR, POR CANAL DE DISTRIBUIÇÃO, 2018-2032 (MIL USD)
TABELA 1630 EQUADOR B2C NO MERCADO DE NOZES, POR TIPO, 2018-2032 (MIL USD)
TABELA 1631 EQUADOR OFFLINE NO MERCADO DE NOZES, POR TIPO, 2018-2032 (MIL USD)
TABELA 1632 EQUADOR ONLINE NO MERCADO DE NOZES, POR TIPO, 2018-2032 (USD MIL)
TABELA 1633 MERCADO DE CASTANHAS DO PARAGUAI, POR TIPO DE PRODUTO, 2018-2032 (MIL USD)
TABELA 1634 MERCADO DE CASTANHAS DO PARAGUAI, POR TIPO DE PRODUTO, 2018-2032 (MIL TONELADAS)
TABELA 1635 NOZES DO PARAGUAI NO MERCADO DE NOZES, POR TIPO, 2018-2032 (MIL USD)
TABELA 1636 AMIDO DO PARAGUAI NO MERCADO DE CASTANHAS, POR AMENDOIM, 2018-2032 (MIL USD)
TABELA 1637 NOZES HÍBRIDAS/OUTRAS DO PARAGUAI NO MERCADO DE NOZES, POR TIPO, 2018-2032 (MIL USD)
TABELA 1638 MERCADO DE CASTANHAS DO PARAGUAI, POR FORMA, 2018-2032 (MIL USD)
TABELA 1639 MERCADO DE CASTANHAS DO PARAGUAI, POR NATUREZA, 2018-2032 (MIL USD)
TABELA 1640 MERCADO DE CASTANHAS DO PARAGUAI, POR MÉTODO DE PROCESSAMENTO, 2018-2032 (MIL USD)
TABELA 1641 PARAGUAI TORRADO NO MERCADO DE NOZES, POR TIPO, 2018-2032 (USD MIL)
TABELA 1642 MERCADO DE NOZES COM SABOR PARAGUAI, POR TIPO, 2018-2032 (MIL USD)
TABELA 1643 MERCADO DE CASTANHAS DO PARAGUAI, POR GRAU, 2018-2032 (MIL USD)
TABELA 1644 MERCADO DE CASTANHAS DO PARAGUAI, POR VALIDADE, 2018-2032 (MIL USD)
TABELA 1645 MERCADO DE CASTANHAS DO PARAGUAI, POR CERTIFICAÇÃO, 2018-2032 (MIL USD)
TABELA 1646 MERCADO DE CASTANHAS DO PARAGUAI, POR EMBALAGEM, 2018-2032 (MIL USD)
TABELA 1647 SACHÊS PLÁSTICOS DO PARAGUAI NO MERCADO DE NOZES, POR TIPO, 2018-2032 (MIL USD)
TABELA 1648 MERCADO DE CASTANHAS DO PARAGUAI, POR TAMANHO DE EMBALAGEM, 2018-2032 (MIL USD)
TABELA 1649 MERCADO DE CASTANHAS DO PARAGUAI, POR FAIXA DE PREÇO, 2018-2032 (MIL USD)
TABELA 1650 MERCADO DE CASTANHAS DO PARAGUAI, POR USO FINAL, 2018-2032 (MIL USD)
TABELA 1651 PARAGUAI NUTRIÇÃO FUNCIONAL NO MERCADO DE NOZES, POR TIPO, 2018-2032 (USD MIL)
TABELA 1652 INDÚSTRIA DE BEBIDAS DO PARAGUAI NO MERCADO DE NOZES, POR TIPO, 2018-2032 (MIL USD)
TABELA 1653 MERCADO DE NOZES CULINÁRIAS DO PARAGUAI, POR TIPO, 2018-2032 (MIL USD)
TABELA 1654 PRODUTOS DE CUIDADOS PESSOAIS NO MERCADO DE NOZES DO PARAGUAI, POR TIPO, 2018-2032 (MIL USD)
TABELA 1655 USOS DE BASE BIOLÓGICA E AGROINDUSTRIAIS NO MERCADO DE NOZES DO PARAGUAI, POR TIPO, 2018-2032 (MIL USD)
TABELA 1656 MERCADO DE RAÇÃO ANIMAL NO PARAGUAI, POR TIPO, 2018-2032 (MIL USD)
TABELA 1657 MERCADO DE CASTANHAS DO PARAGUAI, POR CANAL DE DISTRIBUIÇÃO, 2018-2032 (MIL USD)
TABELA 1658 PARAGUAI B2C NO MERCADO DE NOZES, POR TIPO, 2018-2032 (USD MIL)
TABELA 1659 PARAGUAI OFFLINE NO MERCADO DE NOZES, POR TIPO, 2018-2032 (USD MIL)
TABELA 1660 PARAGUAI ONLINE NO MERCADO DE NOZES, POR TIPO, 2018-2032 (USD MIL)
TABELA 1661 MERCADO DE CASTANHAS DO URUGUAI, POR TIPO DE PRODUTO, 2018-2032 (MIL USD)
TABELA 1662 MERCADO DE CASTANHAS DO URUGUAI, POR TIPO DE PRODUTO, 2018-2032 (MIL TONELADAS)
TABELA 1663 NOZES DO URUGUAI NO MERCADO DE NOZES, POR TIPO, 2018-2032 (MIL USD)
TABELA 1664 AMIDO DO URUGUAI NO MERCADO DE CASTANHAS, POR AMENDOIM, 2018-2032 (MIL USD)
TABELA 1665 NOZES HÍBRIDAS/OUTRAS DO URUGUAI NO MERCADO DE NOZES, POR TIPO, 2018-2032 (MIL USD)
TABELA 1666 MERCADO DE CASTANHAS DO URUGUAI, POR FORMA, 2018-2032 (MIL USD)
TABELA 1667 MERCADO DE CASTANHAS DO URUGUAI, POR NATUREZA, 2018-2032 (MIL USD)
TABELA 1668 MERCADO DE CASTANHAS DO URUGUAI, POR MÉTODO DE PROCESSAMENTO, 2018-2032 (MIL USD)
TABELA 1669 URUGUAI TORRADO NO MERCADO DE NOZES, POR TIPO, 2018-2032 (USD MIL)
TABELA 1670 MERCADO DE NOZES COM SABOR DO URUGUAI, POR TIPO, 2018-2032 (MIL USD)
TABELA 1671 MERCADO DE CASTANHAS DO URUGUAI, POR GRAU, 2018-2032 (MIL USD)
TABELA 1672 MERCADO DE CASTANHAS DO URUGUAI, POR VALIDADE, 2018-2032 (MIL USD)
TABELA 1673 MERCADO DE CASTANHAS DO URUGUAI, POR CERTIFICAÇÃO, 2018-2032 (MIL USD)
TABELA 1674 MERCADO DE CASTANHAS DO URUGUAI, POR EMBALAGEM, 2018-2032 (MIL USD)
TABELA 1675 SACHÊS PLÁSTICOS DO URUGUAI NO MERCADO DE NOZES, POR TIPO, 2018-2032 (MIL USD)
TABELA 1676 MERCADO DE CASTANHAS DO URUGUAI, POR TAMANHO DA EMBALAGEM, 2018-2032 (MIL USD)
TABELA 1677 MERCADO DE CASTANHAS DO URUGUAI, POR FAIXA DE PREÇO, 2018-2032 (MIL USD)
TABELA 1678 MERCADO DE CASTANHAS DO URUGUAI, POR USO FINAL, 2018-2032 (MIL USD)
TABELA 1679 NUTRIÇÃO FUNCIONAL NO MERCADO DE NOZES DO URUGUAI, POR TIPO, 2018-2032 (MIL USD)
TABELA 1680 INDÚSTRIA DE BEBIDAS DO URUGUAI NO MERCADO DE NOZES, POR TIPO, 2018-2032 (MIL USD)
TABELA 1681 MERCADO CULINÁRIO DE NOZES DO URUGUAI, POR TIPO, 2018-2032 (MIL USD)
TABELA 1682 PRODUTOS DE CUIDADOS PESSOAIS NO MERCADO DE NOZES DO URUGUAI, POR TIPO, 2018-2032 (MIL USD)
TABELA 1683 USOS DE BASE BIOLÓGICA E AGROINDUSTRIAIS NO MERCADO DE NOZES, POR TIPO, 2018-2032 (MIL USD)
TABELA 1684 MERCADO DE RAÇÃO ANIMAL NO URUGUAI, POR TIPO, 2018-2032 (MIL USD)
TABELA 1685 MERCADO DE CASTANHAS DO URUGUAI, POR CANAL DE DISTRIBUIÇÃO, 2018-2032 (MIL USD)
TABELA 1686 URUGUAI B2C NO MERCADO DE NOZES, POR TIPO, 2018-2032 (MIL USD)
TABELA 1687 URUGUAI OFFLINE NO MERCADO DE NOZES, POR TIPO, 2018-2032 (USD MIL)
TABELA 1688 URUGUAI ONLINE NO MERCADO DE NOZES, POR TIPO, 2018-2032 (USD MIL)
TABELA 1689 MERCADO DE CASTANHA DA VENEZUELA, POR TIPO DE PRODUTO, 2018-2032 (MIL USD)
TABELA 1690 MERCADO DE CASTANHA DA VENEZUELA, POR TIPO DE PRODUTO, 2018-2032 (MIL TONELADAS)
TABELA 1691 NOZES DA VENEZUELA NO MERCADO DE NOZES, POR TIPO, 2018-2032 (MIL USD)
TABELA 1692 AMIDO DA VENEZUELA NO MERCADO DE NOZES, POR AMENDOIM, 2018-2032 (MIL USD)
TABELA 1693 NOZES HÍBRIDAS/OUTRAS DA VENEZUELA NO MERCADO DE NOZES, POR TIPO, 2018-2032 (MIL USD)
TABELA 1694 MERCADO DE CASTANHA DA VENEZUELA, POR FORMA, 2018-2032 (MIL USD)
TABELA 1695 MERCADO DE CASTANHA DA VENEZUELA, POR NATUREZA, 2018-2032 (MIL USD)
TABELA 1696 MERCADO DE CASTANHA DA VENEZUELA, POR MÉTODO DE PROCESSAMENTO, 2018-2032 (MIL USD)
TABELA 1697 VENEZUELA TORRADA NO MERCADO DE NOZES, POR TIPO, 2018-2032 (USD MIL)
TABELA 1698 SABOR VENEZUELA NO MERCADO DE NOZES, POR TIPO, 2018-2032 (USD MIL)
TABELA 1699 MERCADO DE CASTANHA DA VENEZUELA, POR GRAU, 2018-2032 (MIL USD)
TABELA 1700 MERCADO DE CASTANHA DA VENEZUELA, POR VALIDADE, 2018-2032 (MIL USD)
TABELA 1701 MERCADO DE CASTANHA DA VENEZUELA, POR CERTIFICAÇÃO, 2018-2032 (MIL USD)
TABELA 1702 MERCADO DE CASTANHAS DA VENEZUELA, POR EMBALAGEM, 2018-2032 (MIL USD)
TABELA 1703 SACHÊS PLÁSTICOS DA VENEZUELA NO MERCADO DE NOZES, POR TIPO, 2018-2032 (USD MIL)
TABELA 1704 MERCADO DE CASTANHAS DA VENEZUELA, POR TAMANHO DA EMBALAGEM, 2018-2032 (MIL USD)
TABELA 1705 MERCADO DE CASTANHA DA VENEZUELA, POR FAIXA DE PREÇO, 2018-2032 (MIL USD)
TABELA 1706 MERCADO DE CASTANHA DA VENEZUELA, POR USO FINAL, 2018-2032 (MIL USD)
TABELA 1707 NUTRIÇÃO FUNCIONAL NO MERCADO DE NOZES DA VENEZUELA, POR TIPO, 2018-2032 (MIL USD)
TABELA 1708 INDÚSTRIA DE BEBIDAS DA VENEZUELA NO MERCADO DE NOZES, POR TIPO, 2018-2032 (MIL USD)
TABELA 1709 MERCADO CULINÁRIO VENEZUELANO DE NOZES, POR TIPO, 2018-2032 (USD MIL)
TABELA 1710 PRODUTOS DE CUIDADOS PESSOAIS NO MERCADO DE NOZES DA VENEZUELA, POR TIPO, 2018-2032 (MIL USD)
TABELA 1711 USOS DE BASE BIOLÓGICA E AGROINDUSTRIAIS NO MERCADO DE NOZES DA VENEZUELA, POR TIPO, 2018-2032 (MIL USD)
TABELA 1712 MERCADO DE RAÇÃO ANIMAL NA VENEZUELA, POR TIPO, 2018-2032 (MIL USD)
TABELA 1713 MERCADO DE CASTANHA DA VENEZUELA, POR CANAL DE DISTRIBUIÇÃO, 2018-2032 (MIL USD)
TABELA 1714 VENEZUELA B2C NO MERCADO DE NOZES, POR TIPO, 2018-2032 (USD MIL)
TABELA 1715 VENEZUELA OFFLINE NO MERCADO DE NOZES, POR TIPO, 2018-2032 (USD MIL)
TABELA 1716 VENEZUELA ONLINE NO MERCADO DE NOZES, POR TIPO, 2018-2032 (USD MIL)
TABELA 1717 MERCADO DE CASTANHAS DO RESTO DA AMÉRICA DO SUL, POR TIPO DE PRODUTO, 2018-2032 (MIL USD)
TABELA 1718 MERCADO DE CASTANHAS DO RESTO DA AMÉRICA DO SUL, POR TIPO DE PRODUTO, 2018-2032 (MIL TONELADAS)
Lista de Figura
FIGURA 1 MERCADO GLOBAL DE NOZES
FIGURA 2 MERCADO GLOBAL DE NOZES: TRIANGULAÇÃO DE DADOS
FIGURA 3 MERCADO GLOBAL DE NOZES: ANÁLISE DROC
FIGURA 4 MERCADO GLOBAL DE NOZES: ANÁLISE DE MERCADO GLOBAL VS. REGIONAL
FIGURA 5 MERCADO GLOBAL DE NOZES: ANÁLISE DE PESQUISA DA EMPRESA
FIGURA 6 MERCADO GLOBAL DE NOZES: MODELAGEM MULTIVARIADA
FIGURA 7 CURVA DO TEMPO DO MERCADO GLOBAL DE NOZES
FIGURA 8 MERCADO GLOBAL DE NOZES: DEMOGRAFIA DA ENTREVISTA
FIGURA 9 MERCADO GLOBAL DE NOZES: GRADE DE POSIÇÃO DE MERCADO DBMR
FIGURA 10 MERCADO GLOBAL DE NOZES: GRADE DE COBERTURA DE USO FINAL DO MERCADO
FIGURA 11 MERCADO GLOBAL DE NOZES: ANÁLISE DA PARTICIPAÇÃO DOS FORNECEDORES
FIGURA 12 MERCADO GLOBAL DE NOZES: SEGMENTAÇÃO
FIGURA 13 RESUMO EXECUTIVO
FIGURA 14 DESENVOLVIMENTO ESTRATÉGICO DO MERCADO GLOBAL DE NOZES
FIGURA 15 QUATRO SEGMENTOS COMPREENDEM O MERCADO GLOBAL DE NOZES, POR TIPO DE PRODUTO
FIGURA 16 A AMÉRICA DO NORTE DEVE DOMINA O MERCADO GLOBAL DE NOZES, E A ÁSIA-PACÍFICO DEVE CRESCER COM O MAIOR CAGR NO PERÍODO PREVISTO
FIGURA 17 A CRESCENTE TENDÊNCIA GLOBAL EM DIREÇÃO A LANCHES MAIS SAUDÁVEIS E ESCOLHAS NUTRITIVAS DEVE IMPULSIONAR O MERCADO GLOBAL DE NOZES NO PERÍODO PREVISTO
FIGURA 18 O SEGMENTO DE NOZES DEVE SER REPRESENTANTE DA MAIOR PARCIALIDADE DO MERCADO GLOBAL DE NOZES EM 2025 E 2032
FIGURA 19 A ÁSIA-PACÍFICO É O MERCADO DE CRESCIMENTO MAIS RÁPIDO PARA O MERCADO GLOBAL DE NOZES NO PERÍODO PREVISTO
FIGURA 20 CADEIA DE VALOR DO MERCADO DE NOZES
FIGURA 21 ANÁLISE DA CADEIA DE SUPRIMENTOS DO MERCADO DE NOZES
FIGURA 22 NÚMERO TOTAL DE NEGÓCIOS
FIGURA 23 NEGÓCIOS POR TIPO
FIGURA 24 NEGÓCIOS POR SEGMENTO
FIGURA 25 PERSPECTIVAS DA CAPACIDADE DE PRODUÇÃO
FIGURA 26 VISÃO GERAL DO PRODUTO E DA MARCA
FIGURA 27 FAMÍLIAS DE PATENTES
FIGURA 28 FAMÍLIAS DE PATENTES
FIGURA 29 QUADRANTE DE AVALIAÇÃO DE EMPRESAS
FIGURA 30 ANÁLISE DE TENDÊNCIAS DE PREÇOS, 2018-2032 (USD/KG)
FIGURA 31 ÍNDICE DE EXPORTAÇÃO DE CASTANHAS DO PROJETO TRÊS (2021-2025)
FIGURA 32 ANÁLISE DROC
FIGURA 33 FREQUÊNCIA DE CONSUMO DE NOZES
FIGURA 34 MERCADO GLOBAL DE NOZES: POR TIPO DE PRODUTO, 2024
FIGURA 35 MERCADO GLOBAL DE NOZES: FORMA, 2024
FIGURA 36 MERCADO GLOBAL DE NOZES: POR NATUREZA, 2024
FIGURA 37 MERCADO GLOBAL DE NOZES: POR MÉTODO DE PROCESSAMENTO, 2024
FIGURA 38 MERCADO GLOBAL DE NOZES: POR GRAU, 2024
FIGURA 39 MERCADO GLOBAL DE NOZES: POR VALIDADE, 2024
FIGURA 40 MERCADO GLOBAL DE NOZES: POR CERTIFICAÇÃO, 2024
FIGURA 41 MERCADO GLOBAL DE NOZES: EMBALAGEM, 2024
FIGURA 42 MERCADO GLOBAL DE NOZES: POR TAMANHO DE EMBALAGEM, 2024
FIGURA 43 MERCADO GLOBAL DE NOZES: POR FAIXA DE PREÇO, 2024
FIGURA 44 MERCADO GLOBAL DE NOZES: POR USO FINAL, 2024
FIGURA 45 MERCADO GLOBAL DE NOZES: POR CANAL DE DISTRIBUIÇÃO, 2024
FIGURA 46 MERCADO GLOBAL DE NOZES: EM INSTANTÂNEO
FIGURA 47 MERCADO DE CASTANHAS DA AMÉRICA DO NORTE: POR INSTANTÂNEO
FIGURA 48 MERCADO DE CASTANHAS DA EUROPA: POR INSTANTÂNEO
FIGURA 49 MERCADO DE CASTANHAS DA ÁSIA-PACÍFICO: EM INSTANTÂNEO
FIGURA 50 MERCADO DE CASTANHAS DO ORIENTE MÉDIO E ÁFRICA
FIGURA 51 MERCADO DE CASTANHAS DA AMÉRICA DO SUL
FIGURA 52 MERCADO GLOBAL DE NOZES: PARTICIPAÇÃO DA EMPRESA 2024 (%)
FIGURA 53 MERCADO DE NOZES DA AMÉRICA DO NORTE: PARTICIPAÇÃO DA EMPRESA 2024 (%)
FIGURA 54 MERCADO DE NOZES DA ÁFRICA DO PACÍFICO: PARTICIPAÇÃO DA EMPRESA EM 2024 (%)
FIGURA 55 MERCADO EUROPEU DE NOZES: PARTICIPAÇÃO DA EMPRESA 2024 (%)
Metodologia de Investigação
A recolha de dados e a análise do ano base são feitas através de módulos de recolha de dados com amostras grandes. A etapa inclui a obtenção de informações de mercado ou dados relacionados através de diversas fontes e estratégias. Inclui examinar e planear antecipadamente todos os dados adquiridos no passado. Da mesma forma, envolve o exame de inconsistências de informação observadas em diferentes fontes de informação. Os dados de mercado são analisados e estimados utilizando modelos estatísticos e coerentes de mercado. Além disso, a análise da quota de mercado e a análise das principais tendências são os principais fatores de sucesso no relatório de mercado. Para saber mais, solicite uma chamada de analista ou abra a sua consulta.
A principal metodologia de investigação utilizada pela equipa de investigação do DBMR é a triangulação de dados que envolve a mineração de dados, a análise do impacto das variáveis de dados no mercado e a validação primária (especialista do setor). Os modelos de dados incluem grelha de posicionamento de fornecedores, análise da linha de tempo do mercado, visão geral e guia de mercado, grelha de posicionamento da empresa, análise de patentes, análise de preços, análise da quota de mercado da empresa, normas de medição, análise global versus regional e de participação dos fornecedores. Para saber mais sobre a metodologia de investigação, faça uma consulta para falar com os nossos especialistas do setor.
Personalização disponível
A Data Bridge Market Research é líder em investigação formativa avançada. Orgulhamo-nos de servir os nossos clientes novos e existentes com dados e análises que correspondem e atendem aos seus objetivos. O relatório pode ser personalizado para incluir análise de tendências de preços de marcas-alvo, compreensão do mercado para países adicionais (solicite a lista de países), dados de resultados de ensaios clínicos, revisão de literatura, mercado remodelado e análise de base de produtos . A análise de mercado dos concorrentes-alvo pode ser analisada desde análises baseadas em tecnologia até estratégias de carteira de mercado. Podemos adicionar quantos concorrentes necessitar de dados no formato e estilo de dados que procura. A nossa equipa de analistas também pode fornecer dados em tabelas dinâmicas de ficheiros Excel em bruto (livro de factos) ou pode ajudá-lo a criar apresentações a partir dos conjuntos de dados disponíveis no relatório.

