Global Run Of River Power Market
Tamanho do mercado em biliões de dólares
CAGR :
% 
 USD
275.00 Million
USD
458.55 Million
2021
2029
USD
275.00 Million
USD
458.55 Million
2021
2029
| 2022 –2029 | |
| USD 275.00 Million | |
| USD 458.55 Million | |
| % | |
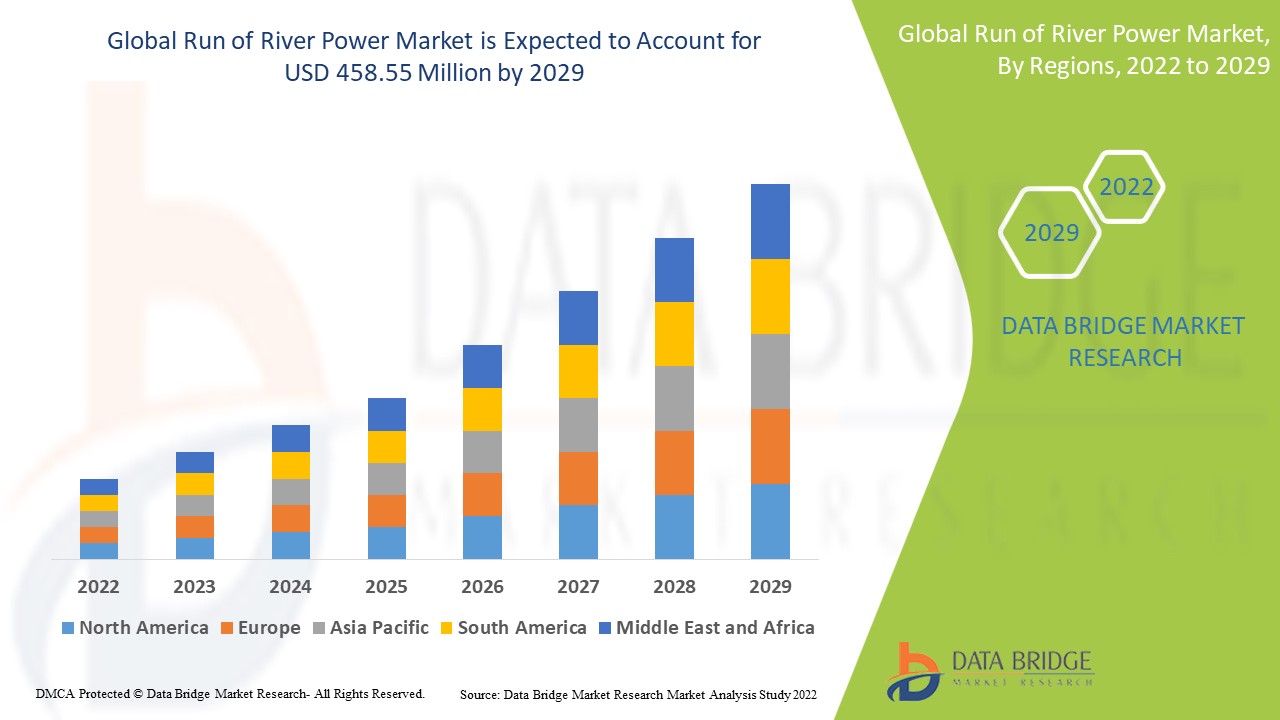
Global Run of River Power Market, By Type (Pondage, Without Pondage) – Industry Trends and Forecast to 2029
Run of River Power Market Analysis and Size
Run of river power systems are renewable, small, and suitable as low-impact alternatives to existing large-scale plants. They are mostly built on rivers and generate hydropower by harnessing the kinetic energy generated by the river's natural flow. Because of the rush of several hundred tons of water per second, these power plants can support large capacities ranging from tens to hundreds of megawatts.
Global run of river power market was valued at USD 275 million in 2021 and is expected to reach USD 458.55 million by 2029, registering a CAGR of 6.6% during the forecast period of 2022-2029. In addition to the market insights such as market value, growth rate, market segments, geographical coverage, market players, and market scenario, the market report curated by the Data Bridge Market Research team also includes technological advancements, regulatory framework, PESTEL, porter's five forces analysis, industry standards-at a glance, raw material costs/operational expenditure-overview, supply chain analysis, vendor selection criteria, pricing analysis, production analysis, and climate chain scenario.
Market Definition
Run of river power systems are hydroelectric systems that generate electricity by harnessing the energy of flowing water in the absence of a large dam and reservoir. "This distinguishes them from conventional impoundment hydroelectric facilities. A small dam and possibly some storage may be used to ensure that enough water enters the penstock (for same day use). Run-of-the-River power generation is primarily based on the natural flow rate of water "rather than the force of water falling a long distance.
Report Scope and Market Segmentation
|
Report Metric |
Details |
|
Forecast Period |
2022 to 2029 |
|
Base Year |
2021 |
|
Historic Years |
2020 (Customizable to 2014 - 2019) |
|
Quantitative Units |
Revenue in USD Million, Volumes in Units, Pricing in USD |
|
Segments Covered |
Type (Pondage, Without Pondage) |
|
Countries Covered |
U.S., Canada and Mexico in North America, Germany, France, U.K., Netherlands, Switzerland, Belgium, Russia, Italy, Spain, Turkey, Poland, Norway, Finland, Rest of Europe in Europe, China, Japan, India, South Korea, Singapore, Malaysia, Australia, Thailand, Indonesia, Philippines, Rest of Asia-Pacific (APAC) in the Asia-Pacific (APAC), Saudi Arabia, U.A.E, Israel, Egypt, South Africa, Nigeria, Algeria, Angola, Ghana, Rest of Middle East and Africa (MEA) as a part of Middle East and Africa (MEA), Brazil, Argentina and Rest of South America as part of South America |
|
Market Players Covered |
Clean Coal Technologies Inc., (U.S.), General Electric (U.S.), Alstom (France), Siemens (Germany), ExxonMobil Corporation (U.S.), Shell PLC (Netherlands), JaworskiEnergyServices (U.S.), ABB (Switzerland), Tracxn Technologies Limited (Poland), GreatPoint Energy (U.S.), Schneider Electric (France), E3 Clean Technologies (South Africa), LanzaTech (New Zealand), Accelergy (U.S.), Hygen (Sweden), Cortus (Sweden), Gasliner (Latvia) and Ciris Energy (U.S.) |
|
Market Opportunities |
|
Global Run of River Power Market Dynamics
This section deals with understanding the market drivers, advantages, opportunities, restraints and challenges. All of this is discussed in detail as below:
Drivers
- Mounting Demand for Clean and Reliable Power Generation
The major determinant anticipated to propel the run of river power technology market throughout the forecast period include the tremendously rising need for clean, dependable power production technology and the accelerating rate of industrialization around the world. Various supportive laws and regulations are also in place to increase spending on environmental protection, fuel efficiency, and technical advancement in both new and existing facilities. Consequently, this factor is ultimately projected to boost the market growth.
Furthermore the increasing urbanization in developing countries will drive industry growth. Moreover, the factors such as increase in the power demand and consumption across the globe and the shifting towards the renewable energy also accelerates the market growth. In addition, more people are becoming aware of the advantages of using clean coal gasification technology since they lower air pollution from carbon emissions, accelerating the market growth.
Opportunities
- Surging Developments and Increasing Investments
Furthermore, various developments coupled with introduction of advanced technologies by the market players further extend profitable opportunities to the market players in the forecast period of 2022 to 2029. The manufacturers of run of river power technology are encouraged to invest in research and development efforts for the progress of technology by numerous global government policies, rules, and recommendations, which generates various opportunities for the market.
Restraints/Challenges
- High Capital Requirements
The development of run of river power technology largely involves a high upfront cost, and other related costs are predicted to impede the market's expansion. The high upfront cost, and other related costs further results in the high capital cost, which is largely preventing the implementation of run of river power. As a result, the global run of river power market is hampered by this factor over the forecasted period.
- Dearth of Awareness
It is anticipated that a lack of public awareness and insufficient financial and economic capabilities will further create challenges for the market growth over the forecast period. This factor will further pose as a serious challenge to the growth of the run of river power market.
This run of river power market report provides details of new recent developments, trade regulations, import-export analysis, production analysis, value chain optimization, market share, impact of domestic and localized market players, analyses opportunities in terms of emerging revenue pockets, changes in market regulations, strategic market growth analysis, market size, category market growths, application niches and dominance, product approvals, product launches, geographic expansions, technological innovations in the market. To gain more info on the run of river power market contact Data Bridge Market Research for an Analyst Brief, our team will help you take an informed market decision to achieve market growth.
COVID-19 Impact on Run of River Power Market
The ongoing COVID-19 pandemic has negatively impacted the global economy and contributed to significant social and lifestyle changes due to the implementation of stringent lockdown policies and trade restrictions. Its effects were also felt in the hydropower industry, where it disrupted supply chains and caused potential delays in a number of projects, reducing the run of river power market share. However, the constant need for power supply in many countries today to deliver essential health and other services has kept the demand for ROR systems alive. The emergence of new approaches to rethinking critical infrastructure and interconnections between countries will also boost industry forecasts in the post-pandemic era.
Global Run of River Power Market Scope
The run of river power market is segmented on the basis of type. The growth amongst these segments will help you analyze meagre growth segments in the industries and provide the users with a valuable market overview and market insights to help them make strategic decisions for identifying core market applications.
Type
- Pondage
- Without Pondage
Run of River Power Market Regional Analysis/Insights
The run of river power market is analyzed and market size insights and trends are provided by country, type as referenced above.
The countries covered in the run of river power market report are U.S., Canada and Mexico in North America, Germany, France, U.K., Netherlands, Switzerland, Belgium, Russia, Italy, Spain, Turkey, Poland, Norway, Finland, Rest of Europe in Europe, China, Japan, India, South Korea, Singapore, Malaysia, Australia, Thailand, Indonesia, Philippines, Rest of Asia-Pacific (APAC) in the Asia-Pacific (APAC), Saudi Arabia, U.A.E, Israel, Egypt, South Africa, Nigeria, Algeria, Angola, Ghana, Rest of Middle East and Africa (MEA) as a part of Middle East and Africa (MEA), Brazil, Argentina and Rest of South America as part of South America.
North America dominates the run of river power market in terms of market share and market revenue. The market growth over this region is attributed to the increase the expenditure on environmental safety coupled with the growing demand for consistent and eco-friendly power generation technology within the region.
Asia-Pacific on the other hand, is estimated to show lucrative growth over the forecast period of 2022-2029, due to the increasing urbanization and the industrial development in major developing countries like China, India. Favorable government policies will also aid in the regional market growth over the forecast period.
The country section of the report also provides individual market impacting factors and changes in market regulation that impact the current and future trends of the market. Data points like down-stream and upstream value chain analysis, technical trends and porter's five forces analysis, case studies are some of the pointers used to forecast the market scenario for individual countries. Also, the presence and availability of global brands and their challenges faced due to large or scarce competition from local and domestic brands, impact of domestic tariffs and trade routes are considered while providing forecast analysis of the country data.
Competitive Landscape and Run of River Power Market Share Analysis
The run of river power market competitive landscape provides details by competitor. Details included are company overview, company financials, revenue generated, market potential, investment in research and development, new market initiatives, global presence, production sites and facilities, production capacities, company strengths and weaknesses, product launch, product width and breadth, application dominance. The above data points provided are only related to the companies' focus related to run of river power market.
Some of the major players operating in the run of river power market are
- Clean Coal Technologies Inc., (U.S.)
- General Electric (U.S.)
- Alstom (France)
- Siemens (Germany)
- ExxonMobil Corporation (U.S.)
- Shell PLC (Netherlands)
- JaworskiEnergyServices (U.S.)
- ABB (Switzerland)
- Tracxn Technologies Limited (Poland)
- GreatPoint Energy (U.S.)
- Schneider Electric (France)
- E3 Clean Technologies (South Africa)
- LanzaTech (New Zealand)
- Accelergy (U.S.)
- Hygen (Sweden)
- Cortus (Sweden)
- Gasliner (Latvia)
- Ciris Energy (U.S.)
SKU-
Obtenha acesso online ao relatório sobre a primeira nuvem de inteligência de mercado do mundo

- Painel interativo de análise de dados
- Painel de análise da empresa para oportunidades de elevado potencial de crescimento
- Acesso de analista de pesquisa para personalização e customização. consultas
- Análise da concorrência com painel interativo
- Últimas notícias, atualizações e atualizações Análise de tendências
- Aproveite o poder da análise de benchmark para um rastreio abrangente da concorrência
Índice
1.INTRODUÇÃO
1.1 OBJETIVOS DO ESTUDO
1.2 DEFINIÇÃO DE MERCADO
1.3VISÃO GERAL DO MERCADO DE ENERGIA RUNOFRIVER
1.4 MOEDA E PREÇOS
1.5LIMITAÇÃO
1.6MERCADOSCOBERTOS
2. SEGMENTAÇÃO DE MERCADO
2.1PRINCIPAIS CONCLUSÕES
2.2CHEGANDO AO TAMANHO DO MERCADO DE ENERGIA
2.3GRADE DE POSICIONAMENTO DO FORNECEDOR
2.4 MERCADOS COBERTOS
2.5ESCOPO GEOGRÁFICO
2,6 ANOS CONSIDERADOS PARA O ESTUDO
2.7METODOLOGIA DE PESQUISA
2.8TECNOLOGIACURVA DA LINHA DE VIDA
2.9MODELAÇÃO MULTIVARIADA
2.10 ENTREVISTAS PRINCIPAIS COM PRINCIPAIS LÍDERES DE OPINIÃO
2.11DBMRMARKETPOSITIONGRID
2.12GRADEDECOBERTURADEAPLICAÇÕESDEMERCADO
2.13DBMRMARKETCHALLENGEMATRIX
2.14 FONTES SECUNDÁRIAS
2.15 EXECUTAR MERCADO DE ENERGIA DO RIO: INSTANTÂNEO DE PESQUISA
2.16 PREMISSAS
3.VISÃO GERAL DO MERCADO
3.1 MOTORISTAS
3.2 RESTRIÇÕES
3.3 OPORTUNIDADES
3.4 DESAFIOS
4. RESUMO EXECUTIVO
5.VISÕES PREMIUM
5.1 COBERTURA DE MATÉRIA-PRIMA
5.2ANÁLISEDEPRODUÇÃOCONSUMO
5.3 AVANÇO TECNOLÓGICO DOS FABRICANTES
5.4CINCO FORÇAS DE PORTER
5.5 CRITÉRIOS DE SELEÇÃO DE FORNECEDORES
5.6ANÁLISE DE PESTLE
5.7 COBERTURA REGULAMENTAR
6. VISÃO GERAL DA CAPACIDADE DE PRODUÇÃO
7. ANÁLISE DE PREÇOS
8. CENÁRIO DE MUDANÇAS CLIMÁTICAS
8.1 PREOCUPAÇÕES AMBIENTAIS
8.2RESPOSTA DA INDÚSTRIA
8.3 PAPEL DO GOVERNO
8.4 RECOMENDAÇÕES DE ANALISTAS
9. EXECUTAR MERCADO DE ENERGIA DO INTERIOR, POR TIPO, (2021-2030), (US$ MILHÕES) (MEGAWATTS)
9.1 VISÃO GERAL
9.2 RESERVATÓRIO
9.3 SEM RESERVATÓRIO
10.EXECUTAR O MERCADO DE ENERGIA SUPERIOR, POR CAPACIDADE, (2021-2030), (US$ MILHÕES)
10.1 VISÃO GERAL
10,2 MENOS QUE 100 MW
10,3MAIS DE 100MW
11. GLOBAL RUNOFRIVERMARKET, POR GEOGRAFIA, (2021-2030), (US$ MILHÕES)
Global RUNOFRIVERPOWER, (TODO O SEGMENTO FORNECIDO ACIMA É REPRESENTADO NESTE CAPÍTULO POR PAÍS)
11.1AMÉRICA DO NORTE
11.1.1 EUA
11.1.2CANADÁ
11.1.3MÉXICO
11.2EUROPA
11.2.1 ALEMANHA
11.2.2 Reino Unido
11.2.3ITÁLIA
11.2.4FRANÇA
11.2.5ESPANHA
11.2.6RÚSSIA
11.2.7SUÍÇA
11.2.8 TURQUIA
11.2.9BÉLGICA
11.2.10 HOLANDA
11.2.11 DINAMARCA
11.2.12SUÉCIA
11.2.13 POLÔNIA
11.2.14NORUEGA
11.2.15 FINLÂNDIA
11.2.16RESTOFEUROPE
11.3ÁSIA-PACÍFICO
11.3.1 JAPÃO
11.3.2CHINA
11.3.3CORÉIA DO SUL
11.3.4ÍNDIA
11.3.5SINGAPURA
11.3.6TAILÂNDIA
11.3.7INDONÉSIA
11.3.8MALÁSIA
11.3.9 FILIPINAS
11.3.10AUSTRÁLIA
11.3.11NOVA ZELÂNDIA
11.3.12VIETNÃ
11.3.13 TAIWAN
11.3.14RESTOFASIA-PACÍFICO
11.4AMÉRICA DO SUL
11.4.1BRASIL
11.4.2ARGENTINA
11.4.3 RESTOFSOUTHAMERICA
11,5 ORIENTE MÉDIO E ÁFRICA
11.5.1ÁFRICA DO SUL
11.5.2EGITO
11.5.3BAHREIN
11.5.4ARABEMIRADOS UNIDOS
11.5.5 KUWAIT
11.5.6OMAN
11.5.7 CATAR
11.5.8ARÁBIA SAUDITA
11.5.9 RESTOFMEA
12. CICLO DE GARRAFA ORGÂNICO GLOBAL (ORC) CALOR RESIDUAL PARA MERCADO DE ENERGIA, CENÁRIO DA EMPRESA
12.1 ANÁLISE DA COMPANHIA: GLOBAL
12.2ANÁLISE DA COMPANHIA:AMÉRICA DO NORTE
12.3ANÁLISE DA COMPANHIA: EUROPA
12.4ANÁLISE DA COMPANHIA: ÁSIA-PACÍFICO
12.5 FUSÕES E AQUISIÇÕES
12.6 DESENVOLVIMENTO E APROVAÇÕES DE NOVOS PRODUTOS
12.7EXPANSÕES
12.8PARCERIAEOUTROSDESENVOLVIMENTOSESTRATÉGICOS
13. PESQUISA DE MERCADO SWOTANDDATABRIDGE
14. RUNOFRIVERPOWERMARKET - PERFIS DE EMPRESAS
14.1DUKEENERGYCORPORATION
14.1.1 INSTANTÂNEO DA EMPRESA
14.1.2PORTFÓLIO DE PRODUTOS
14.1.3 ANÁLISE DE RECEITA
14.1.4 DESENVOLVIMENTO RECENTE
14.2ONTARIOPOWERGENERATIONINC.
14.2.1 INSTANTÂNEO DA EMPRESA
14.2.2PORTFÓLIO DE PRODUTOS
14.2.3 ANÁLISE DE RECEITA
14.2.4 DESENVOLVIMENTO RECENTE
14.3STATKRAFT
14.3.1 INSTANTÂNEO DA EMPRESA
14.3.2PORTFÓLIO DE PRODUTOS
14.3.3 ANÁLISE DE RECEITA
14.3.4 DESENVOLVIMENTO RECENTE
14.4ELÉTRICA GERAL
14.4.1 INSTANTÂNEO DA EMPRESA
14.4.2PORTFÓLIO DE PRODUTOS
14.4.3 ANÁLISE DE RECEITA
14.4.4 DESENVOLVIMENTO RECENTE
14.5SHELLPLC
14.5.1 INSTANTÂNEO DA EMPRESA
14.5.2PORTFÓLIO DE PRODUTOS
14.5.3 ANÁLISE DE RECEITA
14.5.4 DESENVOLVIMENTO RECENTE
14.6 SIEMENSENERGY
14.6.1 INSTANTÂNEO DA EMPRESA
14.6.2PORTFÓLIO DE PRODUTOS
14.6.3 ANÁLISE DE RECEITA
14.6.4 DESENVOLVIMENTO RECENTE
14,7 ABB
14.7.1 INSTANTÂNEO DA EMPRESA
14.7.2PORTFÓLIO DE PRODUTOS
14.7.3 ANÁLISE DE RECEITA
14.7.4 DESENVOLVIMENTO RECENTE
14.8ANDRITZ
14.8.1 INSTANTÂNEO DA EMPRESA
14.8.2PORTFÓLIO DE PRODUTOS
14.8.3 ANÁLISE DE RECEITA
14.8.4 DESENVOLVIMENTO RECENTE
14.9CHINATHREEGORGE CORPORATION
14.9.1 INSTANTÂNEO DA EMPRESA
14.9.2PORTFÓLIO DE PRODUTOS
14.9.3 ANÁLISE DE RECEITA
14.9.4 DESENVOLVIMENTO RECENTE
14.10 GERENCIAMENTO DE BANCOS BROOKFIEL
14.10.1INSTANTÂNEO DA EMPRESA
14.10.2PORTFÓLIO DE PRODUTOS
14.10.3 ANÁLISE DE RECEITA
14.10.4DESENVOLVIMENTO RECENTE
14.11INNERGEX
14.11.1INSTANTÂNEO DA EMPRESA
14.11.2PORTFÓLIO DE PRODUTOS
14.11.3 ANÁLISE DE RECEITA
14.11.4DESENVOLVIMENTO RECENTE
14.12VERBUNDAG
14.12.1INSTANTÂNEO DA EMPRESA
14.12.2PORTFÓLIO DE PRODUTOS
14.12.3 ANÁLISE DE RECEITA
14.12.4DESENVOLVIMENTO RECENTE
14.13FORTUM
14.13.1INSTANTÂNEO DA EMPRESA
14.13.2PORTFÓLIO DE PRODUTOS
14.13.3 ANÁLISE DE RECEITA
14.13.4DESENVOLVIMENTO RECENTE
14.14SCHNEIDERELECTRIC
14.14.1INSTANTÂNEO DA EMPRESA
14.14.2PORTFÓLIO DE PRODUTOS
14.14.3 ANÁLISE DE RECEITA
14.14.4DESENVOLVIMENTO RECENTE
14h15 RWE
14.15.1INSTANTÂNEO DA EMPRESA
14.15.2PORTFÓLIO DE PRODUTOS
14.15.3 ANÁLISE DE RECEITA
14.15.4DESENVOLVIMENTO RECENTE
14.16VOITHGMBH&CO.KGAA
14.16.1INSTANTÂNEO DA EMPRESA
14.16.2PORTFÓLIO DE PRODUTOS
14.16.3 ANÁLISE DE RECEITA
14.16.4DESENVOLVIMENTO RECENTE
OBSERVAÇÃO: O PERFIL DAS EMPRESAS NÃO É UMA LISTA EXAUSTIVA, CONFORME NOSSO REQUISITO ANTERIOR DO CLIENTE. CRIAMOS O PERFIL DE MAIS DE 100 EMPRESAS EM NOSSO ESTUDO E, PORTANTO, A LISTA DE EMPRESAS PODE SER MODIFICADA OU SUBSTITUÍDA MEDIANTE SOLICITAÇÃO
15. RELATÓRIOS RELACIONADOS
16.QUESTIONÁRIO
17. CONCLUSÃO
18. SOBRE A DATABRIDGEMARKETRESEARCH
Metodologia de Investigação
A recolha de dados e a análise do ano base são feitas através de módulos de recolha de dados com amostras grandes. A etapa inclui a obtenção de informações de mercado ou dados relacionados através de diversas fontes e estratégias. Inclui examinar e planear antecipadamente todos os dados adquiridos no passado. Da mesma forma, envolve o exame de inconsistências de informação observadas em diferentes fontes de informação. Os dados de mercado são analisados e estimados utilizando modelos estatísticos e coerentes de mercado. Além disso, a análise da quota de mercado e a análise das principais tendências são os principais fatores de sucesso no relatório de mercado. Para saber mais, solicite uma chamada de analista ou abra a sua consulta.
A principal metodologia de investigação utilizada pela equipa de investigação do DBMR é a triangulação de dados que envolve a mineração de dados, a análise do impacto das variáveis de dados no mercado e a validação primária (especialista do setor). Os modelos de dados incluem grelha de posicionamento de fornecedores, análise da linha de tempo do mercado, visão geral e guia de mercado, grelha de posicionamento da empresa, análise de patentes, análise de preços, análise da quota de mercado da empresa, normas de medição, análise global versus regional e de participação dos fornecedores. Para saber mais sobre a metodologia de investigação, faça uma consulta para falar com os nossos especialistas do setor.
Personalização disponível
A Data Bridge Market Research é líder em investigação formativa avançada. Orgulhamo-nos de servir os nossos clientes novos e existentes com dados e análises que correspondem e atendem aos seus objetivos. O relatório pode ser personalizado para incluir análise de tendências de preços de marcas-alvo, compreensão do mercado para países adicionais (solicite a lista de países), dados de resultados de ensaios clínicos, revisão de literatura, mercado remodelado e análise de base de produtos . A análise de mercado dos concorrentes-alvo pode ser analisada desde análises baseadas em tecnologia até estratégias de carteira de mercado. Podemos adicionar quantos concorrentes necessitar de dados no formato e estilo de dados que procura. A nossa equipa de analistas também pode fornecer dados em tabelas dinâmicas de ficheiros Excel em bruto (livro de factos) ou pode ajudá-lo a criar apresentações a partir dos conjuntos de dados disponíveis no relatório.

