Global Track And Trace Solutions Market
Tamanho do mercado em biliões de dólares
CAGR :
% 
 USD
5.88 Billion
USD
24.46 Billion
2024
2032
USD
5.88 Billion
USD
24.46 Billion
2024
2032
| 2025 –2032 | |
| USD 5.88 Billion | |
| USD 24.46 Billion | |
| % | |
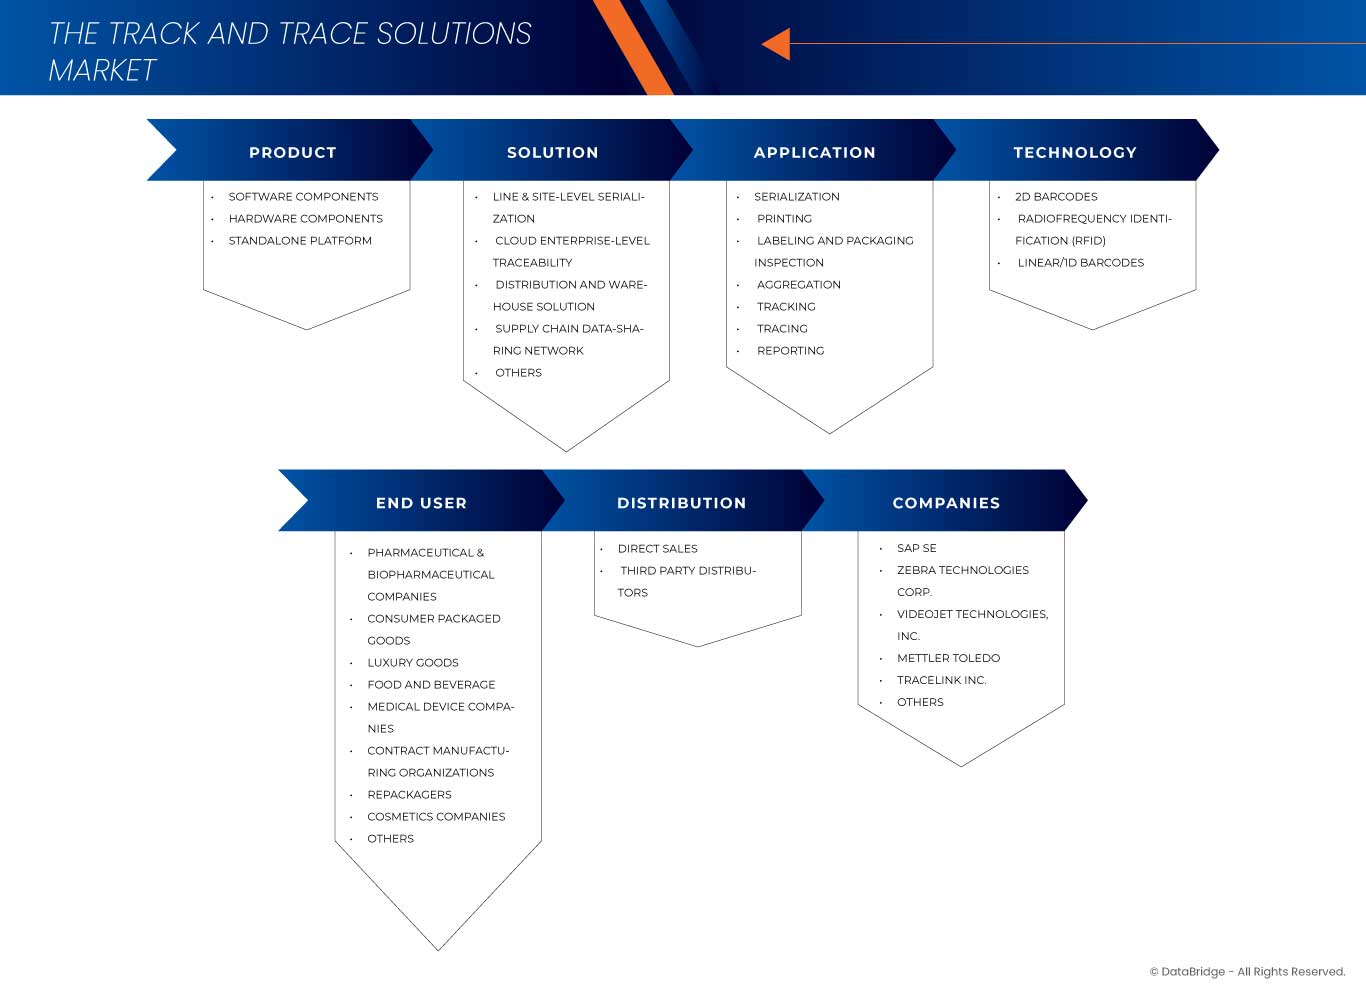
Global Track And Trace Solutions Market, By Product (Software Components, Hardware Components, and Standalone Platform), Solution (Line and Site-Level Serialization, Cloud Enterprise-Level Traceability, Distribution and Warehouse Solution, Supply Chain Data-Sharing Network, and Others), Application (Serialization, Printing, Labeling and Packaging Inspection, Aggregation, Tracking, Tracing, and Reporting), Technology (2D Barcodes, Radiofrequency Identification (RFID), and Linear/1D Barcodes), End User (Pharmaceutical and Biopharmaceutical Companies, Consumer Packaged Goods, Luxury Goods, Food and Beverage, Medical Device Companies, Contract Manufacturing Organizations, Repackagers, Cosmetics Companies, and Others), Distribution Channel (Direct Sales and Third Party Distributors) - Industry Trends and Forecast to 2032
Global Track and Trace Solutions Market Analysis
Tracking and tracing medications to enhance the accessibility of products in the prescription supply chain is not a novel phenomenon. In reality, the concept of serialization has been debated for more than 15 years. In 1999, after a study by the U.S. College of Medicine, President Bill Clinton put patient protection (including avoiding mistakes at the point of dispensing medicines) on the agenda of the federal government and proceeded to advocate for reform after his presidency. In 2003, the U.S. Food and Drug Administration (FDA) required barcoding at unit levels, and in the same year, the World Health Organization (WHO) released a study highlighting the scope of the counterfeit medication problem, claiming that 10% of medicines worldwide were counterfeit. A major shift in serialization took place around 2005 and the variety of countries started to set targets for adoption. However, after making several measures in protecting the supply chain, the challenge was less of a concern after the 2008 financial crisis.
As the world economy has changed, the focus has gradually moved. Turkey adopted serialization standards in 2010 and rules are in effect for other markets such as China, South Korea and India. With the EU Falsified Medicines Directive (FMD) coming into force in February 2019 and the U.S. adopting legislation as part of the Drug Supply Chain Security Act (DSCSA) in November 2017, more than 75% of global medicines are required to be protected by some form of monitor and trace regulations by 2019. The track and trace solutions market is of keen importance in various industries starting from pharmaceutical to medical devices and food and beverages among more.
The progress in demand of track and trace solutions in healthcare facilities is due to stringent laws formulated for serialization and labeling which leads to the lucrative growth of track and trace solutions in the market. The vast product portfolio with enormous options for almost all major industries such as food and beverage, cosmetic and medical devices among more further impels the growth of track and trace solutions in the global track and trace solutions market.
Global Track and Trace Solutions Market Size
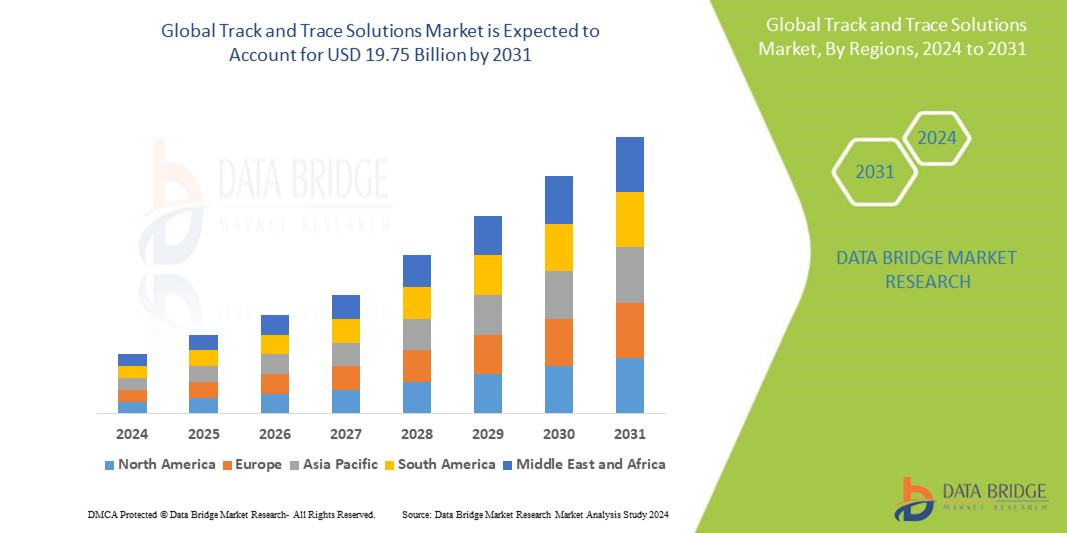
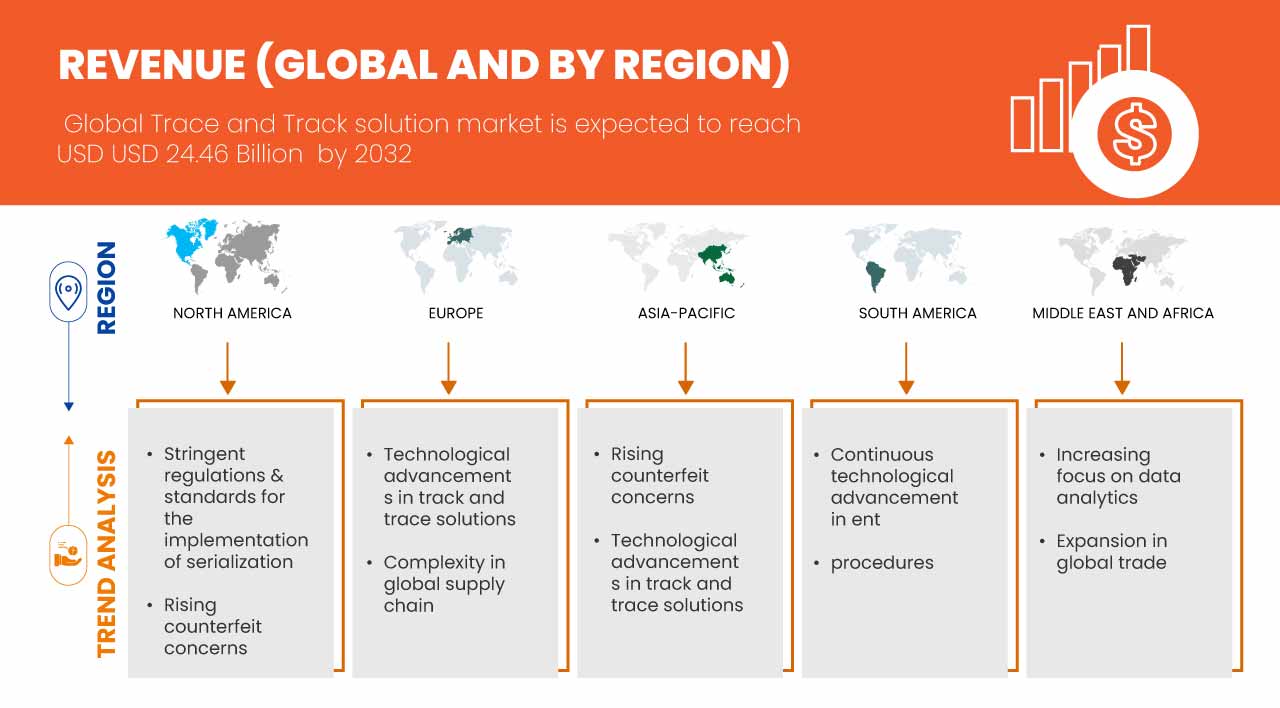
Global track and trace solutions market size was valued at USD 5.88 Billion in 2024 and is projected to reach USD 24.46 Billion by 2032, with a CAGR of 19.5% during the forecast period of 2025 to 2032. In addition to the insights on market scenarios such as market value, growth rate, segmentation, geographical coverage, and major players, the market reports curated by the Data Bridge Market Research also include import export analysis, production capacity overview, production consumption analysis, price trend analysis, climate change scenario, supply chain analysis, value chain analysis, raw material/consumables overview, vendor selection criteria, PESTLE Analysis, Porter Analysis, and regulatory framework.
Global Track and Trace Solutions Market Trends
“Increased Demand For Supply Chain Transparency”
The demand for track and trace solutions is particularly strong due to the need for ensuring patient safety, product integrity, and regulatory compliance. Track and trace technologies help monitor the movement of pharmaceutical products, medical devices, and vaccines throughout the supply chain, minimizing the risk of counterfeit drugs and ensuring that products are stored and transported under proper conditions. Additionally, with the rising need for personalized medicine and greater healthcare accountability, these solutions enable healthcare providers to track products from production to end-use, ensuring they reach the right patients safely and efficiently. Regulatory bodies, such as the FDA, require stringent traceability measures, making track and trace systems an essential part of healthcare operations.
Report Scope and Global Track and Trace Solutions Market Segmentation
|
Attributes |
Global Track and Trace Solutions Market Market Insights |
|
Segments Covered |
|
|
Region Covered |
U.S., Canada, Mexico, Germany, U.K., France, Italy, Spain, Switzerland, Russia, Turkey, Belgium, Netherlands, Denmark, Poland, Sweden, Norway, Finland, Rest of Europe, China, Japan, India, South Korea, Australia, Singapore, Indonesia, Thailand, Malaysia, Philippines, New Zealand, Vietnam, Taiwan, Rest of Asia-Pacific, Brazil, Argentina, Rest of South America, South Africa, Saudi Arabia, U.A.E., Qatar, Egypt, Kuwait, Bahrain, Oman, Rest of Middle East and Africa |
|
Key Market Players |
SAP SE(Germany), Zebra Technologies Corp.(U.S.), Videojet Technologies, Inc.(U.S.), METTLER TOLEDO(U.S.), Tracelink Inc.(U.S.), Siemens, Domino Printing Sciences plc(U.K.), Laetus GmbH(Germany), Xyntek Incorporated(U.S.), IBM Corporation(U.S.), WIPOTEC-OCS GmbH(Germany), 3Keys(Germany), ACG(India), NJM Packaging Inc.(U.S.), OPTEL GROUP(Canada), Systech(U.S.), Robert Bosch Manufacturing Solutions GmbH(Germany), ANTARES VISION S.p.A.(Italy), Uhlmann(Germany), SEA VISION S.r.l.(Italy), Jekson Vision(India), Kevision Systems(india), Arvato Systems, Grant-Soft Ltd.(Turkey), PharmaSecure Inc.(U.S.), Axyway(France) and SL Controls Ltd.(U.S.) |
|
Market Opportunities |
Expansion in Global Trade |
|
Value Added Data Infosets |
In addition to the insights on market scenarios such as market value, growth rate, segmentation, geographical coverage, and major players, the market reports curated by the Data Bridge Market Research also include import export analysis, production capacity overview, production consumption analysis, price trend analysis, climate change scenario, supply chain analysis, value chain analysis, raw material/consumables overview, vendor selection criteria, PESTLE Analysis, Porter Analysis, and regulatory framework. |
Global Track and Trace Solutions Market Definition
The method of identifying the present and historical position (and other information) of a particular object or property involves the storage and transportation of several kinds of items, monitoring and tracking or tracing. This definition can be followed by the estimation and recording of the location of cars and containers, for instance, recorded in a real-time database. This method leaves the challenge of drawing up a cohesive description of the corresponding progress notes. Track and trace stands for linking machines to IT and data sharing at all rates. This includes strong hardware suite device modules or stand-alone systems. The major goal of track and trace solutions is to decline the chain of counterfeit drugs and fake products across globe and to provide smooth flow and traceability of the goods at each and every point.
Global Track and Trace Solutions Market Dynamics
Drivers
- Stringent Regulations and Standards for the Implementation 0f Serialization
The arrival of mandatory serialization has completely transformed the pharmaceutical market. With both the United States Drug Supply Chain Security Act (DSCSA) and European Union Falsified Medicines Directive (FMD) now “live”, the supply chain of pharmaceuticals is forever linked to serialized products and data. Looking deeper, a successful serialization program involves far more than just placing serial numbers on packaging. Regulations vary from market to market and can often change, which means that the regulatory professionals need to be prepared to adjust procedures, processes, and filings to keep up. Since the law on the labeling and serialization of medicines is fairly recent, it is subject to greater global complexity and varies more often than other regulations. Moreover, as the supply chain for genuine pharmaceuticals has grown longer, this creates an opportunity for counterfeiters at every step in the supply chain. Hence, stringent regulations and standardization are made in order to protect the goods.
- In July 2024, according to the article published by Food and Drug Administration, the Drug Supply Chain Security Act (DSCSA) mandates the electronic identification and tracing of prescription drugs at the package level to prevent harmful drugs from entering the U.S. supply chain. This stringent regulation drives the need for advanced track and trace solutions to ensure compliance, protect patients, and enable quick responses to threats, thereby acting as a key driver for the global market
- In February 2022, according to the article published by USAID Global Health Supply Chain Program, China's State Food and Drug Administration has mandated serialization for 502 pharmaceutical drugs on the essential drug list, ensuring traceability and authenticity. This stringent regulation boosts the demand for track and trace solutions to comply with serialization requirements. As a result, it acts as a key driver for the global market, pushing for wider adoption of advanced tracking technologies
The issue of medicines and medication adulteration has been a global concern for decades. Fuelled by unsecured physical and cyber global supply chains, internet sales, and minimal penalties, the government believes and various pharmaceutical companies worldwide that the implementation of serialization could decrease and stop the issues related to counterfeiting. This makes the stringent regulations and standards for the implementation of serialization to act as a driver for the global track and trace solutions market.
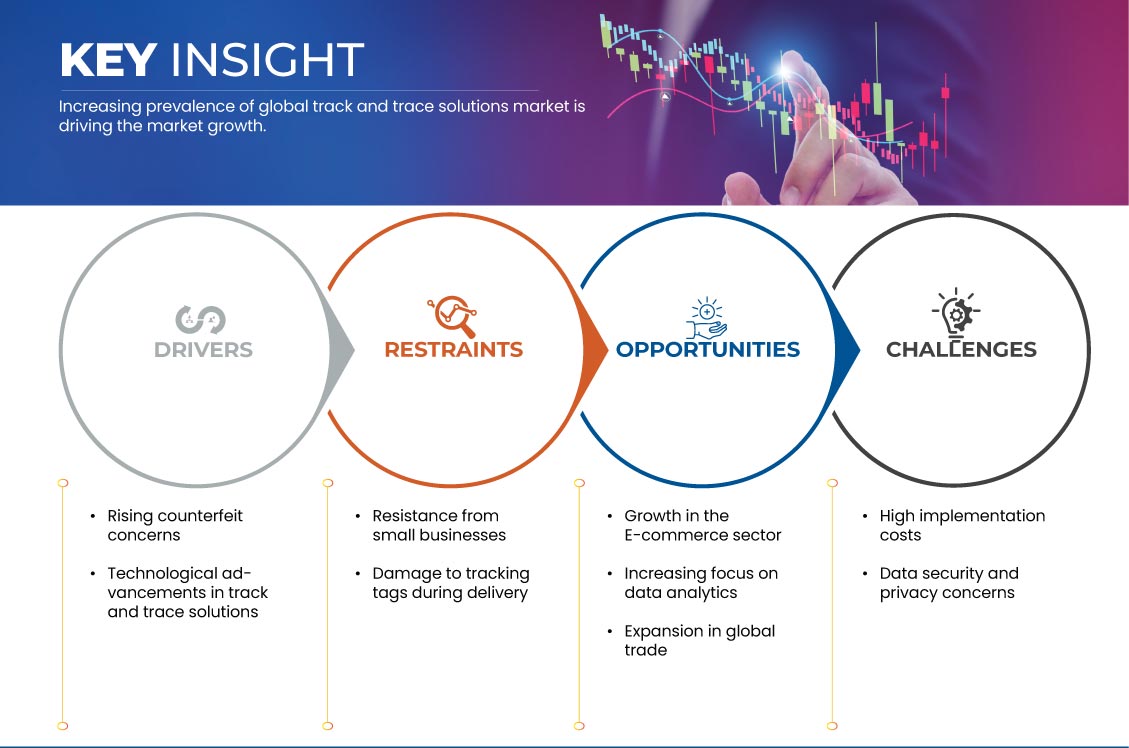
- Rising Counterfeit Concerns
Rising concerns about counterfeit products have become a significant issue, particularly in the pharmaceutical and healthcare sectors, where the presence of fake drugs can have severe consequences on patient health and safety. Counterfeit medications not only compromise the integrity of the healthcare system but also increase risks of adverse effects, drug resistance, and treatment failures. In response to this growing threat, regulators and industry stakeholders are pushing for more stringent traceability and serialization measures. These measures help ensure the authenticity of products by enabling manufacturers, distributors, and retailers to track the movement of goods through the entire supply chain. Technologies such as RFID, barcoding, and blockchain are increasingly being deployed to combat counterfeiting, allowing products to be monitored and verified at each stage of the supply chain, from manufacturing to the end consumer. With the expansion of global trade and more complex supply chains, the risk of counterfeit products entering markets has become more pronounced, further driving the need for enhanced traceability systems. This heightened awareness of counterfeit risks acts as a key driver for the global track and trace solutions market, as businesses and governments seek robust systems to authenticate products, maintain regulatory compliance, and protect consumers from potentially harmful counterfeit goods.
For instance,
- In May 2024, according to the article published by Food and Drug Administration, Counterfeit medicines, which may contain incorrect, insufficient, or harmful ingredients, pose serious health risks while being falsely marketed as authentic. This growing concern over the safety and efficacy of pharmaceuticals is driving the adoption of track and trace solutions to ensure product authenticity. As a result, the rising concerns over counterfeit products act as a significant driver for the global track and trace solutions market
- In October 2024, according to the article published by Science Direct, Falsified and counterfeit medicines, particularly in international travel, pose a serious public health risk. With the rise in reported cases globally, concerns about the spread of counterfeit drugs have grown significantly. This has led to a greater need for traceability systems to ensure product authenticity. As a result, rising concerns over counterfeit medicines act as a key driver for the global track and trace solutions market
Concerns about counterfeit products, especially in the pharmaceutical and healthcare industries, have become a major issue due to the potential harm fake drugs can cause to patients. Counterfeit medications can lead to ineffective treatments and health risks, prompting increased demand for traceability solutions. By using technologies such as RFID, barcodes, and blockchain, companies can track products throughout the supply chain to ensure authenticity. As global supply chains grow more complex, the risk of counterfeit goods entering the market increases, driving the need for stronger tracking systems. This demand for secure and reliable traceability solutions acts as a major driver for the global track and trace solution market
Opportunities
- Growth In The E-Commerce Sector
The rapid growth of the E-commerce sector presents a substantial opportunity for the global track and trace solutions market due to the increasing complexity and scale of online retail operations. As more consumers shift to online shopping, businesses are required to ensure that their logistics and supply chain processes are efficient and transparent. Track and trace solutions facilitate real-time monitoring of inventory levels, shipment status, and delivery processes, enabling companies to provide accurate information to customers regarding their orders. This heightened level of transparency boosts customer confidence and enhances the overall shopping experience, making E-commerce companies more competitive in a crowded marketplace.
For instance,
- In July 2024, according to an article, ‘Impact of E-commerce on Logistics: Adapting to Demand’, published in the marketplace digest, implementing advanced tracking and visibility solutions enhances tracking and visibility solutions are critical for meeting e-commerce demands. Real-time tracking technology enables carriers to provide accurate delivery estimates and updates, improving transparency and customer trust
- In April 2023, according to an article, ‘Identification of benefits, challenges, and pathways in E-commerce industries, published in the ScienceDirect: An integrated two-phase decision-making model,’ the e-commerce industry has seen significant growth over the past decade as it focuses on convenience and accessibility, leading to a surge in online shopping with a larger number of consumers opting for it
Moreover, with the rise of E-commerce, there is a growing risk of issues such as theft, fraud, and counterfeit goods, necessitating robust track and trace systems that can mitigate these challenges. Implementing advanced technologies such as RFID, blockchain, and automated tracking systems empowers e-commerce businesses to maintain the integrity of their products from warehouse to delivery. These solutions further enable enterprises to comply with regulatory requirements and industry standards related to product accountability and safety. As e-commerce continues to expand, the demand for reliable track and trace solutions will grow, creating significant market opportunities for providers of such technologies.
- Expansion in Global Trade
The expansion of global trade creates a significant opportunity for the global track and trace solutions market, driven by the growing complexity of supply chains that cross international borders. As businesses increasingly rely on global networks to source materials and distribute their products, the need for effective tracking systems becomes paramount. Track and trace solutions allow companies to monitor shipments in real time, ensuring transparency and efficiency throughout the logistics process. This capability enhances operational efficiency and helps organizations comply with international regulations and standards, leading to greater trust among partners and customers. As global trade continues to expand, the demand for sophisticated tracking technologies that can handle various regulatory requirements and provide visibility across multiple jurisdictions is likely to surge.
For instance,
- In May 2024, according to an article published in the World Economic Forum, it is expected that global trade in goods and services to grow by 2.3% this year and 3.3% in 2025 – more than double the 1% growth seen in 2023
Moreover, the rise of E-commerce and online retail has further accelerated the demand for track and trace solutions, as consumers expect timely deliveries and transparency regarding their orders. With vast amounts of goods being transported across the globe, businesses need robust systems to track their inventory and shipments accurately. This demand has spurred innovation in the track and trace market, encouraging the development of advanced technologies such as blockchain, IoT, and artificial intelligence. These innovations enhance the capabilities of track and trace solutions and offer the opportunity to differentiate themselves in a crowded marketplace. As global trade continues to grow and evolve, the track and trace solutions market stands poised to capitalize on this trend, providing essential tools that support businesses in navigating the complexities of modern supply chain management while meeting consumer demands for transparency and accountability.
Restraints/Challenges
- Risks Associated with Sample Contamination
Data security and privacy concerns represent a significant challenge for the Asia-Pacific track and trace solutions market, as these systems often involve the collection, storage, and transmission of sensitive information. This can include personal data, product details, and supply chain information, which, if inadequately protected, pose risks to both consumers and businesses. Breaches in data security can lead to financial losses, reputational damage, and legal ramifications, particularly in light of increasingly stringent regulations such as the GDPR in Asia-Pacific and various data protection laws Asia-Pacificly. As organizations implement track and trace technologies, they must ensure robust security measures, which can increase costs and complicate the deployment process, potentially deterring companies from adopting these solutions.
For instance,
- In August 2024, according to an article, ‘Top Challenges in Implementing Track and Trace Solutions in Supply Chain Management’, published by Shriram Veritech Solutions Pvt. Ltd., with the implementation of track and trace solutions, businesses handle a vast amount of sensitive data, including proprietary information, customer details, and real-time location tracking. Track and trace systems are vulnerable to cyberattacks.
Moreover, consumer awareness regarding data privacy is growing, leading to heightened scrutiny of businesses that handle personal information. Organizations are under pressure to demonstrate compliance with data protection regulations and to build trust with their customers. If businesses cannot confidently assure stakeholders of their ability to safeguard data, they risk losing market share and facing backlash from consumers. This climate of concern can limit the willingness of companies to fully invest in and adopt advanced track and trace solutions that may require extensive data handling and processing. Consequently, the market may show slower growth as organizations navigate these complexities, seeking to balance the benefits of enhanced tracking capabilities with the imperative of maintaining data privacy and security.
- Damage To Tracking Tags During Delivery
Damage to tracking tags during delivery significantly impacts the effectiveness of track and trace solutions in the global market. When tracking tags, such as RFID labels or barcodes, are damaged during transit, it leads to data inaccuracies, loss of product visibility, and delays in tracking. This compromises the reliability of supply chain operations, especially in industries that depend on precise product movement and compliance. In the pharmaceutical sector, for instance, damaged tags disrupt critical traceability processes, increasing the risk of counterfeit products and regulatory non-compliance. Such issues result in inefficiencies, higher operational costs, and a decrease in customer confidence, acting as a significant restraint on the global track and trace solutions market.
For instance,
- In August 2024, according to the article published by encstorge.com, RFID tags are vulnerable to damage during delivery, caused by factors like water, excessive heat, chemicals, or physical breakage in the chip or antenna lines. Understanding these risks is crucial for optimizing RFID performance in different environments. Such damage disrupts track and trace systems, leading to inaccuracies and inefficiencies, which act as a significant restraint on the global market's growth
- In August 2023, according to the article published by Lexicon Tech Solutions, Barcodes can be damaged during delivery due to exposure to moisture, oils, or rough surfaces, leading to issues such as smudging or tearing. This damage makes the barcode unreadable, disrupting the tracking process. Such issues with barcode integrity can cause delays, inaccuracies, and inefficiencies in supply chains, acting as a significant restraint to the global track and trace solutions market
Damage to tracking tags during delivery hinders the effectiveness of track and trace systems in the global market. Damaged RFID labels or barcodes result in tracking errors, loss of visibility, and delays, affecting supply chain accuracy. In sectors such as pharmaceuticals, this disrupts compliance and traceability, leading to inefficiencies, higher costs, and reduced trust, which restraints market growth.
Global Track and Trace Solutions Market Scope
The market is segmented on the basis of product, solution, application, technology, end user, and distribution channel. The growth amongst these segments will help you analyze meagre growth segments in the industries and provide the users with a valuable market overview and market insights to help them make strategic decisions for identifying core market applications.
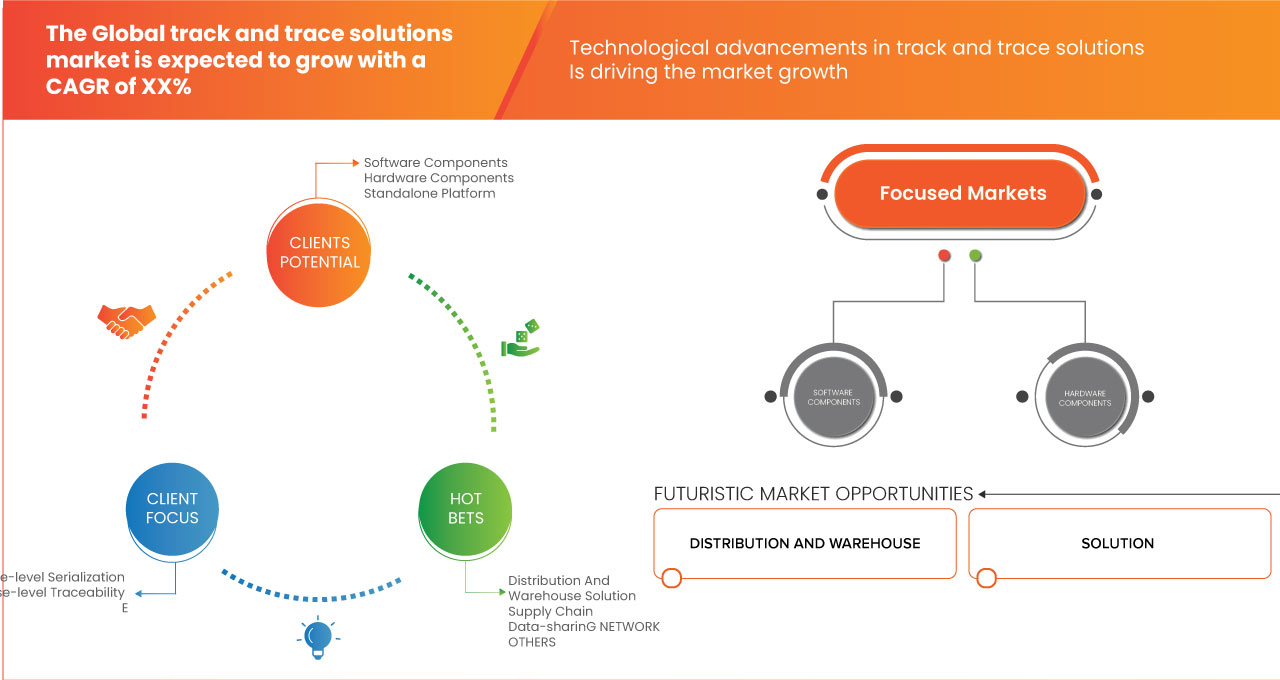
Product
- Software Components
- Plant Manager
- Line Controller
- Enterprise And Network Manager
- Bundle Tracking
- Case Tracking
- Warehouse And Shipment Manager
- Pallet Tracking
- Others
- Hardware Components
- Printing And Marking
- Barcode Scanner
- Monitoring And Verification
- Labeler
- Checkweigher
- Rfid Reader
- Others
- Standalone Platform
Solution
- Line And Site-Level Serialization
- Cloud Enterprise-Level Traceability
- Distribution And Warehouse Solution
- Supply Chain Data-Sharing Network
- Others
Application
- Serialization
- Carton Serialization
- Bottle Serialization
- Medical Device Serialization
- Vial And Ampoule Serialization
- Blister Serialization
- Printing
- Labeling And Packaging Inspection
- Aggregation
- Bundle Aggregation
- Case Aggregation
- Pallet Aggregation
- Tracking
- Tracing
- Reporting
Technology
- 2d Barcodes
- Radiofrequency Identification (Rfid)
- Linear/1d Barcodes
End User
- Pharmaceutical And Biopharmaceutical Companies
- Consumer Packaged Goods
- Luxury Goods
- Food And Beverage
- Medical Device Companies
- Contract Manufacturing Organizations
- Repackagers
- Cosmetics Companies
- Others
Distribution Channel
- Direct Sales
- Third Party Distributors
Global Track and Trace Solutions Market Regional Analysis
The market is analyzed and market size insights and trends are provided country, product, solution, application, technology, end user, and distribution channel as referenced above.
The country covered in the market are U.S., Canada, Mexico, Germany, U.K., France, Italy, Spain, Switzerland, Russia, Turkey, Belgium, Netherlands, Denmark, Poland, Sweden, Norway, Finland, Rest of Europe, China, Japan, India, South Korea, Australia, Singapore, Indonesia, Thailand, Malaysia, Philippines, New Zealand, Vietnam, Taiwan, Rest of Asia-Pacific, Brazil, Argentina, Rest of South America, South Africa, Saudi Arabia, U.A.E., Qatar, Egypt, Kuwait, Bahrain, Oman, and Rest of Middle East and Africa.
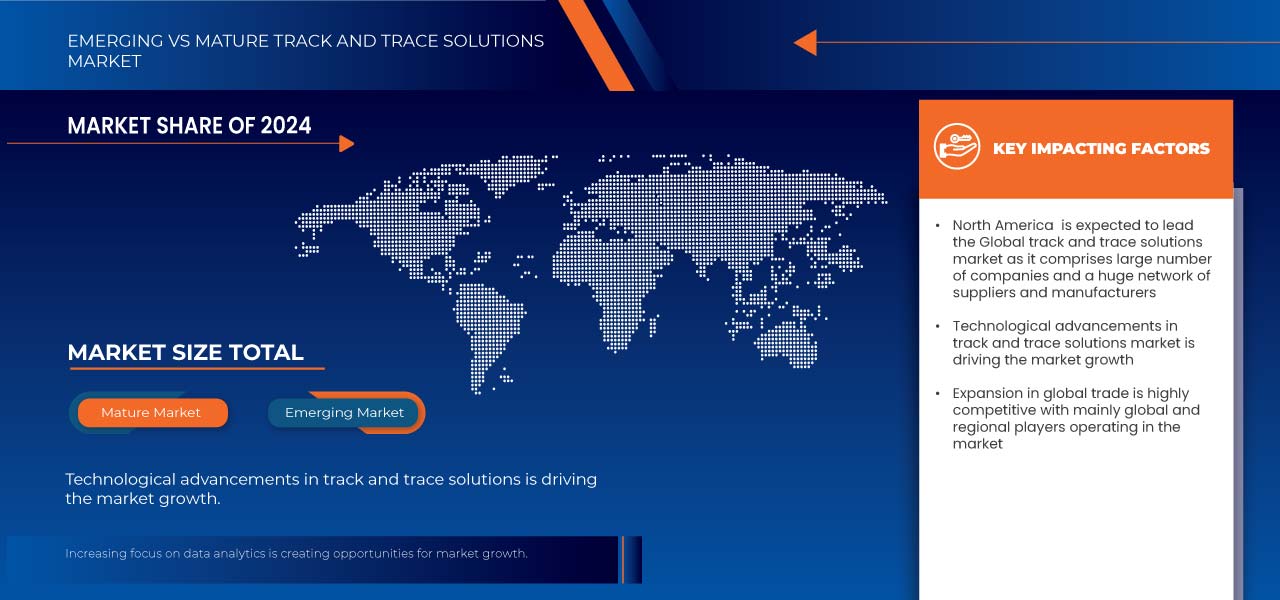
North America is expected to dominate the market due to technological advancement in the region along with the presence of major players of track and trace solutions in the region.
The Asia-Pacific region is expected to witness the fastest in the global track and trace market due to rapid industrialization, growing e-commerce, stringent regulatory requirements, and increasing concerns over counterfeit products. Additionally, expanding pharmaceutical and healthcare sectors, along with technological advancements, are driving demand for efficient supply chain visibility solutions.
The country section of the report also provides individual market impacting factors and changes in regulation in the market domestically that impacts the current and future trends of the market. Data points like down-stream and upstream value chain analysis, technical trends and porter's five forces analysis, case studies are some of the pointers used to forecast the market scenario for individual countries. Also, the presence and availability of global brands and their challenges faced due to large or scarce competition from local and domestic brands, impact of domestic tariffs and trade routes are considered while providing forecast analysis of the country data.
Global Track and Trace Solutions Market Share
The market competitive landscape provides details by competitor. Details included are company overview, company financials, revenue generated, market potential, investment in research and development, new market initiatives, global presence, production sites and facilities, production capacities, company strengths and weaknesses, product launch, product width and breadth, application dominance. The above data points provided are only related to the companies' focus related to market.
Global Track and Trace Solutions Market Leaders Operating in the Market Are:
- SAP SE (Germany)
- Zebra Technologies Corp. (U.S.)
- Videojet Technologies, Inc. (U.S.)
- METTLER TOLEDO (U.S.)
- Tracelink Inc. (U.S.)
- Siemens (Germany)
- Domino Printing Sciences plc (U.K.)
- Laetus GmbH (Germany)
- Xyntek Incorporated (U.S.)
- IBM Corporation (U.S.)
- WIPOTEC-OCS GmbH (Germany)
- 3Keys (Germany)
- ACG (India)
- NJM Packaging Inc. (U.S.)
- OPTEL GROUP (Canada)
- Systech (India)
- Robert Bosch Manufacturing Solutions GmbH (Germany)
- ANTARES VISION S.p.A. (Italy)
- Uhlmann (India)
- SEA VISION S.r.l. (Italy)
- Jekson Vision (India)
- Kevision Systems (India)
- Arvato Systems (Germany)
- Grant-Soft Ltd. (Turkey)
- PharmaSecure Inc. (U.S.)
- Axyway (France)
- SL Controls Ltd. (U.S.)
Latest Developments in Global Track and Trace Solutions Market
- In May 2024, Videojet has launched the 3350 30-Watt CO2 Laser, designed to provide high-quality, permanent marking for a variety of materials. This advanced laser solution improves operational efficiency and reduces downtime with its reliable, high-speed performance. It is particularly suited for industries requiring precision marking, like food, beverage, and pharmaceuticals
- In May 2019, METTLER TOLEDO opened its new product inspection test centre for Middle East and Africaan food and pharmaceutical processors at Barcelona. This new test center opened by the company increase its credibility in the market leading to increased demand and sales of its product in future
- In February 2020, ACG introduced an innovative blockchain-based brand platform. This new platform introduced by the company will increase its demand in the market
- In November 2019, ACG introduced the NXT Series are future ready machines which will provide smart USER experience to our customers. Under the NXT series, the machines included are Protab 300 NXT, Protab 700 NXT, BMax NXT, KartonX NXT, Verishield CS18 NXT at PMEC 2019. These new product launched by ACG will increased the demand for its product in the market
- In July 2020, Axyway had received both the AWS Healthcare Competency designation and AWS Life Sciences Competency designation from Amazon Web Services (AWS) for its solutions used in multiple industries. This recognition received by the company will increase its credibility in the market
SKU-
Obtenha acesso online ao relatório sobre a primeira nuvem de inteligência de mercado do mundo

- Painel interativo de análise de dados
- Painel de análise da empresa para oportunidades de elevado potencial de crescimento
- Acesso de analista de pesquisa para personalização e customização. consultas
- Análise da concorrência com painel interativo
- Últimas notícias, atualizações e atualizações Análise de tendências
- Aproveite o poder da análise de benchmark para um rastreio abrangente da concorrência
Índice
1 INTRODUÇÃO
1.1 OBJETIVOS DO ESTUDO
1.2 DEFINIÇÃO DE MERCADO
1.3 VISÃO GERAL DO MERCADO GLOBAL DE SOLUÇÕES DE RASTREAMENTO E RASTREAMENTO
1.4 MOEDA E PREÇOS
1.5 LIMITAÇÕES
1.6 MERCADOS COBERTOS
2 SEGMENTAÇÃO DE MERCADO
2.1 MERCADOS COBERTOS
2.2 ÂMBITO GEOGRÁFICO
2,3 ANOS CONSIDERADOS PARA O ESTUDO
2.4 MODELO DE VALIDAÇÃO DE DADOS TRIPÉ DBMR
2.5 ENTREVISTAS PRINCIPAIS COM PRINCIPAIS LÍDERES DE OPINIÃO
2.6 MODELAGEM MULTIVARIADA
2.7 GRADE DE COBERTURA DE APLICAÇÃO DE MERCADO
2.8 CURVA DA LINHA DE VIDA DOS PRODUTOS
2.9 GRADE DE POSIÇÃO DE MERCADO DBMR
2.1 ANÁLISE DA PARTICIPAÇÃO DO FORNECEDOR
2.11 FONTES SECUNDÁRIAS
2.12 PREMISSAS
3 RESUMO EXECUTIVO
4 INSIGHTS PREMIUM
4.1 ANÁLISE PESTAL
4.2 ANÁLISE DAS CINCO FORÇAS DE PORTERS
5 MERCADO GLOBAL DE SOLUÇÕES DE RASTREAMENTO E RASTREAMENTO: REGULAMENTAÇÕES
6 VISÃO GERAL DO MERCADO
6.1 MOTORISTAS
6.1.1 REGULAMENTOS E PADRÕES RIGOROSOS PARA A IMPLEMENTAÇÃO DA SERIALIZAÇÃO
6.1.2 AUMENTO DAS PREOCUPAÇÕES COM A FALSIFICAÇÃO
6.1.3 AVANÇOS TECNOLÓGICOS EM SOLUÇÕES DE RASTREAMENTO E RASTREAMENTO
6.1.4 COMPLEXIDADE NA CADEIA DE SUPRIMENTOS GLOBAL
6.2 RESTRIÇÕES
6.2.1 RESISTÊNCIA DAS PEQUENAS EMPRESAS
6.2.2 DANOS ÀS ETIQUETAS DE RASTREAMENTO DURANTE A ENTREGA
6.3 OPORTUNIDADES
6.3.1 CRESCIMENTO DO SETOR DE COMÉRCIO ELETRÔNICO
6.3.2 AUMENTANDO O FOCO NA ANÁLISE DE DADOS
6.3.3 EXPANSÃO DO COMÉRCIO GLOBAL
6.4 DESAFIOS
6.4.1 ALTOS CUSTOS DE IMPLEMENTAÇÃO
6.4.2 QUESTÕES DE SEGURANÇA E PRIVACIDADE DE DADOS
7 MERCADO GLOBAL DE SOLUÇÕES DE RASTREAMENTO E RASTREAMENTO, POR PRODUTOS
7.1 VISÃO GERAL
7.2 COMPONENTES DE SOFTWARE
7.2.1.1 GERENTE DA PLANTA
7.2.1.2 GERENTE DE EMPRESA E REDE
7.2.1.3 RASTREAMENTO DE PACOTES
7.2.1.4 RASTREAMENTO DE PALETES
7.2.1.5 RASTREAMENTO DE CASOS
7.2.1.6 GERENTE DE ARMAZÉM E REMESSA
7.2.1.7 CONTROLADOR DE LINHA
7.2.1.8 OUTROS
7.3 COMPONENTES DE HARDWARE
7.3.1.1 IMPRESSÃO E MARCAÇÃO
7.3.1.2 ETIQUETADOR
7.3.1.3 LEITOR DE CÓDIGO DE BARRAS
7.3.1.4 LEITOR RFID
7.3.1.5 CONTROLADOR DE PESO
7.3.1.6 MONITORAMENTO E VERIFICAÇÃO
7.3.1.7 OUTROS
7.4 PLATAFORMAS AUTÔNOMAS
8 MERCADO GLOBAL DE SOLUÇÕES DE RASTREAMENTO E RASTREAMENTO, POR SOLUÇÃO
8.1 VISÃO GERAL
8.2 SERIALIZAÇÃO DE NÍVEL DE LINHA E SITE
8.3 RASTREABILIDADE DE NÍVEL EMPRESARIAL EM NUVEM
8.4 SOLUÇÃO DE DISTRIBUIÇÃO E ARMAZÉM
8.5 REDE DE COMPARTILHAMENTO DE DADOS DA CADEIA DE SUPRIMENTOS
8.6 OUTROS
9 MERCADO GLOBAL DE SOLUÇÕES DE RASTREAMENTO E RASTREAMENTO, POR TECNOLOGIA
9.1 VISÃO GERAL
9.2 CÓDIGOS DE BARRAS 2D
9.3 IDENTIFICAÇÃO POR RADIOFREQUÊNCIA (RFID)
9.4 CÓDIGO DE BARRAS LINEAR/1D
10 MERCADO GLOBAL DE SOLUÇÕES DE RASTREAMENTO E RASTREAMENTO, POR APLICAÇÃO
10.1 VISÃO GERAL
10.2 SERIALIZAÇÃO
10.3 IMPRESSÃO
10.4 INSPEÇÃO DE ETIQUETAGEM E EMBALAGEM
10.5 AGREGAÇÃO
10.6 RASTREAMENTO
10.7 RASTREAMENTO
10.8 RELATÓRIOS
11 MERCADO GLOBAL DE SOLUÇÕES DE RASTREAMENTO E RASTREAMENTO, POR USUÁRIO FINAL
11.1 VISÃO GERAL
11.2 EMPRESA FARMACÊUTICA E BIOFARMACÊUTICA
11.3 PRODUTOS EMBALADOS PARA O CONSUMIDOR
11.4 PRODUTOS DE LUXO
11.5 ALIMENTOS E BEBIDAS
11.6 EMPRESAS DE DISPOSITIVOS MÉDICOS
11.7 ORGANIZAÇÕES DE FABRICAÇÃO CONTRATADA
11.8 REEMBALADORES
11.9 EMPRESAS DE COSMÉTICOS
11.1 OUTROS
12 MERCADO GLOBAL DE SOLUÇÕES DE RASTREAMENTO E RASTREAMENTO, POR CANAL DE DISTRIBUIÇÃO
12.1 VISÃO GERAL
12.2 VENDAS DIRETAS
12.3 DISTRIBUIDORES TERCEIRIZADOS
13 MERCADO GLOBAL DE SOLUÇÕES DE RASTREAMENTO E RASTREAMENTO
13.1 GLOBAL
13.2 AMÉRICA DO NORTE
13.2.1 EUA
13.2.2 CANADÁ
13.2.3 MÉXICO
13.3 EUROPA
13.3.1 ALEMANHA
13.3.2 Reino Unido
13.3.3 FRANÇA
13.3.4 ITÁLIA
13.3.5 SUÍÇA
13.3.6 ESPANHA
13.3.7 HOLANDA
13.3.8 BÉLGICA
13.3.9 TURQUIA
13.3.10 RÚSSIA
13.3.11 RESTO DA EUROPA
13.4 ÁSIA-PACÍFICO
13.4.1 CHINA
13.4.2 JAPÃO
13.4.3 ÍNDIA
13.4.4 COREIA DO SUL
13.4.5 AUSTRÁLIA
13.4.6 SINGAPURA
13.4.7 TAILÂNDIA
13.4.8 MALÁSIA
13.4.9 INDONÉSIA
13.4.10 FILIPINAS
13.4.11 RESTO DA ÁSIA-PACÍFICO
13,5 AMÉRICA DO SUL
13.5.1 BRASIL
13.5.2 ARGENTINA
13.5.3 RESTO DA AMÉRICA DO SUL
13.6 ORIENTE MÉDIO E ÁFRICA
13.6.1 ÁFRICA DO SUL
13.6.2 ARÁBIA SAUDITA
13.6.3 Emirados Árabes Unidos
13.6.4 ISRAEL
13.6.5 EGITO
13.6.6 RESTANTE DO ORIENTE MÉDIO E ÁFRICA
14 MERCADO GLOBAL DE SOLUÇÕES DE RASTREAMENTO E RASTREAMENTO: CENÁRIO DA EMPRESA
14.1 ANÁLISE DE AÇÕES DA EMPRESA: GLOBAL
14.2 ANÁLISE DE AÇÕES DA EMPRESA: AMÉRICA DO NORTE
14.3 ANÁLISE DE AÇÕES DA EMPRESA: EUROPA
14.4 ANÁLISE DE AÇÕES DA EMPRESA: ÁSIA-PACÍFICO
15 ANÁLISE SWOT
16 PERFIL DA EMPRESA
16.1 SAP SE
16.1.1 RESUMO DA EMPRESA
16.1.2 ANÁLISE DE RECEITA
16.1.3 ANÁLISE DAS AÇÕES DA EMPRESA
16.1.4 PORTFÓLIO DE PRODUTOS
16.1.5 DESENVOLVIMENTO RECENTE
16.2 ZEBRA TECHNOLOGIES CORP.
16.2.1 RESUMO DA EMPRESA
16.2.2 ANÁLISE DE RECEITA
16.2.3 ANÁLISE DAS AÇÕES DA EMPRESA
16.2.4 PORTFÓLIO DE PRODUTOS
16.2.5 DESENVOLVIMENTO RECENTE
16.3 TRACELINK INC.
16.3.1 RESUMO DA EMPRESA
16.3.2 ANÁLISE DAS AÇÕES DA EMPRESA
16.3.3 PORTFÓLIO DE PRODUTOS
16.3.4 DESENVOLVIMENTOS RECENTES
16.4 VIDEOJET TECHNOLOGIES, INC.
16.4.1 RESUMO DA EMPRESA
16.4.2 ANÁLISE DAS AÇÕES DA EMPRESA
16.4.3 PORTFÓLIO DE PRODUTOS
16.4.4 DESENVOLVIMENTO RECENTE
16,5 METTLER TOLEDO
16.5.1 RESUMO DA EMPRESA
16.5.2 ANÁLISE DE RECEITA
16.5.3 ANÁLISE DAS AÇÕES DA EMPRESA
16.5.4 PORTFÓLIO DE PRODUTOS
16.5.5 DESENVOLVIMENTO RECENTE
16,6 ACG
16.6.1 RESUMO DA EMPRESA
16.6.2 PORTFÓLIO DE PRODUTOS
16.6.3 DESENVOLVIMENTOS RECENTES
16.7 AXYWAY
16.7.1 RESUMO DA EMPRESA
16.7.2 ANÁLISE DE RECEITA
16.7.3 PORTFÓLIO DE PRODUTOS
16.7.4 DESENVOLVIMENTO RECENTE
16.8 ANTARES VISION SPA
16.8.1 RESUMO DA EMPRESA
16.8.2 ANÁLISE DE RECEITA
16.8.3 PORTFÓLIO DE PRODUTOS
16.8.4 DESENVOLVIMENTOS RECENTES
16.9 SISTEMAS ARVATO
16.9.1 RESUMO DA EMPRESA
16.9.2 PORTFÓLIO DE PRODUTOS
16.9.3 DESENVOLVIMENTO RECENTE
16.1 DOMINO PRINTING SCIENCES PLC
16.10.1 RESUMO DA EMPRESA
16.10.2 PORTFÓLIO DE PRODUTOS
16.10.3 DESENVOLVIMENTOS RECENTES
16.11 GRANT-SOFT LTDA.
16.11.1 RESUMO DA EMPRESA
16.11.2 PORTFÓLIO DE PRODUTOS
16.11.3 DESENVOLVIMENTO RECENTE
16.12 IBM CORPORAÇÃO
16.12.1 RESUMO DA EMPRESA
16.12.2 ANÁLISE DE RECEITA
16.12.3 PORTFÓLIO DE PRODUTOS
16.12.4 DESENVOLVIMENTO RECENTE
16.13 VISÃO DE JEKSON
16.13.1 RESUMO DA EMPRESA
16.13.2 PORTFÓLIO DE PRODUTOS
16.13.3 DESENVOLVIMENTOS RECENTES
16.14 3 CHAVES
16.14.1 RESUMO DA EMPRESA
16.14.2 ANÁLISE DE RECEITA
16.14.3 PORTFÓLIO DE PRODUTOS
16.14.4 DESENVOLVIMENTO RECENTE
16.15 SISTEMAS KEVISION
16.15.1 RESUMO DA EMPRESA
16.15.2 PORTFÓLIO DE PRODUTOS
16.15.3 DESENVOLVIMENTO RECENTE
16.16 LAETUS GMBH
16.16.1 RESUMO DA EMPRESA
16.16.2 PORTFÓLIO DE PRODUTOS
16.16.3 DESENVOLVIMENTO RECENTE
16.17 NJM EMBALAGEM INC.
16.17.1 RESUMO DA EMPRESA
16.17.2 PORTFÓLIO DE PRODUTOS
16.17.3 DESENVOLVIMENTOS RECENTES
16.18 GRUPO OPTEL
16.18.1 RESUMO DA EMPRESA
16.18.2 PORTFÓLIO DE PRODUTOS
16.18.3 DESENVOLVIMENTOS RECENTES
16.19 PHARMADECURE INC.
16.19.1 RESUMO DA EMPRESA
16.19.2 PORTFÓLIO DE PRODUTOS
16.19.3 DESENVOLVIMENTO RECENTE
16.2 ROBERT BOSCH SOLUÇÕES DE FABRICAÇÃO GMBH
16.20.1 RESUMO DA EMPRESA
16.20.2 PORTFÓLIO DE PRODUTOS
16.20.3 DESENVOLVIMENTO RECENTE
16.21 SEA VISION SRL
16.21.1 RESUMO DA EMPRESA
16.21.2 ANÁLISE DE RECEITA
16.21.3 PORTFÓLIO DE PRODUTOS
16.21.4 DESENVOLVIMENTO RECENTE
16.22 SIEMENS
16.22.1 RESUMO DA EMPRESA
16.22.2 ANÁLISE DE RECEITA
16.22.3 PORTFÓLIO DE PRODUTOS
16.22.4 DESENVOLVIMENTO RECENTE
16.23 SL CONTROLES LTDA
16.23.1 RESUMO DA EMPRESA
16.23.2 PORTFÓLIO DE PRODUTOS
16.23.3 DESENVOLVIMENTO RECENTE
16.24 SYSTECH
16.24.1 RESUMO DA EMPRESA
16.24.2 PORTFÓLIO DE PRODUTOS
16.24.3 DESENVOLVIMENTOS RECENTES
16.25 UHLMANN
16.25.1 RESUMO DA EMPRESA
16.25.2 PORTFÓLIO DE PRODUTOS
16.25.3 DESENVOLVIMENTOS RECENTES
16.26 WIPOTEC-OCS GMBH
16.26.1 RESUMO DA EMPRESA
16.26.2 PORTFÓLIO DE PRODUTOS
16.26.3 DESENVOLVIMENTO RECENTE
16.27 XYNTEK INCORPORATED
16.27.1 RESUMO DA EMPRESA
16.27.2 PORTFÓLIO DE PRODUTOS
16.27.3 DESENVOLVIMENTO RECENTE
17 QUESTIONÁRIO
18 RELATÓRIOS RELACIONADOS
Lista de Tabela
TABELA 1 MERCADO GLOBAL DE SOLUÇÕES DE RASTREAMENTO E RASTREAMENTO, POR PRODUTOS, 2018-2032 (MIL USD)
TABELA 2 COMPONENTES DE SOFTWARE GLOBAIS NO MERCADO DE SOLUÇÕES DE RASTREAMENTO E RASTREAMENTO, POR REGIÃO, 2018-2032 (MIL USD)
TABELA 3 COMPONENTES DE SOFTWARE GLOBAIS NO MERCADO DE SOLUÇÕES DE RASTREAMENTO E RASTREAMENTO, POR PRODUTOS, 2018-2032 (MIL USD)
TABELA 4 COMPONENTES DE HARDWARE GLOBAIS NO MERCADO DE SOLUÇÕES DE RASTREAMENTO E RASTREAMENTO, POR REGIÃO, 2018-2032 (MIL USD)
TABELA 5 COMPONENTES DE HARDWARE GLOBAIS NO MERCADO DE SOLUÇÕES DE RASTREAMENTO E RASTREAMENTO, POR PRODUTOS, 2018-2032 (MIL USD)
TABELA 6 PLATAFORMAS GLOBAIS AUTÔNOMAS NO MERCADO DE SOLUÇÕES DE RASTREAMENTO E RASTREAMENTO, POR REGIÃO, 2018-2032 (MIL USD)
TABELA 7 MERCADO GLOBAL DE SOLUÇÕES DE RASTREAMENTO E RASTREAMENTO, POR SOLUÇÃO, 2018-2032 (MIL USD)
TABELA 8 SERIALIZAÇÃO GLOBAL DE LINHA E NÍVEL DE LOCAL NO MERCADO DE SOLUÇÕES DE RASTREAMENTO E RASTREAMENTO, POR REGIÃO, 2018-2032 (MIL USD)
TABELA 9 RASTREABILIDADE DE NÍVEL EMPRESARIAL DE NUVEM GLOBAL NO MERCADO DE SOLUÇÕES DE RASTREAMENTO E RASTREAMENTO, POR REGIÃO, 2018-2032 (MIL USD)
TABELA 10 SOLUÇÃO GLOBAL DE DISTRIBUIÇÃO E ARMAZENAMENTO NO MERCADO DE SOLUÇÕES DE RASTREAMENTO E RASTREAMENTO, POR REGIÃO, 2018-2032 (MIL USD)
TABELA 11 REDE GLOBAL DE COMPARTILHAMENTO DE DADOS DA CADEIA DE SUPRIMENTOS NO MERCADO DE SOLUÇÕES DE RASTREAMENTO E RASTREAMENTO, POR REGIÃO, 2018-2032 (MIL USD)
TABELA 12 OUTROS NO MERCADO GLOBAL DE SOLUÇÕES DE RASTREAMENTO E RASTREAMENTO, POR REGIÃO, 2018-2032 (MIL USD)
TABELA 13 MERCADO GLOBAL DE SOLUÇÕES DE RASTREAMENTO E RASTREAMENTO, POR TECNOLOGIA, 2018-2032 (MIL USD)
TABELA 14 CÓDIGOS DE BARRAS 2D GLOBAIS NO MERCADO DE SOLUÇÕES DE RASTREAMENTO E RASTREAMENTO, POR REGIÃO, 2018-2032 (MIL USD)
TABELA 15 IDENTIFICAÇÃO GLOBAL POR RADIOFREQUÊNCIA (RFID) NO MERCADO DE SOLUÇÕES DE RASTREAMENTO E RASTREAMENTO, POR REGIÃO, 2018-2032 (MIL USD)
TABELA 16 CÓDIGOS DE BARRAS LINEARES/1D GLOBAIS NO MERCADO DE SOLUÇÕES DE RASTREAMENTO E RASTREAMENTO, POR REGIÃO, 2018-2032 (MIL USD)
TABELA 17 MERCADO GLOBAL DE SOLUÇÕES DE RASTREAMENTO E RASTREAMENTO, POR APLICAÇÃO, 2018-2032 (MIL USD)
TABELA 18 SERIALIZAÇÃO GLOBAL NO MERCADO DE SOLUÇÕES DE RASTREAMENTO E RASTREAMENTO, POR REGIÃO, 2018-2032 (MIL USD)
TABELA 19 SERIALIZAÇÃO GLOBAL NO MERCADO DE SOLUÇÕES DE RASTREAMENTO E RASTREAMENTO, POR APLICAÇÃO, 2018-2032 (MIL USD)
TABELA 20 IMPRESSÃO GLOBAL NO MERCADO DE SOLUÇÕES DE RASTREAMENTO E RASTREAMENTO, POR REGIÃO, 2018-2032 (MIL USD)
TABELA 21 INSPEÇÃO GLOBAL DE ETIQUETAGEM E EMBALAGEM NO MERCADO DE SOLUÇÕES DE RASTREAMENTO E RASTREAMENTO, POR REGIÃO, 2018-2032 (MIL USD)
TABELA 22 AGREGAÇÃO GLOBAL NO MERCADO DE SOLUÇÕES DE RASTREAMENTO E RASTREAMENTO, POR REGIÃO, 2018-2032 (MIL USD)
TABELA 23 AGREGAÇÃO GLOBAL NO MERCADO DE SOLUÇÕES DE RASTREAMENTO E RASTREAMENTO, POR APLICAÇÃO, 2018-2032 (MIL USD)
TABELA 24 RASTREAMENTO GLOBAL NO MERCADO DE SOLUÇÕES DE RASTREAMENTO E RASTREAMENTO, POR REGIÃO, 2018-2032 (MIL USD)
TABELA 25 RASTREAMENTO GLOBAL NO MERCADO DE SOLUÇÕES DE RASTREAMENTO E RASTREAMENTO, POR REGIÃO, 2018-2032 (MIL USD)
TABELA 26 RELATÓRIOS GLOBAIS NO MERCADO DE SOLUÇÕES DE RASTREAMENTO E RASTREAMENTO, POR REGIÃO, 2018-2032 (MIL USD)
TABELA 27 MERCADO GLOBAL DE SOLUÇÕES DE RASTREAMENTO E RASTREAMENTO, POR USUÁRIO FINAL, 2018-2032 (MIL USD)
TABELA 28 EMPRESAS FARMACÊUTICAS E BIOFARMACÊUTICAS GLOBAIS NO MERCADO DE SOLUÇÕES DE RASTREAMENTO E RASTREAMENTO, POR REGIÃO, 2018-2032 (MIL USD)
TABELA 29 PRODUTOS DE CONSUMO EMBALADOS NO MERCADO GLOBAL DE SOLUÇÕES DE RASTREAMENTO E RASTREAMENTO, POR REGIÃO, 2018-2032 (MIL USD)
TABELA 30 PRODUTOS DE LUXO GLOBAIS NO MERCADO DE SOLUÇÕES DE RASTREAMENTO E RASTREAMENTO, POR REGIÃO, 2018-2032 (MIL USD)
TABELA 31 MERCADO GLOBAL DE ALIMENTOS E BEBIDAS EM SOLUÇÕES DE RASTREAMENTO E RASTREAMENTO, POR REGIÃO, 2018-2032 (MIL USD)
TABELA 32 EMPRESAS GLOBAIS DE DISPOSITIVOS MÉDICOS NO MERCADO DE SOLUÇÕES DE RASTREAMENTO E RASTREAMENTO, POR REGIÃO, 2018-2032 (MIL USD)
TABELA 33 ORGANIZAÇÕES GLOBAIS DE FABRICAÇÃO CONTRATADA NO MERCADO DE SOLUÇÕES DE RASTREAMENTO E RASTREAMENTO, POR REGIÃO, 2018-2032 (MIL USD)
TABELA 34 REEMBALADORES GLOBAIS NO MERCADO DE SOLUÇÕES DE RASTREAMENTO E RASTREAMENTO, POR REGIÃO, 2018-2032 (MIL USD)
TABELA 35 EMPRESAS GLOBAIS DE COSMÉTICOS NO MERCADO DE SOLUÇÕES DE RASTREAMENTO E RASTREAMENTO, POR REGIÃO, 2018-2032 (MIL USD)
TABELA 36 OUTROS INGRESSOS GLOBAIS NO MERCADO DE SOLUÇÕES DE RASTREAMENTO E RASTREAMENTO, POR REGIÃO, 2018-2032 (MIL USD)
TABELA 37 MERCADO GLOBAL DE SOLUÇÕES DE RASTREAMENTO E RASTREAMENTO, POR CANAL DE DISTRIBUIÇÃO, 2018-2032 (MIL USD)
TABELA 38 VENDAS DIRETAS GLOBAIS NO MERCADO DE SOLUÇÕES DE RASTREAMENTO E RASTREAMENTO, POR REGIÃO, 2018-2032 (MIL USD)
TABELA 39 DISTRIBUIDORES TERCEIRIZADOS GLOBAIS NO MERCADO DE SOLUÇÕES DE RASTREAMENTO E RASTREAMENTO, POR REGIÃO, 2018-2032 (MIL USD)
TABELA 40 MERCADO DE SOLUÇÕES DE RASTREAMENTO E RASTREAMENTO DA AMÉRICA DO NORTE, POR PAÍS, 2018-2032 (MIL USD)
TABELA 41 MERCADO DE SOLUÇÕES DE RASTREAMENTO E RASTREAMENTO DA AMÉRICA DO NORTE, POR PRODUTOS, 2018-2032 (MIL USD)
TABELA 42 COMPONENTES DE SOFTWARE DA AMÉRICA DO NORTE NO MERCADO DE SOLUÇÕES DE RASTREAMENTO E RASTREAMENTO, POR PRODUTOS, 2018-2032 (MIL USD)
TABELA 43 COMPONENTES DE HARDWARE DA AMÉRICA DO NORTE NO MERCADO DE SOLUÇÕES DE RASTREAMENTO E RASTREAMENTO, POR PRODUTOS, 2018-2032 (MIL USD)
TABELA 44 MERCADO DE SOLUÇÕES DE RASTREAMENTO E RASTREAMENTO DA AMÉRICA DO NORTE, POR SOLUÇÃO, 2018-2032 (MIL USD)
TABELA 45 MERCADO DE SOLUÇÕES DE RASTREAMENTO E RASTREAMENTO DA AMÉRICA DO NORTE, POR APLICAÇÃO, 2018-2032 (MIL USD)
TABELA 46 SERIALIZAÇÃO NA AMÉRICA DO NORTE NO MERCADO DE SOLUÇÕES DE RASTREAMENTO E RASTREAMENTO, POR APLICAÇÃO, 2018-2032 (MIL USD)
TABELA 47 AGREGAÇÃO DA AMÉRICA DO NORTE NO MERCADO DE SOLUÇÕES DE RASTREAMENTO E RASTREAMENTO, POR APLICAÇÃO, 2018-2032 (MIL USD)
TABELA 48 MERCADO DE SOLUÇÕES DE RASTREAMENTO E RASTREAMENTO DA AMÉRICA DO NORTE, POR TECNOLOGIA, 2018-2032 (MIL USD)
TABELA 49 MERCADO DE SOLUÇÕES DE RASTREAMENTO E RASTREAMENTO DA AMÉRICA DO NORTE, POR USUÁRIO FINAL, 2018-2032 (MIL USD)
TABELA 50 MERCADO DE SOLUÇÕES DE RASTREAMENTO E RASTREAMENTO DA AMÉRICA DO NORTE, POR CANAL DE DISTRIBUIÇÃO, 2018-2032 (MIL USD)
TABELA 51 MERCADO DE SOLUÇÕES DE RASTREAMENTO E RASTREAMENTO DOS EUA, POR PRODUTOS, 2018-2032 (MIL USD)
TABELA 52 COMPONENTES DE SOFTWARE DOS EUA NO MERCADO DE SOLUÇÕES DE RASTREAMENTO E RASTREAMENTO, POR PRODUTOS, 2018-2032 (MIL USD)
TABELA 53 COMPONENTES DE HARDWARE DOS EUA NO MERCADO DE SOLUÇÕES DE RASTREAMENTO E RASTREAMENTO, POR PRODUTOS, 2018-2032 (MIL USD)
TABELA 54 MERCADO DE SOLUÇÕES DE RASTREAMENTO E RASTREAMENTO NOS EUA, POR SOLUÇÃO, 2018-2032 (MIL USD)
TABELA 55 MERCADO DE SOLUÇÕES DE RASTREAMENTO E RASTREAMENTO DOS EUA, POR APLICAÇÃO, 2018-2032 (MIL USD)
TABELA 56 SERIALIZAÇÃO NOS EUA NO MERCADO DE SOLUÇÕES DE RASTREAMENTO E RASTREAMENTO, POR APLICAÇÃO, 2018-2032 (MIL USD)
TABELA 57 AGREGAÇÃO DOS EUA NO MERCADO DE SOLUÇÕES DE RASTREAMENTO E RASTREAMENTO, POR APLICAÇÃO, 2018-2032 (MIL USD)
TABELA 58 MERCADO DE SOLUÇÕES DE RASTREAMENTO E RASTREAMENTO NOS EUA, POR TECNOLOGIA, 2018-2032 (MIL USD)
TABELA 59 MERCADO DE SOLUÇÕES DE RASTREAMENTO E RASTREAMENTO DOS EUA, POR USUÁRIO FINAL, 2018-2032 (MIL USD)
TABELA 60 MERCADO DE SOLUÇÕES DE RASTREAMENTO E RASTREAMENTO NOS EUA, POR CANAL DE DISTRIBUIÇÃO, 2018-2032 (MIL USD)
TABELA 61 MERCADO DE SOLUÇÕES DE RASTREAMENTO E RASTREAMENTO DO CANADÁ, POR PRODUTOS, 2018-2032 (MIL USD)
TABELA 62 COMPONENTES DE SOFTWARE DO CANADÁ NO MERCADO DE SOLUÇÕES DE RASTREAMENTO E RASTREAMENTO, POR PRODUTOS, 2018-2032 (MIL USD)
TABELA 63 COMPONENTES DE HARDWARE DO CANADÁ NO MERCADO DE SOLUÇÕES DE RASTREAMENTO E RASTREAMENTO, POR PRODUTOS, 2018-2032 (MIL USD)
TABELA 64 MERCADO DE SOLUÇÕES DE RASTREAMENTO E RASTREAMENTO DO CANADÁ, POR SOLUÇÃO, 2018-2032 (MIL USD)
TABELA 65 MERCADO DE SOLUÇÕES DE RASTREAMENTO E RASTREAMENTO DO CANADÁ, POR APLICAÇÃO, 2018-2032 (MIL USD)
TABELA 66 SERIALIZAÇÃO DO CANADÁ NO MERCADO DE SOLUÇÕES DE RASTREAMENTO E RASTREAMENTO, POR APLICAÇÃO, 2018-2032 (MIL USD)
TABELA 67 AGREGAÇÃO DO CANADÁ NO MERCADO DE SOLUÇÕES DE RASTREAMENTO E RASTREAMENTO, POR APLICAÇÃO, 2018-2032 (MIL USD)
TABELA 68 MERCADO DE SOLUÇÕES DE RASTREAMENTO E RASTREAMENTO DO CANADÁ, POR TECNOLOGIA, 2018-2032 (MIL USD)
TABELA 69 MERCADO DE SOLUÇÕES DE RASTREAMENTO E RASTREAMENTO DO CANADÁ, POR USUÁRIO FINAL, 2018-2032 (MIL USD)
TABELA 70 MERCADO DE SOLUÇÕES DE RASTREAMENTO E RASTREAMENTO DO CANADÁ, POR CANAL DE DISTRIBUIÇÃO, 2018-2032 (MIL USD)
TABELA 71 MERCADO DE SOLUÇÕES DE RASTREAMENTO E RASTREAMENTO DO MÉXICO, POR PRODUTOS, 2018-2032 (MIL USD)
TABELA 72 COMPONENTES DE SOFTWARE DO MÉXICO NO MERCADO DE SOLUÇÕES DE RASTREAMENTO E RASTREAMENTO, POR PRODUTOS, 2018-2032 (MIL USD)
TABELA 73 COMPONENTES DE HARDWARE DO MÉXICO NO MERCADO DE SOLUÇÕES DE RASTREAMENTO E RASTREAMENTO, POR PRODUTOS, 2018-2032 (MIL USD)
TABELA 74 MERCADO DE SOLUÇÕES DE RASTREAMENTO E RASTREAMENTO NO MÉXICO, POR SOLUÇÃO, 2018-2032 (MIL USD)
TABELA 75 MERCADO DE SOLUÇÕES DE RASTREAMENTO E RASTREAMENTO DO MÉXICO, POR APLICAÇÃO, 2018-2032 (MIL USD)
TABELA 76 SERIALIZAÇÃO NO MERCADO DE SOLUÇÕES DE RASTREAMENTO E RASTREAMENTO NO MÉXICO, POR APLICAÇÃO, 2018-2032 (MIL USD)
TABELA 77 AGREGAÇÃO DO MÉXICO NO MERCADO DE SOLUÇÕES DE RASTREAMENTO E RASTREAMENTO, POR APLICAÇÃO, 2018-2032 (MIL USD)
TABELA 78 MERCADO DE SOLUÇÕES DE RASTREAMENTO E RASTREAMENTO NO MÉXICO, POR TECNOLOGIA, 2018-2032 (MIL USD)
TABELA 79 MERCADO DE SOLUÇÕES DE RASTREAMENTO E RASTREAMENTO NO MÉXICO, POR USUÁRIO FINAL, 2018-2032 (MIL USD)
TABELA 80 MERCADO DE SOLUÇÕES DE RASTREAMENTO E RASTREAMENTO NO MÉXICO, POR CANAL DE DISTRIBUIÇÃO, 2018-2032 (MIL USD)
TABELA 81 MERCADO DE SOLUÇÕES DE RASTREAMENTO E RASTREAMENTO NA EUROPA, POR PAÍS, 2018-2032 (MIL USD)
TABELA 82 MERCADO EUROPEU DE SOLUÇÕES DE RASTREAMENTO E RASTREAMENTO, POR PRODUTOS, 2018-2032 (MIL USD)
TABELA 83 COMPONENTES DE SOFTWARE DA EUROPA NO MERCADO DE SOLUÇÕES DE RASTREAMENTO E RASTREAMENTO, POR PRODUTOS, 2018-2032 (MIL USD)
TABELA 84 COMPONENTES DE HARDWARE NA EUROPA NO MERCADO DE SOLUÇÕES DE RASTREAMENTO E RASTREAMENTO, POR PRODUTOS, 2018-2032 (MIL USD)
TABELA 85 MERCADO EUROPEU DE SOLUÇÕES DE RASTREAMENTO E RASTREAMENTO, POR SOLUÇÃO, 2018-2032 (MIL USD)
TABELA 86 MERCADO EUROPEU DE SOLUÇÕES DE RASTREAMENTO E RASTREAMENTO, POR APLICAÇÃO, 2018-2032 (MIL USD)
TABELA 87 SERIALIZAÇÃO EUROPEIA NO MERCADO DE SOLUÇÕES DE RASTREAMENTO E RASTREAMENTO, POR APLICAÇÃO, 2018-2032 (MIL USD)
TABELA 88 AGREGAÇÃO EUROPEIA NO MERCADO DE SOLUÇÕES DE RASTREAMENTO E RASTREAMENTO, POR APLICAÇÃO, 2018-2032 (MIL USD)
TABELA 89 MERCADO EUROPEU DE SOLUÇÕES DE RASTREAMENTO E RASTREAMENTO, POR TECNOLOGIA, 2018-2032 (MIL USD)
TABELA 90 MERCADO DE SOLUÇÕES DE RASTREAMENTO E RASTREAMENTO NA EUROPA, POR USUÁRIO FINAL, 2018-2032 (MIL USD)
TABELA 91 MERCADO EUROPEU DE SOLUÇÕES DE RASTREAMENTO E RASTREAMENTO, POR CANAL DE DISTRIBUIÇÃO, 2018-2032 (MIL USD)
TABELA 92 MERCADO DE SOLUÇÕES DE RASTREAMENTO E RASTREAMENTO DA ALEMANHA, POR PRODUTOS, 2018-2032 (MIL USD)
TABELA 93 COMPONENTES DE SOFTWARE DA ALEMANHA NO MERCADO DE SOLUÇÕES DE RASTREAMENTO E RASTREAMENTO, POR PRODUTOS, 2018-2032 (MIL USD)
TABELA 94 COMPONENTES DE HARDWARE DA ALEMANHA NO MERCADO DE SOLUÇÕES DE RASTREAMENTO E RASTREAMENTO, POR PRODUTOS, 2018-2032 (MIL USD)
TABELA 95 MERCADO DE SOLUÇÕES DE RASTREAMENTO E RASTREAMENTO DA ALEMANHA, POR SOLUÇÃO, 2018-2032 (MIL USD)
TABELA 96 MERCADO DE SOLUÇÕES DE RASTREAMENTO E RASTREAMENTO DA ALEMANHA, POR APLICAÇÃO, 2018-2032 (MIL USD)
TABELA 97 SERIALIZAÇÃO NA ALEMANHA NO MERCADO DE SOLUÇÕES DE RASTREAMENTO E RASTREAMENTO, POR APLICAÇÃO, 2018-2032 (MIL USD)
TABELA 98 AGREGAÇÃO DA ALEMANHA NO MERCADO DE SOLUÇÕES DE RASTREAMENTO E RASTREAMENTO, POR APLICAÇÃO, 2018-2032 (MIL USD)
TABELA 99 MERCADO DE SOLUÇÕES DE RASTREAMENTO E RASTREAMENTO DA ALEMANHA, POR TECNOLOGIA, 2018-2032 (MIL USD)
TABELA 100 MERCADO DE SOLUÇÕES DE RASTREAMENTO E RASTREAMENTO DA ALEMANHA, POR USUÁRIO FINAL, 2018-2032 (MIL USD)
TABELA 101 MERCADO DE SOLUÇÕES DE RASTREAMENTO E RASTREAMENTO DA ALEMANHA, POR CANAL DE DISTRIBUIÇÃO, 2018-2032 (MIL USD)
TABELA 102 MERCADO DE SOLUÇÕES DE RASTREAMENTO E RASTREAMENTO DO REINO UNIDO, POR PRODUTOS, 2018-2032 (MIL USD)
TABELA 103 COMPONENTES DE SOFTWARE DO REINO UNIDO NO MERCADO DE SOLUÇÕES DE RASTREAMENTO E RASTREAMENTO, POR PRODUTOS, 2018-2032 (MIL USD)
TABELA 104 COMPONENTES DE HARDWARE DO REINO UNIDO NO MERCADO DE SOLUÇÕES DE RASTREAMENTO E RASTREAMENTO, POR PRODUTOS, 2018-2032 (MIL USD)
TABELA 105 MERCADO DE SOLUÇÕES DE RASTREAMENTO E RASTREAMENTO DO REINO UNIDO, POR SOLUÇÃO, 2018-2032 (MIL USD)
TABELA 106 MERCADO DE SOLUÇÕES DE RASTREAMENTO E RASTREAMENTO DO REINO UNIDO, POR APLICAÇÃO, 2018-2032 (MIL USD)
TABELA 107 SERIALIZAÇÃO DO REINO UNIDO NO MERCADO DE SOLUÇÕES DE RASTREAMENTO E RASTREAMENTO, POR APLICAÇÃO, 2018-2032 (MIL USD)
TABELA 108 AGREGAÇÃO DO REINO UNIDO NO MERCADO DE SOLUÇÕES DE RASTREAMENTO E RASTREAMENTO, POR APLICAÇÃO, 2018-2032 (MIL USD)
TABELA 109 MERCADO DE SOLUÇÕES DE RASTREAMENTO E RASTREAMENTO DO REINO UNIDO, POR TECNOLOGIA, 2018-2032 (MIL USD)
TABELA 110 MERCADO DE SOLUÇÕES DE RASTREAMENTO E RASTREAMENTO DO REINO UNIDO, POR USUÁRIO FINAL, 2018-2032 (MIL USD)
TABELA 111 MERCADO DE SOLUÇÕES DE RASTREAMENTO E RASTREAMENTO NO REINO UNIDO, POR CANAL DE DISTRIBUIÇÃO, 2018-2032 (MIL USD)
TABELA 112 MERCADO DE SOLUÇÕES DE RASTREAMENTO E RASTREAMENTO DA FRANÇA, POR PRODUTOS, 2018-2032 (MIL USD)
TABELA 113 COMPONENTES DE SOFTWARE DA FRANÇA NO MERCADO DE SOLUÇÕES DE RASTREAMENTO E RASTREAMENTO, POR PRODUTOS, 2018-2032 (MIL USD)
TABELA 114 COMPONENTES DE HARDWARE DA FRANÇA NO MERCADO DE SOLUÇÕES DE RASTREAMENTO E RASTREAMENTO, POR PRODUTOS, 2018-2032 (MIL USD)
TABELA 115 MERCADO DE SOLUÇÕES DE RASTREAMENTO E RASTREAMENTO DA FRANÇA, POR SOLUÇÃO, 2018-2032 (MIL USD)
TABELA 116 MERCADO DE SOLUÇÕES DE RASTREAMENTO E RASTREAMENTO DA FRANÇA, POR APLICAÇÃO, 2018-2032 (MIL USD)
TABELA 117 SERIALIZAÇÃO NA FRANÇA NO MERCADO DE SOLUÇÕES DE RASTREAMENTO E RASTREAMENTO, POR APLICAÇÃO, 2018-2032 (MIL USD)
TABELA 118 AGREGAÇÃO DA FRANÇA NO MERCADO DE SOLUÇÕES DE RASTREAMENTO E RASTREAMENTO, POR APLICAÇÃO, 2018-2032 (MIL USD)
TABLE 119 FRANCE TRACK AND TRACE SOLUTIONS MARKET, BY TECHNOLOGY, 2018-2032 (USD THOUSAND)
TABLE 120 FRANCE TRACK AND TRACE SOLUTIONS MARKET, BY END USER, 2018-2032 (USD THOUSAND)
TABLE 121 FRANCE TRACK AND TRACE SOLUTIONS MARKET, BY DISTRIBUTION CHANNEL, 2018-2032 (USD THOUSAND)
TABLE 122 ITALY TRACK AND TRACE SOLUTIONS MARKET, BY PRODUCTS, 2018-2032 (USD THOUSAND)
TABLE 123 ITALY SOFTWARE COMPONENTS IN TRACK AND TRACE SOLUTIONS MARKET, BY PRODUCTS, 2018-2032 (USD THOUSAND)
TABLE 124 ITALY HARDWARE COMPONENTS IN TRACK AND TRACE SOLUTIONS MARKET, BY PRODUCTS, 2018-2032 (USD THOUSAND)
TABLE 125 ITALY TRACK AND TRACE SOLUTIONS MARKET, BY SOLUTION, 2018-2032 (USD THOUSAND)
TABLE 126 ITALY TRACK AND TRACE SOLUTIONS MARKET, BY APPLICATION, 2018-2032 (USD THOUSAND)
TABLE 127 ITALY SERIALIZATION IN TRACK AND TRACE SOLUTIONS MARKET, BY APPLICATION, 2018-2032 (USD THOUSAND)
TABLE 128 ITALY AGGREGATION IN TRACK AND TRACE SOLUTIONS MARKET, BY APPLICATION, 2018-2032 (USD THOUSAND)
TABLE 129 ITALY TRACK AND TRACE SOLUTIONS MARKET, BY TECHNOLOGY, 2018-2032 (USD THOUSAND)
TABLE 130 ITALY TRACK AND TRACE SOLUTIONS MARKET, BY END USER, 2018-2032 (USD THOUSAND)
TABLE 131 ITALY TRACK AND TRACE SOLUTIONS MARKET, BY DISTRIBUTION CHANNEL, 2018-2032 (USD THOUSAND)
TABLE 132 SWITZERLAND TRACK AND TRACE SOLUTIONS MARKET, BY PRODUCTS, 2018-2032 (USD THOUSAND)
TABLE 133 SWITZERLAND SOFTWARE COMPONENTS IN TRACK AND TRACE SOLUTIONS MARKET, BY PRODUCTS, 2018-2032 (USD THOUSAND)
TABLE 134 SWITZERLAND HARDWARE COMPONENTS IN TRACK AND TRACE SOLUTIONS MARKET, BY PRODUCTS, 2018-2032 (USD THOUSAND)
TABLE 135 SWITZERLAND TRACK AND TRACE SOLUTIONS MARKET, BY SOLUTION, 2018-2032 (USD THOUSAND)
TABLE 136 SWITZERLAND TRACK AND TRACE SOLUTIONS MARKET, BY APPLICATION, 2018-2032 (USD THOUSAND)
TABLE 137 SWITZERLAND SERIALIZATION IN TRACK AND TRACE SOLUTIONS MARKET, BY APPLICATION, 2018-2032 (USD THOUSAND)
TABLE 138 SWITZERLAND AGGREGATION IN TRACK AND TRACE SOLUTIONS MARKET, BY APPLICATION, 2018-2032 (USD THOUSAND)
TABLE 139 SWITZERLAND TRACK AND TRACE SOLUTIONS MARKET, BY TECHNOLOGY, 2018-2032 (USD THOUSAND)
TABLE 140 SWITZERLAND TRACK AND TRACE SOLUTIONS MARKET, BY END USER, 2018-2032 (USD THOUSAND)
TABLE 141 SWITZERLAND TRACK AND TRACE SOLUTIONS MARKET, BY DISTRIBUTION CHANNEL, 2018-2032 (USD THOUSAND)
TABLE 142 SPAIN TRACK AND TRACE SOLUTIONS MARKET, BY PRODUCTS, 2018-2032 (USD THOUSAND)
TABLE 143 SPAIN SOFTWARE COMPONENTS IN TRACK AND TRACE SOLUTIONS MARKET, BY PRODUCTS, 2018-2032 (USD THOUSAND)
TABLE 144 SPAIN HARDWARE COMPONENTS IN TRACK AND TRACE SOLUTIONS MARKET, BY PRODUCTS, 2018-2032 (USD THOUSAND)
TABLE 145 SPAIN TRACK AND TRACE SOLUTIONS MARKET, BY SOLUTION, 2018-2032 (USD THOUSAND)
TABLE 146 SPAIN TRACK AND TRACE SOLUTIONS MARKET, BY APPLICATION, 2018-2032 (USD THOUSAND)
TABLE 147 SPAIN SERIALIZATION IN TRACK AND TRACE SOLUTIONS MARKET, BY APPLICATION, 2018-2032 (USD THOUSAND)
TABLE 148 SPAIN AGGREGATION IN TRACK AND TRACE SOLUTIONS MARKET, BY APPLICATION, 2018-2032 (USD THOUSAND)
TABELA 149 MERCADO DE SOLUÇÕES DE RASTREAMENTO E RASTREAMENTO DA ESPANHA, POR TECNOLOGIA, 2018-2032 (MIL USD)
TABELA 150 MERCADO DE SOLUÇÕES DE RASTREAMENTO E RASTREAMENTO NA ESPANHA, POR USUÁRIO FINAL, 2018-2032 (MIL USD)
TABELA 151 MERCADO DE SOLUÇÕES DE RASTREAMENTO E RASTREAMENTO NA ESPANHA, POR CANAL DE DISTRIBUIÇÃO, 2018-2032 (MIL USD)
TABELA 152 MERCADO HOLANDÊS DE SOLUÇÕES DE RASTREAMENTO E RASTREAMENTO, POR PRODUTOS, 2018-2032 (MIL USD)
TABELA 153 COMPONENTES DE SOFTWARE DA HOLANDA NO MERCADO DE SOLUÇÕES DE RASTREAMENTO E RASTREAMENTO, POR PRODUTOS, 2018-2032 (MIL USD)
TABELA 154 COMPONENTES DE HARDWARE HOLANDÊS NO MERCADO DE SOLUÇÕES DE RASTREAMENTO E RASTREAMENTO, POR PRODUTOS, 2018-2032 (MIL USD)
TABELA 155 MERCADO HOLANDÊS DE SOLUÇÕES DE RASTREAMENTO E RASTREAMENTO, POR SOLUÇÃO, 2018-2032 (MIL USD)
TABELA 156 MERCADO HOLANDÊS DE SOLUÇÕES DE RASTREAMENTO E RASTREAMENTO, POR APLICAÇÃO, 2018-2032 (MIL USD)
TABELA 157 SERIALIZAÇÃO HOLANDESA NO MERCADO DE SOLUÇÕES DE RASTREAMENTO E RASTREAMENTO, POR APLICAÇÃO, 2018-2032 (MIL USD)
TABELA 158 AGREGAÇÃO HOLANDESA NO MERCADO DE SOLUÇÕES DE RASTREAMENTO E RASTREAMENTO, POR APLICAÇÃO, 2018-2032 (MIL USD)
TABELA 159 MERCADO HOLANDÊS DE SOLUÇÕES DE RASTREAMENTO E RASTREAMENTO, POR TECNOLOGIA, 2018-2032 (MIL USD)
TABELA 160 MERCADO HOLANDÊS DE SOLUÇÕES DE RASTREAMENTO E RASTREAMENTO, POR USUÁRIO FINAL, 2018-2032 (MIL USD)
TABELA 161 MERCADO HOLANDÊS DE SOLUÇÕES DE RASTREAMENTO E RASTREAMENTO, POR CANAL DE DISTRIBUIÇÃO, 2018-2032 (MIL USD)
TABELA 162 MERCADO BÉLGICO DE SOLUÇÕES DE RASTREAMENTO E RASTREAMENTO, POR PRODUTOS, 2018-2032 (MIL USD)
TABELA 163 COMPONENTES DE SOFTWARE DA BÉLGICA NO MERCADO DE SOLUÇÕES DE RASTREAMENTO E RASTREAMENTO, POR PRODUTOS, 2018-2032 (MIL USD)
TABELA 164 COMPONENTES DE HARDWARE DA BÉLGICA NO MERCADO DE SOLUÇÕES DE RASTREAMENTO E RASTREAMENTO, POR PRODUTOS, 2018-2032 (MIL USD)
TABELA 165 MERCADO BÉLGICO DE SOLUÇÕES DE RASTREAMENTO E RASTREAMENTO, POR SOLUÇÃO, 2018-2032 (MIL USD)
TABELA 166 MERCADO BÉLGICO DE SOLUÇÕES DE RASTREAMENTO E RASTREAMENTO, POR APLICAÇÃO, 2018-2032 (MIL USD)
TABELA 167 SERIALIZAÇÃO BÉLGICA NO MERCADO DE SOLUÇÕES DE RASTREAMENTO E RASTREAMENTO, POR APLICAÇÃO, 2018-2032 (MIL USD)
TABELA 168 AGREGAÇÃO DA BÉLGICA NO MERCADO DE SOLUÇÕES DE RASTREAMENTO E RASTREAMENTO, POR APLICAÇÃO, 2018-2032 (MIL USD)
TABELA 169 MERCADO BÉLGICO DE SOLUÇÕES DE RASTREAMENTO E RASTREAMENTO, POR TECNOLOGIA, 2018-2032 (MIL USD)
TABELA 170 MERCADO BÉLGICO DE SOLUÇÕES DE RASTREAMENTO E RASTREAMENTO, POR USUÁRIO FINAL, 2018-2032 (MIL USD)
TABELA 171 MERCADO BÉLGICO DE SOLUÇÕES DE RASTREAMENTO E RASTREAMENTO, POR CANAL DE DISTRIBUIÇÃO, 2018-2032 (MIL USD)
TABELA 172 MERCADO DE SOLUÇÕES DE RASTREAMENTO E RASTREAMENTO NA TURQUIA, POR PRODUTOS, 2018-2032 (MIL USD)
TABELA 173 COMPONENTES DE SOFTWARE DA TURQUIA NO MERCADO DE SOLUÇÕES DE RASTREAMENTO E RASTREAMENTO, POR PRODUTOS, 2018-2032 (MIL USD)
TABELA 174 COMPONENTES DE HARDWARE DA TURQUIA NO MERCADO DE SOLUÇÕES DE RASTREAMENTO E RASTREAMENTO, POR PRODUTOS, 2018-2032 (MIL USD)
TABELA 175 MERCADO DE SOLUÇÕES DE RASTREAMENTO E RASTREAMENTO NA TURQUIA, POR SOLUÇÃO, 2018-2032 (MIL USD)
TABELA 176 MERCADO DE SOLUÇÕES DE RASTREAMENTO E RASTREAMENTO NA TURQUIA, POR APLICAÇÃO, 2018-2032 (MIL USD)
TABELA 177 SERIALIZAÇÃO DA TURQUIA NO MERCADO DE SOLUÇÕES DE RASTREAMENTO E RASTREAMENTO, POR APLICAÇÃO, 2018-2032 (MIL USD)
TABELA 178 AGREGAÇÃO DA TURQUIA NO MERCADO DE SOLUÇÕES DE RASTREAMENTO E RASTREAMENTO, POR APLICAÇÃO, 2018-2032 (MIL USD)
TABELA 179 MERCADO DE SOLUÇÕES DE RASTREAMENTO E RASTREAMENTO DA TURQUIA, POR TECNOLOGIA, 2018-2032 (MIL USD)
TABELA 180 MERCADO DE SOLUÇÕES DE RASTREAMENTO E RASTREAMENTO NA TURQUIA, POR USUÁRIO FINAL, 2018-2032 (MIL USD)
TABELA 181 MERCADO DE SOLUÇÕES DE RASTREAMENTO E RASTREAMENTO NA TURQUIA, POR CANAL DE DISTRIBUIÇÃO, 2018-2032 (MIL USD)
TABELA 182 MERCADO DE SOLUÇÕES DE RASTREAMENTO E RASTREAMENTO DA RÚSSIA, POR PRODUTOS, 2018-2032 (MIL USD)
TABELA 183 COMPONENTES DE SOFTWARE DA RÚSSIA NO MERCADO DE SOLUÇÕES DE RASTREAMENTO E RASTREAMENTO, POR PRODUTOS, 2018-2032 (MIL USD)
TABELA 184 COMPONENTES DE HARDWARE DA RÚSSIA NO MERCADO DE SOLUÇÕES DE RASTREAMENTO E RASTREAMENTO, POR PRODUTOS, 2018-2032 (MIL USD)
TABELA 185 MERCADO DE SOLUÇÕES DE RASTREAMENTO E RASTREAMENTO DA RÚSSIA, POR SOLUÇÃO, 2018-2032 (MIL USD)
TABELA 186 MERCADO DE SOLUÇÕES DE RASTREAMENTO E RASTREAMENTO DA RÚSSIA, POR APLICAÇÃO, 2018-2032 (MIL USD)
TABELA 187 SERIALIZAÇÃO DA RÚSSIA NO MERCADO DE SOLUÇÕES DE RASTREAMENTO E RASTREAMENTO, POR APLICAÇÃO, 2018-2032 (MIL USD)
TABELA 188 AGREGAÇÃO DA RÚSSIA NO MERCADO DE SOLUÇÕES DE RASTREAMENTO E RASTREAMENTO, POR APLICAÇÃO, 2018-2032 (MIL USD)
TABELA 189 MERCADO DE SOLUÇÕES DE RASTREAMENTO E RASTREAMENTO DA RÚSSIA, POR TECNOLOGIA, 2018-2032 (MIL USD)
TABELA 190 MERCADO DE SOLUÇÕES DE RASTREAMENTO E RASTREAMENTO DA RÚSSIA, POR USUÁRIO FINAL, 2018-2032 (MIL USD)
TABELA 191 MERCADO DE SOLUÇÕES DE RASTREAMENTO E RASTREAMENTO DA RÚSSIA, POR CANAL DE DISTRIBUIÇÃO, 2018-2032 (MIL USD)
TABELA 192 MERCADO DE SOLUÇÕES DE RASTREAMENTO E RASTREAMENTO DO RESTO DA EUROPA, POR PRODUTOS, 2018-2032 (MIL USD)
TABELA 193 MERCADO DE SOLUÇÕES DE RASTREAMENTO E RASTREAMENTO NA ÁSIA-PACÍFICO, POR PAÍS, 2018-2032 (MIL USD)
TABELA 194 MERCADO DE SOLUÇÕES DE RASTREAMENTO E RASTREAMENTO DA ÁSIA-PACÍFICO, POR PRODUTOS, 2018-2032 (MIL USD)
TABELA 195 COMPONENTES DE SOFTWARE DA ÁSIA-PACÍFICO NO MERCADO DE SOLUÇÕES DE RASTREAMENTO E RASTREAMENTO, POR PRODUTOS, 2018-2032 (MIL USD)
TABELA 196 COMPONENTES DE HARDWARE DA ÁSIA-PACÍFICO NO MERCADO DE SOLUÇÕES DE RASTREAMENTO E RASTREAMENTO, POR PRODUTOS, 2018-2032 (MIL USD)
TABELA 197 MERCADO DE SOLUÇÕES DE RASTREAMENTO E RASTREAMENTO NA ÁSIA-PACÍFICO, POR SOLUÇÃO, 2018-2032 (MIL USD)
TABELA 198 MERCADO DE SOLUÇÕES DE RASTREAMENTO E RASTREAMENTO NA ÁSIA-PACÍFICO, POR APLICAÇÃO, 2018-2032 (MIL USD)
TABELA 199 SERIALIZAÇÃO DA ÁSIA-PACÍFICO NO MERCADO DE SOLUÇÕES DE RASTREAMENTO E RASTREAMENTO, POR APLICAÇÃO, 2018-2032 (MIL USD)
TABELA 200 AGREGAÇÃO DA ÁSIA-PACÍFICO NO MERCADO DE SOLUÇÕES DE RASTREAMENTO E RASTREAMENTO, POR APLICAÇÃO, 2018-2032 (MIL USD)
TABELA 201 MERCADO DE SOLUÇÕES DE RASTREAMENTO E RASTREAMENTO NA ÁSIA-PACÍFICO, POR TECNOLOGIA, 2018-2032 (MIL USD)
TABELA 202 MERCADO DE SOLUÇÕES DE RASTREAMENTO E RASTREAMENTO NA ÁSIA-PACÍFICO, POR USUÁRIO FINAL, 2018-2032 (MIL USD)
TABELA 203 MERCADO DE SOLUÇÕES DE RASTREAMENTO E RASTREAMENTO NA ÁSIA-PACÍFICO, POR CANAL DE DISTRIBUIÇÃO, 2018-2032 (MIL USD)
TABELA 204 MERCADO DE SOLUÇÕES DE RASTREAMENTO E RASTREAMENTO DA CHINA, POR PRODUTOS, 2018-2032 (MIL USD)
TABELA 205 COMPONENTES DE SOFTWARE DA CHINA NO MERCADO DE SOLUÇÕES DE RASTREAMENTO E RASTREAMENTO, POR PRODUTOS, 2018-2032 (MIL USD)
TABELA 206 COMPONENTES DE HARDWARE DA CHINA NO MERCADO DE SOLUÇÕES DE RASTREAMENTO E RASTREAMENTO, POR PRODUTOS, 2018-2032 (MIL USD)
TABELA 207 MERCADO DE SOLUÇÕES DE RASTREAMENTO E RASTREAMENTO DA CHINA, POR SOLUÇÃO, 2018-2032 (MIL USD)
TABELA 208 MERCADO DE SOLUÇÕES DE RASTREAMENTO E RASTREAMENTO DA CHINA, POR APLICAÇÃO, 2018-2032 (MIL USD)
TABLE 209 CHINA SERIALIZATION IN TRACK AND TRACE SOLUTIONS MARKET, BY APPLICATION, 2018-2032 (USD THOUSAND)
TABLE 210 CHINA AGGREGATION IN TRACK AND TRACE SOLUTIONS MARKET, BY APPLICATION, 2018-2032 (USD THOUSAND)
TABLE 211 CHINA TRACK AND TRACE SOLUTIONS MARKET, BY TECHNOLOGY, 2018-2032 (USD THOUSAND)
TABLE 212 CHINA TRACK AND TRACE SOLUTIONS MARKET, BY END USER, 2018-2032 (USD THOUSAND)
TABLE 213 CHINA TRACK AND TRACE SOLUTIONS MARKET, BY DISTRIBUTION CHANNEL, 2018-2032 (USD THOUSAND)
TABLE 214 JAPAN TRACK AND TRACE SOLUTIONS MARKET, BY PRODUCTS, 2018-2032 (USD THOUSAND)
TABLE 215 JAPAN SOFTWARE COMPONENTS IN TRACK AND TRACE SOLUTIONS MARKET, BY PRODUCTS, 2018-2032 (USD THOUSAND)
TABLE 216 JAPAN HARDWARE COMPONENTS IN TRACK AND TRACE SOLUTIONS MARKET, BY PRODUCTS, 2018-2032 (USD THOUSAND)
TABLE 217 JAPAN TRACK AND TRACE SOLUTIONS MARKET, BY SOLUTION, 2018-2032 (USD THOUSAND)
TABLE 218 JAPAN TRACK AND TRACE SOLUTIONS MARKET, BY APPLICATION, 2018-2032 (USD THOUSAND)
TABLE 219 JAPAN SERIALIZATION IN TRACK AND TRACE SOLUTIONS MARKET, BY APPLICATION, 2018-2032 (USD THOUSAND)
TABLE 220 JAPAN AGGREGATION IN TRACK AND TRACE SOLUTIONS MARKET, BY APPLICATION, 2018-2032 (USD THOUSAND)
TABLE 221 JAPAN TRACK AND TRACE SOLUTIONS MARKET, BY TECHNOLOGY, 2018-2032 (USD THOUSAND)
TABLE 222 JAPAN TRACK AND TRACE SOLUTIONS MARKET, BY END USER, 2018-2032 (USD THOUSAND)
TABLE 223 JAPAN TRACK AND TRACE SOLUTIONS MARKET, BY DISTRIBUTION CHANNEL, 2018-2032 (USD THOUSAND)
TABLE 224 INDIA TRACK AND TRACE SOLUTIONS MARKET, BY PRODUCTS, 2018-2032 (USD THOUSAND)
TABLE 225 INDIA SOFTWARE COMPONENTS IN TRACK AND TRACE SOLUTIONS MARKET, BY PRODUCTS, 2018-2032 (USD THOUSAND)
TABLE 226 INDIA HARDWARE COMPONENTS IN TRACK AND TRACE SOLUTIONS MARKET, BY PRODUCTS, 2018-2032 (USD THOUSAND)
TABLE 227 INDIA TRACK AND TRACE SOLUTIONS MARKET, BY SOLUTION, 2018-2032 (USD THOUSAND)
TABLE 228 INDIA TRACK AND TRACE SOLUTIONS MARKET, BY APPLICATION, 2018-2032 (USD THOUSAND)
TABLE 229 INDIA SERIALIZATION IN TRACK AND TRACE SOLUTIONS MARKET, BY APPLICATION, 2018-2032 (USD THOUSAND)
TABLE 230 INDIA AGGREGATION IN TRACK AND TRACE SOLUTIONS MARKET, BY APPLICATION, 2018-2032 (USD THOUSAND)
TABLE 231 INDIA TRACK AND TRACE SOLUTIONS MARKET, BY TECHNOLOGY, 2018-2032 (USD THOUSAND)
TABLE 232 INDIA TRACK AND TRACE SOLUTIONS MARKET, BY END USER, 2018-2032 (USD THOUSAND)
TABLE 233 INDIA TRACK AND TRACE SOLUTIONS MARKET, BY DISTRIBUTION CHANNEL, 2018-2032 (USD THOUSAND)
TABLE 234 SOUTH KOREA TRACK AND TRACE SOLUTIONS MARKET, BY PRODUCTS, 2018-2032 (USD THOUSAND)
TABLE 235 SOUTH KOREA SOFTWARE COMPONENTS IN TRACK AND TRACE SOLUTIONS MARKET, BY PRODUCTS, 2018-2032 (USD THOUSAND)
TABLE 236 SOUTH KOREA HARDWARE COMPONENTS IN TRACK AND TRACE SOLUTIONS MARKET, BY PRODUCTS, 2018-2032 (USD THOUSAND)
TABLE 237 SOUTH KOREA TRACK AND TRACE SOLUTIONS MARKET, BY SOLUTION, 2018-2032 (USD THOUSAND)
TABLE 238 SOUTH KOREA TRACK AND TRACE SOLUTIONS MARKET, BY APPLICATION, 2018-2032 (USD THOUSAND)
TABLE 239 SOUTH KOREA SERIALIZATION IN TRACK AND TRACE SOLUTIONS MARKET, BY APPLICATION, 2018-2032 (USD THOUSAND)
TABLE 240 SOUTH KOREA AGGREGATION IN TRACK AND TRACE SOLUTIONS MARKET, BY APPLICATION, 2018-2032 (USD THOUSAND)
TABLE 241 SOUTH KOREA TRACK AND TRACE SOLUTIONS MARKET, BY TECHNOLOGY, 2018-2032 (USD THOUSAND)
TABLE 242 SOUTH KOREA TRACK AND TRACE SOLUTIONS MARKET, BY END USER, 2018-2032 (USD THOUSAND)
TABLE 243 SOUTH KOREA TRACK AND TRACE SOLUTIONS MARKET, BY DISTRIBUTION CHANNEL, 2018-2032 (USD THOUSAND)
TABLE 244 AUSTRALIA TRACK AND TRACE SOLUTIONS MARKET, BY PRODUCTS, 2018-2032 (USD THOUSAND)
TABLE 245 AUSTRALIA SOFTWARE COMPONENTS IN TRACK AND TRACE SOLUTIONS MARKET, BY PRODUCTS, 2018-2032 (USD THOUSAND)
TABLE 246 AUSTRALIA HARDWARE COMPONENTS IN TRACK AND TRACE SOLUTIONS MARKET, BY PRODUCTS, 2018-2032 (USD THOUSAND)
TABLE 247 AUSTRALIA TRACK AND TRACE SOLUTIONS MARKET, BY SOLUTION, 2018-2032 (USD THOUSAND)
TABLE 248 AUSTRALIA TRACK AND TRACE SOLUTIONS MARKET, BY APPLICATION, 2018-2032 (USD THOUSAND)
TABLE 249 AUSTRALIA SERIALIZATION IN TRACK AND TRACE SOLUTIONS MARKET, BY APPLICATION, 2018-2032 (USD THOUSAND)
TABLE 250 AUSTRALIA AGGREGATION IN TRACK AND TRACE SOLUTIONS MARKET, BY APPLICATION, 2018-2032 (USD THOUSAND)
TABLE 251 AUSTRALIA TRACK AND TRACE SOLUTIONS MARKET, BY TECHNOLOGY, 2018-2032 (USD THOUSAND)
TABLE 252 AUSTRALIA TRACK AND TRACE SOLUTIONS MARKET, BY END USER, 2018-2032 (USD THOUSAND)
TABLE 253 AUSTRALIA TRACK AND TRACE SOLUTIONS MARKET, BY DISTRIBUTION CHANNEL, 2018-2032 (USD THOUSAND)
TABLE 254 SINGAPORE TRACK AND TRACE SOLUTIONS MARKET, BY PRODUCTS, 2018-2032 (USD THOUSAND)
TABLE 255 SINGAPORE SOFTWARE COMPONENTS IN TRACK AND TRACE SOLUTIONS MARKET, BY PRODUCTS, 2018-2032 (USD THOUSAND)
TABLE 256 SINGAPORE HARDWARE COMPONENTS IN TRACK AND TRACE SOLUTIONS MARKET, BY PRODUCTS, 2018-2032 (USD THOUSAND)
TABLE 257 SINGAPORE TRACK AND TRACE SOLUTIONS MARKET, BY SOLUTION, 2018-2032 (USD THOUSAND)
TABLE 258 SINGAPORE TRACK AND TRACE SOLUTIONS MARKET, BY APPLICATION, 2018-2032 (USD THOUSAND)
TABLE 259 SINGAPORE SERIALIZATION IN TRACK AND TRACE SOLUTIONS MARKET, BY APPLICATION, 2018-2032 (USD THOUSAND)
TABLE 260 SINGAPORE AGGREGATION IN TRACK AND TRACE SOLUTIONS MARKET, BY APPLICATION, 2018-2032 (USD THOUSAND)
TABLE 261 SINGAPORE TRACK AND TRACE SOLUTIONS MARKET, BY TECHNOLOGY, 2018-2032 (USD THOUSAND)
TABLE 262 SINGAPORE TRACK AND TRACE SOLUTIONS MARKET, BY END USER, 2018-2032 (USD THOUSAND)
TABLE 263 SINGAPORE TRACK AND TRACE SOLUTIONS MARKET, BY DISTRIBUTION CHANNEL, 2018-2032 (USD THOUSAND)
TABLE 264 THAILAND TRACK AND TRACE SOLUTIONS MARKET, BY PRODUCTS, 2018-2032 (USD THOUSAND)
TABLE 265 THAILAND SOFTWARE COMPONENTS IN TRACK AND TRACE SOLUTIONS MARKET, BY PRODUCTS, 2018-2032 (USD THOUSAND)
TABLE 266 THAILAND HARDWARE COMPONENTS IN TRACK AND TRACE SOLUTIONS MARKET, BY PRODUCTS, 2018-2032 (USD THOUSAND)
TABLE 267 THAILAND TRACK AND TRACE SOLUTIONS MARKET, BY SOLUTION, 2018-2032 (USD THOUSAND)
TABLE 268 THAILAND TRACK AND TRACE SOLUTIONS MARKET, BY APPLICATION, 2018-2032 (USD THOUSAND)
TABLE 269 THAILAND SERIALIZATION IN TRACK AND TRACE SOLUTIONS MARKET, BY APPLICATION, 2018-2032 (USD THOUSAND)
TABLE 270 THAILAND AGGREGATION IN TRACK AND TRACE SOLUTIONS MARKET, BY APPLICATION, 2018-2032 (USD THOUSAND)
TABLE 271 THAILAND TRACK AND TRACE SOLUTIONS MARKET, BY TECHNOLOGY, 2018-2032 (USD THOUSAND)
TABLE 272 THAILAND TRACK AND TRACE SOLUTIONS MARKET, BY END USER, 2018-2032 (USD THOUSAND)
TABLE 273 THAILAND TRACK AND TRACE SOLUTIONS MARKET, BY DISTRIBUTION CHANNEL, 2018-2032 (USD THOUSAND)
TABLE 274 MALAYSIA TRACK AND TRACE SOLUTIONS MARKET, BY PRODUCTS, 2018-2032 (USD THOUSAND)
TABLE 275 MALAYSIA SOFTWARE COMPONENTS IN TRACK AND TRACE SOLUTIONS MARKET, BY PRODUCTS, 2018-2032 (USD THOUSAND)
TABLE 276 MALAYSIA HARDWARE COMPONENTS IN TRACK AND TRACE SOLUTIONS MARKET, BY PRODUCTS, 2018-2032 (USD THOUSAND)
TABLE 277 MALAYSIA TRACK AND TRACE SOLUTIONS MARKET, BY SOLUTION, 2018-2032 (USD THOUSAND)
TABLE 278 MALAYSIA TRACK AND TRACE SOLUTIONS MARKET, BY APPLICATION, 2018-2032 (USD THOUSAND)
TABLE 279 MALAYSIA SERIALIZATION IN TRACK AND TRACE SOLUTIONS MARKET, BY APPLICATION, 2018-2032 (USD THOUSAND)
TABLE 280 MALAYSIA AGGREGATION IN TRACK AND TRACE SOLUTIONS MARKET, BY APPLICATION, 2018-2032 (USD THOUSAND)
TABLE 281 MALAYSIA TRACK AND TRACE SOLUTIONS MARKET, BY TECHNOLOGY, 2018-2032 (USD THOUSAND)
TABLE 282 MALAYSIA TRACK AND TRACE SOLUTIONS MARKET, BY END USER, 2018-2032 (USD THOUSAND)
TABLE 283 MALAYSIA TRACK AND TRACE SOLUTIONS MARKET, BY DISTRIBUTION CHANNEL, 2018-2032 (USD THOUSAND)
TABLE 284 INDONESIA TRACK AND TRACE SOLUTIONS MARKET, BY PRODUCTS, 2018-2032 (USD THOUSAND)
TABLE 285 INDONESIA SOFTWARE COMPONENTS IN TRACK AND TRACE SOLUTIONS MARKET, BY PRODUCTS, 2018-2032 (USD THOUSAND)
TABLE 286 INDONESIA HARDWARE COMPONENTS IN TRACK AND TRACE SOLUTIONS MARKET, BY PRODUCTS, 2018-2032 (USD THOUSAND)
TABLE 287 INDONESIA TRACK AND TRACE SOLUTIONS MARKET, BY SOLUTION, 2018-2032 (USD THOUSAND)
TABLE 288 INDONESIA TRACK AND TRACE SOLUTIONS MARKET, BY APPLICATION, 2018-2032 (USD THOUSAND)
TABLE 289 INDONESIA SERIALIZATION IN TRACK AND TRACE SOLUTIONS MARKET, BY APPLICATION, 2018-2032 (USD THOUSAND)
TABLE 290 INDONESIA AGGREGATION IN TRACK AND TRACE SOLUTIONS MARKET, BY APPLICATION, 2018-2032 (USD THOUSAND)
TABLE 291 INDONESIA TRACK AND TRACE SOLUTIONS MARKET, BY TECHNOLOGY, 2018-2032 (USD THOUSAND)
TABLE 292 INDONESIA TRACK AND TRACE SOLUTIONS MARKET, BY END USER, 2018-2032 (USD THOUSAND)
TABLE 293 INDONESIA TRACK AND TRACE SOLUTIONS MARKET, BY DISTRIBUTION CHANNEL, 2018-2032 (USD THOUSAND)
TABLE 294 PHILIPPINES TRACK AND TRACE SOLUTIONS MARKET, BY PRODUCTS, 2018-2032 (USD THOUSAND)
TABLE 295 PHILIPPINES SOFTWARE COMPONENTS IN TRACK AND TRACE SOLUTIONS MARKET, BY PRODUCTS, 2018-2032 (USD THOUSAND)
TABLE 296 PHILIPPINES HARDWARE COMPONENTS IN TRACK AND TRACE SOLUTIONS MARKET, BY PRODUCTS, 2018-2032 (USD THOUSAND)
TABLE 297 PHILIPPINES TRACK AND TRACE SOLUTIONS MARKET, BY SOLUTION, 2018-2032 (USD THOUSAND)
TABLE 298 PHILIPPINES TRACK AND TRACE SOLUTIONS MARKET, BY APPLICATION, 2018-2032 (USD THOUSAND)
TABLE 299 PHILIPPINES SERIALIZATION IN TRACK AND TRACE SOLUTIONS MARKET, BY APPLICATION, 2018-2032 (USD THOUSAND)
TABLE 300 PHILIPPINES AGGREGATION IN TRACK AND TRACE SOLUTIONS MARKET, BY APPLICATION, 2018-2032 (USD THOUSAND)
TABLE 301 PHILIPPINES TRACK AND TRACE SOLUTIONS MARKET, BY TECHNOLOGY, 2018-2032 (USD THOUSAND)
TABLE 302 PHILIPPINES TRACK AND TRACE SOLUTIONS MARKET, BY END USER, 2018-2032 (USD THOUSAND)
TABLE 303 PHILIPPINES TRACK AND TRACE SOLUTIONS MARKET, BY DISTRIBUTION CHANNEL, 2018-2032 (USD THOUSAND)
TABLE 304 REST OF ASIA-PACIFIC TRACK AND TRACE SOLUTIONS MARKET, BY PRODUCTS, 2018-2032 (USD THOUSAND)
TABLE 305 SOUTH AMERICA TRACK AND TRACE SOLUTIONS MARKET, BY COUNTRY, 2018-2032 (USD THOUSAND)
TABLE 306 SOUTH AMERICA TRACK AND TRACE SOLUTIONS MARKET, BY PRODUCTS, 2018-2032 (USD THOUSAND)
TABLE 307 SOUTH AMERICA SOFTWARE COMPONENTS IN TRACK AND TRACE SOLUTIONS MARKET, BY PRODUCTS, 2018-2032 (USD THOUSAND)
TABLE 308 SOUTH AMERICA HARDWARE COMPONENTS IN TRACK AND TRACE SOLUTIONS MARKET, BY PRODUCTS, 2018-2032 (USD THOUSAND)
TABLE 309 SOUTH AMERICA TRACK AND TRACE SOLUTIONS MARKET, BY SOLUTION, 2018-2032 (USD THOUSAND)
TABLE 310 SOUTH AMERICA TRACK AND TRACE SOLUTIONS MARKET, BY APPLICATION, 2018-2032 (USD THOUSAND)
TABLE 311 SOUTH AMERICA SERIALIZATION IN TRACK AND TRACE SOLUTIONS MARKET, BY APPLICATION, 2018-2032 (USD THOUSAND)
TABLE 312 SOUTH AMERICA AGGREGATION IN TRACK AND TRACE SOLUTIONS MARKET, BY APPLICATION, 2018-2032 (USD THOUSAND)
TABLE 313 SOUTH AMERICA TRACK AND TRACE SOLUTIONS MARKET, BY TECHNOLOGY, 2018-2032 (USD THOUSAND)
TABLE 314 SOUTH AMERICA TRACK AND TRACE SOLUTIONS MARKET, BY END USER, 2018-2032 (USD THOUSAND)
TABLE 315 SOUTH AMERICA TRACK AND TRACE SOLUTIONS MARKET, BY DISTRIBUTION CHANNEL, 2018-2032 (USD THOUSAND)
TABLE 316 BRAZIL TRACK AND TRACE SOLUTIONS MARKET, BY PRODUCTS, 2018-2032 (USD THOUSAND)
TABLE 317 BRAZIL SOFTWARE COMPONENTS IN TRACK AND TRACE SOLUTIONS MARKET, BY PRODUCTS, 2018-2032 (USD THOUSAND)
TABLE 318 BRAZIL HARDWARE COMPONENTS IN TRACK AND TRACE SOLUTIONS MARKET, BY PRODUCTS, 2018-2032 (USD THOUSAND)
TABLE 319 BRAZIL TRACK AND TRACE SOLUTIONS MARKET, BY SOLUTION, 2018-2032 (USD THOUSAND)
TABLE 320 BRAZIL TRACK AND TRACE SOLUTIONS MARKET, BY APPLICATION, 2018-2032 (USD THOUSAND)
TABLE 321 BRAZIL SERIALIZATION IN TRACK AND TRACE SOLUTIONS MARKET, BY APPLICATION, 2018-2032 (USD THOUSAND)
TABLE 322 BRAZIL AGGREGATION IN TRACK AND TRACE SOLUTIONS MARKET, BY APPLICATION, 2018-2032 (USD THOUSAND)
TABLE 323 BRAZIL TRACK AND TRACE SOLUTIONS MARKET, BY TECHNOLOGY, 2018-2032 (USD THOUSAND)
TABLE 324 BRAZIL TRACK AND TRACE SOLUTIONS MARKET, BY END USER, 2018-2032 (USD THOUSAND)
TABLE 325 BRAZIL TRACK AND TRACE SOLUTIONS MARKET, BY DISTRIBUTION CHANNEL, 2018-2032 (USD THOUSAND)
TABLE 326 ARGENTINA TRACK AND TRACE SOLUTIONS MARKET, BY PRODUCTS, 2018-2032 (USD THOUSAND)
TABLE 327 ARGENTINA SOFTWARE COMPONENTS IN TRACK AND TRACE SOLUTIONS MARKET, BY PRODUCTS, 2018-2032 (USD THOUSAND)
TABLE 328 ARGENTINA HARDWARE COMPONENTS IN TRACK AND TRACE SOLUTIONS MARKET, BY PRODUCTS, 2018-2032 (USD THOUSAND)
TABLE 329 ARGENTINA TRACK AND TRACE SOLUTIONS MARKET, BY SOLUTION, 2018-2032 (USD THOUSAND)
TABLE 330 ARGENTINA TRACK AND TRACE SOLUTIONS MARKET, BY APPLICATION, 2018-2032 (USD THOUSAND)
TABLE 331 ARGENTINA SERIALIZATION IN TRACK AND TRACE SOLUTIONS MARKET, BY APPLICATION, 2018-2032 (USD THOUSAND)
TABLE 332 ARGENTINA AGGREGATION IN TRACK AND TRACE SOLUTIONS MARKET, BY APPLICATION, 2018-2032 (USD THOUSAND)
TABLE 333 ARGENTINA TRACK AND TRACE SOLUTIONS MARKET, BY TECHNOLOGY, 2018-2032 (USD THOUSAND)
TABLE 334 ARGENTINA TRACK AND TRACE SOLUTIONS MARKET, BY END USER, 2018-2032 (USD THOUSAND)
TABLE 335 ARGENTINA TRACK AND TRACE SOLUTIONS MARKET, BY DISTRIBUTION CHANNEL, 2018-2032 (USD THOUSAND)
TABLE 336 REST OF SOUTH AMERICA TRACK AND TRACE SOLUTIONS MARKET, BY PRODUCTS, 2018-2032 (USD THOUSAND)
TABLE 337 MIDDLE EAST AND AFRICA TRACK AND TRACE SOLUTIONS MARKET, BY COUNTRY, 2018-2032 (USD THOUSAND)
TABLE 338 MIDDLE EAST AND AFRICA TRACK AND TRACE SOLUTIONS MARKET, BY PRODUCTS, 2018-2032 (USD THOUSAND)
TABLE 339 MIDDLE EAST AND AFRICA SOFTWARE COMPONENTS IN TRACK AND TRACE SOLUTIONS MARKET, BY PRODUCTS, 2018-2032 (USD THOUSAND)
TABLE 340 MIDDLE EAST AND AFRICA HARDWARE COMPONENTS IN TRACK AND TRACE SOLUTIONS MARKET, BY PRODUCTS, 2018-2032 (USD THOUSAND)
TABLE 341 MIDDLE EAST AND AFRICA TRACK AND TRACE SOLUTIONS MARKET, BY SOLUTION, 2018-2032 (USD THOUSAND)
TABLE 342 MIDDLE EAST AND AFRICA TRACK AND TRACE SOLUTIONS MARKET, BY APPLICATION, 2018-2032 (USD THOUSAND)
TABLE 343 MIDDLE EAST AND AFRICA SERIALIZATION IN TRACK AND TRACE SOLUTIONS MARKET, BY APPLICATION, 2018-2032 (USD THOUSAND)
TABLE 344 MIDDLE EAST AND AFRICA AGGREGATION IN TRACK AND TRACE SOLUTIONS MARKET, BY APPLICATION, 2018-2032 (USD THOUSAND)
TABLE 345 MIDDLE EAST AND AFRICA TRACK AND TRACE SOLUTIONS MARKET, BY TECHNOLOGY, 2018-2032 (USD THOUSAND)
TABLE 346 MIDDLE EAST AND AFRICA TRACK AND TRACE SOLUTIONS MARKET, BY END USER, 2018-2032 (USD THOUSAND)
TABLE 347 MIDDLE EAST AND AFRICA TRACK AND TRACE SOLUTIONS MARKET, BY DISTRIBUTION CHANNEL, 2018-2032 (USD THOUSAND)
TABLE 348 SOUTH AFRICA TRACK AND TRACE SOLUTIONS MARKET, BY PRODUCTS, 2018-2032 (USD THOUSAND)
TABLE 349 SOUTH AFRICA SOFTWARE COMPONENTS IN TRACK AND TRACE SOLUTIONS MARKET, BY PRODUCTS, 2018-2032 (USD THOUSAND)
TABLE 350 SOUTH AFRICA HARDWARE COMPONENTS IN TRACK AND TRACE SOLUTIONS MARKET, BY PRODUCTS, 2018-2032 (USD THOUSAND)
TABLE 351 SOUTH AFRICA TRACK AND TRACE SOLUTIONS MARKET, BY SOLUTION, 2018-2032 (USD THOUSAND)
TABLE 352 SOUTH AFRICA TRACK AND TRACE SOLUTIONS MARKET, BY APPLICATION, 2018-2032 (USD THOUSAND)
TABLE 353 SOUTH AFRICA SERIALIZATION IN TRACK AND TRACE SOLUTIONS MARKET, BY APPLICATION, 2018-2032 (USD THOUSAND)
TABELA 354 AGREGAÇÃO DA ÁFRICA DO SUL NO MERCADO DE SOLUÇÕES DE RASTREAMENTO E RASTREAMENTO, POR APLICAÇÃO, 2018-2032 (MIL USD)
TABELA 355 MERCADO DE SOLUÇÕES DE RASTREAMENTO E RASTREAMENTO DA ÁFRICA DO SUL, POR TECNOLOGIA, 2018-2032 (MIL USD)
TABELA 356 MERCADO DE SOLUÇÕES DE RASTREAMENTO E RASTREAMENTO DA ÁFRICA DO SUL, POR USUÁRIO FINAL, 2018-2032 (MIL USD)
TABELA 357 MERCADO DE SOLUÇÕES DE RASTREAMENTO E RASTREAMENTO DA ÁFRICA DO SUL, POR CANAL DE DISTRIBUIÇÃO, 2018-2032 (MIL USD)
TABELA 358 MERCADO DE SOLUÇÕES DE RASTREAMENTO E RASTREAMENTO DA ARÁBIA SAUDITA, POR PRODUTOS, 2018-2032 (MIL USD)
TABELA 359 COMPONENTES DE SOFTWARE DA ARÁBIA SAUDITA NO MERCADO DE SOLUÇÕES DE RASTREAMENTO E RASTREAMENTO, POR PRODUTOS, 2018-2032 (MIL USD)
TABELA 360 COMPONENTES DE HARDWARE DA ARÁBIA SAUDITA NO MERCADO DE SOLUÇÕES DE RASTREAMENTO E RASTREAMENTO, POR PRODUTOS, 2018-2032 (MIL USD)
TABELA 361 MERCADO DE SOLUÇÕES DE RASTREAMENTO E RASTREAMENTO DA ARÁBIA SAUDITA, POR SOLUÇÃO, 2018-2032 (MIL USD)
TABELA 362 MERCADO DE SOLUÇÕES DE RASTREAMENTO E RASTREAMENTO DA ARÁBIA SAUDITA, POR APLICAÇÃO, 2018-2032 (MIL USD)
TABELA 363 SERIALIZAÇÃO DA ARÁBIA SAUDITA NO MERCADO DE SOLUÇÕES DE RASTREAMENTO E RASTREAMENTO, POR APLICAÇÃO, 2018-2032 (MIL USD)
TABELA 364 AGREGAÇÃO DA ARÁBIA SAUDITA NO MERCADO DE SOLUÇÕES DE RASTREAMENTO E RASTREAMENTO, POR APLICAÇÃO, 2018-2032 (MIL USD)
TABELA 365 MERCADO DE SOLUÇÕES DE RASTREAMENTO E RASTREAMENTO DA ARÁBIA SAUDITA, POR TECNOLOGIA, 2018-2032 (MIL USD)
TABELA 366 MERCADO DE SOLUÇÕES DE RASTREAMENTO E RASTREAMENTO DA ARÁBIA SAUDITA, POR USUÁRIO FINAL, 2018-2032 (MIL USD)
TABELA 367 MERCADO DE SOLUÇÕES DE RASTREAMENTO E RASTREAMENTO DA ARÁBIA SAUDITA, POR CANAL DE DISTRIBUIÇÃO, 2018-2032 (MIL USD)
TABELA 368 MERCADO DE SOLUÇÕES DE RASTREAMENTO E RASTREAMENTO DOS EAU, POR PRODUTOS, 2018-2032 (MIL USD)
TABELA 369 COMPONENTES DE SOFTWARE DOS EAU NO MERCADO DE SOLUÇÕES DE RASTREAMENTO E RASTREAMENTO, POR PRODUTOS, 2018-2032 (MIL USD)
TABELA 370 COMPONENTES DE HARDWARE DOS EAU NO MERCADO DE SOLUÇÕES DE RASTREAMENTO E RASTREAMENTO, POR PRODUTOS, 2018-2032 (MIL USD)
TABELA 371 MERCADO DE SOLUÇÕES DE RASTREAMENTO E RASTREAMENTO NOS EAU, POR SOLUÇÃO, 2018-2032 (MIL USD)
TABELA 372 MERCADO DE SOLUÇÕES DE RASTREAMENTO E RASTREAMENTO NOS EAU, POR APLICAÇÃO, 2018-2032 (MIL USD)
TABELA 373 SERIALIZAÇÃO NOS EAU NO MERCADO DE SOLUÇÕES DE RASTREAMENTO E RASTREAMENTO, POR APLICAÇÃO, 2018-2032 (MIL USD)
TABELA 374 AGREGAÇÃO DOS EAU NO MERCADO DE SOLUÇÕES DE RASTREAMENTO E RASTREAMENTO, POR APLICAÇÃO, 2018-2032 (MIL USD)
TABELA 375 MERCADO DE SOLUÇÕES DE RASTREAMENTO E RASTREAMENTO NOS EAU, POR TECNOLOGIA, 2018-2032 (MIL USD)
TABELA 376 MERCADO DE SOLUÇÕES DE RASTREAMENTO E RASTREAMENTO NOS EAU, POR USUÁRIO FINAL, 2018-2032 (MIL USD)
TABELA 377 MERCADO DE SOLUÇÕES DE RASTREAMENTO E RASTREAMENTO NOS EAU, POR CANAL DE DISTRIBUIÇÃO, 2018-2032 (MIL USD)
TABELA 378 MERCADO DE SOLUÇÕES DE RASTREAMENTO E RASTREAMENTO DE ISRAEL, POR PRODUTOS, 2018-2032 (MIL USD)
TABELA 379 COMPONENTES DE SOFTWARE DE ISRAEL NO MERCADO DE SOLUÇÕES DE RASTREAMENTO E RASTREAMENTO, POR PRODUTOS, 2018-2032 (MIL USD)
TABELA 380 COMPONENTES DE HARDWARE DE ISRAEL NO MERCADO DE SOLUÇÕES DE RASTREAMENTO E RASTREAMENTO, POR PRODUTOS, 2018-2032 (MIL USD)
TABELA 381 MERCADO DE SOLUÇÕES DE RASTREAMENTO E RASTREAMENTO DE ISRAEL, POR SOLUÇÃO, 2018-2032 (MIL USD)
TABELA 382 MERCADO DE SOLUÇÕES DE RASTREAMENTO E RASTREAMENTO DE ISRAEL, POR APLICAÇÃO, 2018-2032 (MIL USD)
TABELA 383 SERIALIZAÇÃO DE ISRAEL NO MERCADO DE SOLUÇÕES DE RASTREAMENTO E RASTREAMENTO, POR APLICAÇÃO, 2018-2032 (MIL USD)
TABELA 384 AGREGAÇÃO DE ISRAEL NO MERCADO DE SOLUÇÕES DE RASTREAMENTO E RASTREAMENTO, POR APLICAÇÃO, 2018-2032 (MIL USD)
TABELA 385 MERCADO DE SOLUÇÕES DE RASTREAMENTO E RASTREAMENTO DE ISRAEL, POR TECNOLOGIA, 2018-2032 (MIL USD)
TABELA 386 MERCADO DE SOLUÇÕES DE RASTREAMENTO E RASTREAMENTO DE ISRAEL, POR USUÁRIO FINAL, 2018-2032 (MIL USD)
TABELA 387 MERCADO DE SOLUÇÕES DE RASTREAMENTO E RASTREAMENTO DE ISRAEL, POR CANAL DE DISTRIBUIÇÃO, 2018-2032 (MIL USD)
TABELA 388 MERCADO DE SOLUÇÕES DE RASTREAMENTO E RASTREAMENTO DO EGITO, POR PRODUTOS, 2018-2032 (MIL USD)
TABELA 389 COMPONENTES DE SOFTWARE DO EGITO NO MERCADO DE SOLUÇÕES DE RASTREAMENTO E RASTREAMENTO, POR PRODUTOS, 2018-2032 (MIL USD)
TABELA 390 COMPONENTES DE HARDWARE DO EGITO NO MERCADO DE SOLUÇÕES DE RASTREAMENTO E RASTREAMENTO, POR PRODUTOS, 2018-2032 (MIL USD)
TABELA 391 MERCADO DE SOLUÇÕES DE RASTREAMENTO E RASTREAMENTO DO EGITO, POR SOLUÇÃO, 2018-2032 (MIL USD)
TABELA 392 MERCADO DE SOLUÇÕES DE RASTREAMENTO E RASTREAMENTO DO EGITO, POR APLICAÇÃO, 2018-2032 (MIL USD)
TABELA 393 SERIALIZAÇÃO DO EGITO NO MERCADO DE SOLUÇÕES DE RASTREAMENTO E RASTREAMENTO, POR APLICAÇÃO, 2018-2032 (MIL USD)
TABELA 394 AGREGAÇÃO DO EGITO NO MERCADO DE SOLUÇÕES DE RASTREAMENTO E RASTREAMENTO, POR APLICAÇÃO, 2018-2032 (MIL USD)
TABELA 395 MERCADO DE SOLUÇÕES DE RASTREAMENTO E RASTREAMENTO DO EGITO, POR TECNOLOGIA, 2018-2032 (MIL USD)
TABELA 396 MERCADO DE SOLUÇÕES DE RASTREAMENTO E RASTREAMENTO DO EGITO, POR USUÁRIO FINAL, 2018-2032 (MIL USD)
TABELA 397 MERCADO DE SOLUÇÕES DE RASTREAMENTO E RASTREAMENTO DO EGITO, POR CANAL DE DISTRIBUIÇÃO, 2018-2032 (MIL USD)
TABELA 398 RESTANTE DO MERCADO DE SOLUÇÕES DE RASTREAMENTO E RASTREAMENTO DO ORIENTE MÉDIO E ÁFRICA, POR PRODUTOS, 2018-2032 (MIL USD)
Lista de Figura
FIGURA 1 MERCADO GLOBAL DE SOLUÇÕES DE RASTREAMENTO E RASTREAMENTO: SEGMENTAÇÃO
FIGURA 2 MERCADO GLOBAL DE SOLUÇÕES DE RASTREAMENTO E RASTREAMENTO: TRIANGULAÇÃO DE DADOS
FIGURA 3 MERCADO GLOBAL DE SOLUÇÕES DE RASTREAMENTO E RASTREAMENTO: ANÁLISE DROC
FIGURA 4 MERCADO GLOBAL DE SOLUÇÕES DE RASTREAMENTO E RASTREAMENTO: ANÁLISE DE MERCADO GLOBAL VS. REGIONAL
FIGURA 5 MERCADO GLOBAL DE SOLUÇÕES DE RASTREAMENTO E RASTREAMENTO: ANÁLISE DE PESQUISA DA EMPRESA
FIGURA 6 MERCADO GLOBAL DE SOLUÇÕES DE RASTREAMENTO E RASTREAMENTO: DEMOGRAFIA DA ENTREVISTA
FIGURA 7 MERCADO GLOBAL DE SOLUÇÕES DE RASTREAMENTO E RASTREAMENTO: GRADE DE COBERTURA DE APLICAÇÕES DE MERCADO
FIGURA 8 MERCADO GLOBAL DE SOLUÇÕES DE RASTREAMENTO E RASTREAMENTO: GRADE DE POSIÇÃO DE MERCADO DBMR
FIGURA 9 MERCADO GLOBAL DE SOLUÇÕES DE RASTREAMENTO E RASTREAMENTO: ANÁLISE DA PARTICIPAÇÃO DE FORNECEDORES
FIGURA 10 MERCADO GLOBAL DE SOLUÇÕES DE RASTREAMENTO E RASTREAMENTO: SEGMENTAÇÃO
FIGURA 11 A AMÉRICA DO NORTE DEVE DOMINA O MERCADO GLOBAL DE SOLUÇÕES DE RASTREAMENTO E RASTREAMENTO, E A ÁSIA-PACÍFICO DEVE CRESCER COM O MAIOR CAGR NO PERÍODO DE PREVISÃO DE 2025 A 2032
FIGURA 12 REGULAMENTOS E PADRÕES RIGOROSOS PARA A IMPLEMENTAÇÃO DA SERIALIZAÇÃO DEVEM IMPULSIONAR O MERCADO GLOBAL DE SOLUÇÕES DE RASTREAMENTO E RASTREAMENTO NO PERÍODO PREVISTO DE 2025 A 2032
FIGURA 13 O SEGMENTO DE COMPONENTES DE SOFTWARE DEVE SER REPRESENTANTE DA MAIOR PARCIALIDADE DO MERCADO GLOBAL DE SOLUÇÕES DE RASTREAMENTO E RASTREAMENTO EM 2025 E 2032
FIGURA 14 A ÁSIA-PACÍFICO É A REGIÃO COM CRESCIMENTO MAIS RÁPIDO PARA O MERCADO DE SOLUÇÕES DE RASTREAMENTO E RASTREAMENTO NO PERÍODO PREVISTO DE 2025 A 2032
FIGURA 15 ANÁLISE DROC
FIGURA 16 MERCADO GLOBAL DE SOLUÇÕES DE RASTREAMENTO E RASTREAMENTO: POR PRODUTOS, 2024
FIGURA 17 MERCADO GLOBAL DE SOLUÇÕES DE RASTREAMENTO E RASTREAMENTO: POR PRODUTOS, 2025-2032 (MIL USD)
FIGURA 18 MERCADO GLOBAL DE SOLUÇÕES DE RASTREAMENTO E RASTREAMENTO: POR PRODUTOS, CAGR (2025-2032)
FIGURA 19 MERCADO GLOBAL DE SOLUÇÕES DE RASTREAMENTO E RASTREAMENTO: POR PRODUTOS, CURVA DE LINHA DE SALVAÇÃO
FIGURA 20 MERCADO GLOBAL DE SOLUÇÕES DE RASTREAMENTO E RASTREAMENTO: POR SOLUÇÃO, 2024
FIGURA 21 MERCADO GLOBAL DE SOLUÇÕES DE RASTREAMENTO E RASTREAMENTO: POR SOLUÇÃO, 2025-2032 (MIL USD)
FIGURA 22 MERCADO GLOBAL DE SOLUÇÕES DE RASTREAMENTO E RASTREAMENTO: POR SOLUÇÃO, CAGR (2025-2032)
FIGURA 23 MERCADO GLOBAL DE SOLUÇÕES DE RASTREAMENTO E RASTREAMENTO: POR SOLUÇÃO, CURVA DA LINHA DE SALVAÇÃO
FIGURA 24 MERCADO GLOBAL DE SOLUÇÕES DE RASTREAMENTO E RASTREAMENTO: POR TECNOLOGIA, 2024
FIGURA 25 MERCADO GLOBAL DE SOLUÇÕES DE RASTREAMENTO E RASTREAMENTO: POR TECNOLOGIA, 2025-2032 (MIL USD)
FIGURA 26 MERCADO GLOBAL DE SOLUÇÕES DE RASTREAMENTO E RASTREAMENTO: POR TECNOLOGIA, CAGR (2025-2032)
FIGURA 27 MERCADO GLOBAL DE SOLUÇÕES DE RASTREAMENTO E RASTREAMENTO: POR TECNOLOGIA, CURVA DE LINHA DE SALVAÇÃO
FIGURA 28 MERCADO GLOBAL DE SOLUÇÕES DE RASTREAMENTO E RASTREAMENTO: POR APLICAÇÃO, 2024
FIGURA 29 MERCADO GLOBAL DE SOLUÇÕES DE RASTREAMENTO E RASTREAMENTO: POR APLICAÇÃO, 2025-2032 (MIL USD)
FIGURA 30 MERCADO GLOBAL DE SOLUÇÕES DE RASTREAMENTO E RASTREAMENTO: POR APLICAÇÃO, CAGR (2025-2032)
FIGURA 31 MERCADO GLOBAL DE SOLUÇÕES DE RASTREAMENTO E RASTREAMENTO: POR APLICAÇÃO, CURVA DA LINHA DE SALVAÇÃO
FIGURA 32 MERCADO GLOBAL DE SOLUÇÕES DE RASTREAMENTO E RASTREAMENTO: POR USUÁRIO FINAL, 2024
FIGURA 33 MERCADO GLOBAL DE SOLUÇÕES DE RASTREAMENTO E RASTREAMENTO: POR USUÁRIO FINAL, 2025-2032 (MIL USD)
FIGURA 34 MERCADO GLOBAL DE SOLUÇÕES DE RASTREAMENTO E RASTREAMENTO: POR USUÁRIO FINAL, CAGR (2025-2032)
FIGURA 35 MERCADO GLOBAL DE SOLUÇÕES DE RASTREAMENTO E RASTREAMENTO: POR USUÁRIO FINAL, CURVA DE LINHA DE SALVAÇÃO
FIGURA 36 MERCADO GLOBAL DE SOLUÇÕES DE RASTREAMENTO E RASTREAMENTO: POR CANAL DE DISTRIBUIÇÃO, 2024
FIGURA 37 MERCADO GLOBAL DE SOLUÇÕES DE RASTREAMENTO E RASTREAMENTO: POR CANAL DE DISTRIBUIÇÃO, 2025-2032 (MIL USD)
FIGURA 38 MERCADO GLOBAL DE SOLUÇÕES DE RASTREAMENTO E RASTREAMENTO: POR CANAL DE DISTRIBUIÇÃO, CAGR (2025-2032)
FIGURA 39 MERCADO GLOBAL DE SOLUÇÕES DE RASTREAMENTO E RASTREAMENTO: POR CANAL DE DISTRIBUIÇÃO, CURVA DA LINHA DE SALVAÇÃO
FIGURA 40 RESUMO DO MERCADO DE SOLUÇÕES GLOBAIS DE RASTREAMENTO E RASTREAMENTO
FIGURA 41 MERCADO GLOBAL DE SOLUÇÕES DE RASTREAMENTO E RASTREAMENTO: PARTICIPAÇÃO DA EMPRESA EM 2024 (%)
FIGURA 42 MERCADO DE SOLUÇÕES DE RASTREAMENTO E RASTREAMENTO DA AMÉRICA DO NORTE: PARTICIPAÇÃO DA EMPRESA EM 2024 (%)
FIGURA 43 MERCADO EUROPEU DE SOLUÇÕES DE RASTREAMENTO E RASTREAMENTO: PARTICIPAÇÃO DA EMPRESA EM 2024 (%)
FIGURA 44 MERCADO DE SOLUÇÕES DE RASTREAMENTO E RASTREAMENTO DA ÁSIA-PACÍFICO: PARTICIPAÇÃO DA EMPRESA EM 2024 (%)
Metodologia de Investigação
A recolha de dados e a análise do ano base são feitas através de módulos de recolha de dados com amostras grandes. A etapa inclui a obtenção de informações de mercado ou dados relacionados através de diversas fontes e estratégias. Inclui examinar e planear antecipadamente todos os dados adquiridos no passado. Da mesma forma, envolve o exame de inconsistências de informação observadas em diferentes fontes de informação. Os dados de mercado são analisados e estimados utilizando modelos estatísticos e coerentes de mercado. Além disso, a análise da quota de mercado e a análise das principais tendências são os principais fatores de sucesso no relatório de mercado. Para saber mais, solicite uma chamada de analista ou abra a sua consulta.
A principal metodologia de investigação utilizada pela equipa de investigação do DBMR é a triangulação de dados que envolve a mineração de dados, a análise do impacto das variáveis de dados no mercado e a validação primária (especialista do setor). Os modelos de dados incluem grelha de posicionamento de fornecedores, análise da linha de tempo do mercado, visão geral e guia de mercado, grelha de posicionamento da empresa, análise de patentes, análise de preços, análise da quota de mercado da empresa, normas de medição, análise global versus regional e de participação dos fornecedores. Para saber mais sobre a metodologia de investigação, faça uma consulta para falar com os nossos especialistas do setor.
Personalização disponível
A Data Bridge Market Research é líder em investigação formativa avançada. Orgulhamo-nos de servir os nossos clientes novos e existentes com dados e análises que correspondem e atendem aos seus objetivos. O relatório pode ser personalizado para incluir análise de tendências de preços de marcas-alvo, compreensão do mercado para países adicionais (solicite a lista de países), dados de resultados de ensaios clínicos, revisão de literatura, mercado remodelado e análise de base de produtos . A análise de mercado dos concorrentes-alvo pode ser analisada desde análises baseadas em tecnologia até estratégias de carteira de mercado. Podemos adicionar quantos concorrentes necessitar de dados no formato e estilo de dados que procura. A nossa equipa de analistas também pode fornecer dados em tabelas dinâmicas de ficheiros Excel em bruto (livro de factos) ou pode ajudá-lo a criar apresentações a partir dos conjuntos de dados disponíveis no relatório.

