Middle East and Africa SiC Power Semiconductor Market, By Type (MOSFETS, Hybrid Modules, Schottky Barrier Diodes (SBDS), IGBT, Bipolar Junction Transistor (BJT), Pin Diode, Junction FET (JFET), and Others), Voltage Range (301-900 V, 901-1700 V, Above 1701 V), Wafer size (6 Inch, 4 Inch, 2 Inch, Above 6 Inch), Wafer type (SiC Epitaxial Wafers, Blank SiC Wafers), Application (Electric Vehicles (EV), Photovoltaics, Power Supplies, Industrial Motor Drives, EV Charging Infrastructure, RF Devices, and Others), Vertical (Automotive, Utilities and Energy, Industrial, Transportation, IT and Telecommunication, Consumer Electronics, Aerospace and Defense, Commercial, and Others) Industry Trends and Forecast to 2030.
Middle East and Africa SiC Power Semiconductor Market Analysis and Size
SiC power semiconductors are the most prevalent semiconductors and are considered the best choice for electronics. These SiC power semiconductors are applied in domestic, commercial, and industrial sectors and various other areas. SiC power semiconductors are available in two types of devices, such as SiC discrete devices and SiC bare die. Due to technological advancements, the prevalence of SiC discrete devices has been increasing faster. The SiC power semiconductor' significant property is high thermal conductive properties along with various others that efficiently use electricity. SiC power semiconductors are used in telecommunication, energy and power, renewable power generation, and several other places. SiC power semiconductors are used in power electronics gaining prevalence among individuals. The demand for SiC power semiconductors in the Middle East and Africa SiC power semiconductor market is increasing at a higher rate. For this, various market players are introducing new products and forming a partnership to expand their business in the Middle East and Africa SiC power semiconductor market.
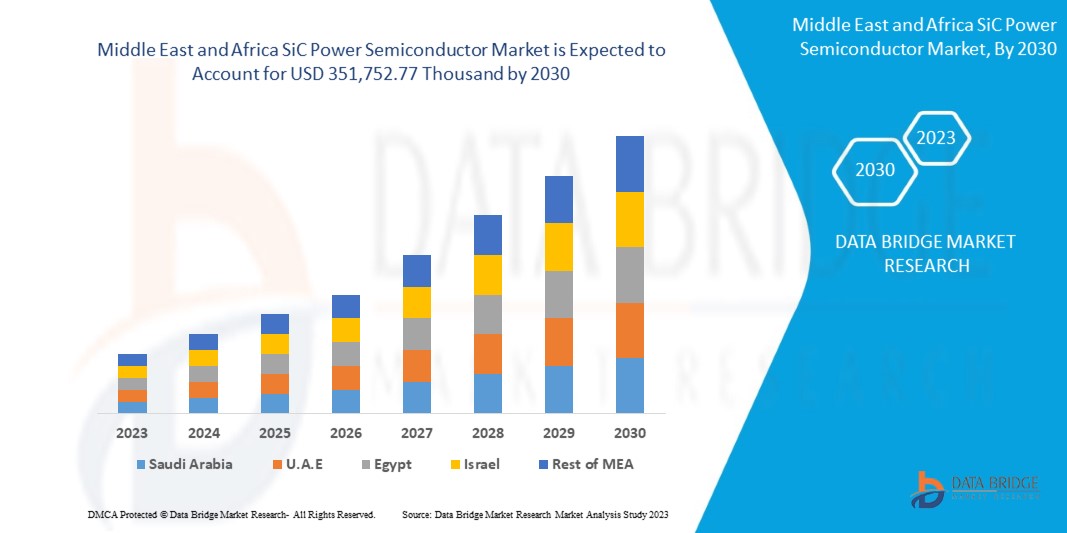
Data Bridge Market Research analyses that the Middle East and Africa SiC power semiconductor market is expected to reach a value of USD 351,752.77 thousand by 2030, at a CAGR of 25.2% during the forecast period. The Middle East and Africa SiC power semiconductor market report also comprehensively covers pricing analysis, patent analysis, and technological advancements.
|
Report Metric |
Details |
|
Forecast Period |
2023 to 2030 |
|
Base Year |
2022 |
|
Historic Years |
2021 (Customizable to 2020-2016) |
|
Quantitative Units |
Revenue in USD Thousand, Volumes in Units, Pricing in USD |
|
Segments Covered |
By Type (MOSFETS, Hybrid Modules, Schottky Barrier Diodes (SBDS), IGBT, Bipolar Junction Transistor (BJT), Pin Diode, Junction FET (JFET), and Others), Voltage Range (301-900 V, 901-1700 V, Above 1701 V), Wafer size (6 Inch, 4 Inch, 2 Inch, Above 6 Inch), Wafer type (SiC Epitaxial Wafers, Blank SiC Wafers), Application (Electric Vehicles (EV), Photovoltaics, Power Supplies, Industrial Motor Drives, EV Charging Infrastructure, RF Devices, and Others), Vertical (Automotive, Utilities and Energy, Industrial, Transportation, IT and Telecommunication, Consumer Electronics, Aerospace and Defense, Commercial, and Others). |
|
Countries Covered |
South Africa, UAE., Israel, Egypt, Qatar, Saudi Arabia, Kuwait, Rest of the Middle East and Africa. |
|
Market Players Covered |
STMicroelectronics, Fuji Electric Co., Ltd., Mitsubishi Electric Corporation, Texas Instruments Incorporated, Infineon Technologies AG, Semikron Danfoss, TOSHIBA ELECTRONIC DEVICES & STORAGE CORPORATION, Microchip Technology Inc., NXP Semiconductors, and UnitedSiC among others |
Market Definition
SiC power semiconductor refers to the type of semiconductor that contains carbon and silicon and operates at very high voltage and temperature. SiC power semiconductors can be used in producing a strong as well as a very hard material. SiC power semiconductors can be implemented in various sectors such as telecommunication, energy and power, automotive, renewable power generation, and in different other areas. They are basically considered due to higher maximum thermal conductive properties that have widened the area of application. SiC power semiconductors are devices that are considered high-frequency power devices that are majorly applicable in wireless communications. SiC semiconductor offers ten times the dielectric breakdown field strength, three times the thermal conductivity, and three times the bandgap as compared to a silicon semiconductor. The SiC semiconductor has taken over the market because of its high performance and efficiency. The SiC power semiconductor offers to work at high voltage and current and offers low on-resistance in addition to being efficient at high temperatures. The combination of silicon carbide has thus proved to be a better and optimum choice of semiconductor.
Middle East and Africa SiC Power Semiconductor Market Dynamics
This section deals with understanding the market drivers, advantages, opportunities, restraints, and challenges. All of this is discussed in detail below:
Drivers
- Advent Of SiC Power Semiconductors
There are very useful properties of SiC as a semiconductor material. In applications such as inverters, motor drives, and battery chargers, silicon carbide (SiC) devices offer many advantages, such as improved power density, reduced cooling requirements, and reduced overall system cost. These advantages are enough to make SiC power semiconductors at the high efficient stage.
The energy lost by SiC during the reverse recovery phase is only 1% of the energy lost by silicon which creates a huge difference in the efficiency of the material. The virtual absence of a tail current allows a faster turn‑off, and it makes lower losses. Since there is less energy to dissipate, a SiC device able to switch at higher frequencies and improve efficiency. The more efficient, small size, and lower weight of SiC as compared to other materials can create a higher-rated solution or a smaller design with reduced cooling requirements. Thus, the advent of SiC power semiconductors is a major factor expected to drive the growth of the Middle East and Africa SiC power semiconductor market.
- Rising Penetration of Electronic Vehicles
The world is changing so fast, and it is turning towards renewable energy. All sectors, market players, and government institutes are making more focus to build electric vehicle infrastructure and generate more demand for electric vehicles.
As per the information from International Energy Agency (IEA), 16.5 million electric cars were on the road in 2021, a tripling in just three years, and this is a big number as compared to 2020. Electric car sales increased and doubled in China, continued to increase in Middle East and Africa, and picked up in the U.S. in 2021. This data shows that there is a tremendous increase in the penetration of EVs in the market, which may positively affect the environment as well as the Middle East and Africa SiC power semiconductor market. SiC is highly efficient at high voltages, enabling fast battery charging times that are comparable to filling the tank of conventional vehicles. Silicon carbide power electronics are enabling a surge in 800-volt drive systems, paving the way for lighter EVs with greater range.
Opportunity
- Strategic Partnership and Acquisition by SiC Manufacturers
There are various organizations and market players which are creating strategic partnerships and acquisitions. This partnership creates a huge positive impact on the growth of the Middle East and Africa SiC power semiconductor market. This collaboration results in cooperation, becoming a low-cost route for new competitors to gain technology and market access.
A joint venture involves two or more businesses pooling their resources and expertise to achieve a particular goal. There are many organizations that collaborate with each other's and create a positive impact on the growth of the Middle East and Africa SiC power semiconductor market.
Restraint/Challenge
- Issues Related With SiC Wafer Manufacturing
A SiC wafer is a semiconductor material that has excellent electrical and thermal properties. It is a high-performance semiconductor that is ideal for a wide variety of applications. In addition to its high thermal resistance, it also features a very high level of hardness. There is a lot of fabrication challenge faced by SiC wafer manufacturers. The main defects that can occur during the manufacturing of SiC substrates are crystalline stacking faults, micro pipes, pits, scratches, stains, and surface particles. These factors are adversely affecting the performance of SiC devices which have been detected more frequently on 150-mm wafers than on 100-mm wafers. This is because SiC is the third-hardest composite material in the world and is also very fragile, and its production poses complex challenges related to cycle time, cost, and dicing performance. It is effective to predict that even switching to 200-mm wafers will entail significant issues. In fact, it will be necessary to guarantee the same quality of the substrate, facing an inevitably higher density of defects.
Post-COVID-19 Impact on Middle East and Africa SiC Power Semiconductor Market
The SiC power semiconductor industry noted a gradual decrease in demand due to the lockdown and COVID-19 governmental laws, as manufacturing facilities and services were closed. Even private and public development was called off. Moreover, the industry was also affected by the halt of the supply chain, especially of raw materials used in the manufacturing process of SiC power semiconductors. Stringent government regulations for different industries and restrictions on trade & transportation were some of the top factors that caused a dent in the growth of the market for SiC power semiconductors around the world in 2020 and in the first two quarters of 2021. As the SiC power semiconductor production slowed down owing to the restrictions by governments across the globe, the production was not meeting the demand in the first three quarters of 2020. Moreover, high demand/requirement for SiC power semiconductor products in the automotive and defense industry, in the medical sector, and in hydraulics applications has been witnessed. The resumption of production of the oil and gas industry and automotive; further fuelled the rising demand for SiC power semiconductors across the globe. Thus, this not only led to a hike in demand but also increased the cost of the product.
Recent Developments
- In December 2022, STMicroelectronics and Soitec (Euronext Paris), in designing and manufacturing innovative semiconductor materials, announced the next stage of their cooperation on Silicon Carbide (SiC) substrates, with the qualification of Soitec's SiC substrate technology by ST planned over the next 18 months. The goal of this cooperation is the adoption by ST of Soitec's SmartSiC technology for its future 200mm substrate manufacturing, feeding its devices and modules manufacturing business, with volume production expected in the midterm. This collaboration will help the company to boost its financials as well as the growth of the Middle East and Africa SiC power semiconductor market.
- In July 2022, Semikron Danfoss and the Kyoto-based company ROHM Semiconductor have been collaborating for more than ten years with regard to the implementation of silicon carbide (SiC) inside power modules. Recently, ROHM's latest 4th generation of SiC MOSFETs has been fully qualified in SEMIKRON's eMPack modules for automotive use. Hence, both companies serve worldwide customers' needs. This collaboration enhanced the company's financials and made a positive impact on the growth of the Middle East and Africa SiC power semiconductor market.
Middle East and Africa SiC Power Semiconductor Market Scope
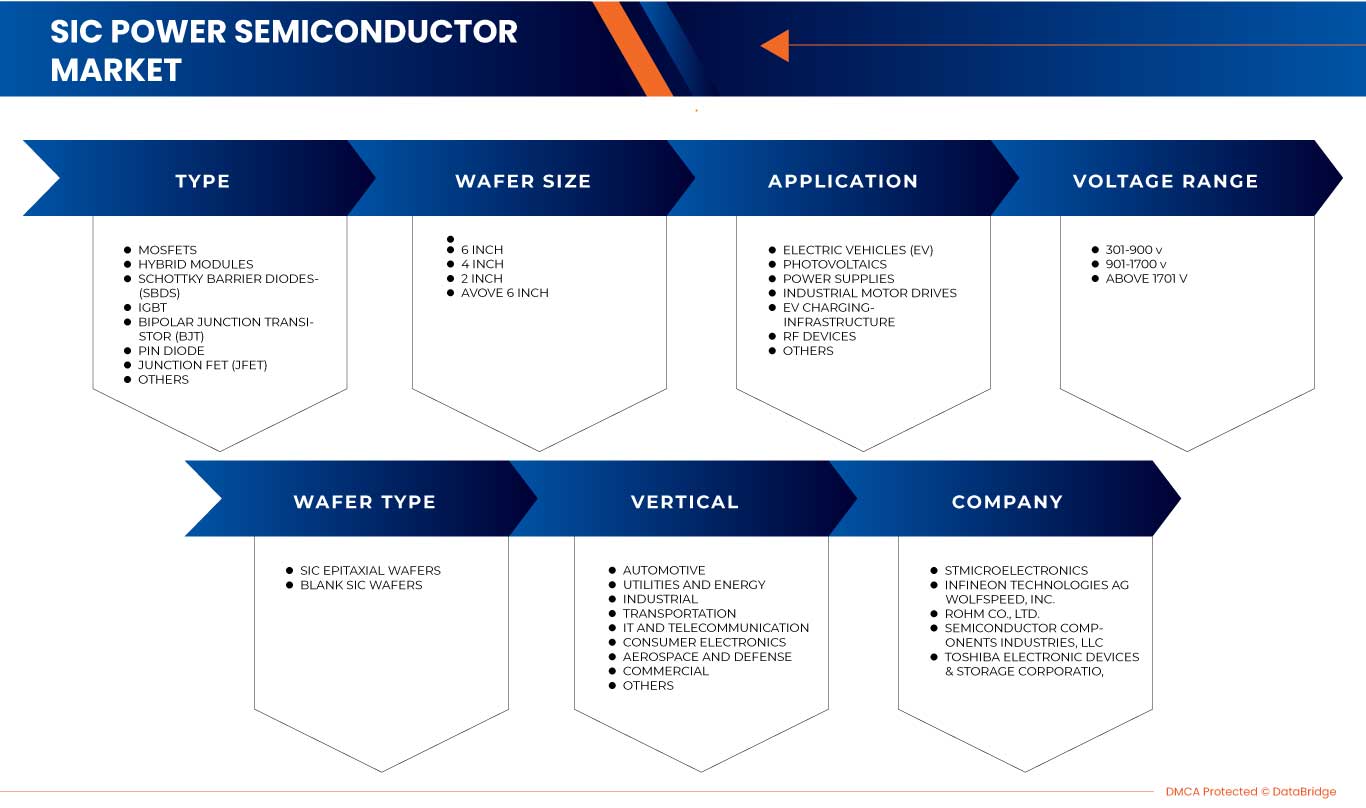
The Middle East and Africa SiC power semiconductor market is segmented on the basis of type, voltage range, wafer size, wafer type, application, and vertical. The growth amongst these segments will help you analyze meager growth segments in the industries and provide the users with a valuable market overview and market insights to help them make strategic decisions for identifying core market applications.
By Type
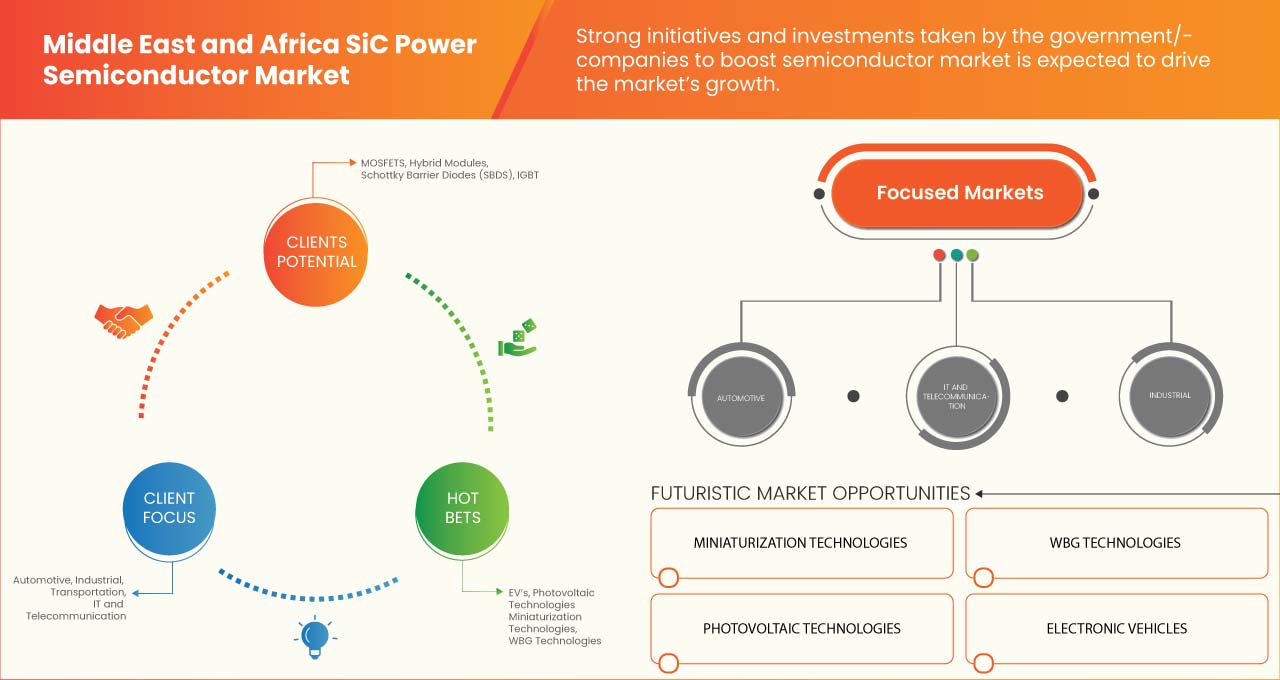
- MOSFETS
- Hybrid Modules
- Schottky Barrier Diodes (SBDS)
- IGBT
- Bipolar Junction Transistor (BJT)
- Pin Diode
- Junction FET (JFET)
- Others
On the basis of type, the Middle East and Africa SiC power semiconductor market is segmented into MOSFETS, Hybrid Modules, Schottky Barrier Diodes (SBDS), IGBT, Bipolar Junction Transistor (BJT), Pin Diode, Junction FET (JFET) and others.
By Voltage Range
- 301-900 V
- 901-1700 V
- Above 1701 V
On the basis of voltage range, the Middle East and Africa SiC power semiconductor market is segmented into 301-900 V, 901-1700 V, and above 1701 V.
By Wafer Size
- 6 Inch
- 4 Inch
- 2 Inch
- Above 6 Inch
On the basis of wafer size, the Middle East and Africa SiC power semiconductor market is segmented into 6 Inch, 4 Inch, 2 Inch, and above 6 Inch.
By Wafer Type
- SiC epitaxial wafers
- Blank SiC wafers
On the basis of the wafer type, the Middle East and Africa SiC power semiconductor market is segmented into SiC epitaxial wafers and blank SiC wafers.
By Application
- Electric Vehicles (EV)
- Photovoltaics
- Power supplies
- Industrial motor drives
- EV charging infrastructure
- RF Devices
- Others
On the basis of the application, the Middle East and Africa sic power semiconductor market is segmented into electric vehicles (EV), photovoltaics, power supplies, industrial motor drives, EV charging infrastructure, RF devices, and others.
By Vertical
- Automotive
- Utilities and energy
- Industrial
- Transportation
- IT and telecommunication
- Consumer electronics
- Aerospace and defense
- Commercial
- Others
On the basis of the vertical, the Middle East and Africa SiC power semiconductor market is segmented into automotive, utilities and energy, industrial, transportation, IT and telecommunication, consumer electronics, aerospace and defense, commercial, and others.
Middle East and Africa SiC Power Semiconductor Market Regional Analysis/Insights
The Middle East and Africa SiC power semiconductor market is analyzed, and market size insights and trends are provided by region, type, voltage range, wafer size, wafer type, application, and vertical as referenced above.
The countries covered in the Middle East and Africa SiC power semiconductor market report are South Africa, UAE., Israel, Egypt, Qatar, Saudi Arabia, Kuwait, Rest of the Middle East and Africa.
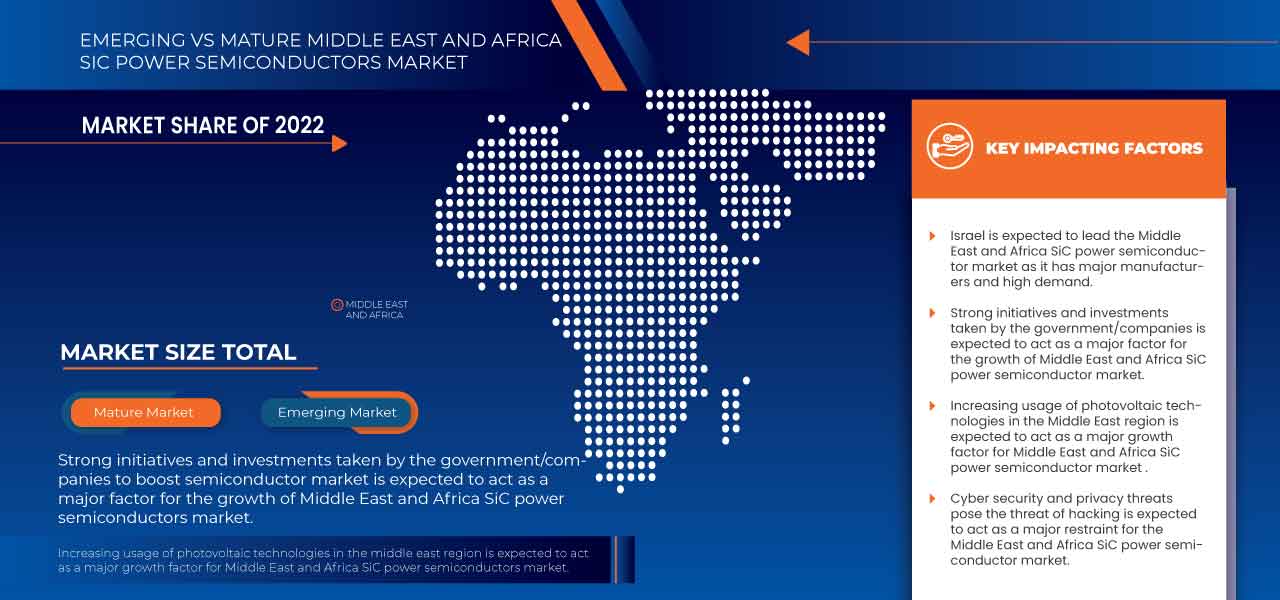
In 2023, Israel is expected to dominate the Middle East and Africa region due to the high demand for defense related to SiC power semiconductor products. Additionally, the high demand for power modules and related devices is expected to act as a driving factor for the market's growth.
The region section of the report also provides individual market-impacting factors and changes in market regulation that impact the current and future trends of the market. Data points like downstream and upstream value chain analysis, technical trends, and porter's five forces analysis, case studies are some of the pointers used to forecast the market scenario for individual countries. Also, the presence and availability of Middle East and Africa brands and their challenges faced due to large or scarce competition from local and domestic brands, the impact of domestic tariffs, and trade routes are considered while providing forecast analysis of the region data.
Competitive Landscape and Middle East and Africa SiC Power Semiconductor Market Share Analysis
Middle East and Africa SiC power semiconductor market competitive landscape provide details by the competitor. Details included are company overview, company financials, revenue generated, market potential, investment in research and development, new market initiatives, Middle East and Africa presence, production sites and facilities, production capacities, company strengths and weaknesses, product launch, product width and breadth, and application dominance. The above data points provided are only related to the companies' focus related to the Middle East and Africa SiC power semiconductor market.
Some of the major players operating in the Middle East and Africa SiC power semiconductor market are STMicroelectronics, Fuji Electric Co., Ltd., Mitsubishi Electric Corporation, Texas Instruments Incorporated, Infineon Technologies AG, Semikron Danfoss, TOSHIBA ELECTRONIC DEVICES & STORAGE CORPORATION, Microchip Technology Inc., NXP Semiconductors, and UnitedSiC among others.
SKU-
Obtenha acesso online ao relatório sobre a primeira nuvem de inteligência de mercado do mundo

- Painel interativo de análise de dados
- Painel de análise da empresa para oportunidades de elevado potencial de crescimento
- Acesso de analista de pesquisa para personalização e customização. consultas
- Análise da concorrência com painel interativo
- Últimas notícias, atualizações e atualizações Análise de tendências
- Aproveite o poder da análise de benchmark para um rastreio abrangente da concorrência
Metodologia de Investigação
A recolha de dados e a análise do ano base são feitas através de módulos de recolha de dados com amostras grandes. A etapa inclui a obtenção de informações de mercado ou dados relacionados através de diversas fontes e estratégias. Inclui examinar e planear antecipadamente todos os dados adquiridos no passado. Da mesma forma, envolve o exame de inconsistências de informação observadas em diferentes fontes de informação. Os dados de mercado são analisados e estimados utilizando modelos estatísticos e coerentes de mercado. Além disso, a análise da quota de mercado e a análise das principais tendências são os principais fatores de sucesso no relatório de mercado. Para saber mais, solicite uma chamada de analista ou abra a sua consulta.
A principal metodologia de investigação utilizada pela equipa de investigação do DBMR é a triangulação de dados que envolve a mineração de dados, a análise do impacto das variáveis de dados no mercado e a validação primária (especialista do setor). Os modelos de dados incluem grelha de posicionamento de fornecedores, análise da linha de tempo do mercado, visão geral e guia de mercado, grelha de posicionamento da empresa, análise de patentes, análise de preços, análise da quota de mercado da empresa, normas de medição, análise global versus regional e de participação dos fornecedores. Para saber mais sobre a metodologia de investigação, faça uma consulta para falar com os nossos especialistas do setor.
Personalização disponível
A Data Bridge Market Research é líder em investigação formativa avançada. Orgulhamo-nos de servir os nossos clientes novos e existentes com dados e análises que correspondem e atendem aos seus objetivos. O relatório pode ser personalizado para incluir análise de tendências de preços de marcas-alvo, compreensão do mercado para países adicionais (solicite a lista de países), dados de resultados de ensaios clínicos, revisão de literatura, mercado remodelado e análise de base de produtos . A análise de mercado dos concorrentes-alvo pode ser analisada desde análises baseadas em tecnologia até estratégias de carteira de mercado. Podemos adicionar quantos concorrentes necessitar de dados no formato e estilo de dados que procura. A nossa equipa de analistas também pode fornecer dados em tabelas dinâmicas de ficheiros Excel em bruto (livro de factos) ou pode ajudá-lo a criar apresentações a partir dos conjuntos de dados disponíveis no relatório.

