Middle East and Africa System Integrator Market for Retail and Consumer Goods, By Service Type (Consulting Services, Application System Integration and Infrastructure Integration), Technology (Supervisory Control and Data Acquisition (SCADA), Distributed Control System (DCS), Human Machine Interface (HMI), Product Lifecycle Management (PLM), Safety Automation System, Programmable Controller Logic (PLC), Manufacturing Execution System (MES), Advanced Process Control (APC) and Operator Training Simulators (OTS)), Product Type (Barcode and RFID, Point of Sales, Camera, Electronic Shelf Labels, Others), End User (Retail and Consumer Goods) – Industry Trends and Forecast to 2029
Market Analysis and Size
Retail system integrators are being highly deployed in the recent years as they deliver services including business process outsourcing (BPO) and strategic consulting to IT, among others. This technology allows plants to deploy and upgrade software and hardware solution.
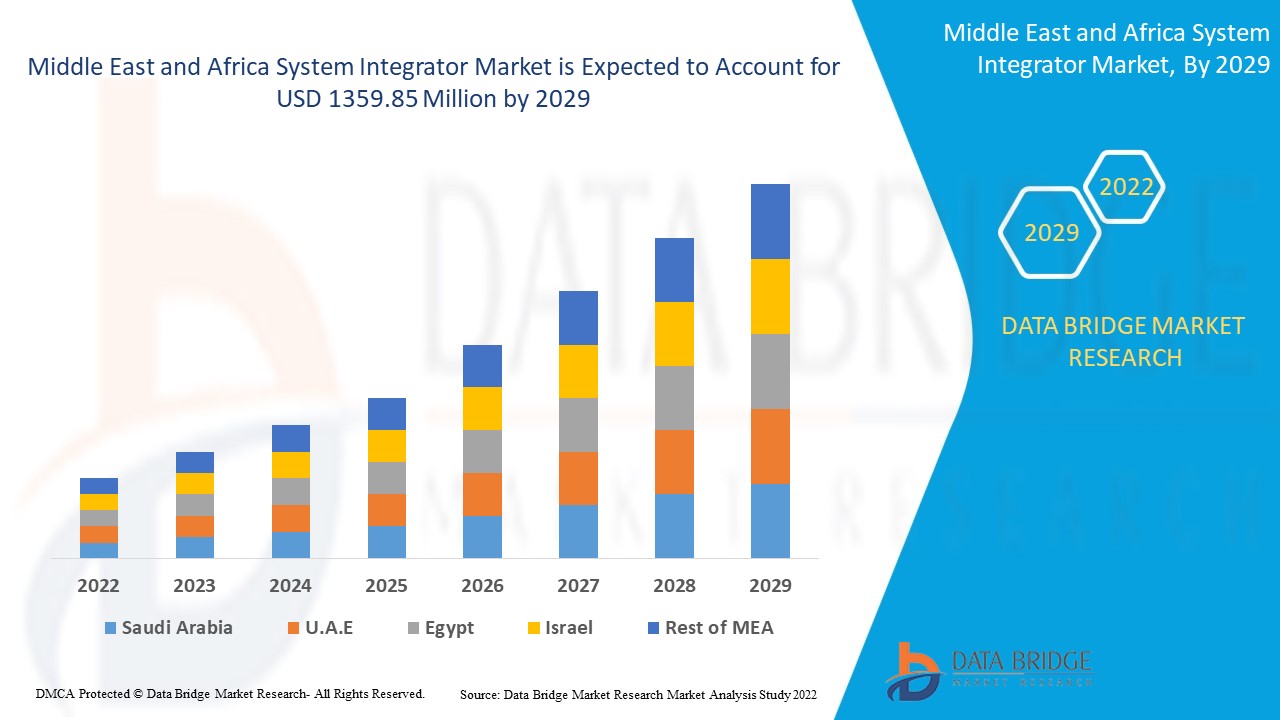
Middle East and Africa System Integrator Market for Retail and Consumer Goods was valued at USD 474.20 million in 2021 and is expected to reach USD 1359.85 million by 2029, registering a CAGR of 11.30% during the forecast period of 2022-2029. Barcode and RFID accounts for the largest product type segments in the respective market owing to the rise in digitalization in the retail sector. . The market report curated by the Data Bridge Market Research team includes in-depth expert analysis, import/export analysis, pricing analysis, production consumption analysis, and pestle analysis.
Market Definition
System integration is a cost efficient method for IT application software and infrastructure exist around the world. It guarantees the improved infrastructure management, it lessens data redundancy, and provides data integrity, causing in enhanced organizational efficiency and effectiveness. Moreover, the organizations situated around the world are impacted by technological developments for example as the hardware and software solutions, flexibility applications, and big data management software.
Report Scope and Market Segmentation
|
Report Metric |
Details |
|
Forecast Period |
2022 to 2029 |
|
Base Year |
2021 |
|
Historic Years |
2020 (Customizable to 2019 - 2014) |
|
Quantitative Units |
Revenue in USD Million, Volumes in Units, Pricing in USD |
|
Segments Covered |
Service Type (Consulting Services, Application System Integration and Infrastructure Integration), Technology (Supervisory Control and Data Acquisition (SCADA), Distributed Control System (DCS), Human Machine Interface (HMI), Product Lifecycle Management (PLM), Safety Automation System, Programmable Controller Logic (PLC), Manufacturing Execution System (MES), Advanced Process Control (APC) and Operator Training Simulators (OTS)), Product Type (Barcode and RFID, Point of Sales, Camera, Electronic Shelf Labels, Others), End User (Retail and Consumer Goods) |
|
Countries Covered |
Saudi Arabia, U.A.E, Israel, Egypt, South Africa, Rest of Middle East and Africa (MEA) as a part of Middle East and Africa (MEA) |
|
Market Players Covered |
Capgemini (France), Accenture (Ireland), IBM Corporation (US), Logic (India), Infosys Limited (India), Magic Software Enterprises (Isreal), HCL Technologies Limited (India), Atos SE (France), SAP SE (Germany), Schneider Electric (France), Wipro Limited (India), Cognizant (US), Tata Consultancy Services Limited (India), among others |
|
Market Opportunities |
|
Middle East and Africa System Integrator Market for Retail and Consumer Goods Dynamics
This section deals with understanding the market drivers, advantages, opportunities, restraints and challenges. All of this is discussed in detail as below:
Drivers
- Inclination for Computerisation Technologies
The rise in inclination for computerisation technologies acts as one of the major factors driving the growth of system integrator market for retail and consumer goods. The increase in need from the corporations to increase the effectiveness of their present systems has a positive impact on the market.
- Advancements in Cloud Technologies
The rise in advancements in cloud technologies along with use of the Internet of Things (IoT) accelerate the market growth. Also, the rise in investment in distributed information technology systems drive the growth of market.
- Advent of Big Data Technology
The increase in the advent of big data technology offering benefits to organizations in implementing big data further influence the market. Organizations require advanced data integration tools for combining the information silos assisting to get valuable business insights.
Opportunities
Furthermore, demand for remote operating owing to COVID-19 and emergence of Industry 4.0 extend profitable opportunities to the market players in the forecast period of 2022 to 2029.
Restraints/Challenges
On the other hand, high investments required for automation implementation and maintenance, and fall in crude oil prices are expected to obstruct market growth. Also, system interoperability and Security vulnerability in SCADA systems are projected to challenge the system integrator market for retail and consumer goods in the forecast period of 2022-2029.
This system integrator market for retail and consumer goods report provides details of new recent developments, trade regulations, import-export analysis, production analysis, value chain optimization, market share, impact of domestic and localized market players, analyses opportunities in terms of emerging revenue pockets, changes in market regulations, strategic market growth analysis, market size, category market growths, application niches and dominance, product approvals, product launches, geographic expansions, technological innovations in the market. To gain more info on system integrator market for retail and consumer goods contact Data Bridge Market Research for an Analyst Brief, our team will help you take an informed market decision to achieve market growth.
COVID-19 Impact on Middle East and Africa System Integrator Market for Retail and Consumer Goods
The COVID-19 had a negative impact on the system integrator market for retail and consumer goods. The COVID-19 epidemic has caused a number of initiatives to be postponed, including infrastructure construction, reorganization, and renovation. Increased government attention on overcompensating for impacts by enhancing operations when opportunities occur would accelerate industry growth. Government actions to reopen major industries, manufacturing facilities, and infrastructure projects, on the other hand, will support corporate growth.
Middle East and Africa System Integrator Market for Retail and Consumer Goods Scope and Market Size
The system integrator market for retail and consumer goods is segmented on the basis of service type, product type, technology and end user. The growth amongst these segments will help you analyze meager growth segments in the industries and provide the users with a valuable market overview and market insights to help them make strategic decisions for identifying core market applications.
Service Type
- Consulting Services
- Application System Integration
- Infrastructure Integration
Technology
- Supervisory Control and Data Acquisition (SCADA)
- Distributed Control System (DCS)
- Human Machine Interface (HMI)
- Product Lifecycle Management (PLM)
- Safety Automation System, Programmable Controller Logic (PLC)
- Manufacturing Execution System (MES)
- Advanced Process Control (APC)
- Operator Training Simulators (OTS)
Product Type
- Barcode and RFID
- Point Of Shelf
- Camera
- Electronic Shelf Labels
- Others
End User
- Retail
- Consumer Goods
Middle East and Africa System Integrator Market for Retail and Consumer Goods Regional Analysis/Insights
The system integrator market for retail and consumer goods is analysed and market size insights and trends are provided by country, service type, product type, technology and end user as referenced above.
The countries covered in the Middle East and Africa system integrator market for retail and consumer goods report are Saudi Arabia, U.A.E, Israel, Egypt, South Africa, Rest of Middle East and Africa (MEA) as a part of Middle East and Africa (MEA).
The U.A.E. is dominating in the Middle East and Africa system integrator market for retail and consumer goods as the central government increase their investment in the e-commerce industry which has increased integration of system for the retail and consumer goods.
The country section of the report also provides individual market impacting factors and changes in regulation in the market domestically that impacts the current and future trends of the market. Data points like down-stream and upstream value chain analysis, technical trends and porter's five forces analysis, case studies are some of the pointers used to forecast the market scenario for individual countries. Also, the presence and availability of global brands and their challenges faced due to large or scarce competition from local and domestic brands, impact of domestic tariffs and trade routes are considered while providing forecast analysis of the country data.
Competitive Landscape and Middle East and Africa System Integrator Market for Retail and Consumer Goods
The system integrator market for retail and consumer goods competitive landscape provides details by competitor. Details included are company overview, company financials, revenue generated, market potential, investment in research and development, new market initiatives, global presence, production sites and facilities, production capacities, company strengths and weaknesses, product launch, product width and breadth, application dominance. The above data points provided are only related to the companies' focus related to system integrator market for retail and consumer goods.
Some of the major players operating in the system integrator market for retail and consumer goods are
- Capgemini (France)
- Accenture (Ireland)
- IBM Corporation (US)
- Logic (India)
- Infosys Limited (India)
- Magic Software Enterprises (Isreal)
- HCL Technologies Limited (India)
- Atos SE (France)
- SAP SE (Germany)
- Schneider Electric (France)
- Wipro Limited (India)
- Cognizant (US)
- Tata Consultancy Services Limited (India)
SKU-
Obtenha acesso online ao relatório sobre a primeira nuvem de inteligência de mercado do mundo

- Painel interativo de análise de dados
- Painel de análise da empresa para oportunidades de elevado potencial de crescimento
- Acesso de analista de pesquisa para personalização e customização. consultas
- Análise da concorrência com painel interativo
- Últimas notícias, atualizações e atualizações Análise de tendências
- Aproveite o poder da análise de benchmark para um rastreio abrangente da concorrência
Índice
1 INTRODUÇÃO
1.1 OBJETIVOS DO ESTUDO
1.2 DEFINIÇÃO DE MERCADO
1.3 VISÃO GERAL DO MERCADO DE INTEGRAÇÃO DE SISTEMAS DO ORIENTE MÉDIO E ÁFRICA PARA BENS DE VAREJO E CONSUMO
1.4 ÂMBITO DO ESTUDO DE MERCADO
1.5 MOEDA E PREÇOS
1.6 LIMITAÇÕES
1.7 MERCADOS COBERTOS
2 SEGMENTAÇÃO DE MERCADO
2.1 MERCADOS COBERTOS
2.2 ÂMBITO GEOGRÁFICO
2,3 ANOS CONSIDERADOS PARA O ESTUDO
2.4 MODELO DE VALIDAÇÃO DE DADOS TRIPÉ DBMR
2.5 ENTREVISTAS PRINCIPAIS COM PRINCIPAIS LÍDERES DE OPINIÃO
2.6 GRADE DE POSIÇÃO DE MERCADO DBMR
2.7 ANÁLISE DA PARTICIPAÇÃO DO FORNECEDOR
2.8 MODELAGEM MULTIVARIADA
2.9 CURVA DO TIPO DE SERVIÇO
2.1 FONTES SECUNDÁRIAS
2.11 PREMISSAS
3 RESUMO EXECUTIVO
4 INSIGHTS PREMIUM
5 VISÃO GERAL DO MERCADO
5.1 MOTORISTAS
5.1.1 USO CRESCENTE DA INTERNET DAS COISAS (IOT)
5.1.2 PREOCUPAÇÃO CRESCENTE COM O PLANEJAMENTO DE RECURSOS EMPRESARIAIS
5.1.3 AUMENTO DA PENETRAÇÃO DE SMARTPHONES E DA INFRAESTRUTURA DE BANDA LARGA
5.1.4 AUMENTO DE DADOS ORGANIZACIONAIS E DE CONSUMIDORES
5.1.5 AUMENTO DA TRANSFORMAÇÃO DIGITAL NO VAREJO E NA INDÚSTRIA DE BENS DE CONSUMO
5.2 RESTRIÇÕES
5.2.1 ALTO CUSTO E TEMPO DE IMPLEMENTAÇÃO
5.2.2 FALTA DE TRABALHADORES TÉCNICOS QUALIFICADOS NOS PAÍSES EM DESENVOLVIMENTO
5.2.3 FALTA DE TAXA DE ADOÇÃO EM NEGÓCIOS DE PEQUENA ESCALA
5.3 OPORTUNIDADES
5.3.1 ALTOS INVESTIMENTOS EM TECNOLOGIA DA INFORMAÇÃO PELOS ATORES DO MERCADO
5.3.2 DIGITALIZAÇÃO E CENTRALIZAÇÃO DOS PROCESSOS DE NEGÓCIO
5.3.3 ADOÇÃO CRESCENTE DA INDÚSTRIA 4.0 NO SETOR DE VAREJO
5.3.4 AUMENTO DOS INVESTIMENTOS DO SETOR DE VAREJO EM SERVIÇOS DE NUVEM
5.4 DESAFIOS
5.4.1 VULNERABILIDADE DE SEGURANÇA EM SISTEMAS
5.4.2 COMPLEXIDADES PARA INTEGRAÇÃO DE SISTEMAS
6 IMPACTO DA COVID-19 NO MERCADO DE INTEGRADORES DE SISTEMAS PARA BENS DE VAREJO E CONSUMO
6.1 CONSEQUÊNCIAS DA COVID-19 E INICIATIVA DO GOVERNO PARA IMPULSIONAR O MERCADO
6.2 DECISÕES ESTRATÉGICAS PARA FABRICANTES APÓS A COVID-19 PARA GANHAR PARTICIPAÇÃO COMPETITIVA NO MERCADO
6.3 IMPACTO NA DEMANDA E NA CADEIA DE SUPRIMENTOS
6.4 CONCLUSÃO
7 MERCADO INTEGRADOR DE SISTEMAS DO ORIENTE MÉDIO E ÁFRICA PARA BENS DE VAREJO E CONSUMO, POR SERVIÇO
7.1 VISÃO GERAL
7.2 INTEGRAÇÃO DE INFRAESTRUTURA
7.2.1 GESTÃO EMPRESARIAL
7.2.2 GERENCIAMENTO DE REDE
7.2.3 GERENCIAMENTO DE DATA CENTER
7.2.4 GERENCIAMENTO BASEADO EM NUVEM
7.2.5 GESTÃO DE EDIFÍCIOS
7.2.6 GESTÃO DE SEGURANÇA E VIGILÂNCIA
7.3 INTEGRAÇÃO DE APLICATIVOS
7.3.1 INTEGRAÇÃO DE SOFTWARE DE APLICAÇÃO
7.3.2 INTEGRAÇÃO DE SISTEMAS E DADOS
7.3.3 COMUNICAÇÃO UNIFICADA
7.3.4 SOFTWARE SOCIAL INTEGRADO
7.3.5 OUTROS
7.4 SERVIÇOS DE CONSULTORIA
7.4.1 INTEGRAÇÃO DE PROCESSOS DE NEGÓCIO
7.4.2 TRANSFORMAÇÃO DE NEGÓCIOS
7.4.3 GERENCIAMENTO DO CICLO DE VIDA DO APLICATIVO
8 MERCADO INTEGRADOR DE SISTEMAS DO ORIENTE MÉDIO E ÁFRICA PARA BENS DE VAREJO E CONSUMO, POR TIPO DE PRODUTO
8.1 VISÃO GERAL
8.2 CÓDIGO DE BARRAS E RFID
8.3 PONTO DE VENDA
8.4 CÂMERA
8.5 ETIQUETAS ELETRÔNICAS PARA PRATELEIRAS
8.6 OUTROS
9 MERCADO INTEGRADOR DE SISTEMAS DO ORIENTE MÉDIO E ÁFRICA PARA BENS DE VAREJO E CONSUMO, POR TECNOLOGIA
9.1 VISÃO GERAL
9.2 GERENCIAMENTO DO CICLO DE VIDA DO PRODUTO (PLM)
9.3 SISTEMA DE EXECUÇÃO DE FABRICAÇÃO (MES)
9.4 SISTEMA DE AUTOMAÇÃO DE SEGURANÇA
9.5 CONTROLE AVANÇADO DE PROCESSOS
9.6 SISTEMA DE CONTROLE DISTRIBUÍDO (DCS)
9.7 CONTROLE DE SUPERVISÃO E AQUISIÇÃO DE DADOS (SCADA)
9.8 INTERFACE HOMEM-MÁQUINA (HMI)
9.9 LÓGICA DO CONTROLADOR PROGRAMÁVEL (CLP)
9.1 SIMULADOR DE TREINAMENTO DE OPERADORES
10 MIDDLE EAST & AFRICA SYSTEM INTEGRATOR MARKET FOR RETAIL AND CONSUMER GOODS, BY END-USER
10.1 OVERVIEW
10.2 RETAIL
10.3 CONSUMER GOODS
11 MIDDLE EAST & AFRICA SYSTEM INTEGRATOR MARKET FOR RETAIL AND CONSUMER GOODS, BY GEOGRAPHY
11.1 MIDDLE EAST AND AFRICA
11.1.1 U.A.E
11.1.2 SAUDI ARABIA
11.1.3 SOUTH AFRICA
11.1.4 EGYPT
11.1.5 ISRAEL
11.1.6 REST OF MIDDLE EAST AND AFRICA
12 MIDDLE EAST & AFRICA SYSTEM INTEGRATOR MARKET FOR RETAIL AND CONSUMER GOODS: COMPANY LANDSCAPE
12.1 COMPANY SHARE ANALYSIS: MIDDLE EAST & AFRICA
13 SWOT ANALYSIS
14 COMPANY PROFILE
14.1 IBM CORPORATION
14.1.1 COMPANY SNAPSHOT
14.1.2 REVENUE ANALYSIS
14.1.3 COMPANY SHARE ANALYSIS
14.1.4 SERVICE PORTFOLIO
14.1.5 RECENT DEVELOPMENTS
14.2 ACCENTURE
14.2.1 COMPANY SNAPSHOT
14.2.2 REVENUE ANALYSIS
14.2.3 COMPANY SHARE ANALYSIS
14.2.4 PRODUCT PORTFOLIO
14.2.5 RECENT DEVELOPMENT
14.3 CAPGEMINI
14.3.1 COMPANY SNAPSHOT
14.3.2 REVENUE ANALYSIS
14.3.3 COMPANY SHARE ANALYSIS
14.3.4 SERVICE PORTFOLIO
14.3.5 RECENT DEVELOPMENTS
14.4 COGNIZANT
14.4.1 COMPANY SNAPSHOT
14.4.2 REVENUE ANALYSIS
14.4.3 COMPANY SHARE ANALYSIS
14.4.4 SERVICE PORTFOLIO
14.4.5 RECENT DEVELOPMENTS
14.5 HCL TECHNOLOGIES LIMITED
14.5.1 COMPANY SNAPSHOT
14.5.2 REVENUE ANALYSIS
14.5.3 COMPANY SHARE ANALYSIS
14.5.4 SERVICE PORTFOLIO
14.5.5 RECENT DEVELOPMENTS
14.6 ATOS SE
14.6.1 COMPANY SNAPSHOT
14.6.2 REVENUE ANALYSIS
14.6.3 SOLUTION PORTFOLIO
14.6.4 RECENT DEVELOPMENTS
14.7 AISG
14.7.1 COMPANY SNAPSHOT
14.7.2 SERVICE PORTFOLIO
14.7.3 RECENT DEVELOPMENTS
14.8 BTM MIDDLE EAST & AFRICA
14.8.1 COMPANY SNAPSHOT
14.8.2 PRODUCT PORTFOLIO
14.8.3 RECENT DEVELOPMENTS
14.9 JITTERBIT
14.9.1 COMPANY SNAPSHOT
14.9.2 SOLUTION PORTFOLIO
14.9.3 RECENT DEVELOPMENTS
14.1 INFOSYS LIMITED
14.10.1 COMPANY SNAPSHOT
14.10.2 REVENUE ANALYSIS
14.10.3 PRODUCT PORTFOLIO
14.10.4 RECENT DEVELOPMENTS
14.11 LOGIC
14.11.1 COMPANY SNAPSHOT
14.11.2 SERVICEPORTFOLIO
14.11.3 RECENT DEVELOPMENTS
14.12 MAGIC SOFTWARE ENTERPRISES
14.12.1 COMPANY SNAPSHOT
14.12.2 REVENUE ANALYSIS
14.12.3 PRODUCT PORTFOLIO
14.12.4 RECENT DEVELOPMENTS
14.13 TATA CONSULTANCY SERVICES LIMITED
14.13.1 COMPANY SNAPSHOT
14.13.2 REVENUE ANALYSIS
14.13.3 SOLUTION PORTFOLIO
14.13.4 RECENT DEVELOPMENT
14.14 SADA, INC.
14.14.1 COMPANY SNAPSHOT
14.14.2 PRODUCT PORTFOLIO
14.14.3 RECENT DEVELOPMENT
14.15 SOPRA STERIA
14.15.1 COMPANY SNAPSHOT
14.15.2 REVENUE ANALYSIS
14.15.3 PRODUCT PORTFOLIO
14.15.4 RECENT DEVELOPMENT
14.16 SAP SE
14.16.1 COMPANY SNAPSHOT
14.16.2 REVENUE ANALYSIS
14.16.3 PRODUCT PORTFOLIO
14.16.4 RECENT DEVELOPMENTS
14.17 SCHNEIDER ELECTRIC
14.17.1 COMPANY SNAPSHOT
14.17.2 REVENUE ANALYSIS
14.17.3 SOLUTION PORTFOLIO
14.17.4 RECENT DEVELOPMENTS
14.18 WIPRO LIMITED
14.18.1 COMPANY SNAPSHOT
14.18.2 REVENUE ANALYSIS
14.18.3 SERVICE PORTFOLIO
14.18.4 RECENT DEVELOPMENTS
14.19 TYCO.
14.19.1 COMPANY SNAPSHOT
14.19.2 PRODUCT PORTFOLIO
14.19.3 RECENT DEVELOPMENTS
15 QUESTIONNAIRE
16 RELATED REPORTS
Lista de Tabela
LISTA DE TABELAS
TABELA 1 MERCADO DE INTEGRAÇÃO DE SISTEMAS DO ORIENTE MÉDIO E ÁFRICA PARA BENS DE VAREJO E CONSUMO, POR SERVIÇO, 2018-2027 (US$ MILHÕES)
TABELA 2 INTEGRAÇÃO DE INFRAESTRUTURA DO ORIENTE MÉDIO E ÁFRICA NO MERCADO DE INTEGRADORES DE SISTEMAS PARA BENS DE VAREJO E CONSUMO, POR REGIÃO, 2018-2027 (US$ MILHÕES)
TABELA 3 INTEGRAÇÃO DE APLICATIVOS NO ORIENTE MÉDIO E ÁFRICA NO MERCADO DE INTEGRADORES DE SISTEMAS PARA BENS DE VAREJO E CONSUMO, POR REGIÃO, 2018-2027 (US$ MILHÕES)
TABELA 4 SERVIÇOS DE CONSULTORIA NO ORIENTE MÉDIO E ÁFRICA NO MERCADO DE INTEGRADORES DE SISTEMAS PARA BENS DE VAREJO E CONSUMO, POR REGIÃO, 2018-2027 (US$ MILHÕES)
TABELA 5 MERCADO DE INTEGRAÇÃO DE SISTEMAS DO ORIENTE MÉDIO E ÁFRICA PARA BENS DE VAREJO E CONSUMO, POR TIPO DE PRODUTO, 2018-2027 (US$ MILHÕES)
TABELA 6 ORIENTE MÉDIO E ÁFRICA CÓDIGO DE BARRAS E RFID NO MERCADO DE INTEGRADORES DE SISTEMAS PARA BENS DE VAREJO E CONSUMO, POR REGIÃO, 2018-2027 (US$ MILHÕES)
TABELA 7 PONTOS DE VENDA NO ORIENTE MÉDIO E ÁFRICA NO MERCADO DE INTEGRADORES DE SISTEMAS PARA BENS DE VAREJO E CONSUMO, POR REGIÃO, 2018-2027 (US$ MILHÕES)
TABELA 8 ORIENTE MÉDIO E ÁFRICA CÂMERA NO MERCADO DE INTEGRADORES DE SISTEMAS PARA BENS DE VAREJO E CONSUMO, POR REGIÃO, 2018-2027 (US$ MILHÕES)
TABELA 9 ETIQUETAS ELETRÔNICAS DE PRATELEIRA NO ORIENTE MÉDIO E ÁFRICA NO MERCADO DE INTEGRADORES DE SISTEMAS PARA BENS DE VAREJO E CONSUMO, POR REGIÃO, 2018-2027 (US$ MILHÕES)
TABELA 10 ORIENTE MÉDIO E ÁFRICA OUTROS NO MERCADO DE INTEGRADORES DE SISTEMAS PARA BENS DE VAREJO E CONSUMO, POR REGIÃO, 2018-2027 (US$ MILHÕES)
TABELA 11 MERCADO DE INTEGRAÇÃO DE SISTEMAS DO ORIENTE MÉDIO E ÁFRICA PARA BENS DE VAREJO E CONSUMO, POR TECNOLOGIA, 2018-2027 (US$ MILHÕES)
TABELA 12 GESTÃO DO CICLO DE VIDA DO PRODUTO (PLC) NO ORIENTE MÉDIO E ÁFRICA NO MERCADO DE INTEGRADORES DE SISTEMAS PARA BENS DE VAREJO E CONSUMO, POR REGIÃO, 2018-2027 (US$ MILHÕES)
TABELA 13 SISTEMA DE EXECUÇÃO DE FABRICAÇÃO (MES) DO ORIENTE MÉDIO E ÁFRICA NO MERCADO DE INTEGRADORES DE SISTEMAS PARA BENS DE VAREJO E CONSUMO, POR REGIÃO, 2018-2027 (US$ MILHÕES)/
TABELA 14 SISTEMA DE AUTOMAÇÃO DE SEGURANÇA DO ORIENTE MÉDIO E ÁFRICA NO MERCADO DE INTEGRADORES DE SISTEMAS PARA BENS DE VAREJO E CONSUMO, POR REGIÃO, 2018-2027 (US$ MILHÕES)
TABELA 15 ORIENTE MÉDIO E ÁFRICA CONTROLE AVANÇADO DE PROCESSOS NO MERCADO DE INTEGRADORES DE SISTEMAS PARA BENS DE VAREJO E CONSUMO, POR REGIÃO, 2018-2027 (US$ MILHÕES)/
TABELA 16 SISTEMA DE CONTROLE DISTRIBUÍDO (DCS) NO ORIENTE MÉDIO E ÁFRICA NO MERCADO DE INTEGRADORES DE SISTEMAS PARA BENS DE VAREJO E CONSUMO, POR REGIÃO, 2018-2027 (US$ MILHÕES)
TABELA 17 CONTROLE DE SUPERVISÃO E AQUISIÇÃO DE DADOS (SCADA) NO ORIENTE MÉDIO E ÁFRICA NO MERCADO DE INTEGRADORES DE SISTEMAS PARA BENS DE VAREJO E CONSUMO, POR REGIÃO, 2018-2027 (US$ MILHÕES)
TABELA 18 INTERFACE HOMEM-MÁQUINA (HMI) DO ORIENTE MÉDIO E ÁFRICA NO MERCADO DE INTEGRADORES DE SISTEMAS PARA BENS DE VAREJO E CONSUMO, POR REGIÃO, 2018-2027 (US$ MILHÕES)
TABELA 19 LÓGICA DE CONTROLADOR PROGRAMÁVEL (CLP) DO ORIENTE MÉDIO E ÁFRICA NO MERCADO DE INTEGRADORES DE SISTEMAS PARA BENS DE VAREJO E CONSUMO, POR REGIÃO, 2018-2027 (US$ MILHÕES)
TABELA 20 SIMULADOR DE TREINAMENTO DE OPERADORES DO ORIENTE MÉDIO E ÁFRICA NO MERCADO DE INTEGRADORES DE SISTEMAS PARA BENS DE VAREJO E CONSUMO, POR REGIÃO, 2018-2027 (US$ MILHÕES)
TABELA 21 MERCADO DE INTEGRADORES DE SISTEMAS DO ORIENTE MÉDIO E ÁFRICA PARA BENS DE VAREJO E CONSUMO, POR TIPO DE DATA CENTER, 2018-2027 (US$ MILHÕES)
TABELA 22 ORIENTE MÉDIO E ÁFRICA VAREJO NO MERCADO DE INTEGRADORES DE SISTEMAS PARA O MERCADO DE VAREJO E BENS DE CONSUMO, POR REGIÃO, 2018-2027 (US$ MILHÕES)
TABELA 23 CENTRO DE DADOS DE BENS DE CONSUMO DO ORIENTE MÉDIO E ÁFRICA NO MERCADO DE INTEGRADORES DE SISTEMAS PARA O MERCADO DE VAREJO E BENS DE CONSUMO, POR REGIÃO, 2018-2027 (US$ MILHÕES)
TABELA 24 MERCADO INTEGRADOR DE SISTEMAS DO ORIENTE MÉDIO E ÁFRICA PARA BENS DE VAREJO E CONSUMO, POR PAÍS, 2018-2027 (US$ MILHÕES)
TABELA 25 MERCADO INTEGRADOR DE SISTEMAS DO ORIENTE MÉDIO E ÁFRICA PARA BENS DE VAREJO E CONSUMO, POR TIPO DE SERVIÇOS, 2018-2027 (US$ MILHÕES)
TABELA 26 INTEGRAÇÃO DE INFRAESTRUTURA DO ORIENTE MÉDIO E ÁFRICA NO MERCADO DE INTEGRADORES DE SISTEMAS PARA BENS DE VAREJO E CONSUMO, POR SOLUÇÕES, 2018-2027 (US$ MILHÕES)
TABELA 27 INTEGRAÇÃO DE APLICATIVOS NO ORIENTE MÉDIO E ÁFRICA NO MERCADO DE INTEGRADORES DE SISTEMAS PARA BENS DE VAREJO E CONSUMO, POR SOLUÇÕES, 2018-2027 (US$ MILHÕES)
TABELA 28 CONSULTORIA NO ORIENTE MÉDIO E ÁFRICA NO MERCADO DE INTEGRADORES DE SISTEMAS PARA BENS DE VAREJO E CONSUMO, POR SOLUÇÕES, 2018-2027 (US$ MILHÕES)
TABELA 29 MERCADO DE INTEGRAÇÃO DE SISTEMAS DO ORIENTE MÉDIO E ÁFRICA PARA BENS DE VAREJO E CONSUMO, POR TECNOLOGIA, 2018-2027 (US$ MILHÕES)
TABELA 30 MERCADO INTEGRADOR DE SISTEMAS DO ORIENTE MÉDIO E ÁFRICA PARA BENS DE VAREJO E CONSUMO, POR TIPO DE PRODUTO, 2018-2027 (US$ MILHÕES)
TABELA 31 MERCADO DE INTEGRAÇÃO DE SISTEMAS DO ORIENTE MÉDIO E ÁFRICA PARA BENS DE VAREJO E CONSUMO, POR USO FINAL, 2018-2027 (US$ MILHÕES)
TABELA 32 MERCADO DE INTEGRADORES DE SISTEMAS DOS EAU PARA BENS DE VAREJO E CONSUMO, POR TIPO DE SERVIÇO, 2018-2027 (US$ MILHÕES)
TABELA 33 INTEGRAÇÃO DE INFRAESTRUTURA DOS EAU NO MERCADO DE INTEGRADORES DE SISTEMAS PARA BENS DE VAREJO E CONSUMO, POR SOLUÇÕES, 2018-2027 (US$ MILHÕES)
TABELA 34 INTEGRAÇÃO DE APLICATIVOS NOS EAU NO MERCADO DE INTEGRADORES DE SISTEMAS PARA BENS DE VAREJO E CONSUMO, POR SOLUÇÕES, 2018-2027 (US$ MILHÕES)
TABELA 35 CONSULTORIA DOS EAU NO MERCADO DE INTEGRADORES DE SISTEMAS PARA BENS DE VAREJO E CONSUMO, POR SOLUÇÕES, 2018-2027 (US$ MILHÕES)
TABELA 36 MERCADO DE INTEGRADORES DE SISTEMAS DOS EAU PARA BENS DE VAREJO E CONSUMO, POR TECNOLOGIA, 2018-2027 (US$ MILHÕES)
TABELA 37 MERCADO DE INTEGRADORES DE SISTEMAS DOS EAU PARA BENS DE VAREJO E CONSUMO, POR TIPO DE PRODUTO, 2018-2027 (US$ MILHÕES)
TABELA 38 MERCADO DE INTEGRADORES DE SISTEMAS DOS EAU PARA BENS DE VAREJO E CONSUMO, POR USO FINAL, 2018-2027 (US$ MILHÕES)
TABELA 39 MERCADO DE INTEGRADORES DE SISTEMAS DA ARÁBIA SAUDITA PARA BENS DE VAREJO E CONSUMO, POR TIPO DE SERVIÇO, 2018-2027 (US$ MILHÕES)
TABELA 40 INTEGRAÇÃO DE INFRAESTRUTURA DA ARÁBIA SAUDITA NO MERCADO DE INTEGRADORES DE SISTEMAS PARA BENS DE VAREJO E CONSUMO, POR SOLUÇÕES, 2018-2027 (US$ MILHÕES)
TABELA 41 INTEGRAÇÃO DE APLICATIVOS DA ARÁBIA SAUDITA NO MERCADO DE INTEGRADORES DE SISTEMAS PARA BENS DE VAREJO E CONSUMO, POR SOLUÇÕES, 2018-2027 (US$ MILHÕES)
TABELA 42 CONSULTORIA DA ARÁBIA SAUDITA NO MERCADO DE INTEGRADORES DE SISTEMAS PARA BENS DE VAREJO E CONSUMO, POR SOLUÇÕES, 2018-2027 (US$ MILHÕES)
TABELA 43 MERCADO DE INTEGRADORES DE SISTEMAS DA ARÁBIA SAUDITA PARA BENS DE VAREJO E CONSUMO, POR TECNOLOGIA, 2018-2027 (US$ MILHÕES)
TABELA 44 MERCADO DE INTEGRADORES DE SISTEMAS DA ARÁBIA SAUDITA PARA BENS DE VAREJO E CONSUMO, POR TIPO DE PRODUTO, 2018-2027 (US$ MILHÕES)
TABELA 45 MERCADO DE INTEGRADORES DE SISTEMAS DA ARÁBIA SAUDITA PARA BENS DE VAREJO E CONSUMO, POR USO FINAL, 2018-2027 (US$ MILHÕES)
TABELA 46 MERCADO DE INTEGRAÇÃO DE SISTEMAS DA ÁFRICA DO SUL PARA BENS DE VAREJO E CONSUMO, POR TIPO DE SERVIÇO, 2018-2027 (US$ MILHÕES)
TABELA 47 INTEGRAÇÃO DE INFRAESTRUTURA DA ÁFRICA DO SUL NO MERCADO DE INTEGRADORES DE SISTEMAS PARA BENS DE VAREJO E CONSUMO, POR SOLUÇÕES, 2018-2027 (US$ MILHÕES)
TABELA 48 INTEGRAÇÃO DE APLICATIVOS DA ÁFRICA DO SUL NO MERCADO DE INTEGRADORES DE SISTEMAS PARA BENS DE VAREJO E CONSUMO, POR SOLUÇÕES, 2018-2027 (US$ MILHÕES)
TABELA 49 CONSULTORIA NA ÁFRICA DO SUL NO MERCADO DE INTEGRADORES DE SISTEMAS PARA BENS DE VAREJO E CONSUMO, POR SOLUÇÕES, 2018-2027 (US$ MILHÕES)
TABELA 50 MERCADO DE INTEGRADORES DE SISTEMAS DA ÁFRICA DO SUL PARA BENS DE VAREJO E CONSUMO, POR TECNOLOGIA, 2018-2027 (US$ MILHÕES)
TABELA 51 MERCADO DE INTEGRADORES DE SISTEMAS DA ÁFRICA DO SUL PARA BENS DE VAREJO E CONSUMO, POR TIPO DE PRODUTO, 2018-2027 (US$ MILHÕES)
TABELA 52 MERCADO DE INTEGRADORES DE SISTEMAS DA ÁFRICA DO SUL PARA BENS DE VAREJO E CONSUMO, POR USO FINAL, 2018-2027 (US$ MILHÕES)
TABELA 53 MERCADO DE INTEGRADORES DE SISTEMAS DO EGITO PARA BENS DE VAREJO E CONSUMO, POR TIPO DE SERVIÇO, 2018-2027 (US$ MILHÕES)
TABELA 54 INTEGRAÇÃO DE INFRAESTRUTURA DO EGITO NO MERCADO DE INTEGRADORES DE SISTEMAS PARA BENS DE VAREJO E CONSUMO, POR SOLUÇÕES, 2018-2027 (US$ MILHÕES)
TABELA 55 INTEGRAÇÃO DE APLICATIVOS DO EGITO NO MERCADO DE INTEGRADORES DE SISTEMAS PARA BENS DE VAREJO E CONSUMO, POR SOLUÇÕES, 2018-2027 (US$ MILHÕES)
TABELA 56 CONSULTORIA DO EGITO NO MERCADO DE INTEGRADORES DE SISTEMAS PARA BENS DE VAREJO E CONSUMO, POR SOLUÇÕES, 2018-2027 (US$ MILHÕES)
TABELA 57 MERCADO DE INTEGRADORES DE SISTEMAS DO EGITO PARA BENS DE VAREJO E CONSUMO, POR TECNOLOGIA, 2018-2027 (US$ MILHÕES)
TABELA 58 MERCADO DE INTEGRADORES DE SISTEMAS DO EGITO PARA BENS DE VAREJO E CONSUMO, POR TIPO DE PRODUTO, 2018-2027 (US$ MILHÕES)
TABELA 59 MERCADO DE INTEGRADORES DE SISTEMAS DO EGITO PARA BENS DE VAREJO E CONSUMO, POR USO FINAL, 2018-2027 (US$ MILHÕES)
TABELA 60 MERCADO DE INTEGRADORES DE SISTEMAS DE ISRAEL PARA BENS DE VAREJO E CONSUMO, POR TIPO DE SERVIÇO, 2018-2027 (US$ MILHÕES)
TABELA 61 INTEGRAÇÃO DA INFRAESTRUTURA DE ISRAEL NO MERCADO DE INTEGRADORES DE SISTEMAS PARA BENS DE VAREJO E CONSUMO, POR SOLUÇÕES, 2018-2027 (US$ MILHÕES)
TABELA 62 INTEGRAÇÃO DE APLICATIVOS DE ISRAEL NO MERCADO DE INTEGRADORES DE SISTEMAS PARA BENS DE VAREJO E CONSUMO, POR SOLUÇÕES, 2018-2027 (US$ MILHÕES)
TABELA 63 CONSULTORIA DE ISRAEL NO MERCADO DE INTEGRADORES DE SISTEMAS PARA BENS DE VAREJO E CONSUMO, POR SOLUÇÕES, 2018-2027 (US$ MILHÕES)
TABELA 64 MERCADO DE INTEGRADORES DE SISTEMAS DE ISRAEL PARA BENS DE VAREJO E CONSUMO, POR TECNOLOGIA, 2018-2027 (US$ MILHÕES)
TABELA 65 MERCADO DE INTEGRADORES DE SISTEMAS DE ISRAEL PARA BENS DE VAREJO E CONSUMO, POR TIPO DE PRODUTO, 2018-2027 (US$ MILHÕES)
TABELA 66 MERCADO DE INTEGRADORES DE SISTEMAS DE ISRAEL PARA BENS DE VAREJO E CONSUMO, POR USO FINAL, 2018-2027 (US$ MILHÕES)
TABELA 67 RESTANTE DO ORIENTE MÉDIO E ÁFRICA MERCADO INTEGRADOR DE SISTEMAS PARA BENS DE VAREJO E CONSUMO, POR TIPO DE SERVIÇOS, 2018-2027 (US$ MILHÕES)
Lista de Figura
LISTA DE FIGURAS
FIGURA 1 MERCADO INTEGRADOR DE SISTEMAS DO ORIENTE MÉDIO E ÁFRICA PARA BENS DE VAREJO E CONSUMO: SEGMENTAÇÃO
FIGURA 2 MERCADO INTEGRADOR DE SISTEMAS DO ORIENTE MÉDIO E ÁFRICA PARA BENS DE VAREJO E CONSUMO: TRIANGULAÇÃO DE DADOS
FIGURA 3 MERCADO INTEGRADOR DE SISTEMAS DO ORIENTE MÉDIO E ÁFRICA PARA BENS DE VAREJO E CONSUMO: ANÁLISE DROC
FIGURA 4 MERCADO INTEGRADOR DE SISTEMAS DO ORIENTE MÉDIO E ÁFRICA PARA BENS DE VAREJO E CONSUMO: ANÁLISE DE MERCADO DO ORIENTE MÉDIO E ÁFRICA VS MERCADO REGIONAL
FIGURA 5 MERCADO INTEGRADOR DE SISTEMAS DO ORIENTE MÉDIO E ÁFRICA PARA BENS DE VAREJO E CONSUMO: ANÁLISE DE PESQUISA DA EMPRESA
FIGURA 6 MERCADO INTEGRADOR DE SISTEMAS DO ORIENTE MÉDIO E ÁFRICA PARA BENS DE VAREJO E CONSUMO: DEMOGRAFIA DAS ENTREVISTAS
FIGURA 7 MERCADO INTEGRADOR DE SISTEMAS DO ORIENTE MÉDIO E ÁFRICA PARA BENS DE VAREJO E CONSUMO: GRADE DE POSIÇÃO DE MERCADO DBMR
FIGURA 8 MERCADO INTEGRADOR DE SISTEMAS DO ORIENTE MÉDIO E ÁFRICA PARA BENS DE VAREJO E CONSUMO: ANÁLISE DA PARTICIPAÇÃO DE FORNECEDORES
FIGURA 9 MERCADO INTEGRADOR DE SISTEMAS DO ORIENTE MÉDIO E ÁFRICA PARA BENS DE VAREJO E CONSUMO: SEGMENTAÇÃO
FIGURA 10 O CRESCIMENTO DO USO DA INTERNET DAS COISAS (IOT) DEVE IMPULSIONAR O MERCADO DE INTEGRADORES DE SISTEMAS DO ORIENTE MÉDIO E DA ÁFRICA PARA BENS DE VAREJO E CONSUMO NO PERÍODO PREVISTO DE 2020 A 2027
FIGURA 11 O SEGMENTO DE INTEGRAÇÃO DE INFRAESTRUTURA DEVE SER REPRESENTANTE DA MAIOR PARCIALIDADE DO MERCADO DE INTEGRADORES DE SISTEMAS DO ORIENTE MÉDIO E ÁFRICA PARA BENS DE VAREJO E CONSUMO EM 2020 E 2027
FIGURA 12 MOTIVADORES, RESTRIÇÕES, OPORTUNIDADES E DESAFIOS DO MERCADO INTEGRADOR DE SISTEMAS DO ORIENTE MÉDIO E ÁFRICA PARA BENS DE VAREJO E CONSUMO
FIGURA 13 TAMANHO DO MERCADO DE IOT MUNDIAL DE 2017 A 2019, PREVISÃO PARA 2020-2025
FIGURA 14 NÚMERO DE USUÁRIOS DE SMARTPHONE NO MUNDO, DE 2016 A 2020
FIGURA 15 A ÁSIA-PACÍFICO É O MERCADO DE CRESCIMENTO MAIS RÁPIDO PARA O MERCADO DE INTEGRADORES DE SISTEMAS PARA BENS DE VAREJO E CONSUMO NO PERÍODO DE PREVISÃO DE 2020 A 2027
FIGURA 16 MERCADO INTEGRADOR DE SISTEMAS DO ORIENTE MÉDIO E ÁFRICA PARA BENS DE VAREJO E CONSUMO: POR SERVIÇO, 2019
FIGURA 17 MERCADO DE INTEGRAÇÃO DE SISTEMAS DO ORIENTE MÉDIO E ÁFRICA PARA BENS DE VAREJO E CONSUMO: POR TIPO DE PRODUTO, 2019
FIGURA 18 MERCADO DE INTEGRAÇÃO DE SISTEMAS DO ORIENTE MÉDIO E ÁFRICA PARA BENS DE VAREJO E CONSUMO: POR TECNOLOGIA, 2019
FIGURA 19 MERCADO DE INTEGRADORES DE SISTEMAS DO ORIENTE MÉDIO E ÁFRICA PARA BENS DE VAREJO E CONSUMO: POR TIPO DE DATA CENTER, 2019
FIGURA 20 MERCADO INTEGRADOR DE SISTEMAS DO ORIENTE MÉDIO E ÁFRICA PARA BENS DE VAREJO E CONSUMO: INSTANTÂNEO (2019)
FIGURA 21 MERCADO INTEGRADOR DE SISTEMAS DO ORIENTE MÉDIO E ÁFRICA PARA BENS DE VAREJO E CONSUMO: POR PAÍS (2019)
FIGURA 22 MERCADO DE INTEGRAÇÃO DE SISTEMAS DO ORIENTE MÉDIO E ÁFRICA PARA BENS DE VAREJO E CONSUMO: POR PAÍS (2020 E 2027)
FIGURA 23 MERCADO DE INTEGRAÇÃO DE SISTEMAS DO ORIENTE MÉDIO E ÁFRICA PARA BENS DE VAREJO E CONSUMO: POR PAÍS (2019 E 2027)
FIGURA 24 MERCADO DE INTEGRADORES DE SISTEMAS DO ORIENTE MÉDIO E ÁFRICA PARA BENS DE VAREJO E CONSUMO: POR TIPO DE SERVIÇO (2020-2027)
FIGURA 25 MERCADO DE INTEGRADORES DE SISTEMAS DO ORIENTE MÉDIO E ÁFRICA PARA BENS DE VAREJO E CONSUMO: PARTICIPAÇÃO DA EMPRESA EM 2019 (%)
Metodologia de Investigação
A recolha de dados e a análise do ano base são feitas através de módulos de recolha de dados com amostras grandes. A etapa inclui a obtenção de informações de mercado ou dados relacionados através de diversas fontes e estratégias. Inclui examinar e planear antecipadamente todos os dados adquiridos no passado. Da mesma forma, envolve o exame de inconsistências de informação observadas em diferentes fontes de informação. Os dados de mercado são analisados e estimados utilizando modelos estatísticos e coerentes de mercado. Além disso, a análise da quota de mercado e a análise das principais tendências são os principais fatores de sucesso no relatório de mercado. Para saber mais, solicite uma chamada de analista ou abra a sua consulta.
A principal metodologia de investigação utilizada pela equipa de investigação do DBMR é a triangulação de dados que envolve a mineração de dados, a análise do impacto das variáveis de dados no mercado e a validação primária (especialista do setor). Os modelos de dados incluem grelha de posicionamento de fornecedores, análise da linha de tempo do mercado, visão geral e guia de mercado, grelha de posicionamento da empresa, análise de patentes, análise de preços, análise da quota de mercado da empresa, normas de medição, análise global versus regional e de participação dos fornecedores. Para saber mais sobre a metodologia de investigação, faça uma consulta para falar com os nossos especialistas do setor.
Personalização disponível
A Data Bridge Market Research é líder em investigação formativa avançada. Orgulhamo-nos de servir os nossos clientes novos e existentes com dados e análises que correspondem e atendem aos seus objetivos. O relatório pode ser personalizado para incluir análise de tendências de preços de marcas-alvo, compreensão do mercado para países adicionais (solicite a lista de países), dados de resultados de ensaios clínicos, revisão de literatura, mercado remodelado e análise de base de produtos . A análise de mercado dos concorrentes-alvo pode ser analisada desde análises baseadas em tecnologia até estratégias de carteira de mercado. Podemos adicionar quantos concorrentes necessitar de dados no formato e estilo de dados que procura. A nossa equipa de analistas também pode fornecer dados em tabelas dinâmicas de ficheiros Excel em bruto (livro de factos) ou pode ajudá-lo a criar apresentações a partir dos conjuntos de dados disponíveis no relatório.

