North America Teleradiology Market
Tamanho do mercado em biliões de dólares
CAGR :
% 
 USD
1.37 Billion
USD
5.32 Billion
2025
2033
USD
1.37 Billion
USD
5.32 Billion
2025
2033
| 2026 –2033 | |
| USD 1.37 Billion | |
| USD 5.32 Billion | |
| % | |
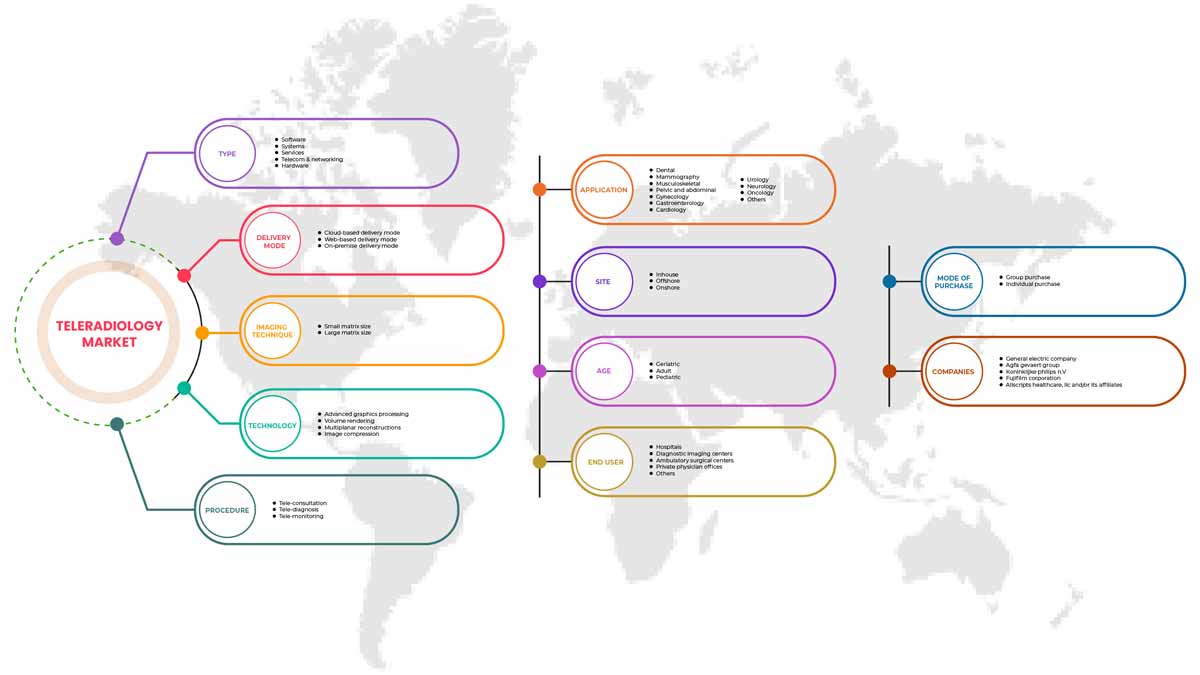
North America Teleradiology Market, By Type (Hardware, Systems, Software, Telecom, and Networking Services), Delivery Mode (Web-Based Delivery Mode, Cloud Based Delivery Mode, and On-Premise Delivery Mode), Imaging Technique (Small Matrix Size, and Large Matrix Size), Technology (Advanced Graphics Processing, Volume Rendering, Multiplanar Reconstructions, and Image Compression), Procedure (Tele-Consultation, Tele-Diagnosis, and Tele-Monitoring), Application (Cardiology, Neurology, Oncology, Musculoskeletal, Gastroenterology, Pelvic and Abdominal, Gynecology, Urology, Mammography, Dental, and Others), Site (In-House, Offshore, and Onshore), Age (Pediatric, Geriatric, and Adults), Mode of Purchase (Group Purchase, and Individual Purchase), End User (Hospitals, Ambulatory Surgical Centers, Private Physician Offices, Diagnostics Imaging Centers, and Others), Industry Trends and Forecast To 2029.
North America Teleradiology Market Analysis and Insights
Teleradiology is a branch of telemedicine in which telecommunication systems are used to transmit radiological images from one location to another. Rapid digital image processing technologies have developed to ensure effective image distribution across the regional, local, and North American levels. The emergence and acceptance of mobile technology (mHealth) to visualize and interpret images further fuels the growth of the teleradiology market in developed nations such as the U.S., Germany, the U.K., Australia, and Japan. Widespread use of smart connected devices and related solutions confirms the effective interpretation of the medical images, thereby reducing treatment time. Hence, advancements in digital technology will enhance remote patient monitoring methodologies and accessibility to radiologists’ interpretation and consultation.
In addition, according to the World Health Organization factsheet, cancer is responsible for one of every six deaths worldwide. Furthermore, approximately 70% of cancer deaths occur in low- and middle-income countries. The increase in the funding by the federal government to drive the adoption of these solutions further influence the market. Additionally, the surge in healthcare expenditure, advancements in healthcare infrastructure, and high demand for expanded care delivery positively affect the teleradiology market.
However, repayments and the growing regulatory burden are expected to dampen the growth of the teleradiology market. On the other hand, the rising cost of technology is anticipated to restrain the market growth.
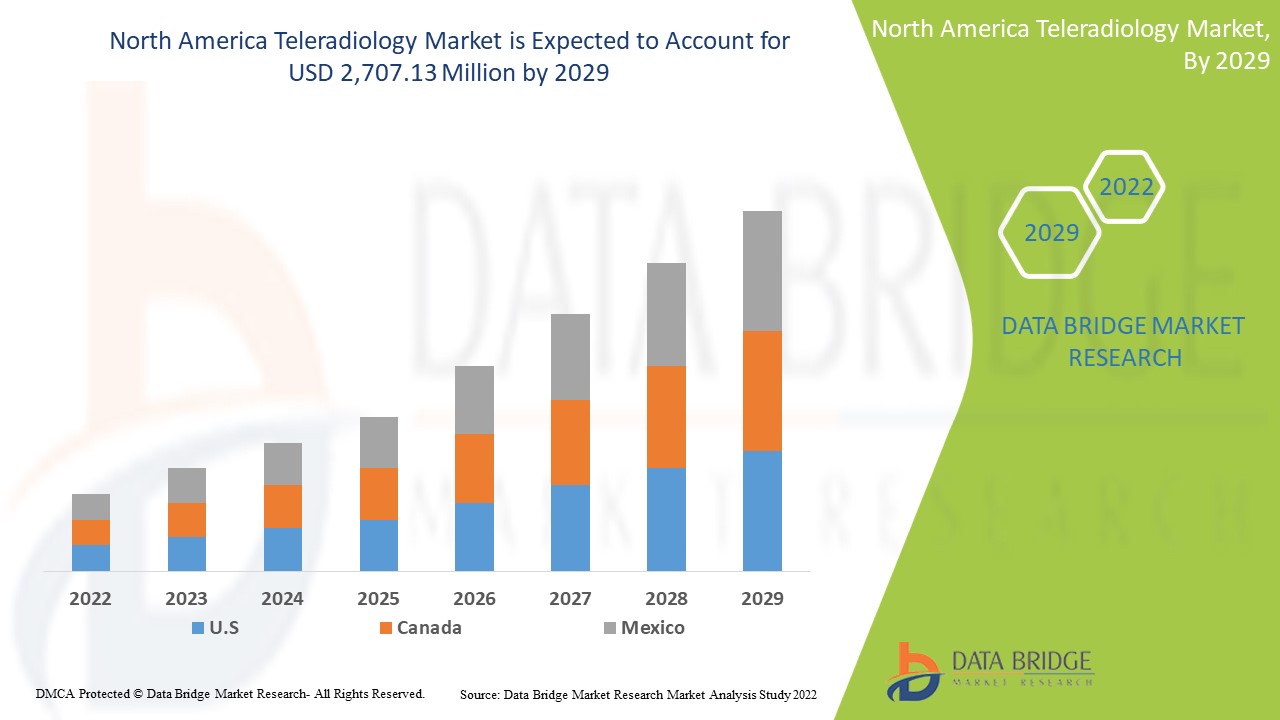
Data Bridge Market Research analyzes that the North American teleradiology market is expected to reach a value of USD 2,707.13 million by 2029, at a CAGR of 18.5% during the forecast period. Services account for the largest type segment in the market due to increasing in teleradiology services among the North American population. This market report also covers pricing analysis, patent analysis, and technological advancements in depth.
|
Report Metric |
Details |
|
Forecast Period |
2022 to 2029 |
|
Base Year |
2021 |
|
Historic Years |
2020 (Customizable to 2019 - 2014) |
|
Quantitative Units |
Revenue in USD Million, Volumes in Units, Pricing in USD |
|
Segments Covered |
By Type (Hardware, Systems, Software, Telecom, and Networking Services), Delivery Mode (Web-Based Delivery Mode, Cloud Based Delivery Mode, and On-Premise Delivery Mode), Imaging Technique (Small Matrix Size, and Large Matrix Size), Technology (Advanced Graphics Processing, Volume Rendering, Multiplanar Reconstructions, and Image Compression), Procedure (Tele-Consultation, Tele-Diagnosis, and Tele-Monitoring), Application (Cardiology, Neurology, Oncology, Musculoskeletal, Gastroenterology, Pelvic and Abdominal, Gynecology, Urology, Mammography, Dental, and Others), Site (In-House, Offshore, and Onshore), Age (Pediatric, Geriatric, and Adults), Mode of Purchase (Group Purchase, and Individual Purchase), End User (Hospitals, Ambulatory Surgical Centers, Private Physician Offices, Diagnostics Imaging Centers, and Others) |
|
Countries Covered |
U.S., Canada, and Mexico |
|
Market Players Covered |
Telemedicine Clinic, Virtual Radiologic, RamSoft, Inc., Koninklijke Philips N.V., Everlight Radiology, Teleradiology Solutions, All-American Teleradiology, Medica Group PLC, Vital Radiology Services, PMG Services, Inc., General Electric, RadNet, Inc., FUJIFILM Corporation, Agfa-Gevaert Group, USARAD.COM, TeleDiagnosys Services Pvt Ltd., ONRAD, Inc., 4ways Healthcare Limited, Allscripts Healthcare, LLC, Redox, Inc., NightHawk Radiology, NightShift Radiology, and NucleusHealth, among others. |
North America Teleradiology Market Definition
Teleradiology is a medical method that captures visuals of the internal anatomy and function of the body that helps in the process of medical diagnosis or therapy. Interpreting all noninvasive imaging studies, such as digitized x-rays, CT, MRI, ultrasound, and nuclear medicine studies, can be carried out in such a manner. It can capture medical images in one location and facilitate or transmit them over a range so that a radiologist can view and interpret them for diagnostic or consultative purposes. Teleradiology is extensively used in telemonitoring, teleconsultation, and telediagnosis, enabling radiologists to perform their daily work effectively. Teleradiology enables effective on-site solutions through real-time interpretation and North American cloud networks. Teleradiology primarily aids medical personnel in accessing patient information regardless of location, enhancing diagnostic coverage. Teleradiology services present extensive applications for radiologists to use web services that improve patients' care and therapies without the requirement to be physically present on site.
In addition, the rising demand for teleradiology in cases of second opinion and emergencies is one of the high-impact rendering drivers of the market. Moreover, a shortage of healthcare professionals, especially in sub-specialist segments such as pediatric, neurology, and musculoskeletal radiology, is leading to the adoption of teleradiology services.
North America Teleradiology Market Dynamics
This section deals with understanding the market drivers, opportunities, restraints, and challenges. All of this is discussed in detail below:
Drivers
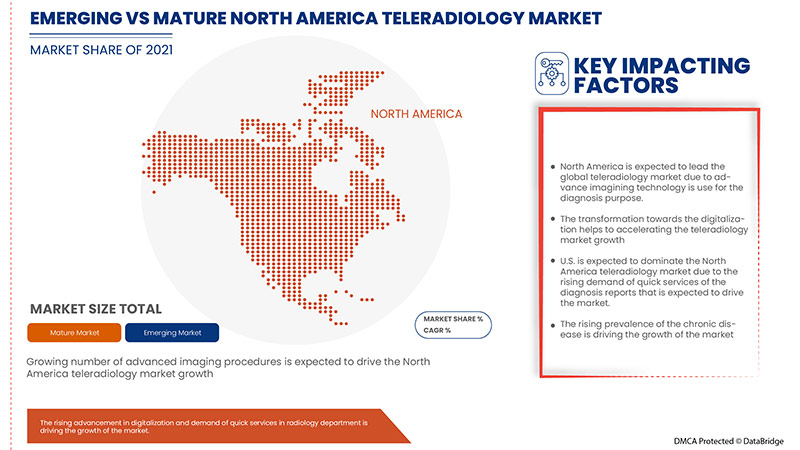
- Growing Number of Advanced Imaging Procedures
The rise in imaging procedures is expected to drive the demand for teleradiology solutions for reliability and efficiency. Advanced diagnostic imaging, including diagnostic magnetic resonance imaging (MRI), computed tomography (CT), and nuclear medicine imaging, such as positron emission tomography (PET), has attracted many new providers. There has been a proliferation in the volume of diagnostic medical imaging services prescribed by practitioners, including radiologists.
CT scans account for a quarter of all Americans exposed to radiation. A high level of engineering and expertise is required to manage advanced and sophisticated diagnostic imaging systems, thus driving the growing complexity of cases with a lack of appropriate resources. Adopting remote sensing solutions has contributed significantly to narrowing the rural-urban disparity in many emerging countries, including India and Brazil, as well as in developed economies such as the United States, the United Kingdom, and Germany. These solutions are more practical and economical as they eliminate travel and allow radiologists to work from anywhere. The shortage of qualified radiologists has further increased the demand for radiology services.
Advanced imaging procedures for teleradiology are expected to help the market get more accurate results quickly and propel the North American teleradiology market growth in the forecasted period.
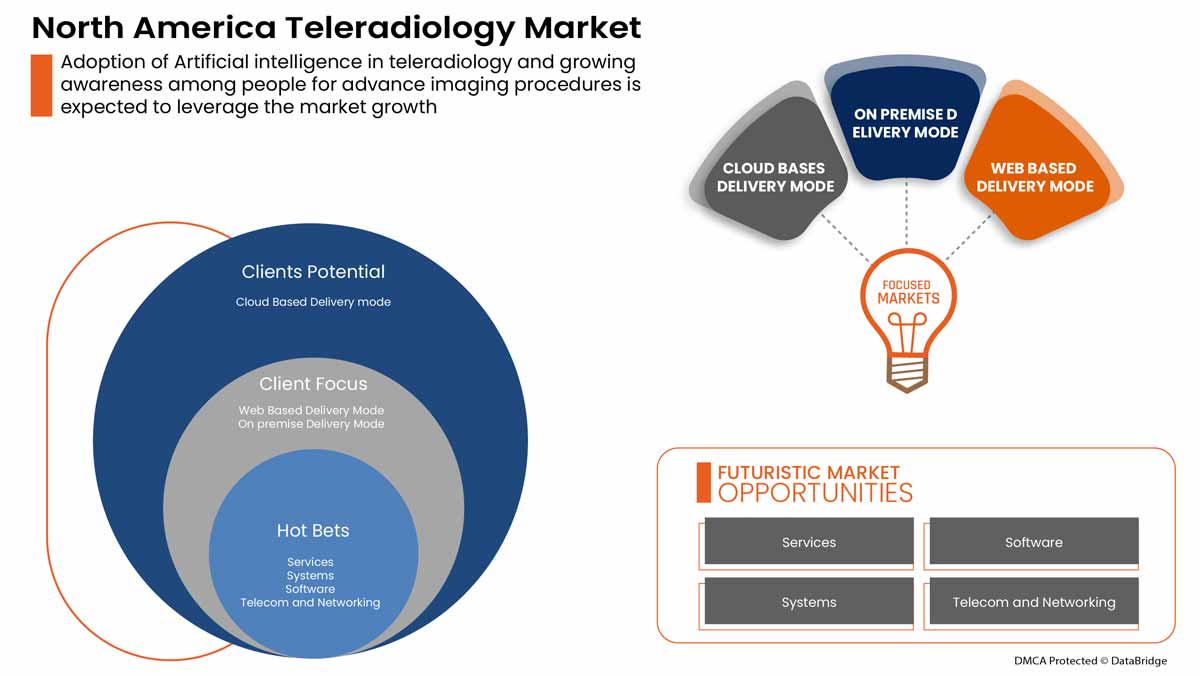
- Adoption of Artificial Intelligence in Teleradiology
Artificial intelligence is one of the most promising breakthroughs in teleradiology. It is estimated that the number of publications on AI in radiology has grown from an average of 100-150 research publications per year to 700-800 per year over the past decade. Among all major imaging modalities, the acceptance of AI is higher in CT and MRI systems. Depending on the application, AI is also used primarily in neuroradiology. Several players in this market are expanding their AI offerings.
AI has been embedded in numerous medical institutions worldwide and has proven itself a valuable partner in the radiology environment. North America Diagnostics Australia (GDA), an Integral Diagnostics Group (IDG) subsidiary, was one of the first Australian diagnostics companies to deploy AI as part of their radiology workflow. The company integrated high-end algorithms into the care management path to accelerate patient care and treatment of head, neck, and chest conditions. The additional benefit of AI in teleradiology is that Artificial intelligence helps radiologists quickly analyze image and data registries to understand patient conditions better, enhance their clinical role, and become part of the core management team. AI picks up enough weight that the radiologist can focus on the complex cases that require their specialist attention.
Artificial intelligence (AI) can help create an inbuilt system that prioritizes cases based on their protocol requirement. For example, cases of trauma and stroke can be prioritized and assigned to the radiologist's work lists, thereby saving many lives.
Artificial intelligence in teleradiology helps get improved results with automated tools and helps radiologists utilize their skills properly, which is expected to propel market growth.
Restraint
- Lack of Access to High-Speed Internet in Rural Areas
Teleradiology allows rural patients and professionals to receive quality imaging advice without traveling to populated urban areas with more advanced medical systems. Additionally, radiologists remotely working need a good internet connection. However, the lack of high-speed broadband connectivity has impacted the growing access to teleradiation services in rural areas.
Limited access to high-speed internet connections impacts the ability of radiologists to participate in video consultations, submit medical imaging reports, and monitor patient health remotely. When slow connection speeds create bottlenecks in image-heavy studies, the workflow can quickly become frustrating and affect patient care. Additionally, IT services are required to ensure that the images are submitted in compliance with his HIPAA. Lack of reliable internet connectivity and poor broadband connectivity in rural areas is, therefore, major obstacles to the steady expansion of the North American market.
Opportunity
-
Increasing Awareness Among People
Teleradiology offers alternative options for receiving healthcare services in North America, improving access and reducing costs associated with traveling for services. However, the full potential of teleradiology has not been realized with slow and fragmented uptake.
The increase in the awareness program, teleradiology awareness, and support from the government has increased the usage of teleradiology and telehealth in various areas.
These awareness programs and events among the people increase their interest in their health and to know more about the healthcare programs and what new opportunities are available for their health that will ultimately raise market growth of teleradiology and provide opportunities for companies to grow.
Challenge
- High Chances of Misdiagnosis
A physical examination can better understand the patient's actual health condition, which is the most crucial element for the patient's treatment. All the treatment programs and what should be the next step for the treatment can be created with the help of a quick physical examination. The same procedure should be applied to the radiologists to know more about actual problems and conditions, and more outcomes are obtained when patients are present with radiologists during consultations. Lack of patient medical history and other necessary records of the patient body examination during medical imaging is a major factor in the radiologist's incapacity to make the optimal decision in teleradiology. For example, it has been demonstrated that communication between doctors and radiologists results in clinical diagnosis revisions in 50% of cases, affecting therapy options. The accuracy of interpretation will change if the patient's medical history is appropriately disclosed
Thus, the high chances of misdiagnosis and improper examination of the report demolish the usage of teleradiology which is expected to challenge the North American teleradiology market growth.
Post-Covid-19 Impact On North America Teleradiology Market
The COVID-19 outbreak drastically affected North American healthcare, with the UK among the countries most severely impacted. Coronavirus had spread worldwide, affecting millions of people and resulting in thousands of deaths. Medical practices of all sizes were under tremendous strain due to the North American outbreak of COVID-19. The market suffered at the pandemic's start because medical treatment volumes had declined dramatically due to the revocation or postponement of elective procedures. On the other hand, healthcare providers were required to rely on teleradiology solutions to read diagnostic reports and treat patients, which boosted the teleradiology industry. Teleradiology solutions improved diagnostic imaging efficiency by improving and simplifying radiology with accurate reads and fewer manual errors. As the fight against COVID-19 continues, teleradiology methods are more widely used.
Manufacturers are making various strategic decisions to bounce back post-COVID-19. The players are conducting multiple R&D activities, product launches, and strategic partnerships to improve the technology and test results in the pharmacogenetics testing market.
Recent Developments
- In April 2022, 4ways announced that it had been shortlisted at the 2022 Health Investor Awards. 4ways is in contention for the diagnostics provider of the year award. This acknowledgment celebrated the growth of 4ways’, strengthening its position as a key partner to the clients. 4ways has sustained improvement to its service offering through innovations in workflows and investments in new technologies. This has enabled 4ways to gain resilience as a platform for teleradiology and has provided operations security
North America Teleradiology Market Scope
North America's teleradiology market is segmented into type, delivery mode, imaging technique, technology, procedure, application, site, age, mode of purchase, and end-user. The growth among segments helps you analyze niche pockets of development and strategies to approach the market and determine your core application areas and the difference in your target markets.
By Type
- HARDWARE
- SYSTEMS
- SOFTWARE
- TELECOM & NETWORKING
- SERVICES
On the basis of type, the North American teleradiology market is segmented into hardware, systems, software, telecom, and networking services.
By Delivery Mode
- WEB-BASED DELIVERY MODE
- CLOUD-BASED DELIVERY MODE
- ON-PREMISE DELIVERY MODE
On the basis of delivery mode, the North American teleradiology market is segmented into the web-based delivery mode, cloud-based delivery mode, and on-premise delivery mode.
By Imaging Technique
- SMALL MATRIX SIZE
- LARGE MATRIX SIZE
On the basis of imaging techniques, the North American teleradiology market is segmented into small matrix size and large matrix size.
By Technology
- ADVANCED GRAPHICS PROCESSING
- VOLUME RENDERING
- MULTIPLANAR RECONSTRUCTIONS
- IMAGE COMPRESSION
On the basis of technology, the North American teleradiology market is segmented into advanced graphics processing, volume rendering, multiplanar reconstructions, and image compression.
By Procedure
- TELE-CONSULTATION
- TELE-DIAGNOSIS
- TELE-MONITORING
On the basis of procedure, the North American teleradiology market is segmented into teleconsultation, telediagnosis, and telemonitoring.
By Application
- CARDIOLOGY
- NEUROLOGY
- ONCOLOGY
- MUSCULOSKELETAL
- GASTROENTEROLOGY
- PELVIC AND ABDOMINAL
- GYNECOLOGY
- UROLOGY
- MAMMOGRAPHY
- DENTAL
- OTHERS
On the basis of application, the North American teleradiology market is segmented into cardiology, neurology, oncology, musculoskeletal, gastroenterology, pelvic and abdominal, gynecology, urology, mammography, dental, and others.
By Site
- INHOUSE
- ONSHORE
- OFFSHORE
On the basis of site, the North American teleradiology market is segmented in-house, offshore, and onshore.
By Age
- PEDIATRIC
- ADULT
- GERIATRIC
On the basis of age, the North American teleradiology market is segmented into pediatric, geriatric, and adult.
By Mode Of Purchase
- GROUP PURCHASE
- INDIVIDUAL PURCHASE
On the basis of mode of purchase, the North American teleradiology market is segmented into group purchases and individual purchases.
By End Users
- HOSPITALS
- AMBULATORY SURGICAL CENTERS
- PRIVATE PHYSICIAN OFFICES
- DIAGNOSTIC IMAGING CENTERS
- OTHERS
On the basis of end-user, the North American teleradiology market is segmented into hospitals, ambulatory surgical centers, private physician offices, diagnostics imaging centers, and others.
North America Teleradiology Market Regional Analysis/Insights
The North American teleradiology market is analyzed, and market size information is provided by type, delivery mode, imaging technique, technology, procedure, application, site, age, mode of purchase, and end-user.
The countries covered in this market report are U.S., Canada, and Mexico.
In 2022, North America will be most dominating due to the presence of key market players in the largest consumer market with high GDP. The U.S is expected to grow due to the rise in technological advancement in teleradiology.
The country section of the report also provides individual market-impacting factors and changes in regulation in the market domestically that impact the current and future trends of the market. Data points such as new sales, replacement sales, country demographics, regulatory acts, and import-export tariffs are some of the major pointers used to forecast the market scenario for individual countries. Also, the presence and availability of North America brands and their challenges faced due to large or scarce competition from local and domestic brands, and the impact of sales channels are considered while providing forecast analysis of the country data.
Competitive Landscape and North America Teleradiology Market Share Analysis
North America teleradiology market competitive landscape provides details by the competitor. Details included are company overview, company financials, revenue generated, market potential, investment in R&D, new market initiatives, production sites and facilities, company strengths and weaknesses, product launch, product trials pipelines, product approvals, patents, product width and breath, application dominance, technology lifeline curve. The above data points provided are only related to the company’s focus on the North America teleradiology market.
Research Methodology: North America Teleradiology Market
Data collection and base year analysis are done using data collection modules with large sample sizes. The market data is analyzed and estimated using market statistical and coherent models. In addition, market share analysis and key trend analysis are the major success factors in the market report. The key research methodology used by DBMR research team is data triangulation which involves data mining, analysis of the impact of data variables on the market, and primary (industry expert) validation. Apart from this, data models include the Vendor Positioning Grid, Market Time Line Analysis, Market Overview and Guide, Company Positioning Grid, Company Market Share Analysis, Standards of Measurement, North America vs Regional, and Vendor Share Analysis. Please request an analyst call in case of further inquiry.
SKU-
Obtenha acesso online ao relatório sobre a primeira nuvem de inteligência de mercado do mundo

- Painel interativo de análise de dados
- Painel de análise da empresa para oportunidades de elevado potencial de crescimento
- Acesso de analista de pesquisa para personalização e customização. consultas
- Análise da concorrência com painel interativo
- Últimas notícias, atualizações e atualizações Análise de tendências
- Aproveite o poder da análise de benchmark para um rastreio abrangente da concorrência
Índice
1 INTRODUÇÃO
1.1 OBJETIVOS DO ESTUDO
1.2 DEFINIÇÃO DE MERCADO
1.3 VISÃO GERAL DO MERCADO DE TELERADIOLOGIA DA AMÉRICA DO NORTE
1.4 MOEDA E PREÇOS
1.5 LIMITAÇÕES
1.6 MERCADOS COBERTOS
2 SEGMENTAÇÃO DE MERCADO
2.1 MERCADOS COBERTOS
2.2 ÂMBITO GEOGRÁFICO
2,3 ANOS CONSIDERADOS PARA O ESTUDO
2.4 MODELO DE VALIDAÇÃO DE DADOS TRIPÉ DBMR
2.5 ENTREVISTAS PRINCIPAIS COM PRINCIPAIS LÍDERES DE OPINIÃO
2.6 MODELAGEM MULTIVARIADA
2.7 GRADE DE COBERTURA DE APLICAÇÃO DE MERCADO
CURVA DE LINHA DE VIDA TIPO 2.8
2.9 GRADE DE POSIÇÃO DE MERCADO DBMR
2.1 ANÁLISE DA PARTICIPAÇÃO DO FORNECEDOR
2.11 FONTES SECUNDÁRIAS
2.12 PREMISSAS
3 RESUMO EXECUTIVO
3.1 ANÁLISE PESTEL
3.2 AS CINCO FORÇAS DE PORTER
3.3 PERCEPÇÕES INDUSTRIAIS:
4 REGULAMENTOS
5 VISÃO GERAL DO MERCADO
5.1 MOTORISTAS
5.1.1 NÚMERO CRESCENTE DE PROCEDIMENTOS AVANÇADOS DE IMAGEM
5.1.2 ADOÇÃO DE INTELIGÊNCIA ARTIFICIAL EM TELERADIOLOGIA
5.1.3 INVESTIMENTOS GOVERNAMENTAIS PARA A INTEROPERABILIDADE DA SAÚDE
5.2 RESTRIÇÕES
5.2.1 FALTA DE ACESSO À INTERNET DE ALTA VELOCIDADE NAS ZONAS RURAIS
5.2.2 FALTA DE SEGURANÇA DE DADOS DE IMAGEM
5.3 OPORTUNIDADES
5.3.1 TRANSFORMAÇÃO RUMO À DIGITALIZAÇÃO
5.3.2 CRESCENTE PREVALÊNCIA DE DOENÇAS E CONDIÇÕES CRÔNICAS
5.3.3 AUMENTANDO A CONSCIENTIZAÇÃO DAS PESSOAS
5.4 DESAFIOS
5.4.1 ALTAS CHANCES DE DIAGNÓSTICO ERRO
5.4.2 FRAUDES CRESCENTES NA ÁREA DE SAÚDE
5.4.3 REGULAMENTAÇÃO RIGOROSA
6 MERCADO DE TELERADIOLOGIA DA AMÉRICA DO NORTE, POR TIPO
6.1 VISÃO GERAL
6.2 SERVIÇOS
6.2.1 POR TIPO DE SERVIÇOS
6.2.1.1 SERVIÇOS DE RADIOLOGIA NOTURNA
6.2.1.2 SERVIÇOS DE RADIOLOGIA DIURNA
6.2.2 SERVIÇOS POR PROCESSO
6.2.2.1 SERVIÇOS DE RELATÓRIOS CERTIFICADOS
6.2.2.2 RELATÓRIO PRELIMINAR
6.3 SOFTWARE
6.3.1 POR IMPLANTAÇÃO
6.3.1.1 SOFTWARE INTEGRADO
6.3.1.2 SOFTWARE AUTÔNOMO
6.3.2 POR TIPO DE SOFTWARE
6.3.2.1 ARQUIVAMENTO E COMUNICAÇÃO DE IMAGENS
6.3.2.2 SISTEMA DE INFORMAÇÃO DE RADIOLOGIA
6.4 SISTEMAS
6.4.1 IMAGEM DIGITAL E COMUNICAÇÃO EM MEDICINA (DICOM)
6.4.2 SISTEMAS DE REGISTROS MÉDICOS ELETRÔNICOS (EMR)
6.4.3 SISTEMA DE REGISTRO ELETRÔNICO DE SAÚDE (HER)
6.5 TELECOMUNICAÇÕES E REDES
6.5.1 SOLUÇÕES DE TELERADIOLOGIA BASEADAS EM EMPRESAS
6.5.2 SOLUÇÕES DE TELERADIOLOGIA BASEADAS EM NUVEM
6.5.3 SOLUÇÕES DE TELERADIOLOGIA BASEADAS NA WEB
6.5.4 REDE PRIVADA VIRTUAL (VPN)
6.6 HARDWARE
6.6.1 IMPRESSORA DE IMAGENS
6.6.2 ESTAÇÃO DE VISUALIZAÇÃO DE RADIOLOGIA
6.6.3 SCANNER
6.6.4 DIGITALIZADOR DE FILME
6.6.5 MONITORES
6.6.6 VISUALIZADORES DE IMAGENS
6.6.7 OUTROS
7 MERCADO DE TELERADIOLOGIA DA AMÉRICA DO NORTE, POR MODALIDADE DE ENTREGA
7.1 VISÃO GERAL
7.2 MODO DE ENTREGA BASEADO EM NUVEM
7.3 MODO DE ENTREGA BASEADO NA WEB
7.4 MODO DE ENTREGA NO LOCAL
8 MERCADO DE TELERADIOLOGIA DA AMÉRICA DO NORTE, POR TÉCNICA DE IMAGEM
8.1 VISÃO GERAL
8.1.1 TAMANHO DE MATRIZ PEQUENO
8.1.1.1 IMAGEM DE RESSONÂNCIA MAGNÉTICA
8.1.1.2 IMAGEM NUCLEAR (SPECT/PET)
8.1.1.3 TOMOGRAFIA COMPUTADORIZADA (TC)
8.1.1.4 TELE-ULTRASSOM
8.1.1.5 FLUOROGRAFIA DIGITAL
8.1.1.6 ANGIOGRAFIA DIGITAL
8.1.1.7 ECOCARDIOGRAMA
8.1.1.8 MAMOGRAFIA
8.1.1.9 IMAGEM DE RAIO-X DIGITAL
8.2 TAMANHO DE MATRIZ GRANDE
8.2.1 FILMES RADIOGRÁFICOS DIGITALIZADOS
8.2.2 RADIOGRAFIA DIGITAL
9 MERCADO DE TELERADIOLOGIA DA AMÉRICA DO NORTE, POR TECNOLOGIA
9.1 VISÃO GERAL
9.2 PROCESSAMENTO GRÁFICO AVANÇADO
9.3 RENDERIZAÇÃO DE VOLUME
9.4 RECONSTRUÇÕES MULTIPLANARES
9.5 COMPRESSÃO DE IMAGEM
10 MERCADO DE TELERADIOLOGIA DA AMÉRICA DO NORTE, POR PROCEDIMENTO
10.1 VISÃO GERAL
10.2 TELE-CONSULTA
10.3 TELE-DIAGNÓSTICO
10.4 TELE-MONITORAMENTO
11 MERCADO DE TELERADIOLOGIA DA AMÉRICA DO NORTE, POR APLICAÇÃO
11.1 VISÃO GERAL
11.1.1 CARDIOLOGIA
11.1.1.1 SERVIÇOS
11.1.1.2 SOFTWARE
11.1.1.3 SISTEMAS
11.1.1.4 TELECOMUNICAÇÕES E REDES
11.1.1.5 HARDWARE
11.1.2 ONCOLOGIA
11.1.2.1 SERVIÇOS
11.1.2.2 SOFTWARE
11.1.2.3 SISTEMAS
11.1.2.4 TELECOMUNICAÇÕES E REDES
11.1.2.5 HARDWARE
11.1.3 NEUROLOGIA
11.1.3.1 SERVIÇOS
11.1.3.2 SOFTWARE
11.1.3.3 SISTEMAS
11.1.3.4 TELECOMUNICAÇÕES E REDES
11.1.3.5 HARDWARE
11.1.4 MÚSCULO-ESQUELÉTICO
11.1.4.1 SERVIÇOS
11.1.4.2 SOFTWARE
11.1.4.3 SISTEMAS
11.1.4.4 TELECOMUNICAÇÕES E REDES
11.1.4.5 HARDWARE
11.1.5 GASTROENTEROLOGIA
11.1.5.1 SERVIÇOS
11.1.5.2 SOFTWARE
11.1.5.3 SISTEMAS
11.1.5.4 TELECOMUNICAÇÕES E REDES
11.1.5.5 HARDWARE
11.1.6 PÉLVICO E ABDOMINAL
11.1.6.1 SERVIÇOS
11.1.6.2 SOFTWARE
11.1.6.3 SISTEMAS
11.1.6.4 TELECOMUNICAÇÕES E REDES
11.1.6.5 HARDWARE
11.1.7 GINECOLOGIA
11.1.7.1 SERVIÇOS
11.1.7.2 SOFTWARE
11.1.7.3 SISTEMAS
11.1.7.4 TELECOMUNICAÇÕES E REDES
11.1.7.5 HARDWARE
11.1.8 UROLOGIA
11.1.8.1 SERVIÇOS
11.1.8.2 SOFTWARE
11.1.8.3 SISTEMAS
11.1.8.4 TELECOMUNICAÇÕES E REDES
11.1.8.5 HARDWARE
11.1.9 MAMOGRAFIA
11.1.9.1 SERVIÇOS
11.1.9.2 SOFTWARE
11.1.9.3 SISTEMAS
11.1.9.4 TELECOMUNICAÇÕES E REDES
11.1.9.5 HARDWARE
11.1.10 ODONTOLÓGICO
11.1.10.1 SERVIÇOS
11.1.10.2 SOFTWARE
11.1.10.3 SISTEMAS
11.1.10.4 TELECOMUNICAÇÕES E REDES
11.1.10.5 HARDWARE
11.1.11 OUTROS
12 MERCADO DE TELERADIOLOGIA DA AMÉRICA DO NORTE, POR LOCAL
12.1 VISÃO GERAL
12.1.1 INTERNO
12.1.2 OFFSHORE
12.1.3 EM TERRA
13 MERCADO DE TELERADIOLOGIA DA AMÉRICA DO NORTE, POR IDADE
13.1 VISÃO GERAL
13.2 PEDIÁTRICA
13.3 ADULT
13.4 GERIÁTRICA
14 MERCADO DE TELERADIOLOGIA DA AMÉRICA DO NORTE, POR MODO DE COMPRA
14.1 VISÃO GERAL
14.2 COMPRA EM GRUPO
14.3 COMPRA INDIVIDUAL
15 MERCADO DE TELERADIOLOGIA DA AMÉRICA DO NORTE, POR USUÁRIO FINAL
15.1 VISÃO GERAL
15.2 HOSPITAIS
15.2.1 PRIVADO
15.2.2 PÚBLICO
15.3 CENTROS DE DIAGNÓSTICO POR IMAGEM
15.4 CENTROS CIRÚRGICOS AMBULATORIAIS
15.5 CONSULTÓRIOS MÉDICOS PRIVADOS
15.6 OUTROS
16 MERCADO DE TELERADIOLOGIA DA AMÉRICA DO NORTE, POR GEOGRAFIA
16.1 AMÉRICA DO NORTE
16.1.1 EUA
16.1.2 CANADÁ
16.1.3 MÉXICO
17 MERCADO DE TELERADIOLOGIA DA AMÉRICA DO NORTE: CENÁRIO DA EMPRESA
17.1 ANÁLISE DAS AÇÕES DA EMPRESA: AMÉRICA DO NORTE
18 ANÁLISE SWOT
19 PERFIL DA EMPRESA
19.1 GENERAL ELECTRIC COMPANY (2021)
19.1.1 RESUMO DA EMPRESA
19.1.2 ANÁLISE DE RECEITA
19.1.3 ANÁLISE DE AÇÕES DA EMPRESA
19.1.4 PORTFÓLIO DE PRODUTOS
19.1.5 DESENVOLVIMENTO RECENTE
19.2 GRUPO AGFA GEVAERT
19.2.1 RESUMO DA EMPRESA
19.2.2 ANÁLISE DE RECEITA
19.2.3 ANÁLISE DE AÇÕES DA EMPRESA
19.2.4 PORTFÓLIO DE PRODUTOS
19.2.5 DESENVOLVIMENTOS RECENTES
19.3 KONINKLIJKE PHILIPS NV
19.3.1 RESUMO DA EMPRESA
19.3.2 ANÁLISE DE RECEITA
19.3.3 ANÁLISE DE AÇÕES DA EMPRESA
19.3.4 PORTFÓLIO DE PRODUTOS
19.3.5 DESENVOLVIMENTOS RECENTES
19.4 CORPORAÇÃO FUJIFILM
19.4.1 RESUMO DA EMPRESA
19.4.2 ANÁLISE DE RECEITA
19.4.3 ANÁLISE DE AÇÕES DA EMPRESA
19.4.4 PORTFÓLIO DE PRODUTOS
19.4.5 DESENVOLVIMENTOS RECENTES
19.5 ALLSCRIPTS HEALTHCARE, LLC E/OU SUAS AFILIADAS.
19.5.1 RESUMO DA EMPRESA
19.5.2 ANÁLISE DE RECEITA
19.5.3 ANÁLISE DE AÇÕES DA EMPRESA
19.5.4 PORTFÓLIO DE PRODUTOS
19.5.5 DESENVOLVIMENTO RECENTE
19.6 MEDNAX SERVICES, INC
19.6.1 RESUMO DA EMPRESA
19.6.2 ANÁLISE DE RECEITA
19.6.3 PORTFÓLIO DE PRODUTOS
19.6.4 DESENVOLVIMENTO RECENTE
19.7 RADIOLÓGICO VIRTUAL
19.7.1 RESUMO DA EMPRESA
19.7.2 PORTFÓLIO DE PRODUTOS
19.7.3 DESENVOLVIMENTOS RECENTES
19.8 SAÚDE NUCLEAR
19.8.1 RESUMO DA EMPRESA
19.8.2 PORTFÓLIO DE PRODUTOS
19.8.3 DESENVOLVIMENTOS RECENTES
19.9 SOLUÇÕES DE TELERADIOLOGIA
19.9.1 RESUMO DA EMPRESA
19.9.2 PORTFÓLIO DE PRODUTOS
19.9.3 DESENVOLVIMENTOS RECENTES
19.1 TELERADIOLOGIA TOTALMENTE AMERICANA
19.10.1 RESUMO DA EMPRESA
19.10.2 PORTFÓLIO DE PRODUTOS
19.10.3 DESENVOLVIMENTO RECENTE
19.11 RADIOLOGIA EVERLIGHT
19.11.1 RESUMO DA EMPRESA
19.11.2 PORTFÓLIO DE PRODUTOS
19.11.3 DESENVOLVIMENTOS RECENTES
19.12 MEDICA GROUP PLC.
19.12.1 RESUMO DA EMPRESA
19.12.2 ANÁLISE DE RECEITA
19.12.3 PORTFÓLIO DE PRODUTOS
19.12.4 DESENVOLVIMENTOS RECENTES
19.13 RADIOLOGIA NIGHTHAWK
19.13.1 RESUMO DA EMPRESA
19.13.2 PORTFÓLIO DE PRODUTOS
19.13.3 DESENVOLVIMENTOS RECENTES
19.14 RADIOLOGIA DO TURNO DA NOITE
19.14.1 RESUMO DA EMPRESA
19.14.2 PORTFÓLIO DE PRODUTOS
19.14.3 DESENVOLVIMENTOS RECENTES
19.15 ONRAD, INC.
19.15.1 RESUMO DA EMPRESA
19.15.2 PORTFÓLIO DE PRODUTOS
19.15.3 DESENVOLVIMENTOS RECENTES
19.16 RADNET, INC.
19.16.1 RESUMO DA EMPRESA
19.16.2 ANÁLISE DE RECEITA
19.16.3 PORTFÓLIO DE PRODUTOS
19.16.4 DESENVOLVIMENTOS RECENTES
19.17 RAMSOFT, INC.
19.17.1 RESUMO DA EMPRESA
19.17.2 PORTFÓLIO DE PRODUTOS
19.17.3 DESENVOLVIMENTOS RECENTES
19.18 RADS REAIS
19.18.1 RESUMO DA EMPRESA
19.18.2 PORTFÓLIO DE PRODUTOS
19.18.3 DESENVOLVIMENTO RECENTE
19.19 REDOX, INC
19.19.1 RESUMO DA EMPRESA
19.19.2 PORTFÓLIO DE PRODUTOS
19.19.3 DESENVOLVIMENTOS RECENTES
19.2 SERVIÇOS DE TELEDIAGNOSYS PVT LTD.
19.20.1 RESUMO DA EMPRESA
19.20.2 PORTFÓLIO DE PRODUTOS
19.20.3 DESENVOLVIMENTO RECENTE
19.21 CLÍNICA DE TELEMEDICINA
19.21.1 RESUMO DA EMPRESA
19.21.2 PORTFÓLIO DE PRODUTOS
19.21.3 DESENVOLVIMENTOS RECENTES
19.22 USARAD.COM.
19.22.1 RESUMO DA EMPRESA
19.22.2 PORTFÓLIO DE PRODUTOS
19.22.3 DESENVOLVIMENTOS RECENTES
19.23 SERVIÇOS DE RADIOLOGIA VITAL
19.23.1 RESUMO DA EMPRESA
19.23.2 PORTFÓLIO DE PRODUTOS
19.23.3 DESENVOLVIMENTOS RECENTES
19.24 4 CAMINHOS
19.24.1 RESUMO DA EMPRESA
19.24.2 PORTFÓLIO DE PRODUTOS
19.24.3 DESENVOLVIMENTOS RECENTES
20 QUESTIONÁRIO
21 RELATÓRIOS RELACIONADOS
Lista de Tabela
TABELA 1 MERCADO DE TELERADIOLOGIA DA AMÉRICA DO NORTE, POR TIPO, 2020-2029 (US$ MILHÕES)
TABELA 2 SERVIÇOS NO MERCADO DE TELERADIOLOGIA DA AMÉRICA DO NORTE, POR REGIÃO, 2020-2029 (US$ MILHÕES)
TABELA 3 SERVIÇOS DE MERCADO DE TELERADIOLOGIA NA AMÉRICA DO NORTE, POR TIPO, 2020-2029 (US$ MILHÕES)
TABELA 4 AMÉRICA DO NORTE POR TIPO DE SERVIÇOS NO MERCADO DE TELERADIOLOGIA, POR TIPO, 2020-2029 (US$ MILHÕES)
TABELA 5 AMÉRICA DO NORTE POR SERVIÇOS DE PROCESSO NO MERCADO DE TELERADIOLOGIA, POR TIPO, 2020-2029 (US$ MILHÕES)
TABELA 6 MERCADO DE SOFTWARES DE TELERADIOLOGIA NA AMÉRICA DO NORTE, POR REGIÃO, 2020-2029 (US$ MILHÕES)
TABELA 7 MERCADO DE SOFTWARES DE TELERADIOLOGIA NA AMÉRICA DO NORTE, POR TIPO, 2020-2029 (US$ MILHÕES)
TABELA 8 AMÉRICA DO NORTE POR IMPLANTAÇÃO DE SOFTWARE NO MERCADO DE TELERADIOLOGIA, POR TIPO, 2020-2029 (US$ MILHÕES)
TABELA 9 AMÉRICA DO NORTE POR TIPO DE SOFTWARE NO MERCADO DE TELERADIOLOGIA, POR TIPO, 2020-2029 (US$ MILHÕES)
TABELA 10 SISTEMAS NORTE-AMERICANOS NO MERCADO DE TELERADIOLOGIA, POR REGIÃO, 2020-2029 (US$ MILHÕES)
TABELA 11 SISTEMAS NORTE-AMERICANOS NO MERCADO DE TELERADIOLOGIA, POR TIPO, 2020-2029 (US$ MILHÕES)
TABELA 12 TELECOMUNICAÇÕES E REDES NA AMÉRICA DO NORTE NO MERCADO DE TELERADIOLOGIA, POR REGIÃO, 2020-2029 (US$ MILHÕES)
TABELA 13 MERCADO DE TELECOMUNICAÇÕES E REDES NA AMÉRICA DO NORTE NO MERCADO DE TELERADIOLOGIA, POR TIPO, 2020-2029 (US$ MILHÕES)
TABELA 14 MERCADO DE HARDWARE DE TELERADIOLOGIA DA AMÉRICA DO NORTE, POR REGIÃO, 2020-2029 (US$ MILHÕES)
TABELA 15 MERCADO DE HARDWARE DE TELERADIOLOGIA DA AMÉRICA DO NORTE, POR TIPO, 2020-2029 (US$ MILHÕES)
TABELA 16 MERCADO DE TELERADIOLOGIA DA AMÉRICA DO NORTE, POR MODALIDADE DE ENTREGA, 2020-2029 (US$ MILHÕES)
TABELA 17 MODO DE ENTREGA BASEADO EM NUVEM NA AMÉRICA DO NORTE NO MERCADO DE TELERADIOLOGIA, POR REGIÃO, 2020-2029 (US$ MILHÕES)
TABELA 18 MODO DE ENTREGA PELA WEB NA AMÉRICA DO NORTE NO MERCADO DE TELERADIOLOGIA, POR REGIÃO, 2020-2029 (US$ MILHÕES)
TABELA 19 MODO DE ENTREGA NO LOCAL DA AMÉRICA DO NORTE NO MERCADO DE TELERADIOLOGIA, POR REGIÃO, 2020-2029 (US$ MILHÕES)
TABELA 20 MERCADO DE TELERADIOLOGIA DA AMÉRICA DO NORTE, POR TÉCNICA DE IMAGEM, 2020-2029 (US$ MILHÕES)
TABELA 21 TAMANHO DE PEQUENA MATRIZ NO MERCADO DE TELERADIOLOGIA NA AMÉRICA DO NORTE, POR REGIÃO, 2020-2029 (US$ MILHÕES)
TABELA 22 TAMANHO DE MATRIZ PEQUENA NA AMÉRICA DO NORTE NO MERCADO DE TELERADIOLOGIA, POR TÉCNICA DE IMAGEM, 2020-2029 (US$ MILHÕES)
TABELA 23 TAMANHO DA MATRIZ GRANDE NO MERCADO DE TELERADIOLOGIA NA AMÉRICA DO NORTE, POR REGIÃO, 2020-2029 (US$ MILHÕES)
TABELA 24 TAMANHO DE MATRIZ GRANDE NA AMÉRICA DO NORTE NO MERCADO DE TELERADIOLOGIA, POR TÉCNICA DE IMAGEM, 2020-2029 (US$ MILHÕES)
TABELA 25 MERCADO DE TELERADIOLOGIA DA AMÉRICA DO NORTE, POR TECNOLOGIA, 2020-2029 (US$ MILHÕES)
TABELA 26 PROCESSAMENTO GRÁFICO AVANÇADO NA AMÉRICA DO NORTE NO MERCADO DE TELERADIOLOGIA, POR REGIÃO, 2020-2029 (US$ MILHÕES)
TABELA 27 VOLUME DE RENDERIZAÇÃO NO MERCADO DE TELERADIOLOGIA DA AMÉRICA DO NORTE, POR REGIÃO, 2020-2029 (US$ MILHÕES)
TABELA 28 RECONSTRUÇÕES MULTIPLANARES NA AMÉRICA DO NORTE NO MERCADO DE TELERADIOLOGIA, POR REGIÃO, 2020-2029 (US$ MILHÕES)
TABELA 29 COMPRESSÃO DE IMAGENS NA AMÉRICA DO NORTE NO MERCADO DE TELERADIOLOGIA, POR REGIÃO, 2020-2029 (US$ MILHÕES)
TABELA 30 MERCADO DE TELERADIOLOGIA DA AMÉRICA DO NORTE, POR PROCEDIMENTO, 2020-2029 (US$ MILHÕES)
TABELA 31 MERCADO DE TELECONSULTA EM TELERADIOLOGIA NA AMÉRICA DO NORTE, POR REGIÃO, 2020-2029 (US$ MILHÕES)
TABELA 32 MERCADO DE TELEDIAGNÓSTICO EM TELERADIOLOGIA NA AMÉRICA DO NORTE, POR REGIÃO, 2020-2029 (US$ MILHÕES)
TABELA 33 MERCADO DE TELEMONITORAMENTO EM TELERADIOLOGIA NA AMÉRICA DO NORTE, POR REGIÃO, 2020-2029 (US$ MILHÕES)
TABELA 34 MERCADO DE TELERADIOLOGIA DA AMÉRICA DO NORTE, POR APLICAÇÃO, 2020-2029 (US$ MILHÕES)
TABELA 35 CARDIOLOGIA NA AMÉRICA DO NORTE NO MERCADO DE TELERADIOLOGIA, POR REGIÃO, 2020-2029 (US$ MILHÕES)
TABELA 36 CARDIOLOGIA NA AMÉRICA DO NORTE NO MERCADO DE TELERADIOLOGIA, POR APLICAÇÃO, 2020-2029 (US$ MILHÕES)
TABELA 37 MERCADO DE ONCOLOGIA NO TELERADIOLOGIA DA AMÉRICA DO NORTE, POR REGIÃO, 2020-2029 (US$ MILHÕES)
TABELA 38 ONCOLOGIA NORTE-AMERICANA NO MERCADO DE TELERADIOLOGIA, POR APLICAÇÃO, 2020-2029 (US$ MILHÕES)
TABELA 39 NEUROLOGIA NA AMÉRICA DO NORTE NO MERCADO DE TELERADIOLOGIA, POR REGIÃO, 2020-2029 (US$ MILHÕES)
TABELA 40 NEUROLOGIA NA AMÉRICA DO NORTE NO MERCADO DE TELERADIOLOGIA, POR APLICAÇÃO, 2020-2029 (US$ MILHÕES)
TABELA 41 MERCADO DE MÚSCULOESQUELÉTICO EM TELERADIOLOGIA NA AMÉRICA DO NORTE, POR REGIÃO, 2020-2029 (US$ MILHÕES)
TABELA 42 MERCADO DE MÚSCULOESQUELÉTICO EM TELERADIOLOGIA NA AMÉRICA DO NORTE, POR APLICAÇÃO, 2020-2029 (US$ MILHÕES)
TABELA 43 MERCADO DE GASTROENTEROLOGIA E TELERADIOLOGIA NA AMÉRICA DO NORTE, POR REGIÃO, 2020-2029 (US$ MILHÕES)
TABELA 44 MERCADO DE GASTROENTEROLOGIA EM TELERADIOLOGIA NA AMÉRICA DO NORTE, POR APLICAÇÃO, 2020-2029 (US$ MILHÕES)
TABELA 45 MERCADO DE TELERADIOLOGIA PÉLVICA E ABDOMINAL NA AMÉRICA DO NORTE, POR REGIÃO, 2020-2029 (US$ MILHÕES)
TABELA 46 MERCADO DE TELERADIOLOGIA PÉLVICA E ABDOMINAL NA AMÉRICA DO NORTE, POR APLICAÇÃO, 2020-2029 (US$ MILHÕES)
TABELA 47 GINECOLOGIA NORTE-AMERICANA NO MERCADO DE TELERADIOLOGIA, POR REGIÃO, 2020-2029 (US$ MILHÕES)
TABELA 48 GINECOLOGIA NORTE-AMERICANA NO MERCADO DE TELERADIOLOGIA, POR APLICAÇÃO, 2020-2029 (US$ MILHÕES)
TABELA 49 UROLOGIA NORTE-AMERICANA NO MERCADO DE TELERADIOLOGIA, POR REGIÃO, 2020-2029 (US$ MILHÕES)
TABELA 50 UROLOGIA NORTE-AMERICANA NO MERCADO DE TELERADIOLOGIA, POR APLICAÇÃO, 2020-2029 (US$ MILHÕES)
TABELA 51 MERCADO DE MAMOGRAFIA E TELERADIOLOGIA NA AMÉRICA DO NORTE, POR REGIÃO, 2020-2029 (US$ MILHÕES)
TABELA 52 MERCADO DE MAMOGRAFIA E TELERADIOLOGIA NA AMÉRICA DO NORTE, POR APLICAÇÃO, 2020-2029 (US$ MILHÕES)
TABELA 53 MERCADO DE TELERADIOLOGIA ODONTOLÓGICA NA AMÉRICA DO NORTE, POR REGIÃO, 2020-2029 (US$ MILHÕES)
TABELA 54 MERCADO DE TELERADIOLOGIA ODONTOLÓGICA NA AMÉRICA DO NORTE, POR APLICAÇÃO, 2020-2029 (US$ MILHÕES)
TABELA 55 AMÉRICA DO NORTE OUTROS NO MERCADO DE TELERADIOLOGIA, POR REGIÃO, 2020-2029 (US$ MILHÕES)
TABELA 56 MERCADO DE TELERADIOLOGIA DA AMÉRICA DO NORTE, POR LOCAL, 2020-2029 (US$ MILHÕES)
TABELA 57 MERCADO INTERNO DE TELERADIOLOGIA NA AMÉRICA DO NORTE, POR REGIÃO, 2020-2029 (US$ MILHÕES)
TABELA 58 MERCADO OFFSHORE DE TELERADIOLOGIA NA AMÉRICA DO NORTE, POR REGIÃO, 2020-2029 (US$ MILHÕES)
TABELA 59 AMÉRICA DO NORTE ONSHORE NO MERCADO DE TELERADIOLOGIA, POR REGIÃO, 2020-2029 (US$ MILHÕES)
TABELA 60 MERCADO DE TELERADIOLOGIA DA AMÉRICA DO NORTE, POR IDADE, 2020-2029 (US$ MILHÕES)
TABELA 61 MERCADO DE TELERADIOLOGIA PEDIÁTRICA NA AMÉRICA DO NORTE, POR REGIÃO, 2020-2029 (US$ MILHÕES)
TABELA 62 MERCADO DE ADULTOS NO MERCADO DE TELERADIOLOGIA DA AMÉRICA DO NORTE, POR REGIÃO, 2020-2029 (US$ MILHÕES)
TABELA 63 MERCADO DE GERIÁTRICA EM TELERADIOLOGIA DA AMÉRICA DO NORTE, POR REGIÃO, 2020-2029 (US$ MILHÕES)
TABELA 64 MERCADO DE TELERADIOLOGIA DA AMÉRICA DO NORTE, POR MODO DE COMPRA, 2020-2029 (US$ MILHÕES)
TABELA 65 COMPRAS DO GRUPO NORTE-AMERICANO NO MERCADO DE TELERADIOLOGIA, POR REGIÃO, 2020-2029 (US$ MILHÕES)
TABELA 66 COMPRA INDIVIDUAL NA AMÉRICA DO NORTE NO MERCADO DE TELERADIOLOGIA, POR REGIÃO, 2020-2029 (US$ MILHÕES)
TABELA 67 MERCADO DE TELERADIOLOGIA DA AMÉRICA DO NORTE, POR USUÁRIO FINAL, 2020-2029 (US$ MILHÕES)
TABELA 68 HOSPITAIS DA AMÉRICA DO NORTE NO MERCADO DE TELERADIOLOGIA, POR REGIÃO, 2020-2029 (US$ MILHÕES)
TABELA 69 HOSPITAIS DA AMÉRICA DO NORTE NO MERCADO DE TELERADIOLOGIA, POR USUÁRIO FINAL, 2020-2029 (US$ MILHÕES)
TABELA 70 CENTROS DE DIAGNÓSTICO POR IMAGEM DA AMÉRICA DO NORTE NO MERCADO DE TELERADIOLOGIA, POR REGIÃO, 2020-2029 (US$ MILHÕES)
TABELA 71 CENTROS CIRÚRGICOS AMBULATORIAIS DA AMÉRICA DO NORTE NO MERCADO DE TELERADIOLOGIA, POR REGIÃO, 2020-2029 (US$ MILHÕES)
TABELA 72 CONSULTÓRIOS MÉDICOS PRIVADOS NA AMÉRICA DO NORTE NO MERCADO DE TELERADIOLOGIA, POR REGIÃO, 2020-2029 (US$ MILHÕES)
TABELA 73 AMÉRICA DO NORTE OUTROS NO MERCADO DE TELERADIOLOGIA, POR REGIÃO, 2020-2029 (US$ MILHÕES)
TABELA 74 MERCADO DE TELERADIOLOGIA DA AMÉRICA DO NORTE, POR PAÍS, 2020-2029 (US$ MILHÕES)
TABELA 75 MERCADO DE TELERADIOLOGIA DA AMÉRICA DO NORTE, POR TIPO, 2020-2029 (US$ MILHÕES)
TABELA 76 SERVIÇOS NO MERCADO DE TELERADIOLOGIA DA AMÉRICA DO NORTE, POR TIPO, 2020-2029 (US$ MILHÕES)
TABELA 77 AMÉRICA DO NORTE POR TIPO DE SERVIÇOS NO MERCADO DE TELERADIOLOGIA, POR TIPO, 2020-2029 (US$ MILHÕES)
TABELA 78 AMÉRICA DO NORTE POR SERVIÇOS DE PROCESSO NO MERCADO DE TELERADIOLOGIA, POR TIPO, 2020-2029 (US$ MILHÕES)
TABELA 79 MERCADO DE SOFTWARES DE TELERADIOLOGIA NA AMÉRICA DO NORTE, POR TIPO, 2020-2029 (US$ MILHÕES)
TABELA 80 AMÉRICA DO NORTE POR IMPLANTAÇÃO DE SOFTWARE NO MERCADO DE TELERADIOLOGIA, POR TIPO, 2020-2029 (US$ MILHÕES)
TABELA 81 AMÉRICA DO NORTE POR TIPO DE SOFTWARE NO MERCADO DE TELERADIOLOGIA, POR TIPO, 2020-2029 (US$ MILHÕES)
TABELA 82 SISTEMAS DE MERCADO DE TELERADIOLOGIA NA AMÉRICA DO NORTE, POR TIPO, 2020-2029 (US$ MILHÕES)
TABELA 83 MERCADO DE TELECOMUNICAÇÕES E REDES NA AMÉRICA DO NORTE NO MERCADO DE TELERADIOLOGIA, POR TIPO, 2020-2029 (US$ MILHÕES)
TABELA 84 MERCADO DE HARDWARE DE TELERADIOLOGIA DA AMÉRICA DO NORTE, POR TIPO, 2020-2029 (US$ MILHÕES)
TABELA 85 MERCADO DE TELERADIOLOGIA DA AMÉRICA DO NORTE, POR MODALIDADE DE ENTREGA, 2020-2029 (US$ MILHÕES)
TABELA 86 MERCADO DE TELERADIOLOGIA DA AMÉRICA DO NORTE, POR TÉCNICA DE IMAGEM, 2020-2029 (US$ MILHÕES)
TABELA 87 TAMANHO DE MATRIZ PEQUENA NA AMÉRICA DO NORTE NO MERCADO DE TELERADIOLOGIA, POR TÉCNICA DE IMAGEM, 2020-2029 (US$ MILHÕES)
TABELA 88 TAMANHO DE MATRIZ GRANDE NA AMÉRICA DO NORTE NO MERCADO DE TELERADIOLOGIA, POR TÉCNICA DE IMAGEM, 2020-2029 (US$ MILHÕES)
TABELA 89 MERCADO DE TELERADIOLOGIA DA AMÉRICA DO NORTE, POR TECNOLOGIA, 2020-2029 (US$ MILHÕES)
TABELA 90 MERCADO DE TELERADIOLOGIA DA AMÉRICA DO NORTE, POR PROCEDIMENTO, 2020-2029 (US$ MILHÕES)
TABELA 91 MERCADO DE TELERADIOLOGIA DA AMÉRICA DO NORTE, POR APLICAÇÃO, 2020-2029 (US$ MILHÕES)
TABELA 92 CARDIOLOGIA NA AMÉRICA DO NORTE NO MERCADO DE TELERADIOLOGIA, POR APLICAÇÃO, 2020-2029 (US$ MILHÕES)
TABELA 93 MERCADO DE ONCOLOGIA NO NORTE DA AMÉRICA DO NORTE, POR APLICAÇÃO, 2020-2029 (US$ MILHÕES)
TABELA 94 NEUROLOGIA NORTE-AMERICANA NO MERCADO DE TELERADIOLOGIA, POR APLICAÇÃO, 2020-2029 (US$ MILHÕES)
TABELA 95 MERCADO DE MÚSCULOESQUELÉTICO EM TELERADIOLOGIA NA AMÉRICA DO NORTE, POR APLICAÇÃO, 2020-2029 (US$ MILHÕES)
TABELA 96 MERCADO DE GASTROENTEROLOGIA E TELERADIOLOGIA NA AMÉRICA DO NORTE, POR APLICAÇÃO, 2020-2029 (US$ MILHÕES)
TABELA 97 MERCADO DE TELERADIOLOGIA PÉLVICA E ABDOMINAL NA AMÉRICA DO NORTE, POR APLICAÇÃO, 2020-2029 (US$ MILHÕES)
TABELA 98 GINECOLOGIA NORTE-AMERICANA NO MERCADO DE TELERADIOLOGIA, POR APLICAÇÃO, 2020-2029 (US$ MILHÕES)
TABELA 99 UROLOGIA NORTE-AMERICANA NO MERCADO DE TELERADIOLOGIA, POR APLICAÇÃO, 2020-2029 (US$ MILHÕES)
TABELA 100 MERCADO DE MAMOGRAFIA E TELERADIOLOGIA NA AMÉRICA DO NORTE, POR APLICAÇÃO, 2020-2029 (US$ MILHÕES)
TABELA 101 MERCADO DE TELERADIOLOGIA ODONTOLÓGICA NA AMÉRICA DO NORTE, POR APLICAÇÃO, 2020-2029 (US$ MILHÕES)
TABELA 102 MERCADO DE TELERADIOLOGIA DA AMÉRICA DO NORTE, POR LOCAL, 2020-2029 (US$ MILHÕES)
TABELA 103 MERCADO DE TELERADIOLOGIA DA AMÉRICA DO NORTE, POR IDADE, 2020-2029 (US$ MILHÕES)
TABELA 104 MERCADO DE TELERADIOLOGIA DA AMÉRICA DO NORTE, POR MODO DE COMPRA, 2020-2029 (US$ MILHÕES)
TABELA 105 MERCADO DE TELERADIOLOGIA DA AMÉRICA DO NORTE, POR USUÁRIO FINAL, 2020-2029 (US$ MILHÕES)
TABELA 106 HOSPITAIS DA AMÉRICA DO NORTE NO MERCADO DE TELERADIOLOGIA, POR USUÁRIO FINAL, 2020-2029 (US$ MILHÕES)
TABELA 107 MERCADO DE TELERADIOLOGIA NOS EUA, POR TIPO, 2020-2029 (US$ MILHÕES)
TABELA 108 SERVIÇOS NOS EUA NO MERCADO DE TELERADIOLOGIA, POR TIPO, 2020-2029 (US$ MILHÕES)
TABELA 109 EUA POR TIPO DE SERVIÇOS NO MERCADO DE TELERADIOLOGIA, POR TIPO, 2020-2029 (US$ MILHÕES)
TABELA 110 SERVIÇOS DE PROCESSO NO MERCADO DE TELERADIOLOGIA NOS EUA, POR TIPO, 2020-2029 (US$ MILHÕES)
TABELA 111 SOFTWARE NO MERCADO DE TELERADIOLOGIA NOS EUA, POR TIPO, 2020-2029 (US$ MILHÕES)
TABELA 112 EUA POR IMPLANTAÇÃO DE SOFTWARE NO MERCADO DE TELERADIOLOGIA, POR TIPO, 2020-2029 (US$ MILHÕES)
TABELA 113 EUA POR TIPO DE SOFTWARE NO MERCADO DE TELERADIOLOGIA, POR TIPO, 2020-2029 (US$ MILHÕES)
TABELA 114 SISTEMAS NOS EUA NO MERCADO DE TELERADIOLOGIA, POR TIPO, 2020-2029 (US$ MILHÕES)
TABELA 115 TELECOMUNICAÇÕES E REDES NO MERCADO DE TELERADIOLOGIA DOS EUA, POR TIPO, 2020-2029 (US$ MILHÕES)
TABELA 116 MERCADO DE HARDWARE DE TELERADIOLOGIA NOS EUA, POR TIPO, 2020-2029 (US$ MILHÕES)
TABELA 117 MERCADO DE TELERADIOLOGIA DOS EUA, POR MODALIDADE DE ENTREGA, 2020-2029 (US$ MILHÕES)
TABELA 118 MERCADO DE TELERADIOLOGIA NOS EUA, POR TÉCNICA DE IMAGEM, 2020-2029 (US$ MILHÕES)
TABELA 119 TAMANHO PEQUENO DA MATRIZ NO MERCADO DE TELERADIOLOGIA NOS EUA, POR TÉCNICA DE IMAGEM, 2020-2029 (US$ MILHÕES)
TABELA 120 TAMANHO DE MATRIZ GRANDE NO MERCADO DE TELERADIOLOGIA NOS EUA, POR TÉCNICA DE IMAGEM, 2020-2029 (US$ MILHÕES)
TABELA 121 MERCADO DE TELERADIOLOGIA DOS EUA, POR TECNOLOGIA, 2020-2029 (US$ MILHÕES)
TABELA 122 MERCADO DE TELERADIOLOGIA NOS EUA, POR PROCEDIMENTO, 2020-2029 (US$ MILHÕES)
TABELA 123 MERCADO DE TELERADIOLOGIA NOS EUA, POR APLICAÇÃO, 2020-2029 (US$ MILHÕES)
TABELA 124 CARDIOLOGIA NOS EUA NO MERCADO DE TELERADIOLOGIA, POR APLICAÇÃO, 2020-2029 (US$ MILHÕES)
TABELA 125 MERCADO DE ONCOLOGIA EM TELERADIOLOGIA NOS EUA, POR APLICAÇÃO, 2020-2029 (US$ MILHÕES)
TABELA 126 NEUROLOGIA NOS EUA NO MERCADO DE TELERADIOLOGIA, POR APLICAÇÃO, 2020-2029 (US$ MILHÕES)
TABELA 127 MERCADO DE MÚSCULOESQUELÉTICO EM TELERADIOLOGIA NOS EUA, POR APLICAÇÃO, 2020-2029 (US$ MILHÕES)
TABELA 128 MERCADO DE GASTROENTEROLOGIA EM TELERADIOLOGIA NOS EUA, POR APLICAÇÃO, 2020-2029 (US$ MILHÕES)
TABELA 129 MERCADO DE TELERADIOLOGIA PÉLVICA E ABDOMINAL NOS EUA, POR APLICAÇÃO, 2020-2029 (US$ MILHÕES)
TABELA 130 GINECOLOGIA NOS EUA NO MERCADO DE TELERADIOLOGIA, POR APLICAÇÃO, 2020-2029 (US$ MILHÕES)
TABELA 131 UROLOGIA NOS EUA NO MERCADO DE TELERADIOLOGIA, POR APLICAÇÃO, 2020-2029 (US$ MILHÕES)
TABELA 132 MERCADO DE MAMOGRAFIA E TELERADIOLOGIA NOS EUA, POR APLICAÇÃO, 2020-2029 (US$ MILHÕES)
TABELA 133 MERCADO DE TELERADIOLOGIA ODONTOLÓGICA NOS EUA, POR APLICAÇÃO, 2020-2029 (US$ MILHÕES)
TABELA 134 MERCADO DE TELERADIOLOGIA NOS EUA, POR LOCAL, 2020-2029 (US$ MILHÕES)
TABELA 135 MERCADO DE TELERADIOLOGIA NOS EUA, POR IDADE, 2020-2029 (US$ MILHÕES)
TABELA 136 MERCADO DE TELERADIOLOGIA DOS EUA, POR MODO DE COMPRA, 2020-2029 (US$ MILHÕES)
TABELA 137 MERCADO DE TELERADIOLOGIA NOS EUA, POR USUÁRIO FINAL, 2020-2029 (US$ MILHÕES)
TABELA 138 HOSPITAIS NOS EUA NO MERCADO DE TELERADIOLOGIA, POR USUÁRIO FINAL, 2020-2029 (US$ MILHÕES)
TABELA 139 MERCADO DE TELERADIOLOGIA DO CANADÁ, POR TIPO, 2020-2029 (US$ MILHÕES)
TABELA 140 SERVIÇOS NO MERCADO DE TELERADIOLOGIA DO CANADÁ, POR TIPO, 2020-2029 (US$ MILHÕES)
TABELA 141 CANADÁ POR TIPO DE SERVIÇOS NO MERCADO DE TELERADIOLOGIA, POR TIPO, 2020-2029 (US$ MILHÕES)
TABELA 142 CANADÁ POR SERVIÇOS DE PROCESSO NO MERCADO DE TELERADIOLOGIA, POR TIPO, 2020-2029 (US$ MILHÕES)
TABELA 143 SOFTWARE NO MERCADO DE TELERADIOLOGIA DO CANADÁ, POR TIPO, 2020-2029 (US$ MILHÕES)
TABELA 144 CANADÁ POR IMPLANTAÇÃO DE SOFTWARE NO MERCADO DE TELERADIOLOGIA, POR TIPO, 2020-2029 (US$ MILHÕES)
TABELA 145 CANADÁ POR TIPO DE SOFTWARE NO MERCADO DE TELERADIOLOGIA, POR TIPO, 2020-2029 (US$ MILHÕES)
TABELA 146 SISTEMAS NO MERCADO DE TELERADIOLOGIA DO CANADÁ, POR TIPO, 2020-2029 (US$ MILHÕES)
TABELA 147 TELECOMUNICAÇÕES E REDES NO MERCADO DE TELERADIOLOGIA DO CANADÁ, POR TIPO, 2020-2029 (US$ MILHÕES)
TABELA 148 MERCADO DE HARDWARE DE TELERADIOLOGIA DO CANADÁ, POR TIPO, 2020-2029 (US$ MILHÕES)
TABELA 149 MERCADO DE TELERADIOLOGIA DO CANADÁ, POR MODALIDADE DE ENTREGA, 2020-2029 (US$ MILHÕES)
TABELA 150 MERCADO DE TELERADIOLOGIA DO CANADÁ, POR TÉCNICA DE IMAGEM, 2020-2029 (US$ MILHÕES)
TABELA 151 TAMANHO PEQUENO DA MATRIZ NO MERCADO DE TELERADIOLOGIA NO CANADÁ, POR TÉCNICA DE IMAGEM, 2020-2029 (US$ MILHÕES)
TABELA 152 TAMANHO DE MATRIZ GRANDE NO MERCADO DE TELERADIOLOGIA NO CANADÁ, POR TÉCNICA DE IMAGEM, 2020-2029 (US$ MILHÕES)
TABELA 153 MERCADO DE TELERADIOLOGIA DO CANADÁ, POR TECNOLOGIA, 2020-2029 (US$ MILHÕES)
TABELA 154 MERCADO DE TELERADIOLOGIA DO CANADÁ, POR PROCEDIMENTO, 2020-2029 (US$ MILHÕES)
TABELA 155 MERCADO DE TELERADIOLOGIA DO CANADÁ, POR APLICAÇÃO, 2020-2029 (US$ MILHÕES)
TABELA 156 CARDIOLOGIA NO MERCADO DE TELERADIOLOGIA DO CANADÁ, POR APLICAÇÃO, 2020-2029 (US$ MILHÕES)
TABELA 157 ONCOLOGIA NO MERCADO DE TELERADIOLOGIA DO CANADÁ, POR APLICAÇÃO, 2020-2029 (US$ MILHÕES)
TABELA 158 NEUROLOGIA NO MERCADO DE TELERADIOLOGIA DO CANADÁ, POR APLICAÇÃO, 2020-2029 (US$ MILHÕES)
TABELA 159 MERCADO CANADÁ DE MÚSCULOESQUELÉTICO EM TELERADIOLOGIA, POR APLICAÇÃO, 2020-2029 (US$ MILHÕES)
TABELA 160 MERCADO DE GASTROENTEROLOGIA NO CANADÁ EM TELERADIOLOGIA, POR APLICAÇÃO, 2020-2029 (US$ MILHÕES)
TABELA 161 MERCADO CANADÁ DE TELERADIOLOGIA PÉLVICA E ABDOMINAL, POR APLICAÇÃO, 2020-2029 (US$ MILHÕES)
TABELA 162 GINECOLOGIA NO MERCADO DE TELERADIOLOGIA DO CANADÁ, POR APLICAÇÃO, 2020-2029 (US$ MILHÕES)
TABELA 163 UROLOGIA NO MERCADO DE TELERADIOLOGIA DO CANADÁ, POR APLICAÇÃO, 2020-2029 (US$ MILHÕES)
TABELA 164 MERCADO DE MAMOGRAFIA NO CANADÁ EM TELERADIOLOGIA, POR APLICAÇÃO, 2020-2029 (US$ MILHÕES)
TABELA 165 MERCADO DE TELERADIOLOGIA ODONTOLÓGICA DO CANADÁ, POR APLICAÇÃO, 2020-2029 (US$ MILHÕES)
TABELA 166 MERCADO DE TELERADIOLOGIA DO CANADÁ, POR LOCAL, 2020-2029 (US$ MILHÕES)
TABELA 167 MERCADO DE TELERADIOLOGIA DO CANADÁ, POR IDADE, 2020-2029 (US$ MILHÕES)
TABELA 168 MERCADO DE TELERADIOLOGIA DO CANADÁ, POR MODO DE COMPRA, 2020-2029 (US$ MILHÕES)
TABELA 169 MERCADO DE TELERADIOLOGIA DO CANADÁ, POR USUÁRIO FINAL, 2020-2029 (US$ MILHÕES)
TABELA 170 HOSPITAIS CANADENSES NO MERCADO DE TELERADIOLOGIA, POR USUÁRIO FINAL, 2020-2029 (US$ MILHÕES)
TABELA 171 MERCADO DE TELERADIOLOGIA DO MÉXICO, POR TIPO, 2020-2029 (US$ MILHÕES)
TABELA 172 SERVIÇOS NO MERCADO DE TELERADIOLOGIA DO MÉXICO, POR TIPO, 2020-2029 (US$ MILHÕES)
TABELA 173 MÉXICO POR TIPO DE SERVIÇOS NO MERCADO DE TELERADIOLOGIA, POR TIPO, 2020-2029 (US$ MILHÕES)
TABELA 174 MÉXICO POR PROCESSO DE SERVIÇOS NO MERCADO DE TELERADIOLOGIA, POR TIPO, 2020-2029 (US$ MILHÕES)
TABELA 175 MERCADO DE SOFTWARES DE TELERADIOLOGIA NO MÉXICO, POR TIPO, 2020-2029 (US$ MILHÕES)
TABELA 176 MÉXICO POR IMPLANTAÇÃO DE SOFTWARE NO MERCADO DE TELERADIOLOGIA, POR TIPO, 2020-2029 (US$ MILHÕES)
TABELA 177 MÉXICO POR TIPO DE SOFTWARE NO MERCADO DE TELERADIOLOGIA, POR TIPO, 2020-2029 (US$ MILHÕES)
TABELA 178 SISTEMAS NO MERCADO DE TELERADIOLOGIA DO MÉXICO, POR TIPO, 2020-2029 (US$ MILHÕES)
TABELA 179 MÉXICO TELECOM & REDES NO MERCADO DE TELERADIOLOGIA, POR TIPO, 2020-2029 (US$ MILHÕES)
TABELA 180 HARDWARE NO MERCADO DE TELERADIOLOGIA DO MÉXICO, POR TIPO, 2020-2029 (US$ MILHÕES)
TABELA 181 MERCADO DE TELERADIOLOGIA DO MÉXICO, POR MODALIDADE DE ENTREGA, 2020-2029 (US$ MILHÕES)
TABELA 182 MERCADO DE TELERADIOLOGIA DO MÉXICO, POR TÉCNICA DE IMAGEM, 2020-2029 (US$ MILHÕES)
TABELA 183 MÉXICO TAMANHO PEQUENO DA MATRIZ NO MERCADO DE TELERADIOLOGIA, POR TÉCNICA DE IMAGEM, 2020-2029 (US$ MILHÕES)
TABELA 184 TAMANHO DA MATRIZ GRANDE NO MERCADO DE TELERADIOLOGIA NO MÉXICO, POR TÉCNICA DE IMAGEM, 2020-2029 (US$ MILHÕES)
TABELA 185 MERCADO DE TELERADIOLOGIA DO MÉXICO, POR TECNOLOGIA, 2020-2029 (US$ MILHÕES)
TABELA 186 MERCADO DE TELERADIOLOGIA DO MÉXICO, POR PROCEDIMENTO, 2020-2029 (US$ MILHÕES)
TABELA 187 MERCADO DE TELERADIOLOGIA DO MÉXICO, POR APLICAÇÃO, 2020-2029 (US$ MILHÕES)
TABELA 188 CARDIOLOGIA NO MERCADO DE TELERADIOLOGIA DO MÉXICO, POR APLICAÇÃO, 2020-2029 (US$ MILHÕES)
TABELA 189 MERCADO DE ONCOLOGIA NO MÉXICO EM TELERADIOLOGIA, POR APLICAÇÃO, 2020-2029 (US$ MILHÕES)
TABELA 190 NEUROLOGIA NO MERCADO DE TELERADIOLOGIA DO MÉXICO, POR APLICAÇÃO, 2020-2029 (US$ MILHÕES)
TABELA 191 MERCADO MUSCULOESQUELÉTICO EM TELERADIOLOGIA DO MÉXICO, POR APLICAÇÃO, 2020-2029 (US$ MILHÕES)
TABELA 192 MERCADO DE GASTROENTEROLOGIA NO MÉXICO EM TELERADIOLOGIA, POR APLICAÇÃO, 2020-2029 (US$ MILHÕES)
TABELA 193 MERCADO DE TELERADIOLOGIA PÉLVICA E ABDOMINAL NO MÉXICO, POR APLICAÇÃO, 2020-2029 (US$ MILHÕES)
TABELA 194 GINECOLOGIA NO MERCADO DE TELERADIOLOGIA DO MÉXICO, POR APLICAÇÃO, 2020-2029 (US$ MILHÕES)
TABELA 195 UROLOGIA NO MERCADO DE TELERADIOLOGIA NO MÉXICO, POR APLICAÇÃO, 2020-2029 (US$ MILHÕES)
TABELA 196 MERCADO DE MAMOGRAFIA NO MÉXICO EM TELERADIOLOGIA, POR APLICAÇÃO, 2020-2029 (US$ MILHÕES)
TABELA 197 MERCADO DE ODONTOLOGIA NO MÉXICO, POR APLICAÇÃO, 2020-2029 (US$ MILHÕES)
TABELA 198 MERCADO DE TELERADIOLOGIA DO MÉXICO, POR LOCAL, 2020-2029 (US$ MILHÕES)
TABELA 199 MERCADO DE TELERADIOLOGIA DO MÉXICO, POR IDADE, 2020-2029 (US$ MILHÕES)
TABELA 200 MERCADO DE TELERADIOLOGIA DO MÉXICO, POR MODALIDADE DE COMPRA, 2020-2029 (US$ MILHÕES)
TABELA 201 MERCADO DE TELERADIOLOGIA DO MÉXICO, POR USUÁRIO FINAL, 2020-2029 (US$ MILHÕES)
TABELA 202 HOSPITAIS DO MÉXICO NO MERCADO DE TELERADIOLOGIA, POR USUÁRIO FINAL, 2020-2029 (US$ MILHÕES)
Lista de Figura
FIGURA 1 MERCADO DE TELERADIOLOGIA DA AMÉRICA DO NORTE: SEGMENTAÇÃO
FIGURA 2 MERCADO DE TELERADIOLOGIA DA AMÉRICA DO NORTE: TRIANGULAÇÃO DE DADOS
FIGURA 3 MERCADO DE TELERADIOLOGIA DA AMÉRICA DO NORTE: ANÁLISE DROC
FIGURA 4 MERCADO DE TELERADIOLOGIA DA AMÉRICA DO NORTE: ANÁLISE DE MERCADO REGIONAL VS. PAÍS
FIGURA 5 MERCADO DE TELERADIOLOGIA DA AMÉRICA DO NORTE: ANÁLISE DE PESQUISA DA EMPRESA
FIGURA 6 MERCADO DE TELERADIOLOGIA DA AMÉRICA DO NORTE: DEMOGRAFIA DA ENTREVISTA
FIGURA 7 MERCADO DE TELERADIOLOGIA DA AMÉRICA DO NORTE: GRADE DE COBERTURA DE APLICAÇÃO DE MERCADO
FIGURA 8 MERCADO DE TELERADIOLOGIA DA AMÉRICA DO NORTE: GRADE DE POSIÇÃO DE MERCADO DE DBMR
FIGURA 9 MERCADO DE TELERADIOLOGIA DA AMÉRICA DO NORTE: ANÁLISE DA PARTICIPAÇÃO DE FORNECEDORES
FIGURA 10 MERCADO DE TELERADIOLOGIA DA AMÉRICA DO NORTE: SEGMENTAÇÃO
FIGURA 11 O CRESCENTE DA POPULAÇÃO GERIÁTRICA E O SUBSEQUENTE AUMENTO NA PREVALÊNCIA DE DOENÇAS ASSOCIADAS DEVEM IMPULSIONAR O MERCADO DE TELERADIOLOGIA DA AMÉRICA DO NORTE NO PERÍODO PREVISTO
FIGURA 12: ESPERA-SE QUE OS SERVIÇOS REPRESENTEM A MAIOR PARCIALIDADE DO MERCADO DE TELERADIOLOGIA DA AMÉRICA DO NORTE EM 2022 E 2029
FIGURA 13 MOTIVADORES, RESTRIÇÕES, OPORTUNIDADES E DESAFIOS DO MERCADO DE TELERADIOLOGIA DA AMÉRICA DO NORTE
FIGURA 14 MERCADO DE TELERADIOLOGIA DA AMÉRICA DO NORTE: POR TIPO, 2021
FIGURA 15 MERCADO DE TELERADIOLOGIA DA AMÉRICA DO NORTE: POR TIPO, 2020-2029 (US$ MILHÕES)
FIGURA 16 MERCADO DE TELERADIOLOGIA DA AMÉRICA DO NORTE: POR TIPO, CAGR (2022-2029)
FIGURA 17 MERCADO DE TELERADIOLOGIA DA AMÉRICA DO NORTE: POR TIPO, CURVA DE LINHA DE SALVAÇÃO
FIGURA 18 MERCADO DE TELERADIOLOGIA DA AMÉRICA DO NORTE: POR MODALIDADE DE ENTREGA, 2021
FIGURA 19 MERCADO DE TELERADIOLOGIA DA AMÉRICA DO NORTE: POR MODALIDADE DE ENTREGA, 2020-2029 (US$ MILHÕES)
FIGURA 20 MERCADO DE TELERADIOLOGIA DA AMÉRICA DO NORTE: POR MODALIDADE DE ENTREGA, CAGR (2022-2029)
FIGURA 21 MERCADO DE TELERADIOLOGIA DA AMÉRICA DO NORTE: POR MODALIDADE DE ENTREGA, CURVA DE LINHA DE VIDA
FIGURA 22 MERCADO DE TELERADIOLOGIA DA AMÉRICA DO NORTE: POR TÉCNICA DE IMAGEM, 2021
FIGURA 23 MERCADO DE TELERADIOLOGIA DA AMÉRICA DO NORTE: POR TÉCNICA DE IMAGEM, 2020-2029 (US$ MILHÕES)
FIGURA 24 MERCADO DE TELERADIOLOGIA DA AMÉRICA DO NORTE: POR TÉCNICA DE IMAGEM, CAGR (2022-2029)
FIGURA 25 MERCADO DE TELERADIOLOGIA DA AMÉRICA DO NORTE: POR TÉCNICA DE IMAGEM, CURVA DA LINHA DE VIDA
FIGURA 26 MERCADO DE TELERADIOLOGIA DA AMÉRICA DO NORTE: POR TECNOLOGIA, 2021
FIGURA 27 MERCADO DE TELERADIOLOGIA DA AMÉRICA DO NORTE: POR TECNOLOGIA, 2020-2029 (US$ MILHÕES)
FIGURA 28 MERCADO DE TELERADIOLOGIA DA AMÉRICA DO NORTE: POR TECNOLOGIA, CAGR (2022-2029)
FIGURA 29 MERCADO DE TELERADIOLOGIA DA AMÉRICA DO NORTE: POR TECNOLOGIA, CURVA DA LINHA DE SALVAÇÃO
FIGURA 30 MERCADO DE TELERADIOLOGIA DA AMÉRICA DO NORTE: POR PROCEDIMENTO, 2021
FIGURA 31 MERCADO DE TELERADIOLOGIA DA AMÉRICA DO NORTE: POR PROCEDIMENTO, 2020-2029 (US$ MILHÕES)
FIGURA 32 MERCADO DE TELERADIOLOGIA DA AMÉRICA DO NORTE: POR PROCEDIMENTO, CAGR (2022-2029)
FIGURA 33 MERCADO DE TELERADIOLOGIA DA AMÉRICA DO NORTE: POR PROCEDIMENTO, CURVA DA LINHA DE SALVAÇÃO
FIGURA 34 MERCADO DE TELERADIOLOGIA DA AMÉRICA DO NORTE: POR APLICAÇÃO, 2021
FIGURA 35 MERCADO DE TELERADIOLOGIA DA AMÉRICA DO NORTE: POR APLICAÇÃO, 2020-2029 (US$ MILHÕES)
FIGURA 36 MERCADO DE TELERADIOLOGIA DA AMÉRICA DO NORTE: POR APLICAÇÃO, CAGR (2022-2029)
FIGURA 37 MERCADO DE TELERADIOLOGIA DA AMÉRICA DO NORTE: POR APLICAÇÃO, CURVA DA LINHA DE SALVAÇÃO
FIGURA 38 MERCADO DE TELERADIOLOGIA DA AMÉRICA DO NORTE: POR LOCAL, 2021
FIGURA 39 MERCADO DE TELERADIOLOGIA DA AMÉRICA DO NORTE: POR LOCAL, 2020-2029 (US$ MILHÕES)
FIGURA 40 MERCADO DE TELERADIOLOGIA DA AMÉRICA DO NORTE: POR LOCAL, CAGR (2022-2029)
FIGURA 41 MERCADO DE TELERADIOLOGIA DA AMÉRICA DO NORTE: POR LOCAL, CURVA DA LINHA DE SALVAÇÃO
FIGURA 42 MERCADO DE TELERADIOLOGIA DA AMÉRICA DO NORTE: POR IDADE, 2021
FIGURA 43 MERCADO DE TELERADIOLOGIA DA AMÉRICA DO NORTE: POR IDADE, 2022-2029 (US$ MILHÕES)
FIGURA 44 MERCADO DE TELERADIOLOGIA DA AMÉRICA DO NORTE: POR IDADE, CAGR (2022-2029)
FIGURA 45 MERCADO DE TELERADIOLOGIA DA AMÉRICA DO NORTE: POR IDADE, CURVA DA LINHA DE VIDA
FIGURA 46 MERCADO DE TELERADIOLOGIA DA AMÉRICA DO NORTE: POR MODO DE COMPRA, 2021
FIGURA 47 MERCADO DE TELERADIOLOGIA DA AMÉRICA DO NORTE: POR MODO DE COMPRA, 2020-2029 (US$ MILHÕES)
FIGURA 48 MERCADO DE TELERADIOLOGIA DA AMÉRICA DO NORTE: POR MODALIDADE DE COMPRA, CAGR (2022-2029)
FIGURA 49 MERCADO DE TELERADIOLOGIA DA AMÉRICA DO NORTE: POR MODO DE COMPRA, CURVA DA LINHA DE SALVAÇÃO
FIGURA 50 MERCADO DE TELERADIOLOGIA DA AMÉRICA DO NORTE: POR USUÁRIO FINAL, 2021
FIGURA 51 MERCADO DE TELERADIOLOGIA DA AMÉRICA DO NORTE: POR USUÁRIO FINAL, 2022-2029 (US$ MILHÕES)
FIGURA 52 MERCADO DE TELERADIOLOGIA DA AMÉRICA DO NORTE: POR USUÁRIO FINAL, CAGR (2022-2029)
FIGURA 53 MERCADO DE TELERADIOLOGIA DA AMÉRICA DO NORTE: POR USUÁRIO FINAL, CURVA DE LINHA DE SALVAÇÃO
FIGURA 54 MERCADO DE TELERADIOLOGIA DA AMÉRICA DO NORTE: RESUMO (2021)
FIGURA 55 MERCADO DE TELERADIOLOGIA DA AMÉRICA DO NORTE: POR PAÍS (2021)
FIGURA 56 MERCADO DE TELERADIOLOGIA DA AMÉRICA DO NORTE: POR PAÍS (2022 E 2029)
FIGURA 57 MERCADO DE TELERADIOLOGIA DA AMÉRICA DO NORTE: POR PAÍS (2021 E 2029)
FIGURA 58 MERCADO DE TELERADIOLOGIA DA AMÉRICA DO NORTE: POR TIPO (2022-2029)
FIGURA 59 MERCADO DE TELERADIOLOGIA DA AMÉRICA DO NORTE: PARTICIPAÇÃO DA EMPRESA 2021 (%)
Metodologia de Investigação
A recolha de dados e a análise do ano base são feitas através de módulos de recolha de dados com amostras grandes. A etapa inclui a obtenção de informações de mercado ou dados relacionados através de diversas fontes e estratégias. Inclui examinar e planear antecipadamente todos os dados adquiridos no passado. Da mesma forma, envolve o exame de inconsistências de informação observadas em diferentes fontes de informação. Os dados de mercado são analisados e estimados utilizando modelos estatísticos e coerentes de mercado. Além disso, a análise da quota de mercado e a análise das principais tendências são os principais fatores de sucesso no relatório de mercado. Para saber mais, solicite uma chamada de analista ou abra a sua consulta.
A principal metodologia de investigação utilizada pela equipa de investigação do DBMR é a triangulação de dados que envolve a mineração de dados, a análise do impacto das variáveis de dados no mercado e a validação primária (especialista do setor). Os modelos de dados incluem grelha de posicionamento de fornecedores, análise da linha de tempo do mercado, visão geral e guia de mercado, grelha de posicionamento da empresa, análise de patentes, análise de preços, análise da quota de mercado da empresa, normas de medição, análise global versus regional e de participação dos fornecedores. Para saber mais sobre a metodologia de investigação, faça uma consulta para falar com os nossos especialistas do setor.
Personalização disponível
A Data Bridge Market Research é líder em investigação formativa avançada. Orgulhamo-nos de servir os nossos clientes novos e existentes com dados e análises que correspondem e atendem aos seus objetivos. O relatório pode ser personalizado para incluir análise de tendências de preços de marcas-alvo, compreensão do mercado para países adicionais (solicite a lista de países), dados de resultados de ensaios clínicos, revisão de literatura, mercado remodelado e análise de base de produtos . A análise de mercado dos concorrentes-alvo pode ser analisada desde análises baseadas em tecnologia até estratégias de carteira de mercado. Podemos adicionar quantos concorrentes necessitar de dados no formato e estilo de dados que procura. A nossa equipa de analistas também pode fornecer dados em tabelas dinâmicas de ficheiros Excel em bruto (livro de factos) ou pode ajudá-lo a criar apresentações a partir dos conjuntos de dados disponíveis no relatório.

