



Asia-Pacific Mobility as a Service Market, By Service Type (Car Sharing, Bus Sharing, Train, Ride Hailing, Bi-Cycle Sharing, Self-Driving Cars and Others), Solution (Navigation Solutions, Ticketing Solutions, Technology Platforms, Insurance Services, Telecom Connectivity Providers and Payment Engines), Transportation Type (Public and Private), Vehicle Type (Four Wheelers, Bus, Train and Micro Mobility), Application Platform (IOS, Android and Others), Requirement Type (First and Last Mile Connectivity, Off-Peak and Shift Work Commute, Daily Commuter, Airport or Mass Transit Stations Trips, Inter-City Trips and Others), Organization Size (Large Enterprises and Small and Medium Size Enterprises (SMES)), Usage (Commercial and Personal), Country (China, India, South Korea, Australia, Japan, Singapore, Malaysia, Thailand, Indonesia, Philippines and Rest of Asia-Pacific) Industry Trends and Forecast to 2028
Market Analysis and Insights: Asia-Pacific Mobility as a Service Market
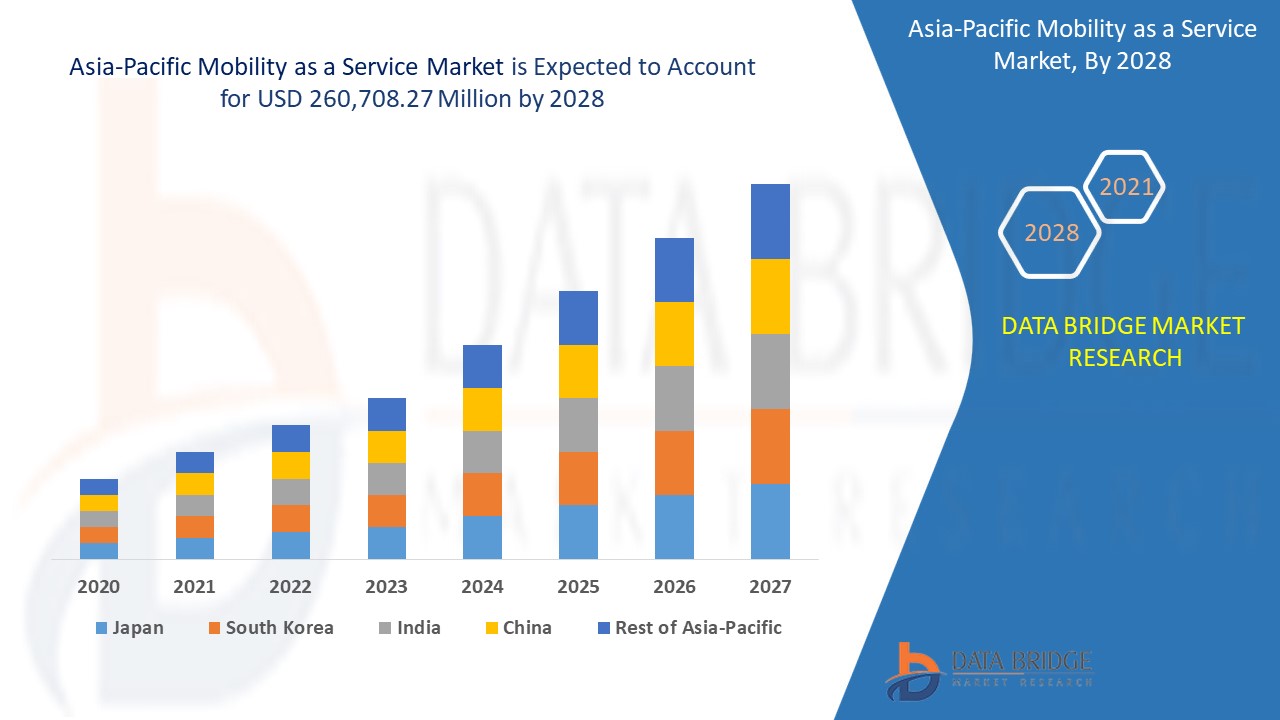
Asia-Pacific mobility as a service market is expected to gain market growth in the forecast period of 2021 to 2028. Data Bridge Market Research analyses that the market is growing with the CAGR of 33.7% in the forecast period of 2021 to 2028 and expected to reach USD 260,708.27 million by 2028. Increasing population and urbanization with need of reducing CO2 emission and traffic congestion is driving growth of the market.
Mobility as a service is a consumer-centric model for providing transportation for people. Mobility as a service is also known as MaaS and sometimes referred to as transportation as a service (TaaS). Mobility as a service is the integration of transport methods such as car and bike sharing, taxis and car rentals/leases through digital channels which enables consumers to plan, book and pay for multiple types of mobility services. The main concept of developing MaaS is to offer travellers mobility solutions based on their travel needs.
The rising urbanization and smart city initiatives are driving the mobility as a service market growth with increased demand for advanced products having enhanced connectivity and performance. The market players have to meet the regulatory standards of each country in which they are selling their products which is limiting the mobility as a service market growth. The growth of electric vehicles for comfortable and clean transport at a lower cost is creating opportunity for the mobility as a service market. The low awareness of the lifetime cost of private vehicles and service ownership is going to be a major challenge for the mobility as a service market.
This mobility as a service market report provides details of market share, new developments, and product pipeline analysis, impact of domestic and localised market players, analyses opportunities in terms of emerging revenue pockets, changes in market regulations, product approvals, strategic decisions, product launches, geographical expansions, and technological innovations in the market. To understand the analysis and the market scenario contact us for an Analyst Brief, our team will help you create a revenue impact solution to achieve your desired goal.

Mobility as a Service Market Scope and Market Size
The mobility as a service market is segmented on the basis of service type, solution, transportation type, vehicle type, application platform, requirement type, organization size and usage. The growth among segments helps you analyse niche pockets of growth and strategies to approach the market and determine your core application areas and the difference in your target markets.
- On the basis of service type, the mobility as a service market is segmented into car sharing, bus sharing, train, ride hailing, bi-cycle sharing, self-driving cars and others. In 2021, ride hailing segment held larger share in the mobility as a service market due to the growing option for booking and comfort which has raise the demand for rail hailing services.
- On the basis of solution, the mobility as a service market is segmented into navigation solutions, ticketing solutions, technology platforms, insurance services, telecom connectivity providers and payment engines. In 2021, navigation solutions category has accounted for maximum market size due to growing importance of passenger safety and growing concern for minimizing travelling time has increase the demand for navigation solutions.
- On the basis of transportation type, the mobility as a service market is segmented into public and private. In 2021, public category has accounted for maximum market size due to rising vehicle traffic which has increase the demand for mobility services.
- On the basis of vehicle type, the mobility as a service market is segmented into four wheelers, bus, train and micro mobility. In 2021, four wheelers segment held the largest share in the market which is mainly attributed to rising investment in the transportation infrastructure which has fuel the demand for mobility services.
- On the basis of application platform, the mobility as a service market is segmented into IOS, android and others. In 2021, android category has accounted for maximum market size owing to rising internet penetration and growing usage of mobile in the developing economies which has resulted in increasing demand for mobility services for the android application.
- On the basis of requirement type, the mobility as a service market is segmented into first and last mile connectivity, off-peak and shift work commute, daily commuter, airport or mass transit stations trips, inter-city trips and others. In 2021, inter-city trips category held larger market share owing to the rising vehicle traffic which has increase the demand for mobility services.
- On the basis of organization size, the mobility as a service market is segmented into large enterprises and small and medium size enterprises (SMES). In 2021, large enterprises segment held larger market share owing to the growing investment from the various tech-giants in the car sharing and transportation infrastructure which are making their presence in the transportation industry.
- On the basis of usage, the mobility as a service market is segmented into commercial and personal. In 2021, commercial category held larger market share owing to the growing need for safe, effective and cost friendly transportation option of goods and materials.
Mobility as a Service Market Country Level Analysis
Mobility as a service market is analysed and market size information is provided by the country, service type, solution, transportation type, vehicle type, application platform, requirement type, organization size and usage as referenced above.
The countries covered in the global mobility as a service market report are China, India, Japan, South Korea, Australia, Singapore, Thailand, Indonesia, Malaysia, Philippines, and Rest of Asia-Pacific.
China is dominating the Asia-Pacific mobility as a service market and is expected to grow with highest CAGR during the forecast period followed by Japan and India due to rising of population and urbanization in the developing countries which is contributing to the growth of MaaS market in these countries. Also, the emergence of reducing vehicle emission and traffic congestion across the region is boosting the Asia-Pacific mobility as a service market.
The country section of the mobility as a service market report also provides individual market impacting factors and changes in regulation in the market domestically that impacts the current and future trends of the market. Data points such as new sales, replacement sales, country demographics, regulatory acts and import-export tariffs are some of the major pointers used to forecast the market scenario for individual countries. Also, presence and availability of Asia-Pacific brands and their challenges faced due to large or scarce competition from local and domestic brands, impact of sales channels are considered while providing forecast analysis of the country data.
Growing Number of Original Equipment Manufacturers (OEMs)
Mobility as a service market also provides you with detailed market analysis for every country growth in installed base of different kind of products for mobility as a service market, impact of technology using life line curves and changes regulatory scenarios and their impact on the mobility as a service market. The data is available for historic period 2010 to 2018.
Competitive Landscape and Mobility as a Service Market Share Analysis
Mobility as a service market competitive landscape provides details by competitor. Details included are company overview, company financials, revenue generated, market potential, investment in research and development, new market initiatives, Asia-Pacific presence, production sites and facilities, company strengths and weaknesses, product launch, clinical trials pipelines, brand analysis, product approvals, patents, product width and breadth, application dominance, technology lifeline curve. The above data points provided are only related to the companies’ focus related to Asia-Pacific mobility as a service market.
The major players covered in the mobility as a service market report are Moovit Inc. (a subsidiary of Intel Corporation), UbiGo Innovation AB, MaaS Global Oy, SkedGo Pty Ltd, Beijing Xiaoju Technology Co, Ltd., Uber Technologies, Inc., EasyMile, Ridecell, Inc., Bolt Technology OÜ, Citymapper Limited, Cubic Corporation, innovation in traffic systems SE, BRIDJ Pty Ltd, ANI Technologies Pvt. Ltd., Splyt Technologies Ltd. and BlaBlaCar among others. DBMR analysts understand competitive strengths and provide competitive analysis for each competitor separately.
For instance,
- In November 2020, Beijing Xiaoju Technology Co, Ltd. launched first electric vehicle custom-built for ride-hailing named as D1. This D1 is developed for major Chinese cities. D1 is the development of autonomous driving and AI technology. Through this product launch, the company is able to provide a better travel experience through shared mobility.
- In November 2020, Uber Technologies, Inc. launched E-rickshaws for first and last mile connectivity. These E-rickshaws will be available across 26 stations on Delhi Metro’s blue line In India. This product offers riders mobility solutions for better connectivity. Through this, the company is able to enhance their product portfolio in the market.
Product launch, acquisition and other strategies enhances the company market share with increased coverage and presence. It also provides the benefit for organisation to improve their offering for mobility as a service through product portfolio of the companies.
SKU-

目录
1 引言
1.1 研究目標
1.2 市場定義
1.3 亞太地區出行即服務市場概況
1.4 貨幣和定價
1.5 限制
1.6 覆蓋市場
2 市場區隔
2.1 覆蓋市場
2.2 地理範圍
研究需時 2.3 年
2.4 DBMR三腳架資料驗證模型
2.5 與關鍵意見領袖的初步訪談
2.6 DBMR 市場地位網格
2.7 市場應用平台覆蓋網格
2.8 供應商份額分析
2.9 多變量建模
2.1 服務類型時間軸曲線
2.11 第二手資料
2.12 假設
3 執行摘要
4 項優質見解
MAAS平台的5大技術趨勢(NFC/RFID)
6 供應鏈
6.1 平台提供商
6.2 交通系統
6.3 產品和服務
6.4 政府法律
6.5 客戶
7 商業模式
7.1 企業對企業
7.2 企業對產業
7.3 企業對政府
7.4 企業對客戶
8 種交通支付解決方案
8.1 非現金支付
8.2 行動支付
8.3 預付費解決方案
9 市場概覽
9.1 驅動程式
9.1.1 智慧城市計畫不斷推進,都市化程度不斷提高
9.1.2 網路普及率和行動裝置不斷上升
9.1.3 原始設備製造商(OEM)數量的成長
9.1.4 消費者對一站式解決方案的需求不斷成長
9.1.5 政府對排放控制的嚴格規定
9.2 限制
9.2.1 國際市場監理差異
9.2.2 交通擁堵與基礎建設
9.2.3 已開發經濟體缺乏意識
9.3 機遇
9.3.1 自動駕駛汽車的使用率不斷提高
9.3.2 用戶線上支付方式的興起
9.3.3 電動車的成長,以更低的成本提供舒適、乾淨的交通
9.3.4 將大數據與新型自動運輸系統結合
9.4 挑戰
9.4.1 對私家車和服務擁有終身成本的認知度較低
9.4.2 發展中國家的連結性問題
10 新冠疫情對亞太地區出行即服務市場的影響
10.1 新冠疫情對市場影響分析
10.2 新冠疫情的後果和政府刺激市場的舉措
10.3 新冠疫情後製造商取得競爭性市佔率的策略決策
10.4 價格影響
10.5 對需求和供應鏈的影響
10.6 結論
11 亞太地區行動旅遊服務市場(依服務劃分)
11.1 概述
11.2 叫車
11.3 汽車共享
11.4 公車共享
11.5 自行車共享
11.6 自動駕駛汽車
11.7 火車
11.8 其他
12 亞太地區行動旅遊服務市場(依解決方案)
12.1 概述
12.2 導航解決方案
12.3 支付引擎
12.4 保險服務
12.5 票務解決方案
12.6 技術平台
12.7 電信連線供應商
13 亞太地區移動旅遊服務市場(依交通類型劃分)
13.1 概述
13.2 公眾
13.3 私人
14 亞太地區移動出行服務市場(依車輛類型劃分)
14.1 概述
14.2 四輪車
14.3 總線
14.4 火車
14.5 微型移動出行
15 亞太地區移動即服務市場(依需求類型劃分)
15.1 概述
15.2 城際旅行
15.3 機場或大眾運輸站行程
15.4 第一英里和最後一英里的連接
15.5 非尖峰時段和輪班通勤
15.6 每日通勤
15.7 其他
16 亞太地區移動即服務市場(依組織規模)
16.1 概述
16.2 大型組織
16.3 中小型組織
17 亞太地區移動即服務市場(依用途劃分)
17.1 概述
17.2 商業
17.3 個人
18 亞太地區行動旅遊服務市場(按應用)
18.1 概述
18.2 安卓
18.3 iOS
18.4 其他
19 亞太地區移動即服務 (MAAS) 市場(按地區劃分)
19.1 亞太地區
19.1.1 中國
19.1.2 日本
19.1.3 印度
19.1.4 韓國
19.1.5 澳大利亞
19.1.6 新加坡
19.1.7 印度尼西亞
19.1.8 泰國
19.1.9 馬來西亞
19.1.10 菲律賓
19.1.11 亞太其他地區
20 亞太地區出行即服務市場:公司格局
20.1 公司份額分析:亞太地區
21 強弱機理分析
22家公司簡介
22.1 北京小炬科技有限公司
22.1.1 公司概況
22.1.2 服務組合
22.1.3 近期發展
22.2 優步科技公司
22.2.1 公司概況
22.2.2 收入分析
22.2.3 公司股份分析
22.2.4 產品組合
22.2.5 近期發展
22.3 LYFT 公司
22.3.1 公司概況
22.3.2 收入分析
22.3.3 公司股份分析
22.3.4 產品組合
22.3.5 近期發展
22.4 ANI TECHNOLOGIES PVT.有限公司
22.4.1 公司概況
22.4.2 公司股份分析
22.4.3 服務組合
22.4.4 最近的發展
22.5 布拉布拉卡
22.5.1 公司概況
22.5.2 產品組合
22.5.3 最近的發展
22.6 博爾特技術公司
22.6.1 公司概況
22.6.2 公司股份分析
22.6.3 產品組合
22.6.4 最近的發展
22.7 BRIDJ 有限公司
22.7.1 公司概況
22.7.2 解決方案組合
22.7.3 最近的發展
22.8 CITYMAPPER有限公司
22.8.1 公司概況
22.8.2 解決方案組合
22.8.3 最近的發展
22.9 通信汽車
22.9.1 公司概況
22.9.2 服務組合
22.9.3 最近的發展
22.1 立方公司
22.10.1 公司概況
22.10.2 收入分析
22.10.3 公司股份分析
22.10.4 解決方案組合
22.10.5 近期發展
22.11 路緣機動性
22.11.1 公司概況
22.11.2 產品組合
22.11.3 近期發展
22.12 易邁
22.12.1 公司概況
22.12.2 解決方案組合
22.12.3 最近的發展
22.13 蓋特
22.13.1 公司概況
22.13.2 公司股份分析
22.13.3 產品組合
22.13.4 近期發展
22.14 綠線科技公司
22.14.1 公司概況
22.14.2 產品組合
22.14.3 最近的發展
22.15 交通系統創新 SE
22.15.1 公司概況
22.15.2 收入分析
22.15.3 解決方案組合
22.15.4 最近的發展
22.16 MAAS亞太有限公司
22.16.1 公司概況
22.16.2 服務組合
22.16.3 近期發展
22.17 MAXI MOBILITY SL
22.17.1 公司概況
22.17.2 產品組合
22.17.3 近期發展
22.18 移動
22.18.1 公司概況
22.18.2 解決方案組合
22.18.3 最近的發展
22.19 MOOVEL GROUP GMBH(戴姆勒股份公司子公司)
22.19.1 公司概況
22.19.2 收入分析
22.19.3 產品組合
22.19.4 近期發展
22.2 MOOVIT INC.(英特爾公司的子公司)
22.20.1 公司概況
22.20.2 收入分析
22.20.3 解決方案組合
22.20.4 近期發展
22.21 MOTIONTAG有限公司
22.21.1 公司概況
22.21.2 解決方案組合
22.21.3 近期發展
22.22 RIDECELL公司
22.22.1 公司概況
22.22.2 解決方案組合
22.22.3 近期發展
22.23 SKEDGO有限公司
22.23.1 公司概況
22.23.2 技術組合
22.23.3 最近的發展
22.24 SPLYT科技有限公司
22.24.1 公司概況
22.24.2 產品組合
22.24.3 近期發展
22.25 UBIGO創新公司
22.25.1 公司概況
22.25.2 服務組合
22.25.3 近期發展
22.26 維洛西亞
22.26.1 公司概況
22.26.2 產品組合
22.26.3 最近的發展
22.27 Zoox, Inc.(AMAZON.COM, Inc. 的子公司)
22.27.1 公司概況
22.27.2 收入分析
22.27.3 產品組合
22.27.4 最近的發展
23 問卷
24份相關報告
表格列表
LIST OF TABLES
TABLE 1 ASIA-PACIFIC MOBILITY AS A SERVICE MARKET, BY SERVICE, 2019-2028 (USD MILLION)
TABLE 2 ASIA-PACIFIC RIDE HAILING IN MOBILITY AS A SERVICE MARKET, BY REGION,2019-2028, (USD MILLION)
TABLE 3 ASIA-PACIFIC CAR SHARING IN MOBILITY AS A SERVICE MARKET, BY REGION,2019-2028, (USD MILLION)
TABLE 4 ASIA-PACIFIC BUS SHARING IN MOBILITY AS A SERVICE MARKET, BY REGION,2019-2028, (USD MILLION)
TABLE 5 ASIA-PACIFIC BI-CYCLE SHARING IN MOBILITY AS A SERVICE MARKET, BY REGION,2019-2028, (USD MILLION)
TABLE 6 ASIA-PACIFIC SELF-DRIVING CARS IN MOBILITY AS A SERVICE MARKET, BY REGION,2019-2028, (USD MILLION)
TABLE 7 ASIA-PACIFIC TRAIN IN MOBILITY AS A SERVICE MARKET, BY REGION,2019-2028, (USD MILLION)
TABLE 8 ASIA-PACIFIC OTHERS IN MOBILITY AS A SERVICE MARKET, BY REGION,2019-2028, (USD MILLION)
TABLE 9 ASIA-PACIFIC MOBILITY AS A SERVICE MARKET, BY SOLUTIONS, 2019-2028 (USD MILLION)
TABLE 10 ASIA-PACIFIC NAVIGATION SOLUTIONS IN MOBILITY AS A SERVICE MARKET, BY REGION,2019-2028, (USD MILLION)
TABLE 11 ASIA-PACIFIC PAYMENT ENGINES IN MOBILITY AS A SERVICE MARKET, BY REGION,2019-2028, (USD MILLION)
TABLE 12 ASIA-PACIFIC INSURANCE SERVICES IN MOBILITY AS A SERVICE MARKET, BY REGION,2019-2028, (USD MILLION)
TABLE 13 ASIA-PACIFIC TICKETING SOLUTIONS IN MOBILITY AS A SERVICE MARKET, BY REGION,2019-2028, (USD MILLION)
TABLE 14 ASIA-PACIFIC TECHNOLOGY PLATFORMS IN MOBILITY AS A SERVICE MARKET, BY REGION,2019-2028, (USD MILLION)
TABLE 15 ASIA-PACIFIC TELECOM CONNECTIVITY PROVIDER IN MOBILITY AS A SERVICE MARKET, BY REGION,2019-2028, (USD MILLION)
TABLE 16 ASIA-PACIFIC MOBILITY AS A SERVICE MARKET, BY TRANSPORTATION TYPE, 2019-2028 (USD MILLION)
TABLE 17 ASIA-PACIFIC PUBLIC IN MOBILITY AS A SERVICE MARKET, BY REGION,2019-2028, (USD MILLION)
TABLE 18 ASIA-PACIFIC PRIVATE IN MOBILITY AS A SERVICE MARKET, BY REGION,2019-2028, (USD MILLION)
TABLE 19 ASIA-PACIFIC MOBILITY AS A SERVICE MARKET, BY VEHICLE TYPE, 2019-2028 (USD MILLION)
TABLE 20 ASIA-PACIFIC FOUR WHEELER IN MOBILITY AS A SERVICE MARKET, BY REGION,2019-2028, (USD MILLION)
TABLE 21 ASIA-PACIFIC BUS IN MOBILITY AS A SERVICE MARKET, BY REGION,2019-2028, (USD MILLION)
TABLE 22 ASIA-PACIFIC TRAIN IN MOBILITY AS A SERVICE MARKET, BY REGION,2019-2028, (USD MILLION)
TABLE 23 ASIA-PACIFIC MICRO MOBILITY IN MOBILITY AS A SERVICE MARKET, BY REGION,2019-2028, (USD MILLION)
TABLE 24 ASIA-PACIFIC MOBILITY AS A SERVICE MARKET, BY REQUIREMENT TYPE, 2019-2028 (USD MILLION)
TABLE 25 ASIA-PACIFIC INTER CITY TRIPS IN MOBILITY AS A SERVICE MARKET, BY REGION,2019-2028, (USD MILLION)
TABLE 26 ASIA-PACIFIC AIRPORT OR MASS TRANSIT STATIONS TRIPS IN MOBILITY AS A SERVICE MARKET, BY REGION,2019-2028, (USD MILLION)
TABLE 27 ASIA-PACIFIC FIRST & LAST MILE CONNECTIVITY IN MOBILITY AS A SERVICE MARKET, BY REGION,2019-2028, (USD MILLION)
TABLE 28 ASIA-PACIFIC OFF-PEAK & SHIFT WORK COMMUTE IN MOBILITY AS A SERVICE MARKET, BY REGION,2019-2028, (USD MILLION)
TABLE 29 ASIA-PACIFIC DAILY COMMUTER IN MOBILITY AS A SERVICE MARKET, BY REGION,2019-2028, (USD MILLION)
TABLE 30 ASIA-PACIFIC OTHERS IN MOBILITY AS A SERVICE MARKET, BY REGION,2019-2028, (USD MILLION)
TABLE 31 ASIA-PACIFIC MOBILITY AS A SERVICE MARKET, BY ORGANIZATION SIZE, 2019-2028 (USD MILLION)
TABLE 32 ASIA-PACIFIC LARGE ORGANIZATION IN MOBILITY AS A SERVICE MARKET, BY REGION,2019-2028, (USD MILLION)
TABLE 33 ASIA-PACIFIC SMALL & MEDIUM ORGANIZATION IN MOBILITY AS A SERVICE MARKET, BY REGION,2019-2028, (USD MILLION)
TABLE 34 ASIA-PACIFIC MOBILITY AS A SERVICE MARKET, BY USAGE, 2019-2028 (USD MILLION)
TABLE 35 ASIA-PACIFIC COMMERCIAL IN MOBILITY AS A SERVICE MARKET, BY REGION,2019-2028, (USD MILLION)
TABLE 36 ASIA-PACIFIC PERSONAL IN MOBILITY AS A SERVICE MARKET, BY REGION,2019-2028, (USD MILLION)
TABLE 37 ASIA-PACIFIC MOBILITY AS A SERVICE MARKET, BY APPLICATION, 2019-2028 (USD MILLION)
TABLE 38 ASIA-PACIFIC ANDROID IN MOBILITY AS A SERVICE MARKET, BY REGION,2019-2028, (USD MILLION)
TABLE 39 ASIA-PACIFIC IOS IN MOBILITY AS A SERVICE MARKET, BY REGION,2019-2028, (USD MILLION)
TABLE 40 ASIA-PACIFIC OTHERS IN MOBILITY AS A SERVICE MARKET, BY REGION,2019-2028, (USD MILLION)
TABLE 41 ASIA-PACIFIC MOBILITY AS A SERVICE (MAAS) MARKET,BY COUNTRY, 2019-2028 (USD MILLION)
TABLE 42 ASIA-PACIFIC MOBILITY AS A SERVICE (MAAS) MARKET, BY SERVICE, 2019-2028 (USD MILLION)
TABLE 43 ASIA-PACIFIC MOBILITY AS A SERVICE (MAAS) MARKET, BY SOLUTIONS, 2019-2028 (USD MILLION)
TABLE 44 ASIA-PACIFIC MOBILITY AS A SERVICE (MAAS) MARKET, BY TRANSPORTATION TYPE, 2019-2028 (USD MILLION)
TABLE 45 ASIA-PACIFIC MOBILITY AS A SERVICE (MAAS) MARKET, BY VEHICLE TYPE, 2019-2028 (USD MILLION)
TABLE 46 ASIA-PACIFIC MOBILITY AS A SERVICE (MAAS)S MARKET, BY REQUIREMENT TYPE, 2019-2028 (USD MILLION)
TABLE 47 ASIA-PACIFIC MOBILITY AS A SERVICE (MAAS) MARKET, BY ORGANISATION SIZE, 2019-2028 (USD MILLION)
TABLE 48 ASIA-PACIFIC MOBILITY AS A SERVICE (MAAS) MARKET, BY USAGE, 2019-2028 (USD MILLION)
TABLE 49 ASIA-PACIFIC MOBILITY AS A SERVICE (MAAS) MARKET, BY APPLICATION , 2019-2028 (USD MILLION)
TABLE 50 CHINA MOBILITY AS A SERVICE (MAAS) MARKET, BY SERVICE, 2019-2028 (USD MILLION)
TABLE 51 CHINA MOBILITY AS A SERVICE (MAAS) MARKET, BY SOLUTIONS, 2019-2028 (USD MILLION)
TABLE 52 CHINA MOBILITY AS A SERVICE (MAAS) MARKET, BY TRANSPORTATION TYPE, 2019-2028 (USD MILLION)
TABLE 53 CHINA MOBILITY AS A SERVICE (MAAS) MARKET, BY VEHICLE TYPE, 2019-2028 (USD MILLION)
TABLE 54 CHINA MOBILITY AS A SERVICE (MAAS)S MARKET, BY REQUIREMENT TYPE, 2019-2028 (USD MILLION)
TABLE 55 CHINA MOBILITY AS A SERVICE (MAAS) MARKET, BY ORGANISATION SIZE, 2019-2028 (USD MILLION)
TABLE 56 CHINA MOBILITY AS A SERVICE (MAAS) MARKET, BY USAGE, 2019-2028 (USD MILLION)
TABLE 57 CHINA MOBILITY AS A SERVICE (MAAS) MARKET, BY APPLICATION , 2019-2028 (USD MILLION)
TABLE 58 JAPAN MOBILITY AS A SERVICE (MAAS) MARKET, BY SERVICE, 2019-2028 (USD MILLION)
TABLE 59 JAPAN MOBILITY AS A SERVICE (MAAS) MARKET, BY SOLUTIONS, 2019-2028 (USD MILLION)
TABLE 60 JAPAN MOBILITY AS A SERVICE (MAAS) MARKET, BY TRANSPORTATION TYPE, 2019-2028 (USD MILLION)
TABLE 61 JAPAN MOBILITY AS A SERVICE (MAAS) MARKET, BY VEHICLE TYPE, 2019-2028 (USD MILLION)
TABLE 62 JAPAN MOBILITY AS A SERVICE (MAAS)S MARKET, BY REQUIREMENT TYPE, 2019-2028 (USD MILLION)
TABLE 63 JAPAN MOBILITY AS A SERVICE (MAAS) MARKET, BY ORGANISATION SIZE, 2019-2028 (USD MILLION)
TABLE 64 JAPAN MOBILITY AS A SERVICE (MAAS) MARKET, BY USAGE, 2019-2028 (USD MILLION)
TABLE 65 JAPAN MOBILITY AS A SERVICE (MAAS) MARKET, BY APPLICATION , 2019-2028 (USD MILLION)
TABLE 66 INDIA MOBILITY AS A SERVICE (MAAS) MARKET, BY SERVICE, 2019-2028 (USD MILLION)
TABLE 67 INDIA MOBILITY AS A SERVICE (MAAS) MARKET, BY SOLUTIONS, 2019-2028 (USD MILLION)
TABLE 68 INDIA MOBILITY AS A SERVICE (MAAS) MARKET, BY TRANSPORTATION TYPE, 2019-2028 (USD MILLION)
TABLE 69 INDIA MOBILITY AS A SERVICE (MAAS) MARKET, BY VEHICLE TYPE, 2019-2028 (USD MILLION)
TABLE 70 INDIA MOBILITY AS A SERVICE (MAAS)S MARKET, BY REQUIREMENT TYPE, 2019-2028 (USD MILLION)
TABLE 71 INDIA MOBILITY AS A SERVICE (MAAS) MARKET, BY ORGANISATION SIZE, 2019-2028 (USD MILLION)
TABLE 72 INDIA MOBILITY AS A SERVICE (MAAS) MARKET, BY USAGE, 2019-2028 (USD MILLION)
TABLE 73 INDIA MOBILITY AS A SERVICE (MAAS) MARKET, BY APPLICATION , 2019-2028 (USD MILLION)
TABLE 74 SOUTH KOREA MOBILITY AS A SERVICE (MAAS) MARKET, BY SERVICE, 2019-2028 (USD MILLION)
TABLE 75 SOUTH KOREA MOBILITY AS A SERVICE (MAAS) MARKET, BY SOLUTIONS, 2019-2028 (USD MILLION)
TABLE 76 SOUTH KOREA MOBILITY AS A SERVICE (MAAS) MARKET, BY TRANSPORTATION TYPE, 2019-2028 (USD MILLION)
TABLE 77 SOUTH KOREA MOBILITY AS A SERVICE (MAAS) MARKET, BY VEHICLE TYPE, 2019-2028 (USD MILLION)
TABLE 78 SOUTH KOREA MOBILITY AS A SERVICE (MAAS)S MARKET, BY REQUIREMENT TYPE, 2019-2028 (USD MILLION)
TABLE 79 SOUTH KOREA MOBILITY AS A SERVICE (MAAS) MARKET, BY ORGANISATION SIZE, 2019-2028 (USD MILLION)
TABLE 80 SOUTH KOREA MOBILITY AS A SERVICE (MAAS) MARKET, BY USAGE, 2019-2028 (USD MILLION)
TABLE 81 SOUTH KOREA MOBILITY AS A SERVICE (MAAS) MARKET, BY APPLICATION , 2019-2028 (USD MILLION)
TABLE 82 AUSTRALIA MOBILITY AS A SERVICE (MAAS) MARKET, BY SERVICE, 2019-2028 (USD MILLION)
TABLE 83 AUSTRALIA MOBILITY AS A SERVICE (MAAS) MARKET, BY SOLUTIONS, 2019-2028 (USD MILLION)
TABLE 84 AUSTRALIA MOBILITY AS A SERVICE (MAAS) MARKET, BY TRANSPORTATION TYPE, 2019-2028 (USD MILLION)
TABLE 85 AUSTRALIA MOBILITY AS A SERVICE (MAAS) MARKET, BY VEHICLE TYPE, 2019-2028 (USD MILLION)
TABLE 86 AUSTRALIA MOBILITY AS A SERVICE (MAAS)S MARKET, BY REQUIREMENT TYPE, 2019-2028 (USD MILLION)
TABLE 87 AUSTRALIA MOBILITY AS A SERVICE (MAAS) MARKET, BY ORGANISATION SIZE, 2019-2028 (USD MILLION)
TABLE 88 AUSTRALIA MOBILITY AS A SERVICE (MAAS) MARKET, BY USAGE, 2019-2028 (USD MILLION)
TABLE 89 AUSTRALIA MOBILITY AS A SERVICE (MAAS) MARKET, BY APPLICATION , 2019-2028 (USD MILLION)
TABLE 90 SINGAPORE MOBILITY AS A SERVICE (MAAS) MARKET, BY SERVICE, 2019-2028 (USD MILLION)
TABLE 91 SINGAPORE MOBILITY AS A SERVICE (MAAS) MARKET, BY SOLUTIONS, 2019-2028 (USD MILLION)
TABLE 92 SINGAPORE MOBILITY AS A SERVICE (MAAS) MARKET, BY TRANSPORTATION TYPE, 2019-2028 (USD MILLION)
TABLE 93 SINGAPORE MOBILITY AS A SERVICE (MAAS) MARKET, BY VEHICLE TYPE, 2019-2028 (USD MILLION)
TABLE 94 SINGAPORE MOBILITY AS A SERVICE (MAAS)S MARKET, BY REQUIREMENT TYPE, 2019-2028 (USD MILLION)
TABLE 95 SINGAPORE MOBILITY AS A SERVICE (MAAS) MARKET, BY ORGANISATION SIZE, 2019-2028 (USD MILLION)
TABLE 96 SINGAPORE MOBILITY AS A SERVICE (MAAS) MARKET, BY USAGE, 2019-2028 (USD MILLION)
TABLE 97 SINGAPORE MOBILITY AS A SERVICE (MAAS) MARKET, BY APPLICATION , 2019-2028 (USD MILLION)
TABLE 98 INDONESIA MOBILITY AS A SERVICE (MAAS) MARKET, BY SERVICE, 2019-2028 (USD MILLION)
TABLE 99 INDONESIA MOBILITY AS A SERVICE (MAAS) MARKET, BY SOLUTIONS, 2019-2028 (USD MILLION)
TABLE 100 INDONESIA MOBILITY AS A SERVICE (MAAS) MARKET, BY TRANSPORTATION TYPE, 2019-2028 (USD MILLION)
TABLE 101 INDONESIA MOBILITY AS A SERVICE (MAAS) MARKET, BY VEHICLE TYPE, 2019-2028 (USD MILLION)
TABLE 102 INDONESIA MOBILITY AS A SERVICE (MAAS)S MARKET, BY REQUIREMENT TYPE, 2019-2028 (USD MILLION)
TABLE 103 INDONESIA MOBILITY AS A SERVICE (MAAS) MARKET, BY ORGANISATION SIZE, 2019-2028 (USD MILLION)
TABLE 104 INDONESIA MOBILITY AS A SERVICE (MAAS) MARKET, BY USAGE, 2019-2028 (USD MILLION)
TABLE 105 INDONESIA MOBILITY AS A SERVICE (MAAS) MARKET, BY APPLICATION , 2019-2028 (USD MILLION)
TABLE 106 THAILAND MOBILITY AS A SERVICE (MAAS) MARKET, BY SERVICE, 2019-2028 (USD MILLION)
TABLE 107 THAILAND MOBILITY AS A SERVICE (MAAS) MARKET, BY SOLUTIONS, 2019-2028 (USD MILLION)
TABLE 108 THAILAND MOBILITY AS A SERVICE (MAAS) MARKET, BY TRANSPORTATION TYPE, 2019-2028 (USD MILLION)
TABLE 109 THAILAND MOBILITY AS A SERVICE (MAAS) MARKET, BY VEHICLE TYPE, 2019-2028 (USD MILLION)
TABLE 110 THAILAND MOBILITY AS A SERVICE (MAAS)S MARKET, BY REQUIREMENT TYPE, 2019-2028 (USD MILLION)
TABLE 111 THAILAND MOBILITY AS A SERVICE (MAAS) MARKET, BY ORGANISATION SIZE, 2019-2028 (USD MILLION)
TABLE 112 THAILAND MOBILITY AS A SERVICE (MAAS) MARKET, BY USAGE, 2019-2028 (USD MILLION)
TABLE 113 THAILAND MOBILITY AS A SERVICE (MAAS) MARKET, BY APPLICATION , 2019-2028 (USD MILLION)
TABLE 114 MALAYSIA MOBILITY AS A SERVICE (MAAS) MARKET, BY SERVICE, 2019-2028 (USD MILLION)
TABLE 115 MALAYSIA MOBILITY AS A SERVICE (MAAS) MARKET, BY SOLUTIONS, 2019-2028 (USD MILLION)
TABLE 116 MALAYSIA MOBILITY AS A SERVICE (MAAS) MARKET, BY TRANSPORTATION TYPE, 2019-2028 (USD MILLION)
TABLE 117 MALAYSIA MOBILITY AS A SERVICE (MAAS) MARKET, BY VEHICLE TYPE, 2019-2028 (USD MILLION)
TABLE 118 MALAYSIA MOBILITY AS A SERVICE (MAAS)S MARKET, BY REQUIREMENT TYPE, 2019-2028 (USD MILLION)
TABLE 119 MALAYSIA MOBILITY AS A SERVICE (MAAS) MARKET, BY ORGANISATION SIZE, 2019-2028 (USD MILLION)
TABLE 120 MALAYSIA MOBILITY AS A SERVICE (MAAS) MARKET, BY USAGE, 2019-2028 (USD MILLION)
TABLE 121 MALAYSIA MOBILITY AS A SERVICE (MAAS) MARKET, BY APPLICATION , 2019-2028 (USD MILLION)
TABLE 122 PHILIPPINES MOBILITY AS A SERVICE (MAAS) MARKET, BY SERVICE, 2019-2028 (USD MILLION)
TABLE 123 PHILIPPINES MOBILITY AS A SERVICE (MAAS) MARKET, BY SOLUTIONS, 2019-2028 (USD MILLION)
TABLE 124 PHILIPPINES MOBILITY AS A SERVICE (MAAS) MARKET, BY TRANSPORTATION TYPE, 2019-2028 (USD MILLION)
TABLE 125 PHILIPPINES MOBILITY AS A SERVICE (MAAS) MARKET, BY VEHICLE TYPE, 2019-2028 (USD MILLION)
TABLE 126 PHILIPPINES MOBILITY AS A SERVICE (MAAS)S MARKET, BY REQUIREMENT TYPE, 2019-2028 (USD MILLION)
TABLE 127 PHILIPPINES MOBILITY AS A SERVICE (MAAS) MARKET, BY ORGANISATION SIZE, 2019-2028 (USD MILLION)
TABLE 128 PHILIPPINES MOBILITY AS A SERVICE (MAAS) MARKET, BY USAGE, 2019-2028 (USD MILLION)
TABLE 129 PHILIPPINES MOBILITY AS A SERVICE (MAAS) MARKET, BY APPLICATION , 2019-2028 (USD MILLION)
TABLE 130 PHILIPPINES MOBILITY AS A SERVICE (MAAS) MARKET, BY SERVICE, 2019-2028 (USD MILLION)
图片列表
LIST OF FIGURES
FIGURE 1 ASIA-PACIFIC MOBILITY AS A SERVICE MARKET: SEGMENTATION
FIGURE 2 ASIA-PACIFIC MOBILITY AS A SERVICE MARKET: DATA TRIANGULATION
FIGURE 3 ASIA-PACIFIC MOBILITY AS A SERVICE MARKET: DROC ANALYSIS
FIGURE 4 ASIA-PACIFIC MOBILITY AS A SERVICE MARKET: ASIA-PACIFIC VS REGIONAL MARKET ANALYSIS
FIGURE 5 ASIA-PACIFIC MOBILITY AS A SERVICE MARKET: COMPANY RESEARCH ANALYSIS
FIGURE 6 ASIA-PACIFIC MOBILITY AS A SERVICE MARKET: INTERVIEW DEMOGRAPHICS
FIGURE 7 ASIA-PACIFIC MOBILITY AS A SERVICE MARKET: DBMR MARKET POSITION GRID
FIGURE 8 ASIA-PACIFIC MOBILITY AS A SERVICE MARKET: MARKET APPLICATION PLATFORM COVERAGE GRID
FIGURE 9 ASIA-PACIFIC MOBILITY AS A SERVICE MARKET: VENDOR SHARE ANALYSIS
FIGURE 10 ASIA-PACIFIC MOBILITY AS A SERVICE MARKET: SEGMENTATION
FIGURE 11 INCREASING SMART CITY PROJECT IMPLEMENTATION AND RISING URBANIZATION IS EXPECTED TO DRIVE ASIA-PACIFIC MOBILITY AS A SERVICE MARKET IN THE FORECAST PERIOD OF 2021 TO 2028
FIGURE 12 CAR SHARING SEGMENT IS EXPECTED TO ACCOUNT FOR THE LARGEST SHARE OF ASIA-PACIFIC MOBILITY AS A SERVICE MARKET IN 2021 & 2028
FIGURE 13 DRIVERS, RESTRAINT, OPPORTUNITIES AND CHALLENGE OF ASIA-PACIFIC MOBILITY AS A SERVICE MARKET
FIGURE 14 DEVELOPMENT INDEX OF SMART CITY SERVICE CATEGORIES
FIGURE 15 COST COMPARISON OF AUTONOMOUS VEHICLE USERS
FIGURE 16 TOP ONLINE METHOD WORLDWIDE, 2019
FIGURE 17 ASIA-PACIFIC MOBILITY AS A SERVICE MARKET: BY SERVICE, 2020
FIGURE 18 ASIA-PACIFIC MOBILITY AS A SERVICE MARKET: BY SOLUTIONS, 2020
FIGURE 19 ASIA-PACIFIC MOBILITY AS A SERVICE MARKET: BY TRANSPORTATION TYPE, 2020
FIGURE 20 ASIA-PACIFIC MOBILITY AS A SERVICE MARKET: BY VEHICLE TYPE, 2020
FIGURE 21 ASIA-PACIFIC MOBILITY AS A SERVICE MARKET: BY REQUIREMENT TYPE, 2020
FIGURE 22 ASIA-PACIFIC MOBILITY AS A SERVICE MARKET: BY ORGANIZATION SIZE, 2020
FIGURE 23 ASIA-PACIFIC MOBILITY AS A SERVICE MARKET: BY USAGE, 2020
FIGURE 24 ASIA-PACIFIC MOBILITY AS A SERVICE MARKET: BY APPLICATION, 2020
FIGURE 25 ASIA-PACIFIC MOBILITY AS A SERVICE (MAAS) MARKET: SNAPSHOT (2020)
FIGURE 26 ASIA-PACIFIC MOBILITY AS A SERVICE (MAAS) MARKET: BY COUNTRY(2020)
圖 27 亞太地區行動即服務 (MAAS) 市場:依國家(2019-2028 年)
圖 28 亞太地區行動即服務 (MAAS) 市場:依國家(2019-2028 年)
圖 29 亞太地區移動即服務 (MAAS) 市場:按服務劃分(2021-2028 年)
圖 30 亞太地區移動即服務市場:2020 年公司佔有率(%)

研究方法
数据收集和基准年分析是使用具有大样本量的数据收集模块完成的。该阶段包括通过各种来源和策略获取市场信息或相关数据。它包括提前检查和规划从过去获得的所有数据。它同样包括检查不同信息源中出现的信息不一致。使用市场统计和连贯模型分析和估计市场数据。此外,市场份额分析和关键趋势分析是市场报告中的主要成功因素。要了解更多信息,请请求分析师致电或下拉您的询问。
DBMR 研究团队使用的关键研究方法是数据三角测量,其中包括数据挖掘、数据变量对市场影响的分析和主要(行业专家)验证。数据模型包括供应商定位网格、市场时间线分析、市场概览和指南、公司定位网格、专利分析、定价分析、公司市场份额分析、测量标准、全球与区域和供应商份额分析。要了解有关研究方法的更多信息,请向我们的行业专家咨询。
可定制
Data Bridge Market Research 是高级形成性研究领域的领导者。我们为向现有和新客户提供符合其目标的数据和分析而感到自豪。报告可定制,包括目标品牌的价格趋势分析、了解其他国家的市场(索取国家列表)、临床试验结果数据、文献综述、翻新市场和产品基础分析。目标竞争对手的市场分析可以从基于技术的分析到市场组合策略进行分析。我们可以按照您所需的格式和数据样式添加您需要的任意数量的竞争对手数据。我们的分析师团队还可以为您提供原始 Excel 文件数据透视表(事实手册)中的数据,或者可以帮助您根据报告中的数据集创建演示文稿。











