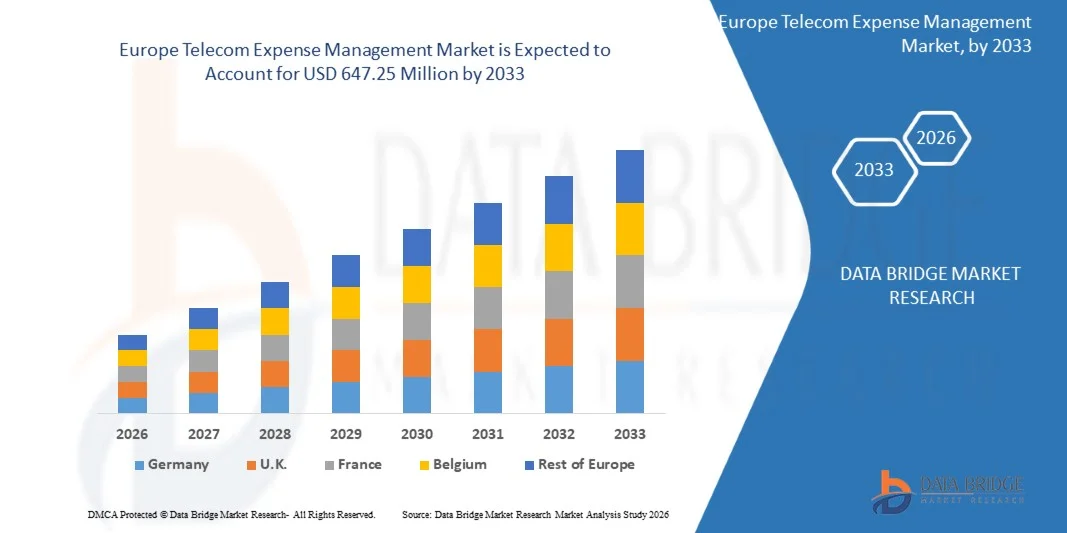
Europe Telecom Expense Management Market
市场规模(十亿美元)
CAGR :
% 
 USD
472.94 Million
USD
647.25 Million
2025
2033
USD
472.94 Million
USD
647.25 Million
2025
2033
| 2026 –2033 | |
| USD 472.94 Million | |
| USD 647.25 Million | |
| % | |
|
電信費用管理市場細分,按產品(解決方案和服務)、服務交付模式(託管服務、完全外包和託管)、部署模式(雲端和本地部署)、企業規模(大型企業和中小企業)、作業系統(Windows、MAC、行動裝置、LINUX、Chromebook 和固定電路)、定價模式(訂閱、許可和電信試用)、最終用戶(IT 和電信銀行試用)、最終用戶(IT 和電信銀行、金融服務(BFSI)、汽車、製造、醫療保健、運輸和物流、消費品和零售、能源和電力、媒體和娛樂以及其他行業)劃分——行業趨勢及至 2033 年的預測
歐洲電信費用管理市場規模
- 2025年歐洲電信費用管理市場規模為4.7294億美元 ,預計 2033年將達到6.4725億美元,預測期內 複合年增長率為4.00%。
- 市場成長的主要驅動力是電信服務日益複雜化、行動和物聯網設備普及率不斷提高,以及企業對成本優化和高效電信支出管理的需求日益增長。
- 企業越來越傾向於尋求自動化解決方案來管理電信帳單、降低營運成本並提高網路使用情況和費用的透明度。
歐洲電信費用管理市場分析
- 市場正日益廣泛地採用人工智慧和分析驅動的電信支出管理(TEM)平台,以優化電信支出並提高營運效率。
- 企業正越來越多地利用託管式TEM服務和整合平台來處理多運營商環境、物聯網設備和行動辦公人員管理。
- 德國在電信費用管理市場佔據主導地位,預計到2025年將獲得最大的收入份額,這主要得益於該國對數位化、資料安全和營運效率的高度重視。企業正在投資先進的電信費用管理平台,以簡化稽核、計費和報告流程。
- 由於託管服務、雲端平台和行動裝置費用管理解決方案的日益普及,英國預計將成為歐洲電信費用管理市場中複合年增長率(CAGR)最高的國家。企業對合規性、成本優化和即時監控日益增長的需求也進一步加速了市場成長。
- 由於企業傾向於由專業人員監管電信運營,而無需投資組建內部團隊,預計到2025年,託管服務板塊將佔據最大的收入份額。託管服務提供監控、報告和優化支持,從而更好地控製成本並提高營運效率。此外,它們還能幫助企業應對複雜的計費結構和多地點電信部署。
報告範圍及歐洲電信費用管理市場細分
|
屬性 |
歐洲電信費用管理關鍵市場洞察 |
|
涵蓋部分 |
|
|
覆蓋國家/地區 |
歐洲
|
|
主要市場參與者 |
•沃達豐集團(英國) |
|
市場機遇 |
• 基於雲端的電信費用管理解決方案日益普及 |
|
加值資料資訊集 |
除了市場價值、成長率、市場細分、地理覆蓋範圍、市場參與者和市場狀況等市場洞察外,Data Bridge Market Research 團隊精心編制的市場報告還包括深入的專家分析、進出口分析、定價分析、生產消費分析和 PESTLE 分析。 |
電信費用管理市場趨勢
“對基於雲端的自動化電信費用解決方案的需求不斷增長”
電信服務的日益複雜化以及行動、物聯網和雲端設備的普及,正在顯著影響電信費用管理 (TEM) 市場。企業越來越傾向於選擇能夠優化成本、提高透明度並確保合規性的解決方案。 TEM 平台因其能夠簡化發票管理、監控網路使用情況並改善財務治理且不增加營運成本而備受青睞。
• 大型企業、中小企業和政府機構對成本優化、營運效率和合規性要求的日益重視,加速了對電信支出管理 (TEM) 解決方案的需求。各機構都在積極尋求自動化、分析驅動的平台來管理電信支出並減少計費錯誤,這促使供應商不斷增強功能、整合和報告能力。
• 雲端採用和數位轉型趨勢正在影響採購和營運決策,企業越來越重視基於 SaaS 的 TEM 解決方案,這些方案提供可擴展性、即時分析以及與 ERP 和會計系統的無縫整合。這些因素有助於企業實現服務差異化,並維持營運效率的競爭力。
例如,2024年,美國AT&T和法國Orange Business Services擴展了其TEM(費用管理)服務,引進了基於雲端平台和人工智慧驅動的分析技術。這些措施旨在滿足企業日益增長的成本控制需求、改進的發票核對以及跨多運營商和多設備環境的自動化費用管理。
儘管對TEM解決方案的需求不斷增長,但市場的持續擴張取決於持續的研發投入、用戶體驗的提升以及用於預測性支出管理的高級分析技術的整合。供應商正致力於增強可擴展性、雲端安全性和平台互通性,以支援全球範圍內的應用。
電信費用管理市場動態
司機
“對成本優化和營運效率日益增長的需求”
企業正越來越多地採用電信支出管理 (TEM) 解決方案來優化電信支出、監控網路使用情況並減少帳單差異。這一趨勢正在推動對自動化雲端平台的需求,這些平台能夠提供即時費用可見度並改善決策。
• 行動、固網、物聯網和雲端服務等領域的部署不斷擴展,正在推動市場成長。 TEM 解決方案可協助企業管理複雜的電信環境,同時提高營運效率和合規性。
服務提供者和企業正積極透過產品創新、與ERP系統整合以及提供託管服務來推廣TEM(運輸管理)的應用。這些努力得益於企業日益重視成本降低、永續發展和數位轉型措施。
例如,2023年,美國IBM和法國凱捷報告稱,受自動化發票核對、優化電信成本和提高報告準確性的需求驅動,企業客戶越來越多地採用人工智慧賦能的TEM平台。
儘管企業需求的成長支撐了市場發展,但更廣泛的應用取決於成本效益、平台可擴展性和合規性。對人工智慧、雲端基礎設施和整合能力的投資對於滿足全球需求和保持競爭優勢至關重要。
克制/挑戰
“實施成本高且中小企業意識有限”
• 先進的TEM解決方案實施和訂閱成本相對較高,這仍然是一個主要挑戰,限制了小型企業的採用。複雜的部署流程和對專業人員的需求也會增加營運負擔。
• 企業對TEM(費用管理自動化)益處的認知仍然參差不齊,尤其是在新興市場,中小企業可能尚未充分了解潛在的成本節約和效率提升。部分產業對自動化費用管理工具的了解有限,限制了其應用。
與現有IT系統、多運營商網路和傳統基礎設施的整合挑戰也會影響市場成長。企業可能難以將TEM解決方案與現有工作流程相協調,這需要額外投資於培訓和系統相容性。
例如,到2024年,東南亞中小企業在採用Orange Business Services和AT&T等供應商提供的TEM平台時,由於成本較高且對功能優勢了解有限,其採用速度有所放緩。整合複雜性和變更管理也是額外的障礙。
克服這些挑戰需要成本效益高的解決方案、簡化的部署模式和有針對性的教育計畫。與顧問公司、託管服務供應商和認證機構合作,有助於釋放全球電信費用管理市場的長期成長潛力。開發經濟實惠、可擴展且用戶友好的平台對於更廣泛的應用至關重要。
電信費用管理市場範圍
市場按產品/服務、服務交付模式、部署模式、企業規模、作業系統和最終用戶進行細分。
• 透過提供
根據產品類型,電信費用管理市場可分為解決方案與服務兩大類。預計到2025年,解決方案類產品將佔據最大的市場份額,這主要得益於企業日益增長的需求,即透過自動化軟體平台來更好地了解和控制電信及IT費用。電信費用管理解決方案提供諸如使用情況監控、帳單審核、成本優化和合約管理等功能,使其成為大規模營運的必備工具。這些解決方案有助於企業減少營運低效率環節,避免計費錯誤。此外,與ERP和IT管理系統的整合還能提高報告的準確性,並輔助財務決策。
預計在2026年至2033年期間,服務領域將迎來最快的成長,這主要得益於市場對電信管理服務和專家支援(旨在優化電信支出)的需求不斷增長。服務通常包括諮詢、實施、持續的費用管理和爭議解決,使企業能夠專注於核心業務,同時確保成本效益和合規性。外包服務對於缺乏專門IT財務團隊的中小型企業尤其具有吸引力。此外,服務還提供針對特定產業需求量身訂製的解決方案,幫助客戶有效管理多供應商電信環境。
• 依服務交付模式
根據服務交付模式,市場可細分為託管服務、完全外包和主機託管。由於企業傾向於在不投資組建內部團隊的情況下,由專業人員對電信營運進行監管,預計到2025年,託管服務將佔據最大的收入份額。託管服務提供監控、報告和優化支持,從而更好地控製成本並提高營運效率。此外,它們還能幫助企業應對複雜的計費結構和多地點電信部署。
受雲端平台的可擴展性和靈活性的驅動,託管型電信服務預計將在2026年至2033年間實現最快成長。託管型電信費用管理解決方案使企業能夠遠端監控、管理和優化電信支出,而無需前期投入大量基礎設施資金。這些解決方案可降低IT維護成本,並提供即時分析以輔助決策。此外,託管模式還支援無縫軟體更新、增強安全性以及多裝置存取。
• 依部署模式
根據部署模式,市場可分為雲端部署和本地部署。受雲端運算普及率不斷提高以及全球企業對遠端存取需求的推動,雲端部署在2025年佔據了最大的市場份額。基於雲端的電信費用管理支援即時追蹤、分析、自動報告以及與其他業務系統的集成,從而助力企業優化成本。雲端解決方案還能降低IT開銷,並支援跨多個地點的快速部署。
預計從2026年到2033年,本地部署市場將實現顯著成長,這主要得益於企業對其電信費用管理系統尋求更強大的資料控制、安全性和客製化能力。本地部署解決方案可讓企業在內部維護敏感的財務和營運資料。對於有嚴格監管合規要求或擁有複雜傳統IT基礎設施的企業而言,這些系統是更佳選擇。此外,本地部署還能提供與現有企業應用程式的進階客製化和整合功能。
• 按企業規模
根據企業規模,市場可分為大型企業和中小企業。由於大型企業擁有複雜的電信網絡,且需要在多個地區進行廣泛的成本監控和合規性管理,因此預計到2025年,大型企業將佔據市場主導地位。電信費用管理平台提供的集中管理、統一計費和全面報告功能,使大型企業受益匪淺。此外,這些企業通常簽訂了涉及多家供應商的電信合同,需要進行複雜的審計和最佳化。
預計2026年至2033年間,中小企業將迎來最快的成長速度,這主要得益於人們對電信費用優化益處的認識不斷提高,以及可擴展且價格合理的管理解決方案的普及。中小企業正在採用電信費用管理平台來降低營運成本並提高效率。基於雲端的解決方案和託管服務使中小企業無需大量前期投資即可監控費用。此外,遠距辦公和行動裝置在中小企業中的普及也加速了靈活的電信費用管理工具的採用。
• 透過作業系統
根據作業系統,市場可細分為 Windows、Mac、行動裝置、Linux、Chromebook 和固定電路。由於 Windows 在企業 IT 環境中的廣泛應用以及與電信費用管理平台的兼容性,預計到 2025 年,Windows 市場佔有率將最大。大多數企業桌上型電腦和筆記型電腦都運行 Windows 系統,這使得整合和使用者培訓更加便利。基於 Windows 的解決方案通常提供用於報告、分析和多用戶協作的高級功能。
預計2026年至2033年間,行動領域將實現最快成長,這主要得益於電信費用管理中對行動性、遠端存取和即時監控功能日益增長的需求。行動應用程式可讓管理人員和IT團隊隨時隨地追蹤使用情況、審批費用並產生報告。智慧型手機的普及和企業自帶設備辦公室(BYOD)政策的推行,正在推動對行動友善電信費用管理解決方案的需求。此外,行動平台增強了分散式團隊的存取能力,並支援推播通知以實現即時提醒。
• 由最終用戶
根據最終用戶,市場可細分為IT與電信、銀行、金融服務和保險(BFSI)、汽車、製造、醫療保健、運輸與物流、消費品與零售、能源與電力、媒體與娛樂等產業。由於IT與電信業電信服務需求量大且基礎設施複雜,預計到2025年,該產業將佔據最大的市場份額。電信費用管理可協助這些企業優化網路服務、雲端訂閱和行動裝置的支出。
預計2026年至2033年間,銀行、金融服務和保險(BFSI)產業將實現最快成長,主要驅動力包括電信基礎設施投資增加、監管合規要求以及銀行、金融服務和保險業務對嚴格成本控制的需求。 BFSI企業利用電信費用管理系統來監控多分公司的連接、行動辦公設備和跨境電信費用。此外,銀行業和保險業日益增長的數位化進程也推動了自動化費用追蹤和報告系統的應用。
電信費用管理市場區域分析
- 德國在電信費用管理市場佔據主導地位,預計到2025年將獲得最大的收入份額,這主要得益於該國對數位化、資料安全和營運效率的高度重視。企業正在投資先進的電信費用管理平台,以簡化稽核、計費和報告流程。
- 大型企業,尤其是擁有複雜多廠商電信環境的企業,越來越傾向選擇整合式雲端解決方案和託管服務。
- 注重永續性和節能型IT基礎設施也有助於市場採納。
英國電信費用管理市場洞察
受雲端解決方案、託管服務和行動費用追蹤日益普及的推動,英國電信費用管理市場預計將在2026年至2033年間實現最快成長。企業正致力於優化電信和IT成本,同時確保符合產業法規。遠距辦公和分散式團隊的興起也推動了對即時監控和行動存取費用管理平台的需求。金融、IT和零售業的企業正引領這一趨勢,利用這些解決方案提高效率和成本透明度。
電信費用管理市場佔有率
歐洲電信費用管理產業主要由一些老牌公司主導,其中包括:
• 沃達丰集團(英國)
• CGI公司(加拿大)
• Dimension Data(南非)
• 埃森哲(愛爾蘭) •
Econocom(法國)
• Asignet(美國)
• Technology DNA(美國)
• AVOTUS(美國)
• Calero-MDSL(美國)
• Cass Information Systems, Inc.(美國)
• Network Control(美國)
• One Source(美國)
• RadiusPoint(美國)
• Saaswedo(德國)
• Sakon(美國)
• Tangoe(美國)
• Tellennium(美國)
• Upland Software, Inc.(美國)
• VALICOM(美國)
• vMOX, LLC.(美國)
• WidePoint Corporation(美國)
SKU-

研究方法
数据收集和基准年分析是使用具有大样本量的数据收集模块完成的。该阶段包括通过各种来源和策略获取市场信息或相关数据。它包括提前检查和规划从过去获得的所有数据。它同样包括检查不同信息源中出现的信息不一致。使用市场统计和连贯模型分析和估计市场数据。此外,市场份额分析和关键趋势分析是市场报告中的主要成功因素。要了解更多信息,请请求分析师致电或下拉您的询问。
DBMR 研究团队使用的关键研究方法是数据三角测量,其中包括数据挖掘、数据变量对市场影响的分析和主要(行业专家)验证。数据模型包括供应商定位网格、市场时间线分析、市场概览和指南、公司定位网格、专利分析、定价分析、公司市场份额分析、测量标准、全球与区域和供应商份额分析。要了解有关研究方法的更多信息,请向我们的行业专家咨询。
可定制
Data Bridge Market Research 是高级形成性研究领域的领导者。我们为向现有和新客户提供符合其目标的数据和分析而感到自豪。报告可定制,包括目标品牌的价格趋势分析、了解其他国家的市场(索取国家列表)、临床试验结果数据、文献综述、翻新市场和产品基础分析。目标竞争对手的市场分析可以从基于技术的分析到市场组合策略进行分析。我们可以按照您所需的格式和数据样式添加您需要的任意数量的竞争对手数据。我们的分析师团队还可以为您提供原始 Excel 文件数据透视表(事实手册)中的数据,或者可以帮助您根据报告中的数据集创建演示文稿。

