Global Orthodontic Supplies Market
市场规模(十亿美元)
CAGR :
% 
 USD
9.18 Million
USD
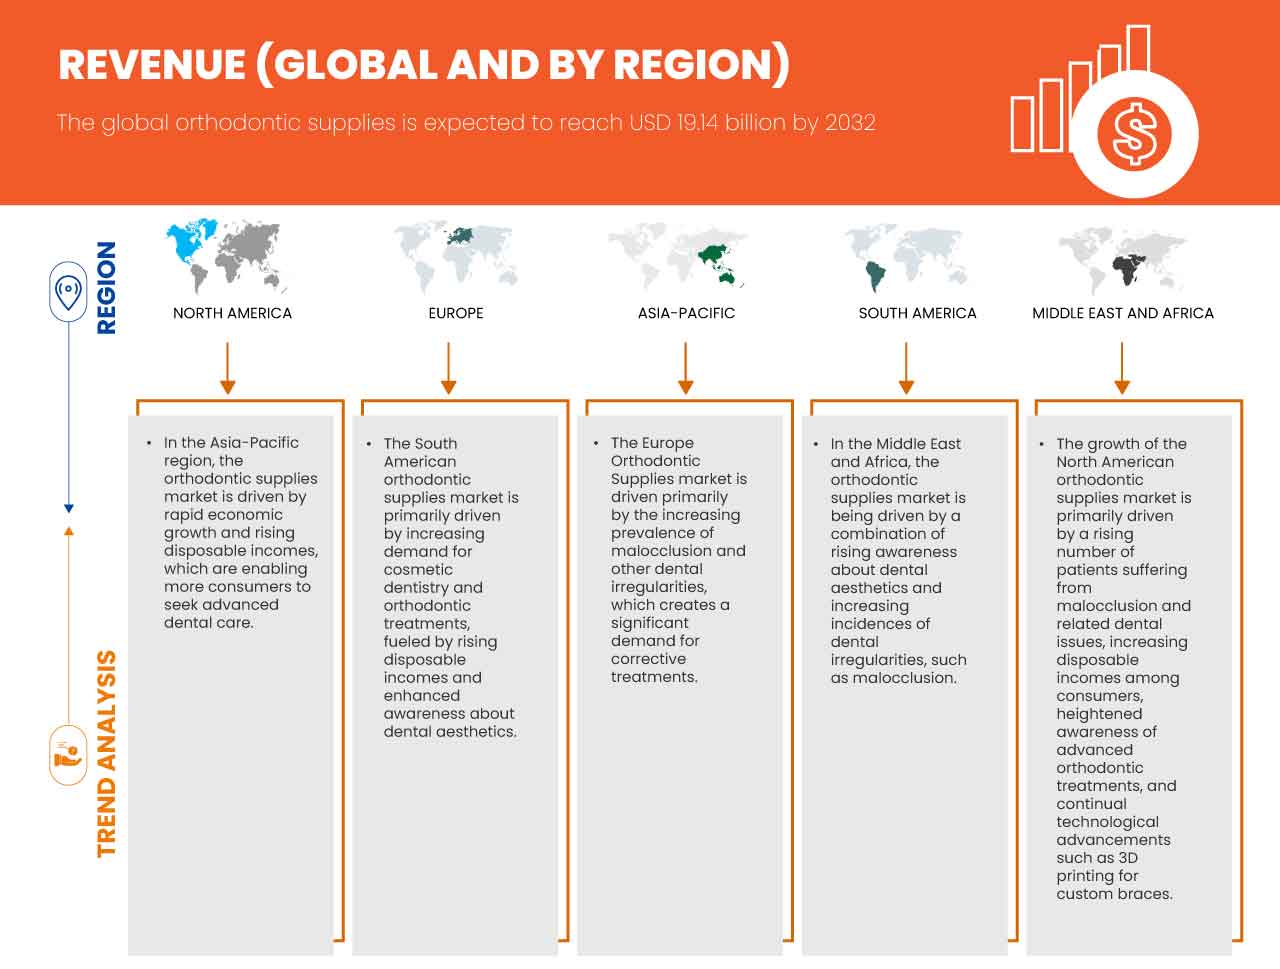
19.14 Million
2024
2032
USD
9.18 Million
USD
19.14 Million
2024
2032
| 2025 –2032 | |
| USD 9.18 Million | |
| USD 19.14 Million | |
| % | |
|
全球矫形用品市场,按产品类型(可移动矫形器械、固定矫形器械、附着物和附着物)、病人类型(儿童和少年及成年人)、材料类型(铁丝网、铁丝网和铝器及保留物)、应用(马列包容治疗、矫正矫形和预防性矫形),最终用户(牙科诊所、医院和学术和研究所)、分销渠道(发酵器、零售销售等) -- -- 2032年行业趋势和预测
Global Orthodontic Supplies Market Analysis
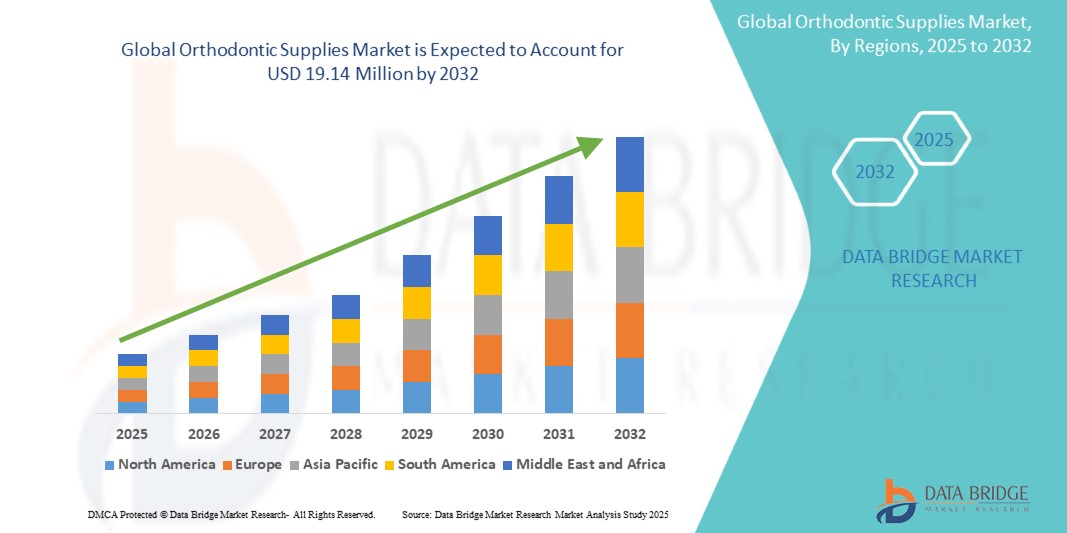
Global orthodontic supplies market is a rapidly growing sector within the dental industry, focused on products used to correct teeth misalignments and jaw issues. Key products in this market include traditional braces, clear aligners, brackets, wires, bands, and adhesives. Growth is driven by factors like increased awareness of dental health, rising demand for aesthetic treatments, and advancements in orthodontic technology, such as 3D printing and custom-made aligners. North America and Europe dominate the market due to high disposable incomes and widespread access to orthodontic care. However, emerging markets in Asia-Pacific and Latin America are seeing significant growth, fueled by rising dental care accessibility and a growing middle class. The increasing preference for less visible treatments, such as clear aligners, is reshaping the market dynamics. As dental aesthetics and health become a priority globally, the orthodontic supplies market is poised for continued expansion with ongoing technological innovations.
Global Orthodontic Supplies Market Size
Global orthodontic supplies market size was valued at USD 9.18 million 2024 and is projected to reach USD 19.14 million by 2032, with a CAGR of 9.7% during the forecast period of 2025 to 2032. In addition to the insights on market scenarios such as market value, growth rate, segmentation, geographical coverage, and major players, the market reports curated by the Data Bridge Market Research also include import export analysis, production capacity overview, production consumption analysis, price trend analysis, climate change scenario, supply chain analysis, value chain analysis, raw material/consumables overview, vendor selection criteria, PESTLE Analysis, Porter Analysis, and regulatory framework.
Global Orthodontic Supplies Market Trends
“Rising Demand for Aesthetic Treatments”
The global orthodontics supply market is experiencing robust growth, driven by technological advancements, increasing demand for aesthetic dental solutions, and expanding awareness of oral health. The market is projected to grow at a significant rate, with innovations such as clear aligners, self-ligating braces, and AI-driven treatment planning gaining popularity. These advancements are improving treatment outcomes and enhancing patient satisfaction, particularly among adults seeking discreet options. Regionally, Asia-Pacific is witnessing strong growth, with policy changes in countries like China boosting market demand. In addition, North America continues to be a key player, benefiting from a steady increase in patient traffic and advancements in orthodontic materials. However, challenges like high treatment costs, unfavorable reimbursement policies, and the need for continuous innovation remain. Despite these hurdles, the market’s overall outlook remains positive as more consumers and practitioners embrace modern orthodontic solutions.
Report Scope and Global Orthodontic Supplies Market Segmentation
|
Attributes |
Global Orthodontic Supplies MarketInsights |
|
Segments Covered |
|
|
Region Covered |
U.S., Canada, Mexico, Germany, France, U.K., Italy, Spain, Russia, Netherlands, Switzerland, Turkey, Belgium, Sweden, Denmark, Finland, Norway, Poland, Rest of Europe, Japan, China, India, South Korea, Australia, Singapore, Thailand, Malaysia, Indonesia, Vietnam, Philippines, Taiwan, New Zealand, Rest of Asia-Pacific, Brazil, Argentina, Rest of South America, South Africa, Saudi Arabia, U.A.E, Egypt, Kuwait, Israel, Qatar, Oman, Bahrain, and Rest of Middle East & Africa |
|
Key Market Players |
Ormco Corporation (U.S.), 3M (U.S.), American Orthodontics (U.S.), Dentsply Sirona (U.S.), Institut Straumann AG (Switzerland), Aditek do Brasil S.A. (Brazil), DENTAURUM GmbH & Co. KG (Germany), FORESTADENT - Bernhard Foerster GmbH (Germany), G&H Orthodontics (U.S.), Gestenco International AB (Sweden), Great Lakes Dental Technologies (U.S.), Henry Schein, Inc. (U.S.), Leone S.p.A. (Italy), LightForce (U.S.), Modern Orthodontics (India), OrthoAmerica Holdings LLC. (U.S.), Shinye Orthodontic Products Co., Ltd. (China), and TP Orthodontics, Inc (U.S.) |
|
Market Opportunities |
|
|
Value Added Data Infosets |
In addition to the insights on market scenarios such as market value, growth rate, segmentation, geographical coverage, and major players, the market reports curated by the Data Bridge Market Research also include import export analysis, production capacity overview, production consumption analysis, price trend analysis, climate change scenario, supply chain analysis, value chain analysis, raw material/consumables overview, vendor selection criteria, PESTLE Analysis, Porter Analysis, and regulatory framework. |
Global Orthodontic Supplies Market Definition
The global orthodontic supplies market involves the production, distribution, and sale of products used in orthodontic treatments, which aim to correct misaligned teeth and jaws. This market includes a variety of products such as braces, clear aligners, brackets, archwires, elastics, retainers, and specialized orthodontic tools and instruments. The demand for orthodontic supplies is driven by factors such as increased awareness of dental aesthetics, advancements in technology, and growing interest in cosmetic dentistry. Innovations like clear aligners have gained popularity due to their aesthetic appeal and comfort, while traditional options like metal braces remain in demand. The market caters to orthodontists, dental clinics, hospitals, and individual patients, with growth fueled by rising disposable incomes and an increasing focus on dental care across the globe. .
Global Orthodontic Supplies MarketDynamics
Drivers
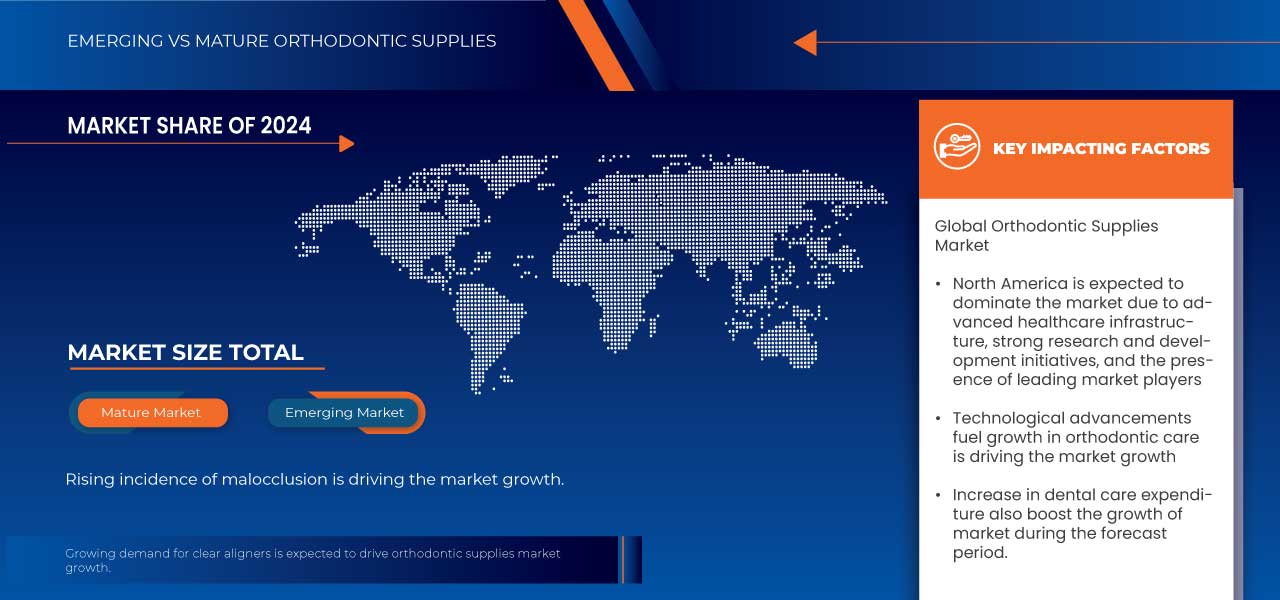
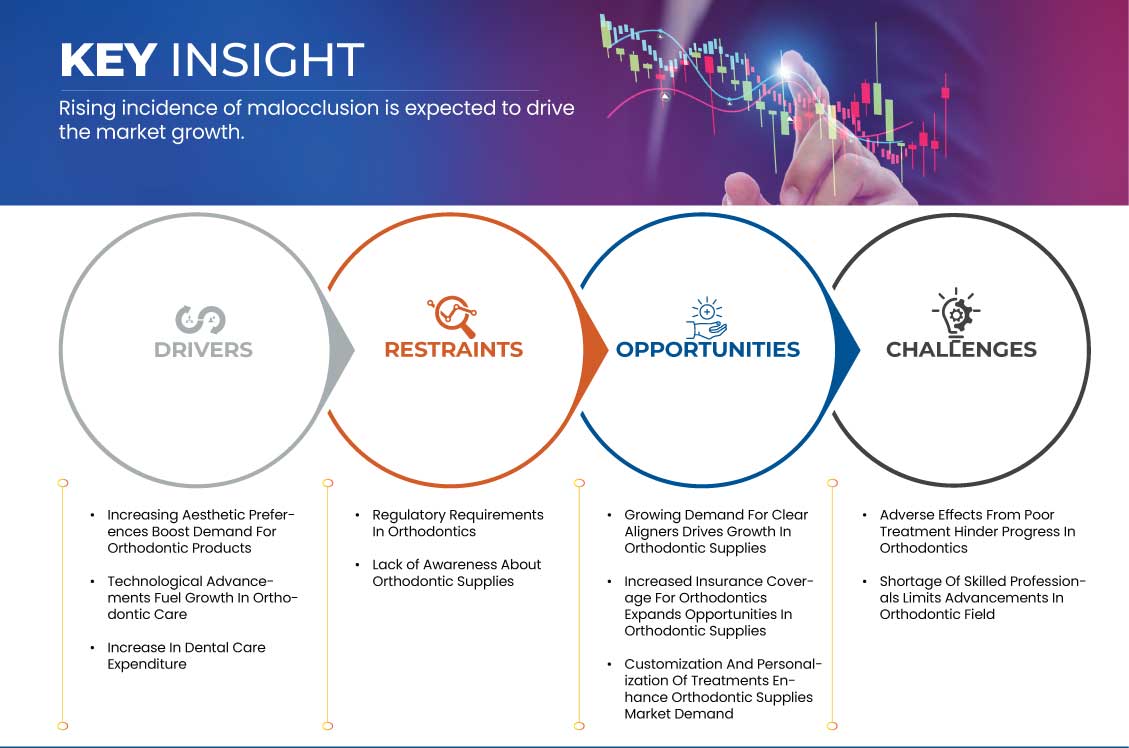
- Rising Incidence of Malocclusion
The global rise in malocclusion, a dental condition where teeth are misaligned, is significantly driving the demand for orthodontic treatments, including dental braces and clear aligners. According to a recent report from Fact.MR, the increasing prevalence of malocclusion is one of the primary factors fueling the growth of the orthodontics market.
As more people, especially children and young adults, are diagnosed with malocclusion, there is a growing awareness of its impact on both oral health and aesthetic appearance. The condition, which can cause difficulty in biting, chewing, and speaking, also leads to long-term dental issues like tooth decay and gum disease if untreated. These complications, along with the increasing importance placed on a perfect smile, are propelling more individuals toward seeking orthodontic treatments.
In recent years, there has been a significant shift in consumer preferences, with a growing inclination toward more discreet orthodontic solutions such as clear aligners and ceramic braces. As technological advancements have made treatments faster, more effective, and less visible, the accessibility of orthodontic care has increased, further fueling the demand.
Furthermore, rising disposable incomes, particularly in emerging economies, have made orthodontic treatments more accessible to a broader demographic. This has been accompanied by an increase in oral health awareness campaigns across various countries, emphasizing the importance of early diagnosis and treatment of malocclusion.
Industry experts also point to innovations in orthodontic technology, such as 3D printing and AI-powered diagnostic tools, as factors enhancing the efficiency and affordability of orthodontic treatments. As orthodontic care becomes increasingly accessible and appealing, the demand for braces and aligners is set to continue its upward trajectory.
For instance,
- In July 2022, according to the article published by BioSpace, a rising incidence of malocclusion, contributing to higher demand for dental braces. As more individuals seek treatments to address misaligned teeth, this trend drives the orthodontic market, boosting the need for innovative dental braces and related products. Increased awareness and demand for corrective treatments support market growth
- In December 2024, according to the article published by MDPI, advancements in orthodontic treatments, particularly focusing on innovative approaches to improving patient care and outcomes. It highlights the role of new materials, technologies like 3D printing, and digital tools in enhancing the effectiveness of treatments. These innovations are expected to drive growth in the orthodontic market
The rising incidence of malocclusion is shaping the orthodontic market, driving demand for corrective treatments such as braces and clear aligners. With a growing focus on both health and aesthetics, this trend highlights a substantial opportunity for the global dental industry, making orthodontic care more accessible to a wider population.
- Increasing Aesthetic Preferences
The growing focus on aesthetics, particularly among adults and adolescents, has significantly boosted the demand for orthodontic products. As societal norms continue to emphasize appearance, more individuals are seeking orthodontic treatments to achieve a more aesthetically pleasing smile. This heightened awareness has led to a surge in popularity for clear aligners, lingual braces, and ceramic options, all of which offer discreet and effective alternatives to traditional metal braces. Consumers are increasingly prioritizing treatments that are less visible and more aligned with their aesthetic preferences, prompting orthodontic manufacturers to innovate and expand their product offerings. This shift towards more visually appealing orthodontic solutions is reshaping the market, with greater emphasis on customization, comfort, and aesthetics. As a result, the demand for clear aligners and other cosmetic orthodontic products has escalated, creating new growth opportunities within the dental industry. Furthermore, the increasing availability of these options, alongside their effectiveness in providing optimal dental alignment, continues to drive the market forward, making orthodontic care more accessible and desirable for a broader range of individuals. This transformation is not only benefiting orthodontic practices but also accelerating the development of new technologies and materials, contributing to the overall expansion of the orthodontic products market.
For instance,
- In January 2023, according to the article published by BDJ, the growing awareness of aesthetics, especially among adults and adolescents, has led to an increased demand for orthodontic treatments. This shift is driving innovation in orthodontic supplies, particularly clear aligners and cosmetic braces, resulting in greater market diversification and expanding opportunities for dental professionals worldwide
- In August 2024, according to the article published by MDPI, the use of artificial intelligence (AI) to automate the aesthetic component (AC) of the Index of Orthodontic Treatment Need (IOTN). Analyzing 1,009 pre-treatment intraoral photos, the AI demonstrated 77% sensitivity and 82% accuracy in predicting treatment needs, indicating its potential to support clinical evaluations of dental aesthetics
The growing emphasis on aesthetics, particularly among adults and adolescents, has significantly influenced the demand for orthodontic treatments. As consumers prioritize appearance and seek more discreet and effective solutions, innovations in orthodontic products like clear aligners and cosmetic braces are becoming increasingly popular. This shift in consumer preferences not only shapes the development of new orthodontic technologies but also opens up opportunities for dental professionals to offer a wider range of personalized, aesthetically appealing treatments. The trend towards more visually acceptable options is expected to continue driving advancements in the orthodontic field
- Technological Advancements in Orthodontic Care
Recent innovations in orthodontic technologies are significantly reshaping the landscape of dental care, especially in the orthodontic sector. Technologies such as 3D printing, digital scanning, and improved materials have not only enhanced the accuracy and customization of treatments but also streamlined the entire process, making it more efficient. 3D printing allows for the precise creation of orthodontic appliances tailored to individual needs, reducing the time and cost involved in the production of traditional braces and aligners. Digital scanning has largely replaced traditional impressions, making the process more comfortable and accurate, while also providing faster results for treatment planning. Moreover, the development of advanced materials, such as high-performance ceramic brackets and more durable, flexible wires, has made treatments less visible, more comfortable, and quicker, ultimately improving the patient experience. These technological advancements are driving a surge in the demand for orthodontic care, as patients are increasingly attracted to the benefits of faster treatments, reduced discomfort, and more aesthetically pleasing options. The growing reliance on these innovations is not only attracting a wider audience, particularly among adults seeking cosmetic improvements, but also encouraging orthodontic professionals to adopt these technologies to remain competitive and provide optimal patient outcomes.
For instance,
- In February 2024, according to the article published by Momentum, article highlights five key advancements in dental technology for 2024, including AI-powered diagnostics, 3D printing, and innovative smart dental tools. It also discusses new product launches, such as advanced intraoral scanners and AI-based treatment planning systems, which are enhancing patient care by improving accuracy and overall dental experiences
- In January 2024, according to the article published by MDPI, 3D printing has become a key driver in clear aligner fabrication by enabling faster production, enhanced customization, and reduced costs. It allows for precise patient-specific aligners, improving comfort and treatment efficiency. This technology’s ability to streamline manufacturing and reduce material waste accelerates the growth of the orthodontics market
Technological innovations are playing a pivotal role in the evolution of orthodontic care. From enhanced treatment precision to reduced treatment time, advancements like 3D printing, digital scanning, and superior materials are elevating the quality and accessibility of orthodontic treatments. As these technologies continue to evolve, they are expected to further drive the demand for orthodontic services, making them more efficient, personalized, and appealing to a broader range of patients. This trend highlights the increasing importance of staying at the forefront of technological developments in the orthodontic industry.
Opportunity
- Growing Demand for Clear Aligners
The growing demand for clear aligners presents a substantial opportunity in the global orthodontic supplies market, as these innovative devices continue to reshape the way orthodontic treatments are approached. Clear aligners, such as Invisalign, have witnessed a significant surge in popularity due to their aesthetic, comfort, and convenience advantages over traditional metal braces. The shift toward clear aligners is driven largely by patient preference for discreet, nearly invisible orthodontic solutions, particularly among adults and image-conscious teenagers who wish to undergo treatment without the visibility of metal brackets and wires. As a result, the market for clear aligners has expanded rapidly, creating a lucrative opportunity for manufacturers, suppliers, and orthodontic professionals to meet the increasing demand for these customized, transparent devices. Advancements in technology, particularly 3D scanning and digital treatment planning, have further fueled this growth, allowing for the creation of highly precise, personalized aligners that improve the overall treatment experience. The ability of clear aligners to be removed for eating, drinking, and oral hygiene is another key factor driving their popularity, as it provides patients with greater flexibility and convenience compared to traditional braces. In addition, as clear aligner technology evolves, it is becoming increasingly effective in treating a broader range of orthodontic issues, from mild to complex misalignments, which has expanded the target demographic and opened new avenues for growth. Clear aligners also offer the appeal of faster treatment times compared to traditional methods, another selling point for patients looking for quicker results. As the market for clear aligners continues to grow, there is a corresponding surge in demand for the supporting products and services that enable their successful use—such as 3D scanning devices, aligner production materials, treatment management software, and patient monitoring tools. This creates a robust market opportunity for orthodontic suppliers to not only focus on the aligners themselves but also develop and distribute complementary technologies and accessories that support clear aligner treatments. The rising popularity of direct-to-consumer clear aligner brands, alongside increasing awareness of the benefits of clear aligners, further strengthens the market, pushing for more investment in research, development, and distribution channels. The growing global preference for clear aligners marks a dynamic shift in the orthodontic industry, positioning it for sustained growth, where innovative product offerings and advancements in treatment technology present substantial opportunities for key stakeholders in the global orthodontic supplies market.
For instance,
- In April 2023, according to the article published by science direct the growing demand for clear aligners (CAT) in orthodontics stems from advancements in biomaterials, CAD/CAM technologies, and aggressive marketing strategies. Direct-to-consumer advertising and social media have raised awareness, particularly among adult patients seeking aesthetic alternatives to traditional fixed appliances, contributing to CAT's increasing popularity over the past decade
- In June 2020, according to the article published by ResearchGate, the growing demand for clear aligners is driven by advancements that enhance comfort and aesthetics in orthodontic treatment. As more manufacturers enter the market, patient interest in clear aligners rises. Success depends on clinicians' expertise, proper case selection, and patient adherence, creating an expanding opportunity in orthodontics
In conclusion, the growing demand for clear aligners presents a significant opportunity in the global orthodontic supplies market. As patients seek discreet, comfortable, and effective treatments, clear aligners are increasingly favored over traditional braces. Technological advancements have expanded their applicability and appeal, driving further market growth. This trend creates opportunities for orthodontic suppliers to innovate and offer complementary products, positioning them to meet the rising global demand for clear aligners and related technologies.
- Increased Insurance Coverage for Orthodontics
Increased insurance coverage for orthodontics represents a significant opportunity for the global orthodontic supplies market, as it opens the door to a larger, more diverse patient base who can now access orthodontic treatments they may have otherwise been unable to afford. In recent years, there has been a growing trend among insurance providers to expand their coverage for orthodontic treatments, including both traditional braces and newer options like clear aligners. This shift is largely driven by an increased awareness of the long-term health benefits of orthodontics, such as improved oral hygiene, prevention of tooth decay, and better overall dental function. As a result, more patients are now able to seek treatment, leading to a surge in demand for orthodontic appliances, tools, and products. The expanded insurance coverage not only lowers the financial barrier for patients but also boosts the number of people willing to undergo orthodontic care, creating a broader market for orthodontic suppliers. This trend is especially prominent in regions where orthodontic treatments were previously considered a luxury or were out of reach for many. With insurance providers increasingly covering a portion or even the full cost of orthodontic treatments, more people are likely to opt for advanced solutions like clear aligners, ceramic braces, and other innovative orthodontic technologies. This growing accessibility is a prime opportunity for manufacturers and suppliers to expand their product offerings and cater to a broader, more diverse consumer demographic. In addition, as the demand for orthodontic treatments rises, orthodontic practices and suppliers will need to adapt by offering more affordable, insurance-compatible solutions to meet the needs of insured patients. The expansion of insurance coverage for orthodontics, therefore, represents a key factor driving growth in the global orthodontic supplies market, making it a critical area for investment and innovation.
For instance,
- In August 2022, according to the article published by NCBI, facilitating access and encouraging higher expenditure. Studies reveal that insurance, such as Medicaid, enhances the likelihood of dental visits, particularly among low-income individuals. Expanding coverage could lead to greater utilization of orthodontic services and improved oral health outcomes
- In May 2021, according to the article published by NCBI, the for orthodontics presents an opportunity to improve accessibility to care. While private insurance plans vary, offering higher coverage can encourage more visits and higher expenditures. Plans like Delta Dental, with options ranging from co-pays to partial coverage, provide flexibility, enhancing treatment opportunities for individuals seeking orthodontic services
In conclusion, increased insurance coverage for orthodontics creates significant growth opportunities in the global orthodontic supplies market. As more patients gain access to affordable treatments, demand for advanced orthodontic solutions, including clear aligners and custom appliances, is rising. This trend encourages innovation and expansion, benefiting both suppliers and patients worldwide.
Restraints/Challenge
- Regulatory Requirements in Orthodontics
Regulatory requirements in orthodontics play a critical role in ensuring patient safety and the effectiveness of treatments, but they also present significant challenges for manufacturers. Compliance with these standards often requires substantial investments in product testing, quality assurance processes, certifications, and regular audits. These compliance measures can be time-consuming and expensive, especially for small and medium-sized companies, as they may need to allocate resources for updating product designs, conducting trials, and meeting specific safety protocols. Moreover, manufacturers must also adapt to changing regulations, which can involve costly adjustments to manufacturing processes and product lines. These stringent standards can also slow down the speed at which new technologies, such as innovative materials or treatment devices, are brought to market. In some cases, regulatory delays can hinder the adoption of cutting-edge treatments, affecting both patients and orthodontic practitioners who seek the latest solutions to meet their needs. As such, while these regulatory requirements are crucial for ensuring the highest standards of care, they also act as a barrier to market growth and innovation in the field.
For instance,
- In June 2024, according to the article published by Scientific Research, Regulatory requirements in orthodontics can delay market growth due to lengthy approval processes, safety assessments, and high compliance costs. Regional variations in regulations also create challenges for manufacturers. These hurdles can slow innovation and limit access to advanced orthodontic products, despite ensuring patient safety and treatment efficacy
- In July 2023, according to the article published by ResearchGate, the study highlights that regulatory requirements in orthodontics often create barriers for orthodontists in adopting innovative technologies. These challenges include time-consuming approval processes, compliance with stringent safety standards, and the complexity of navigating local and international regulations. Such hurdles can delay the availability of new treatments and increase costs for practitioners and patients alike
In conclusion, regulatory compliance, although essential for maintaining safety and efficacy, creates significant challenges for manufacturers in the orthodontic sector. The costs and delays associated with meeting regulatory standards can inhibit innovation, increase the cost of treatment, and ultimately limit accessibility to the latest orthodontic technologies for both patients and providers.
- Lack of Awareness about Orthodontic Supplies
In various regions, the adoption of orthodontic supplies and treatments can be significantly hindered due to a lack of awareness. Many people are unaware of the advantages orthodontic treatments offer, such as enhancing oral health, improving self-esteem, and preventing more severe dental issues in the future. In addition, the understanding of modern orthodontic technologies, such as clear aligners, temporary skeletal anchorage devices (TSADs), and advanced braces, is often limited to only a few professionals and patients who are already involved in orthodontic care. Without widespread knowledge, potential patients may not recognize the need for orthodontic intervention, especially if they don't experience obvious dental problems. This can be compounded by misconceptions or misinformation about the treatment process, costs, or perceived discomfort, leading individuals to overlook orthodontic care altogether.
Furthermore, regions with less access to dental professionals or specialized care are more likely to face this awareness gap. In these areas, dental care may focus more on urgent, immediate needs rather than preventive or elective treatments like orthodontics. In addition, cultural factors and financial constraints can contribute to low demand for such services, as individuals may prioritize other health concerns over orthodontic procedures. The lack of widespread education on the long-term benefits of orthodontics, such as preventing tooth decay, gum disease, and other bite-related issues, also plays a significant role. As a result, potential patients in these areas are less likely to seek out orthodontic consultations or invest in orthodontic products.
The absence of awareness can also affect market growth by limiting the demand for orthodontic products and services. Companies that provide orthodontic supplies may struggle to expand in regions where demand is low, and they may face difficulties in educating both the public and dental professionals about the importance of investing in orthodontic care. This can reduce the overall sales potential of orthodontic supplies, as people may not realize the value these products provide in achieving better oral health and aesthetics. This lack of awareness ultimately hampers the ability of the orthodontic market to grow and thrive, especially in areas where the benefits of orthodontic care are not widely recognized.
For instance,
- In June 2024, according to the article published by ResearchGate, The study highlights that limited awareness of smartphone orthodontic apps among patients acts as a restraint in their adoption. Many individuals are unfamiliar with the availability and benefits of these apps, which can offer convenience and efficiency in orthodontic care. This knowledge gap reduces the potential market and usage
- In September 2024, according to the article published by BDJ, discusses challenges in orthodontic care, emphasizing that limited knowledge of advanced techniques and technologies can act as a restraint. Lack of awareness among patients and practitioners about newer treatment options or benefits can hinder their adoption, ultimately limiting the progress and growth of the orthodontic field
In conclusion, the lack of awareness about the benefits and importance of orthodontic supplies significantly limits the market's growth potential, especially in under-informed regions. By addressing this awareness gap through education, outreach programs, and community-based initiatives, it is possible to increase demand for orthodontic care, thereby boosting both market adoption and growth. Increasing public understanding of the long-term benefits of orthodontics is crucial to driving market expansion and ensuring that individuals in all regions have access to the care they need.
Global Orthodontic Supplies Market Market Scope
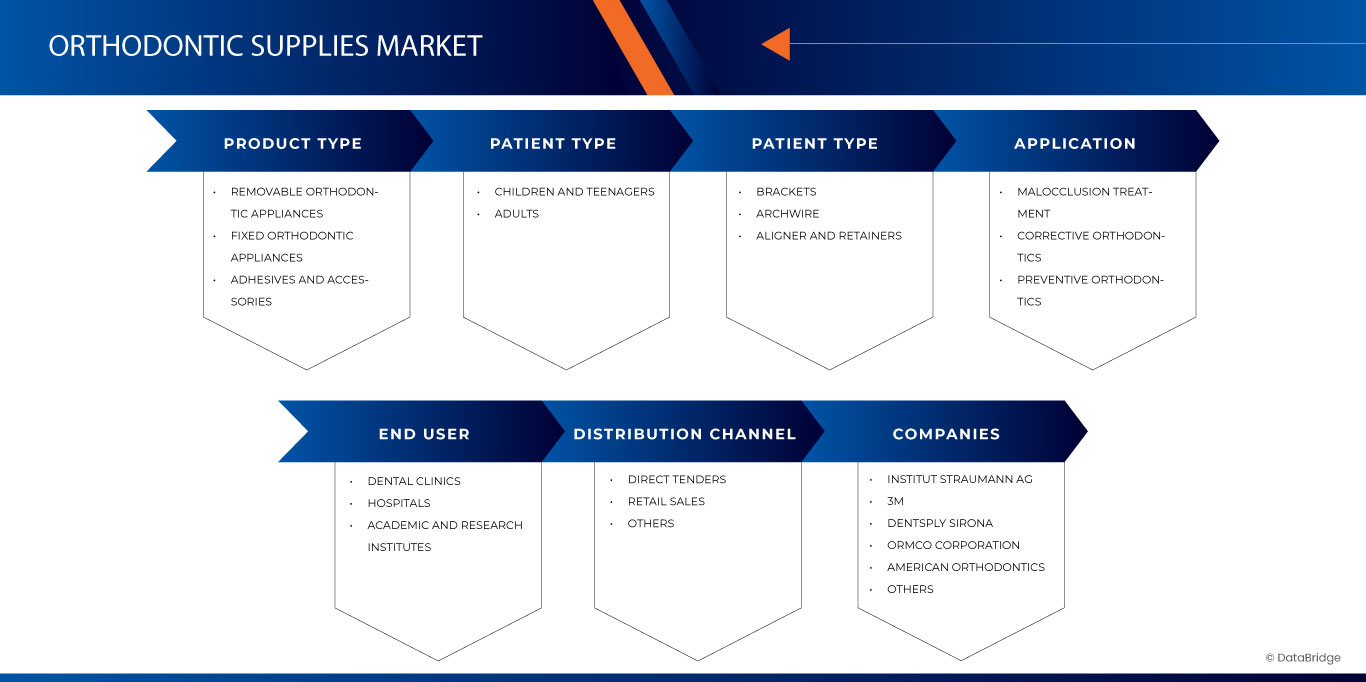
Global orthodontic supplies market is segmented into six notable segments based on product type, patient type, material type, application, end user, and distribution channel.The growth amongst these segments will help you analyze meagre growth segments in the industries and provide the users with a valuable market overview and market insights to help them make strategic decisions for identifying core market applications.
Product Type
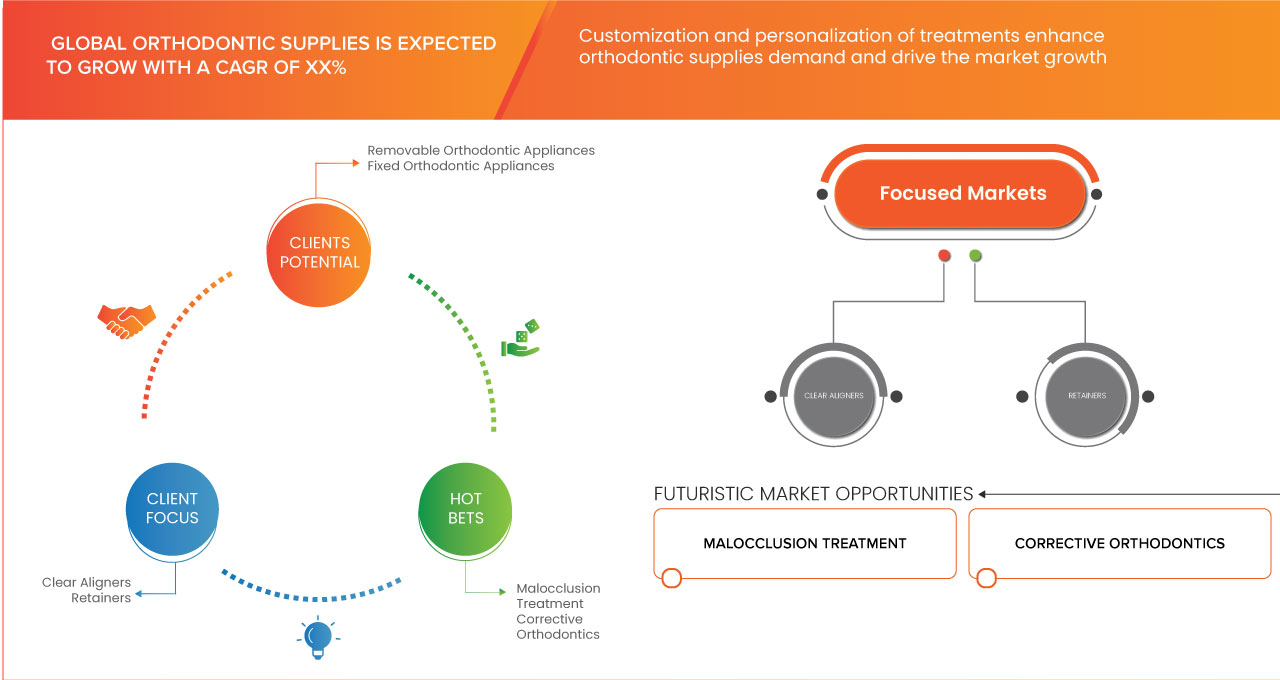
- Removable Orthodontic Appliances
- Clear Aligners
- Retainers
- Vacuum-Formed Retainers
- Hawley Retainers
- Fixed Orthodontic Appliances
- Brackets
- By Type
- Metal Brackets
- Ceramic Brackets
- Self-Ligating Brackets
- Lingual Brackets
- By Type
- Brackets
- By Type
- Bands And Buccal Tubes
- Miniscrews
- By Type
- Archwires
- Stainless Steel Archwires
- Beta Titanium Archwires
- Nickel Titanium Archwires
- Anchorage Appliances
- Brackets
- Adhesives And Accessories
- Elastomeric Products
- By Product Type
- Elastomeric Ligatures
- Elastomeric Chains
- By Product Type
- Orthodontic Adhesives
- Others
- Elastomeric Products
Patient Type
- Children And Teenagers
- Adults
Material Type
- Brackets
- Metal
- Ceramic
- Plastic
- Composite
- Archwire
- Stainless Steel Archwires
- Beta Titanium Archwires
- Nickel Titanium Archwires
- Aligner And Retainers
- Thermoplastics
- Polyurethane
- Polyethylene Terephthalate Glycol
- Others
Application
- Malocclusion Treatment
- Class I Malocclusion
- Class Ii Malocclusion
- Class Iii Malocclusion
- Corrective Orthodontics
- Preventive Orthodontics
End User
- Dental Clinics
- Hospitals
- Academic And Research Institutes
Distribution Channel
- Direct Tenders
- Retail Sales
- Others
Global Orthodontic Supplies Market Regional Analysis
The market is analyzed and market size insights and trends are provided country, product type, patient type, material type, application, end user, and, distribution channel as referenced above.
The countries covered in the market are U.S., Canada, Mexico, Germany, France, U.K., Italy, Spain, Russia, Netherlands, Switzerland, Turkey, Belgium, Sweden, Denmark, Finland, Norway, Poland, rest of Europe, Japan, China, India, South Korea, Australia, Singapore, Thailand, Malaysia, Indonesia, Vietnam, Philippines, Taiwan, New Zealand, rest of Asia-Pacific, Brazil, Argentina, rest of South America, South Africa, Saudi Arabia, U.A.E, Egypt, Kuwait, Israel, Qatar, Oman, Bahrain, and rest of Middle East & Africa.
North America is expected to dominate the Global Orthodontic Supplies Market due to technological advancements, increasing demand for aesthetic dental solutions, and expanding awareness of oral health.
Asia Pacific is expected to dominate the Global Orthodontic Supplies Market in the forecast period due to an expanding middle-class population, increasing healthcare expenditure, and growing awareness of orthodontic treatments.
The country section of the report also provides individual market impacting factors and changes in regulation in the market domestically that impacts the current and future trends of the market. Data points like down-stream and upstream value chain analysis, technical trends and porter's five forces analysis, case studies are some of the pointers used to forecast the market scenario for individual countries. Also, the presence and availability of global brands and their challenges faced due to large or scarce competition from local and domestic brands, impact of domestic tariffs and trade routes are considered while providing forecast analysis of the country data.
Global Orthodontic Supplies Market Share
The market competitive landscape provides details by competitor. Details included are company overview, company financials, revenue generated, market potential, investment in research and development, new market initiatives, global presence, production sites and facilities, production capacities, company strengths and weaknesses, product launch, product width and breadth, application dominance. The above data points provided are only related to the companies' focus related to market.
Global Orthodontic Supplies Market Leaders Operating in the Market Are:
- Ormco Corporation (U.S.)
- 3M (U.S.)
- American Orthodontics (U.S.)
- Dentsply Sirona (U.S.)
- Institut Straumann AG (Switzerland)
- Aditek do Brasil S.A. (Brazil)
- DENTAURUM GmbH & Co. KG (Germany)
- FORESTADENT - Bernhard Foerster GmbH (Germany)
- G&H Orthodontics (U.S.)
- Gestenco International AB (Sweden)
- Great Lakes Dental Technologies (U.S.)
Latest Developments Global Orthodontic Supplies Market
- In May 2022, the Straumann Group entered into an agreement to acquire PlusDental, a provider of orthodontic treatment solutions in Europe. This acquisition will enhance the Group's consumer expertise and unlock new growth opportunities. PlusDental has established an extensive network of clinics across Europe, which will help accelerate the Group’s expansion, particularly in the Netherlands, Sweden, and the UK
- In August 2022, Dentsply Sirona introduced the X-Smart Pro+ endodontic motor and Reciproc Blue file in the United States, offering a streamlined one-file endodontic solution. The X-Smart Pro+ motor delivers up to 7.5 N·cm torque and 3,000 rpm speed, featuring an integrated apex locator with Dynamic Accuracy technology for precise length measurement during active shaping. The Reciproc Blue file is designed for universal use, enabling root canal preparation without the need for an initial glide path in most cases. This combination simplifies endodontic procedures, enhancing efficiency and patient outcomes
- In August 2023, Ormco Corporation introduced Spark Clear Aligners Release 14, enhancing flexibility for orthodontists with the launch of Spark Approver Web and seamless DEXIS IOS integration, along with clinical and workflow updates. Spark Approver Web offers increased convenience, allowing orthodontists to access cases at any time, saving valuable time and improving workflow efficiency
- In March 2023, FORESTADENT partnered with Graphy Inc. to distribute their innovative Tera Harz TC-85 resin for direct aligner printing. This collaboration enables the creation of precisely tailored aligners with shape memory properties, improving treatment results with consistent light forces. The partnership also includes UNIZ Technology for compatible 3D printers, advancing digital orthodontics globally
- In August 2024, Henry Schein Orthodontics launched the Carrierer Motion Pro Bite appliance, designed to enhance orthodontic treatments by improving bite correction and tooth movement efficiency. This innovative device provides more predictable outcomes by delivering optimal force to correct bite misalignments. Its unique design helps shorten treatment time, reduce discomfort, and improve patient compliance. The Carrierer Motion Pro Bite is a valuable tool for orthodontists, offering enhanced precision and effectiveness. It also benefits patients by offering faster, more comfortable treatments, ultimately contributing to better orthodontic care and a higher rate of treatment success
SKU-

目录
1 INTRODUCTION
1.1 OBJECTIVES OF THE STUDY
1.2 MARKET DEFINITION
1.3 OVERVIEW OF THE GLOBAL ORTHODONTIC SUPPLIES MARKET
1.4 CURRENCY AND PRICING
1.5 LIMITATIONS
1.6 MARKETS COVERED
2 MARKET SEGMENTATION
2.1 MARKETS COVERED
2.2 GEOGRAPHICAL SCOPE
2.3 YEARS CONSIDERED FOR THE STUDY
2.4 DBMR TRIPOD DATA VALIDATION MODEL
2.5 MULTIVARIATE MODELLING
2.6 LIFELINE CURVE
2.7 PRIMARY INTERVIEWS WITH KEY OPINION LEADERS
2.8 DBMR MARKET POSITION GRID
2.9 DBMR MARKET POSITION END USER COVERAGE
2.1 VENDOR SHARE ANALYSIS
2.11 SECONDARY SOURCES
2.12 ASSUMPTIONS
3 EXECUTIVE SUMMARY
4 PREMIUM INSIGHTS
4.1 PORTER’S FIVE FORCES
4.2 PESTEL ANALYSIS
4.3 VALUE CHAIN ANALYSIS
4.4 COMPANY COMPARATIVE ANALYSIS
4.5 EVALUATION OF RETAIL VS. DISTRIBUTOR SALES MODELS AND DIRECT SALES STRATEGIES
5 GLOBAL ORTHODONTIC SUPPLIES MARKET: REGULATIONS
5.1.1 NORTH AMERICA (USA AND CANADA)
5.1.2 EUROPEAN UNION (EU)
5.1.3 ASIA-PACIFIC
5.1.4 LATIN AMERICA
5.1.5 MIDDLE EAST AND AFRICA
5.2 REGULATORY CHALLENGES AND STRATEGIES
6 MARKET OVERVIEW
6.1 DRIVERS
6.1.1 RISING INCIDENCE OF MALOCCLUSION DRIVING SURGE IN DENTAL BRACES DEMAND
6.1.2 INCREASING AESTHETIC PREFERENCES BOOST DEMAND FOR ORTHODONTIC PRODUCTS
6.1.3 TECHNOLOGICAL ADVANCEMENTS FUEL GROWTH IN ORTHODONTIC CARE
6.1.4 INCREASE IN DENTAL CARE EXPENDITURE
6.2 RESTRAINTS
6.2.1 REGULATORY REQUIREMENTS IN ORTHODONTICS
6.2.2 LACK OF AWARENESS ABOUT ORTHODONTIC SUPPLIES
6.3 OPPORTUNITIES
6.3.1 GROWING DEMAND FOR CLEAR ALIGNERS DRIVES GROWTH IN ORTHODONTIC SUPPLIES
6.3.2 INCREASED INSURANCE COVERAGE FOR ORTHODONTICS EXPANDS OPPORTUNITIES IN ORTHODONTIC SUPPLIES
6.3.3 CUSTOMIZATION AND PERSONALIZATION OF TREATMENTS ENHANCE ORTHODONTIC SUPPLIES MARKET DEMAND
6.4 CHALLENGES
6.4.1 ADVERSE EFFECTS FROM POOR TREATMENT HINDER PROGRESS IN ORTHODONTICS
6.4.2 SHORTAGE OF SKILLED PROFESSIONALS LIMITS ADVANCEMENTS IN ORTHODONTIC FIELD
7 GLOBAL ORTHODONTIC SUPPLIES MARKET, BY PRODUCT TYPE
7.1 OVERVIEW
7.2 REMOVABLE ORTHODONTIC APPLIANCES
7.2.1 CLEAR ALIGNERS
7.2.2 RETAINERS
7.2.2.1 VACUUM-FORMED RETAINERS AND
7.2.2.2 HAWLEY RETAINERS
7.3 FIXED ORTHODONTIC APPLIANCES
7.3.1 BRACKETS
7.3.1.1 METAL BRACKETS
7.3.1.2 CERAMIC BRACKETS
7.3.1.3 SELF-LIGATING BRACKETS
7.3.1.4 LINGUAL BRACKETS
7.3.1.4.1 BANDS AND BUCCAL TUBES
7.3.1.4.2 MINISCREWS
7.3.2 ARCHWIRES
7.3.2.1 STAINLESS STEEL ARCHWIRES
7.3.2.2 BETA TITANIUM ARCHWIRES
7.3.2.3 NICKEL TITANIUM ARCHWIRES
7.3.3 ANCHORAGE APPLIANCES
7.3.4 OTHERS
7.4 ADHESIVES AND ACCESSORIES
7.4.1 ELASTOMERIC PRODUCTS
7.4.1.1 ELASTOMERIC LIGATURES
7.4.1.2 ELASTOMERIC CHAINS
7.4.2 ORTHODONTIC ADHESIVES
7.4.3 OTHERS
8 GLOBAL ORTHODONTIC SUPPLIES MARKET, BY PATIENT TYPE
8.1 OVERVIEW
8.2 CHILDREN AND TEENAGERS
8.3 ADULTS
9 GLOBAL ORTHODONTIC SUPPLIES MARKET, BY MATERIAL TYPE
9.1 OVERVIEW
9.2 BRACKETS
9.2.1 METAL
9.2.2 CERAMIC
9.2.3 PLASTIC
9.2.4 COMPOSITE
9.3 ARCHWIRE
9.3.1 STAINLESS STEEL ARCHWIRES
9.3.2 BETA TITANIUM ARCHWIRES
9.3.3 NICKEL TITANIUM ARCHWIRES
9.4 ALIGNER AND RETAINERS
9.4.1 THERMOPLASTICS
9.4.2 POLYURETHANE
9.4.3 POLYETHYLENE TEREPHTHALATE GLYCOL
9.4.4 OTHERS
10 GLOBAL ORTHODONTIC SUPPLIES MARKET, BY APPLICATION
10.1 OVERVIEW
10.2 MALOCCLUSION TREATMENT
10.2.1 CLASS I MALOCCLUSION
10.2.2 CLASS II MALOCCLUSION
10.2.3 CLASS III MALOCCLUSION
10.3 CORRECTIVE ORTHODONTICS
10.4 PREVENTIVE ORTHODONTICS
11 GLOBAL ORTHODONTIC SUPPLIES MARKET, BY END USER
11.1 OVERVIEW
11.2 DENTAL CLINICS
11.3 HOSPITALS
11.4 ACADEMIC AND RESEARCH INSTITUTES
12 GLOBAL ORTHODONTIC SUPPLIES MARKET, BY DISTRIBUTION CHANNEL
12.1 OVERVIEW
12.2 DIRECT TENDERS
12.3 RETAIL SALES
12.4 OTHERS
13 GLOBAL ORTHODONTIC SUPPLIES MARKET, BY REGION
13.1 OVERVIEW
13.2 NORTH AMERICA
13.2.1 U.S.
13.2.2 CANADA
13.2.3 MEXICO
13.3 EUROPE
13.3.1 GERMANY
13.3.2 U.K.
13.3.3 FRANCE
13.3.4 ITALY
13.3.5 SPAIN
13.3.6 RUSSIA
13.3.7 NETHERLANDS
13.3.8 SWITZERLAND
13.3.9 TURKEY
13.3.10 BELGIUM
13.3.11 SWEDEN
13.3.12 POLAND
13.3.13 DENMARK
13.3.14 NORWAY
13.3.15 FINLAND
13.3.16 REST OF EUROPE
13.4 ASIA-PACIFIC
13.4.1 CHINA
13.4.2 JAPAN
13.4.3 INDIA
13.4.4 SOUTH KOREA
13.4.5 AUSTRALIA
13.4.6 TAIWAN
13.4.7 SINGAPORE
13.4.8 THAILAND
13.4.9 MALAYSIA
13.4.10 INDONESIA
13.4.11 PHILIPPINES
13.4.12 NEW ZEALAND
13.4.13 VIETNAM
13.4.14 REST OF ASIA-PACIFIC
13.5 SOUTH AMERICA
13.5.1 BRAZIL
13.5.2 ARGENTINA
13.5.3 REST OF SOUTH AMERICA
13.6 MIDDLE EAST AND AFRICA
13.6.1 SOUTH AFRICA
13.6.2 SOUTH ARABIA
13.6.3 U.A.E
13.6.4 EGYPT
13.6.5 ISRAEL
13.6.6 KUWAIT
13.6.7 QATAR
13.6.8 OMAN
13.6.9 BAHRAIN
13.6.10 REST OF MIDDLE EAST AND AFRICA
14 GLOBAL ORTHODONTIC SUPPLIES MARKET: COMPANY LANDSCAPE
14.1 COMPANY SHARE ANALYSIS: GLOBAL
14.2 COMPANY SHARE ANALYSIS: NORTH AMERICA
14.3 COMPANY SHARE ANALYSIS: EUROPE
14.4 COMPANY SHARE ANALYSIS: ASIA-PACIFIC
15 SWOT ANALYSIS
16 COMPANY PROFILE
16.1 INSTITUT STRAUMANN AG
16.1.1 COMPANY SNAPSHOT
16.1.2 REVENUE ANALYSIS
16.1.3 COMPANY SHARE ANALYSIS
16.1.4 PRODUCT PORTFOLIO
16.1.5 RECENT DEVELOPMENTS
16.2 3M
16.2.1 COMPANY SNAPSHOT
16.2.2 REVENUE ANALYSIS
16.2.3 COMPANY SHARE ANALYSIS
16.2.4 PRODUCT PORTFOLIO
16.2.5 RECENT DEVELOPMENT
16.3 DENTSPLY SIRONA
16.3.1 COMPANY SNAPSHOT
16.3.2 REVENUE ANALYSIS
16.3.3 COMPANY SHARE ANALYSIS
16.3.4 PRODUCT PORTFOLIO
16.3.5 RECENT DEVELOPMENT
16.4 ORMCO CORPORATION
16.4.1 COMPANY SNAPSHOT
16.4.2 COMPANY SHARE ANALYSIS
16.4.3 PRODUCT PORTFOLIO
16.4.4 RECENT DEVELOPMENTS
16.5 AMERICAN ORTHODONTICS
16.5.1 COMPANY SNAPSHOT
16.5.2 COMPANY SHARE ANALYSIS
16.5.3 PRODUCT PORTFOLIO
16.5.4 RECENT DEVELOPMENTS
16.6 ADITEK DO BRASIL S.A.
16.6.1 COMPANY SNAPSHOT
16.6.2 PRODUCT PORTFOLIO
16.6.3 RECENT DEVELOPMENT
16.7 DENTAURUM GMBH & CO. KG
16.7.1 COMPANY SNAPSHOT
16.7.2 PRODUCT PORTFOLIO
16.7.3 RECENT DEVELOPMENT
16.8 FORESTADENT BERNHARD FÖRSTER GM
16.8.1 COMPANY SNAPSHOT
16.8.2 PRODUCT PORTFOLIO
16.8.3 RECENT DEVELOPMENT
16.9 GESTENCO INTERNATIONAL AB
16.9.1 COMPANY SNAPSHOT
16.9.2 PRODUCT PORTFOLIO
16.9.3 RECENT DEVELOPMENT
16.1 G&H ORTHODONTICS
16.10.1 COMPANY SNAPSHOT
16.10.2 PRODUCT PORTFOLIO
16.10.3 RECENT DEVELOPMENT
16.11 GREAT LAKES DENTAL TECHNOLOGIES
16.11.1 COMPANY SNAPSHOT
16.11.2 PRODUCT PORTFOLIO
16.11.3 RECENT DEVELOPMENT
16.12 HENRY SCHEIN, INC
16.12.1 COMPANY SNAPSHOT
16.12.2 REVENUE ANALYSIS
16.12.3 PRODUCT PORTFOLIO
16.12.4 RECENT DEVELOPMENT
16.13 LEONE S.P.A
16.13.1 COMPANY SNAPSHOT
16.13.2 PRODUCT PORTFOLIO
16.13.3 RECENT DEVELOPMENT
16.14 LIGHTFORCE
16.14.1 COMPANY SNAPSHOT
16.14.2 PRODUCT PORTFOLIO
16.14.3 RECENT DEVELOPMENT
16.15 MODERN ORTHODONTICS
16.15.1 COMPANY SNAPSHOT
16.15.2 PRODUCT PORTFOLIO
16.15.3 RECENT DEVELOPMENT
16.16 ORTHOAMERICA HOLDINGS LLC
16.16.1 COMPANY SNAPSHOT
16.16.2 PRODUCT PORTFOLIO
16.16.3 RECENT DEVELOPMENT
16.17 SHINYE ORTHODONTIC PRODUCTS CO.,LTD.
16.17.1 COMPANY SNAPSHOT
16.17.2 PRODUCT PORTFOLIO
16.17.3 RECENT DEVELOPMENT
16.18 TP ORTHODONTICS, INC.
16.18.1 COMPANY SNAPSHOT
16.18.2 PRODUCT PORTFOLIO
16.18.3 RECENT DEVELOPMENT
17 QUESTIONNAIRE
18 RELATED REPORTS
表格列表
表1 技术信息化和计算机化
表2 竞争力和弱点
表3 按公司分列的增长机会
表4 按产品类别分列的价格损失
表5 竞争定价比较(清征V.B.B.
表6 零售商、分销商、直销商、销售商、销售商和销售商的比较
表7 2018-2032年按产品类型分列的全球整形产品市场(千美元)
表8 2018-2032年按区域分列的其他资源市场中全球可再生能源应用情况(千美元)
表9 2018-2032年按产品类型分列的市场上全球可变性应用情况(千美元)
表10 2018-2032年按产品类型分列的矫形产品市场全球滞留人员(千人)
表11 2018-2032年按区域分列的在ORTHONY Supplices市场中的全球固定器官应用(美元)
表12 2018-2032年按产品类型分列的矫形市场中全球固定矫形应用情况(千美元)
表13 2018-2032年按类型分列的ORTHONY Supplies市场全球裂缝(千分之一)
表14 按构成部分分列的2018至2032年矫形产品市场全球破损情况(千美元)
表15 2018-2032年按类型分列的矫形用品市场全球弹药数量(千美元)
表16 2018-2032年按区域分列的矫形产品市场全球动态和准入情况(千美元)
表17 2018-2032年按产品分列的矫形产品市场的全球公益性和准入情况(千美元)
表18 2018-2032年按产品分列的矫形产品市场的全球通行和准入情况(千美元)
表19 2018-2032年按Patient类型分列的全球矫形产品市场(千美元)
表20. 2018-2032年按区域分列的矫形产品市场上的全球儿童和青少年(千)
表21 2018-2032年按区域分列的矫形产品市场上的全球青少年(千美元)
表22 2018-2032年按材料类型分列的全球矫形产品市场(千美元)
表23 2018-2032年按区域分列的ORTHONY Supplies市场的全球裂缝(千美元)
表24 2018-2032年按类型分列的矫形用品市场全球破损(千美元)
表25 2018-2032年按区域分列的矫形用品市场的全球弹药量(千美元)
表26 2018-2032年按类型分列的矫形用品市场全球弹药(千美元)
表27 2018-2032年按区域分列的表27 其他资源市场中的全球移民和被拘留者(千美元)
表28 2018-2032年按类型分列的表28 表28 其他资源市场中的全球移民和被拘留者(千美元)
表29 2018-2032年按申请分列的全球矫形市场(千美元)
表30 2018-2032年按区域分列的矫形产品市场全球马来文处理情况(千美元)
表31 2018-2032年按申请分列的矫形产品市场全球马来文处理情况(千美元)
表32 2018-2032年按区域分列的ORTHONY Supplement市场中的全球毒瘤(千分之一)
表33 2018-2032年按区域分列的ORTHONY Supplies市场中的全球预防性肿瘤(千分之一)
表34 2018-2032年按最终用户分列的全球矫形产品市场(千美元)
表35 2018-2032年按区域分列的直肠市场全球本地联系人(千美元)
表36 2018-2032年按区域分列的矫形市场全球医院(千美元)
表37 2018-2032年按区域分列的其他资源市场的全球科学和研究机构(千美元)
表38 2018-2032年按分销部门分列的全球矫形产品市场(千美元)
表39 2018-2032年按区域分列的其他资源市场全球直接交易额(千美元)
表40 2018-2032年按区域分列的其他资源市场全球可再生能源销售情况(千美元)
表41 按区域分列的2018-2032年矫形市场全球其他产品(千美元)
表42 2018-2032年按区域分列的全球整形产品市场(千美元)
表43 2018-2032年按国家分列的北美矫形市场(千美元)
表44 2018-2032年按产品类型分列的北美矫形商品市场(千美元)
表45. 2018-2032年按产品类型分列的北美在ORTHONY Supplices市场上的可变性应用(美元)
表46 2018-2032年按产品类型分列的北美ORTHONY Supplies市场被拘留者(10万美元)
表47 2018-2032年按产品类型分列的北美半导体市场中半导体应用量(千)
表48 2018-2032年按类型分列的北美半导体市场(千美元)
表49 2018-2032年按构成部分分列的北美半径市场
表50 2018-2032年按类型分列的北美ORTHONY Supplies市场中的弹药(千分之一)
表51 2018-2032年按产品分列的北美ORTHONY Supplic SMAK 市场的补贴和准入情况(千美元)
表52 2018-2032年按产品类型分列的北美矫形产品市场
表53 2018-2032年按Patient类型分列的北美矫形商品市场(千美元)
表54 2018-2032年按材料类型分列的北美矫形市场(千美元)
表55 2018-2032年按类型分列的北美ORTHONY Supplies市场中的损失(千美元)
表56 2018-2032年按类型分列的北美ORTHONY Supplies市场中的阿图克(美元)
表57 2018-2032年按类型分列的北方美国在ORTHONICY Supplike市场中的人数和滞留人数(千美元)
表58 2018-2032年按申请分列的北美矫形商品市场(千美元)
表59 2018-2032年按申请分列的北美矫形产品市场上的马来文处理情况(美元)
表60 2018-2032年按终端用户分列的北美矫形产品市场(千美元)
表61 2018-2032年按分销部门分列的北美矫形商品市场(千美元)
表62 美国矫形产品市场,按产品类型分列,2018-2032年(美元)
表63 2018-2032年按产品类型列示的美国在ORTHONITIC SUPLES市场中可移植的矫形应用(美元)
表64 2018-2032年按产品类型分列的美国ORTHODONTION SUPLINT MAKET中的保留人(美元)
表65 2018-2032年按产品类型分列的在ORTHONTICS市场上的美国半导体应用(美元)
表66. 按类型分列的2018-2032年美国ORTHONITIC SUPLINTHE MARKET(美元)
表67. 按构成部分分列的2018至2032年美国矫形产品市场上的碎块(美元)
表68 2018-2032年按类型分列的美国ORTHONICY Supplies市场中的阿瑟克(美元)
表69 2018-2032年按产品分列的美国ORTHONTION Supplices市场的捐赠和获得情况(美元)
表70. 按产品类型分列的2018-2032年美国矫形产品市场中的电子产品(千美元)
表71 美国矫形产品市场,按Patient类型分列,2018-2032年(美元)
表72 美国整形产品市场,按材料类型分列,2018-2032年(美元)
表73. 按类型分列的2018-2032年美国ORTHONTIC SUPLING 市场中的损失(美元)
表74. 按类型分列的2018-2032年美国ORTHONTY Supplies市场中的阿瑟(美元)
表75. 按类型分列的2018-2032年美国ORTHONITIC SUPLINE 市场上的外籍人士和被拘留者(美元)
表76 美国矫形产品市场,按申请分列,2018-2032年(美元)
表77. 按申请分列的2018-2032年美国对矫形用品市场的治疗(美元)
表78 美国矫形产品市场,按最终用户分列,2018-2032年(美元)
表79 美国矫形产品市场,按销售CHANNEL,2018-2032年(千美元)
表80 加拿大矫形产品市场,按产品类型分列,2018-2032年(千美元)
表81. 2018-2032年按产品类型分列的加拿大在ORTHONY Supplices市场上的可改性器官应用(美元)
表82 2018-2032年按产品类型分列的加拿大在ORTHONICY Supplies市场上的滞留者(千美元)
表83 2018-2032年按产品类型分列的加拿大在ORTHONICT市场上的固态应用
表84 2018-2032年按类型分列的加拿大在ORTHONICY Supplies市场中的裂口(美元)
表85 2018-2032年按构成部分分列的加拿大在ORTHONICY Supplies市场中的裂痕(千分之一)
表86 2018-2032年按类型分列的加拿大矫形用品市场上的阿瑟克(千美元)
表87 2018-2032年按产品分列的加拿大在ORTHONY Supplic SMAK 市场上的补贴和获得情况(美元)
表88. 2018-2032年按产品类型分列的加拿大在ORTHONTION Supplic SMK市场上的
表89 2018-2032年加拿大陆生商品市场,按类型分列(千美元)
表90. 2018-2032年按材料类型分列的加拿大矫形产品市场(千美元)
表91 2018-2032年按类型分列的加拿大在ORTHONICY Supplies市场中的损失(千美元)
表92 2018-2032年按类型分列的加拿大矫形用品市场上的阿瑟尔(10万美元)
表93 2018-2032年按类型分列的加拿大在ORTHONY Supplies市场中的代表和居留者(千美元)
表94 加拿大矫形产品市场,按申请分列,2018-2032年(美元)
表95. 2018-2032年按申请分列的加拿大在ORTHONICTION SUPLING市场上的马来文处理情况(美元)
表96 加拿大矫形产品市场,按最终用户分列,2018-2032年(千美元)
表97 2018-2032年加拿大矫形产品市场,按销售商品分列(千)
表98 2018-2032年按产品类型分列的墨西哥矫形产品市场(千美元)
表99 2018-2032年按产品类型分列的有机物市场中可降解有机物应用情况(千)
表100. 按产品类型分列的2018-2032年按有机物市场分列的墨西哥滞留人员(千美元)
表101 2018-2032年按产品类型分列的墨西哥在ORTHONITIC SUPLES市场中的半导体应用(美元)
表102 2018-2032年按类型分列的北美产品市场上的墨西哥钻石
表103 2018-2032年按构成部分分列的有机物市场墨西哥仓储量(千美元)
表104 2018-2032年按类型分列的矫形产品市场上的墨西哥弹药(千美元)
表105 2018-2032年按产品分列的墨西哥在ORTHONY SUPLEST市场上的复苏和准入情况(千美元)
表106 2018-2032年按产品类型分列的北美市场墨西哥电子产品(千美元)
表107 2018-2032年按农药类型分列的墨西哥矫形产品市场(千美元)
表108 2018-2032年按材料类型分列的墨西哥整形产品市场(千美元)
表109 2018-2032年按类型分列的墨西哥在ORTHONICY Supplies市场中的碎块(美元)
表110 2018-2032年按类型分列的矫形产品市场上的墨西哥弹药(千美元)
表111 2018-2032年按类型分列的北美市场上的墨西哥移民和被拘留者(千美元)
表112 2018-2032年按申请分列的墨西哥矫形商品市场(千美元)
表113. 2018-2032年按申请分列的墨西哥在ORTHONATICS SUPLING市场中的治疗(美元)
表114 按最终用户分列的2018-2032年墨西哥整形商品市场(千美元)
表115 2018-2032年按分销部门分列的墨西哥整形商品市场(千美元)
表116 2018-2032年按国家分列的欧洲矫形商品市场(千美元)
表117 按产品类型分列的2018-2032年欧洲ORTHONICY市场(千美元)
表118 2018-2032年按产品类型分列的市场中欧洲可变性应用量(千)
表119 2018-2032年按产品类型分列的矫形用品市场上的欧洲难民(千)
表120. 2018-2032年按产品类型分列的矫形产品市场上的欧洲固态应用(千美元)
表121 2018-2032年按类型分列的矫形用品市场上的欧洲碎块(千美元)
表122 2018-2032年按构成部分分列的矫形产品市场上的欧洲碎块(千美元)
表123 2018-2032年按类型分列的矫形用品市场中的欧洲弹药(千美元)
表124 2018-2032年按产品分列的欧洲ORTHONY Supplic European SMAKT 市场上的自助和准入情况(千美元)
表125 2018-2032年按产品类型分列的矫形产品市场上的欧洲电子产品(千美元)
表126 2018-2032年按Patient类型分列的欧洲矫形商品市场(千美元)
表127 2018-2032年按材料类型分列的欧洲ORTHODON Supplies市场(千美元)
表128 2018-2032年按类型分列的矫形用品市场上的欧元碎块(千美元)
表129 2018-2032年按类型分列的ORTHONY Supplies市场中的欧洲弹药(千美元)
表130 2018-2032年按类型分列的在ORTHONICY SUPLES市场中的欧洲移民和居留者(千美元)
表131 2018-2032年按申请分列的欧洲矫形商品市场(千美元)
表132 2018-2032年按申请分列的欧洲在ORTHONICLUTION SUPLET市场中的待遇(美元)
表133 按最终用户分列的2018-2032年欧洲矫形商品市场(千美元)
表134 2018-2032年按分销部门分列的欧洲整形商品市场(千美元)
表135 2018-2032年按产品类型分列的德国整形商品市场(千美元)
表136 2018-2032年按产品类型分列的德国在ORTHONTICS市场上的可变性应用(美元)
表137 按产品类型分列的德国在ORTHONICT市场中的滞留者,2018-2032年(千美元)
表138 2018-2032年按产品类型分列的德国在ORTHONITICS市场上的固定用途
表139 按类型分列的2018至2032年德国在矫形产品市场上的
表140 按构成部分分列的德国在矫形产品市场上的车辆,2018-2032年(千)
表141 按类型分列的2018至2032年德国ORTHONY Supplies市场中的德国弹药(千分之一)
表142 2018-2032年按产品分列的德国ORTHONY Supplic SMAK 市场的复苏和准入情况(千美元)
表143 2018-2032年按产品类型分列的德国在ORTHONY SUPLES市场中的电子产品(千美元)
表144 德国整形商品市场,按Patient类型分列,2018-2032年(美元)
表145 按材料类型分列的德国骨骼市场,2018-2032年(千美元)
表146 按类型分列的德国在矫形用品市场上的车辆,2018-2032年(千美元)
表147 按类型分列的2018-2032年德国ORTHONATY ARCHIRE市场(千美元)
表148 按类型分列的2018-2032年德国在矫形用品市场上的
表149 德国整形商品市场,按申请分列,2018-2032年(美元)
表150 按申请分列的2018-2032年德国在矫形用品市场上的治疗情况(美元)
表151 德国整形商品市场,按最终用户分列,2018-2032年(千美元)
表152 德国整形商品市场,按分销商品分列,2018-2032年(千美元)
表153 2018-2032年按产品类型分列的英国整形商品市场(千美元)
表154 2018-2032年按产品类型分列的在ORTHONY Supplices市场上的可变性应用(美元)
表155 2018-2032年按产品类型列示的ORTHONY Supplies市场中的英国难民(美元)
表156 2018-2032年按产品类型分列的在ORTHONTICS市场中的固定矫形应用(美元)
表157. 按类型分列的2018-2032年英国ORTHONITIC SUPLINTHE MAKETES(美元)
表158. 按构成部分分列的2018-2032年英国在ORTHONICY Supplits市场上的破损情况(美元)
表 159 U.K. ArCHWires in Orthodonic Suppets Market, 按类型分列 2018-2032年 (美元)
表160 2018-2032年按产品分类的ORTHONY Supplic SMAK市场中的损失和损失(千美元)
表161 2018-2032年按产品类型列示的有机物市场上的美国电子产品(千美元)
表162 2018-2032年按Patient Type(美元)分列的骨骼制品市场
表163 按材料类型分列的2018-2032年英国矫形产品市场(千美元)
表164 按类型分列的2018-2032年按骨骼类产品市场中的U.K.
表165 按类型分列的2018-2032年英国ORTHONY Supplies市场中的ArCHWire(美元)
表166 2018-2032年按类型分列的在ORTHONICY Supplies市场中的美国定居者和被拘留者(美元)
表167 按申请分列的2018-2032年英国矫形产品市场(千美元)
表168 按申请分列的2018-2032年按矫形产品市场分列的陵墓处理情况(美元)
表169 按最终用户分列的2018-2032年英国整形商品市场(千美元)
表170 U.K.ORTHODONTIC Supplies Market, 按分配CHANNEL, 2018-2032年 (美元)
表171 法国矫形市场,按产品类型分列,2018-2032年(千美元)
表172 按产品类型分列的法国在ORTHONTICS市场上的可变性应用,2018-2032年(千美元)
表173 按产品类型分列的法国在矫形用品市场上的滞留者,2018-2032年(千美元)
表174 2018-2032年按产品类型分列的法国在ORTHONTICS SUPLES市场中可加工的矫形制剂(美元)
表175 按类型分列的2018-2032年法国在ORTHONTIC SUPLES市场中的裂口(美元)
表176 按构成部分分列的法国在ORTHONY Supplies市场中的裂缝,2018-2032年(千分之一)
表177 2018-2032年按类型分列的法国矫形用品市场上的弹药(千分之一)
表178 2018-2032年按产品分列的法国ORTHONTHONY Supplices市场的补贴和准入情况(千美元)
表179 2018-2032年按产品类型分列的法国出口农产品
表180 法国矫形商品市场,按购买类型分列,2018-2032年(千美元)
表181 法国矫形市场,按材料类型分列,2018-2032年(千美元)
表182 按类型分列的 2018-2032年按类型分列的
表183 2018-2032年按类型分列的法国ORTHONATIC SUPINE市场中的法国弹药(千分之一)
表184 按类型分列的2018-2032年法国在ORTHONICY Supplike市场中的联系人和扣留人(千人)
表185 法国矫形市场,按申请分列,2018-2032年(千美元)
表186 法国在ORTHONY Supplications市场中的待遇,按申请分列,2018-2032年(千分之一)
表187 法国矫形市场,按最终用户分列,2018-2032年(千美元)
表188 法国矫形产品市场,按分销部门分列,2018-2032年(千美元)
表189 按产品类型分列的2018-2032年意大利矫形产品市场(千美元)
表190 2018-2032年按产品类型分列的在ORTHONY SUPLES市场中可转移性器官应用情况(美元)
表191 按产品类型分列的2018-2032年
表192 2018-2032年按产品类型分列的在ORTHONTHON SPULES市场中已完全固定的矫形应用(美元)
表193 按类型分列的2018-2032年市场中意大利进口商品(千美元)
表194 按构成部分分列的2018-2032年市场中意大利进口商品(千美元)
表195 2018-2032年按类型分列的直肠制品市场上的ITAY Artures(十万美元)
表196 2018-2032年按产品分列的矫形用品市场上的意大利药品和准入情况(千美元)
表197 按产品类型分列的2018-2032年手工制品市场中的意大利电子产品(千美元)
2018-2032年按Patient类型分列的ITAY ORTHONY Supplies市场(美元)
表199 2018-2032年按材料类型分列的ITAY ORTHONTION Supplies市场(美元)
表200 ITALY 市场上的ORTHONY Supplies,按类型,2018-2032年(美元)
表201 2018-2032年按类型分列的直肠市场中ITAY Artubeire(千分之一)
表202 2018-2032年按类型分列的在矫形用品市场上的岩溶剂和滞留剂(千美元)
表203 2018-2032年按申请分列的ITAY ORTHONICY Supplits市场(美元)
表204 2018-2032年按申请分列的半导体市场对有机物的治疗(千)
表205 2018-2032年按终端用户分列的意大利矫形产品市场(千美元)
表206 2018-2032年按分销部门分列的意大利矫形产品市场(千美元)
表207 按产品类型分列的2018-2032年西班牙矫形商品市场(千美元)
表208 2018-2032年按产品类型分列的在ORTHONY Supplices市场上的可变性应用(美元)
表209 按产品类型分列的2018至2032年ORTHONY Supplies市场中的西班牙人(美元)
表210 2018-2032年按产品类型分列的在ORTHONY Supplices市场中填充的螺旋桨应用量(美元)
表211 表211 按类型分列的2018-2032年市场中
表212 骨骼用品市场中的螺旋桨,按构成部分分列,2018-2032年(美元)
表213:按类型分列的2018-2032年陆地用品市场上的西班牙弹药(千美元)
表214 2018-2032年按产品分类的ORTHONY Supplic SMAK 市场上的西班牙补贴和准入情况(美元)
表215 按产品类型分列的2018-2032年ORTHONTHONY Supplic Market市场上的西班牙电子产品(美元)
表216 西班牙矫形产品市场,按农药类型分列,2018-2032年(美元)
表217 按材料类型分列的2018-2032年西班牙矫形商品市场(千美元)
表218 表218 按类型分列的矫形用品市场,2018-2032年 (千美元)
表219 按类型分列的2018-2032年陆地产品市场上的西班牙弹药(千美元)
2018-2032年按类型分列的表220
表221 2018-2032年按申请分列的西班牙矫形产品市场(千美元)
表222 按申请分列的2018至2032年在ORTHONICY Supplications市场上的西班牙马来文处理情况(美元)
表223 按终端用户分列的2018-2032年西班牙矫形产品市场(千美元)
表224 按分销部门分列的2018-2032年西班牙矫形产品市场(千美元)
表225 2018-2032年按产品类型分列的俄罗斯矫形商品市场(千美元)
表226 2018-2032年按产品类型分列的俄罗斯在ORTHONY Supplices市场上的可变性应用(美元)
表227 按产品类型分列的俄罗斯在ORTHONY Supplies市场中的滞留者,2018-2032年(千美元)
表228 2018-2032年按产品类型分列的俄罗斯在ORTHONY SUPLES市场中可加工的矫形制剂(美元)
表229 2018-2032年按类型分列的俄罗斯在ORTHONICY Supplies市场中的裂口(千分之一)
表230 按构成部分分列的2018-2032年俄罗斯在ORTHONICA Supplements市场中的裂口(千分之一)
表231 2018-2032年按类型分列的俄罗斯在ORTHONATIC SUPLES市场中的亚美尼亚(千美元)
表232 2018-2032年按产品分列的俄罗斯ORTHONY Supplic SMAK 市场的复苏和准入情况(千美元)
表233 2018-2032年按产品类型分列的俄罗斯在ORTHONICY SUPPLET市场中的电子产品(千美元)
表234 2018-2032年按Patient类型分列的俄罗斯矫形商品市场(千美元)
表235 2018-2032年按材料类型分列的俄罗斯ORTHONICY市场(千分之一)
表236 2018-2032年按类型分列的俄罗斯在ORTHONY Supplies市场中的裂缝(千分之一)
表237 2018-2032年按类型分列的俄罗斯在矫形产品市场中的亚美尼亚(千美元)
表238 2018-2032年按类型分列的俄罗斯市场上的
表239 2018-2032年按申请分列的俄罗斯矫形商品市场(千美元)
表240 俄克拉何马州在ORTHONY Supplications市场的待遇,按申请分列,2018-2032年(千分之一)
表241 2018-2032年按最终用户分列的俄罗斯矫形商品市场(千美元)
表242 2018-2032年按分销部门分列的俄罗斯ORTHONTION Supplices市场(千美元)
表243 2018-2032年按产品类型分列的荷兰矫形产品市场(千美元)
表244 2018-2032年按产品类型分列的荷兰在ORTHONY Supplements市场上的可变性应用(美元)
表245 按产品类型分列的2018-2032年荷兰在ORTHONY Supplies市场中的滞留者(美元)
表246 2018-2032年按产品类型分列的荷兰在ORTHONY Supplices市场上的固定矫形应用情况(美元)
表247 按类型分列的2018-2032年荷兰在ORTHONY Supplies市场中的碎块(美元)
表248 2018-2032年按构成部分开列的荷兰在ORTHONY Supplies市场中的碎片(千分之一)
表249 按类型分列的2018-2032年荷兰在ORTHONY Supplies市场中的弹药(千分之一)
表250 2018-2032年按产品分列的其他资源和进口市场
表251 2018-2032年按产品类型分列的挪威出口农产品市场
表252 2018-2032年按农药类型分列的荷兰矫形商品市场(千美元)
表253 2018-2032年按材料类型分列的荷兰矫形商品市场(千美元)
表254 按类型分列的2018-2032年荷兰在ORTHONY Supplies市场中的碎块(美元)
表255 按类型分列的2018-2032年荷兰ORTHONY Supplies市场中的阿姆斯特里(千分之一)
表256 2018-2032年按类型分列的在ORTHONICY Supplies市场上的荷兰籍居民和居留者(千)
表257 2018-2032年按申请分列的荷兰矫形商品市场(千美元)
表258 2018-2032年按申请分列的荷兰在ORTHONY SUPLING市场上的治疗情况(美元)
表259 按终端用户分列的2018-2032年荷兰矫形市场(千美元)
表260 2018-2032年按分布情况分列的荷兰ORTHONY Supplies市场(千美元)
表261 2018-2032年按产品类型分列的瑞士整形商品市场(千美元)
表262 2018-2032年按产品类型分列的其他资源市场中可移植性器官应用量(千)
表263 2018-2032年按产品类型列示的瑞士在ORTHONY SUPLES市场中的滞留者(美元)
表264 2018-2032年按产品类型分列的瑞典在ORTHONY SUPINCAL公司市场上的固定用途
表265 2018-2032年按类型分列的其他资源市场瑞士银行
表266 2018-2032年按构成部分分列的其他资源市场中瑞士的钻石
表267 2018-2032年按类型分列的瑞士在ORTHONATY Supplies市场中的弹药(千分之一)
表268 2018-2032年按产品分列的瑞士出口和出口市场进口量和进口量(千美元)
表269 2018-2032年按产品类型分列的瑞士手工制品市场
表270 2018-2032年按Patient类型分列的瑞士矫形商品市场(千美元)
表271 2018-2032年按材料类型分列的瑞士矫形市场(千美元)
表272 按类型分列的2018-2032年瑞士市场中按类别分列的
表273 2018-2032年按类型分列的澳大利亚在ORTHONY Supplies市场中的阿兰(10万美元)
表274 2018-2032年按类型分列的瑞士在ORTHONY Supplies市场上的
表275 按申请分列的2018-2032年瑞士ORTHODON SUPINTION SMAKET(美元)
表276 按申请分列的2018-2032年瑞士市场对矫形用品市场的治疗(千美元)
表277 按终端用户分列的2018-2032年瑞士矫形商品市场(千美元)
表278 2018-2032年按分销部门分列的瑞士整形商品市场(千美元)
表279 按产品类型分列的2018-2032年土耳其ORTHODON Supplies市场(美元)
表280 按产品类型分列的2018-2032年可移植肿瘤市场中可移植肿瘤的应用情况(千)
表281 按产品类型分列的2018至2032年按矫形产品市场收留的土耳其人(10万美元)
表282 2018-2032年按产品类型分列的矫形产品市场上的半导体应用量(美元)
表283 表283 按类型分列的2018-2032年
表284 按构成部分分列的2018-2032年骨骼制品市场上的涡轮裂痕(千分之一)
表285 按类型分列的2018-2032年按器官供应市场分列的土耳其弹药(千美元)
表286 2018-2032年按产品分类的ORTHONICY用品市场的巡回销售和准入情况(千美元)
表287 按产品类型分列的2018-2032年手工制品市场上的土豆制品
表288 图克矫形商品市场,按Patient类型分列,2018-2032年(美元)
表289 按材料类型分列的2018-2032年土耳其ORTHODON Supplies市场(千美元)
表290 图克市场中按类型分列的数字,2018-2032年(千美元)
表291 按类型分列的2018-2032年按器官供应市场中的Turkey ArCHWire(10万美元)
表292 按类型分列的2018-2032年矫形用品市场上的锡矿工人和滞留者(千人)
表293 按申请分列的2018-2032年土耳其ORTHODON SUPINTY 市场(美元)
表294 按申请分列的2018至2032年按矫形产品市场分列的土耳其货币处理情况(美元)
表 295 按最终用户分列的土耳其矫形商品市场,2018-2032年(千美元)
表296 图克ORTHONITHONY Supplies Market,按销售商品分列,2018-2032年 (千美元)
表297 按产品类型分列的2018-2032年比利时矫形商品市场(千美元)
表298 按产品类型分列的2018-2032年市场中可转录的可转录器官应用量(美元)
表299 2018-2032年按产品类型列示的ORTHONY Supplies市场上的比利时人(美元)
2018-2032年按产品类型分列的ORTHONTICS市场上的300贝勒姆半导体应用量(美元)
表301 表301 按类型分列的2018-2032年骨骼制品市场上的金属碎块(千美元)
表302 表302 按构成部分分列的2018-2032年骨骼制品市场上的金属碎块(千美元)
表303 按类型分列的2018-2032年ORTHONY Supplies市场中的贝尔基姆弹药(美元)
表304 2018-2032年按产品分类的ORTHONY Supplic SMAK 市场上的贝尔吉乌姆
表305 按产品类型分列的2018-2032年市场上的钢铁电子产品(10万美元)
2018-2032年按Patient类型分列的表 306 直肠市场(千美元)
表307 按材料类型分列的2018-2032年比利时ORTHODON Supplies市场(美元)
表 308 按类型分列的2018-2032年骨骼制品市场上的金属碎块(千美元)
表309 2018-2032年按类型分列的ORTHONY Supplies市场中的贝尔基姆弹药(美元)
表310 表310 按类型分列的2018-2032年在ORTHONICY SUPLES市场中注册和持有者(美元)
表311 骨骼市场,按申请分列,2018-2032年(千美元)
表312 按申请分列的2018至2032年按矫形产品市场分列的狱政治疗情况(美元)
表313 按最终用户分列的2018-2032年比利时肿瘤市场(千美元)
表314 2018-2032年按销售部门分列的比利时骨骼制品市场(千美元)
表315 2018-2032年按产品类型分列的瑞典矫形商品市场(千美元)
表316 2018-2032年按产品类型分列的瑞典在ORTHONTICS市场上的可变性应用(美元)
表317 2018-2032年按产品类型分列的ORTHONICY Supplies市场的瑞典难民(千)
表318 2018-2032年按产品类型分列的瑞典在ORTHONY Supplices市场上的固态应用(美元)
表319 按类型分列的2018至2032年按矫形产品市场中的瑞典人
表320 按构成部分分列的骨骼产品市场上的瑞典钻石,2018-2032年(千美元)
表321 2018-2032年按类型分列的ORTHONY Supplies市场中的瑞典弹药(千分之一)
表322 2018-2032年按产品分类的ORTHONY Supplic SMAK市场中瑞典的复苏和准入情况(千美元)
表323 2018-2032年按产品类型分列的瑞典在ORTHONY Supplies市场中的电子产品(千美元)
表324 瑞典矫形产品市场,按Patient类型分列,2018-2032年(美元)
表325 按材料类型分列的2018-2032年瑞典ORTHODONTIC SUPUTIES市场(美元)
表326 按类型分列的2018至2032年按骨骼产品市场中瑞典的
表327 按类型分列的2018至2032年挪威ORTHONY Supplies市场中的瑞典弹药(千美元)
表328 2018-2032年按类型分列的ORTHONICY Supplies市场中瑞典籍员工和被拘留者(千分之一)
表329 2018-2032年按申请分列的瑞典ORTHODONTIC SUPPINT 市场(美元)
表330 2018-2032年按申请分列的瑞典在ORTHONY Supplications市场中的治疗情况(美元)
表331 按最终用户分列的瑞典矫形商品市场,2018-2032年(千美元)
表332 2018-2032年按分销部门分列的瑞典ORTHODONTIC SUPUTION SMKET(美元)
表333 2018-2032年按产品类型分列的波兰矫形产品市场(千美元)
表334 2018-2032年按产品类型分列的在ORTHONY Supplices市场上的可移植性器官应用(美元)
表335 按产品类型分列的2018至2032年ORTHONICT市场上的波兰人(千美元)
表336 2018-2032年按产品类型分列的在ORTHONY Supplices市场上的波兰固态应用(千分之一)
表337 按类型分列的2018至2032年在ORTHONY Supplies市场中的波斯堡(美元)
表338 表338 按构成部分分列的2018-2032年按市面结构分列的
表339 按类型分列的2018-2032年半径表
表340 2018-2032年按产品列示的ORTHONICY Supplic SMAKT 市场上的罂粟种植和准入情况(美元)
表341 按产品类型分列的2018-2032年ORTHONTION SUPLET 市场上的波兰电子产品(美元)
表342 2018-2032年按Patient类型分列的波兰矫形商品市场(千美元)
表343 2018-2032年按材料类型分列的波兰矫形商品市场(千美元)
表344:按类型分列的2018-2032年按器官供应市场中的泊车(千美元)
表345 按类型分列的2018-2032年按器官供应市场中的波兰弹药(千美元)
表346 2018-2032年按类型分列的ORTHONICY Supplement市场中的波兰籍居民和居留者(千)
表347 波兰矫形产品市场,按申请分列,2018-2032年(美元)
表348 按申请分列的2018至2032年波兰在ORTHONICY Supplications市场中的
表349 波兰矫形产品市场,按最终用户分列,2018-2032年(千美元)
表 350 波兰ORTHONTIC SUPLES 市场,按分配 CHANNEL, 2018-2032年 (美元)
表351 2018-2032年按产品类型分列的丹麦矫形商品市场(千美元)
表352 2018-2032年按产品类型分列的可变性市场应用量(千美元)
表353 按产品类型分列的2018-2032年丹麦在矫形产品市场上的被拘留者(千美元)
表354 2018-2032年按产品类型分列的在ORTHONTHONY SUPLET市场上的丹麦固态应用(美元)
表355 按类型分列的2018-2032年丹麦在ORTHONY Supplies市场中的碎片(美元)
表356 按构成部分分列的2018至2032年丹麦市场中
表357 按类型分列的2018-2032年丹麦ORTHONY Supplies市场中的弹药(千分之一)
表358 2018-2032年按产品分列的其他资源市场丹麦捐赠和获得情况(千美元)
表359 2018-2032年按产品类型分列的丹麦出口农产品
表360 丹麦矫形商品市场,按Patient类型分列,2018-2032年(美元)
表361 按材料类型分列的丹麦肿瘤市场,2018-2032年(千美元)
表362 按类型分列的2018至2032年丹麦在ORTHONY Supplies市场中的数量(千美元)
表363 2018-2032年按类型划分的ORTHONY Supplies市场中的丹麦阿瑟克(10万美元)
表364 2018-2032年按类型分列的丹麦房地产市场注册商和持有者(千美元)
表365 按申请分列的2018-2032年丹麦矫形商品市场(千美元)
表366 按申请分列的2018-2032年丹麦在ORTHONATING SUPLING市场中的治疗情况(美元)
表367 丹麦矫形商品市场,按终端用户分列,2018-2032年(美元)
表368 2018-2032年丹麦矫形商品市场,按销售商品分列(千美元)
表369 2018-2032年按产品类型分列的挪威整形商品市场(千美元)
表370 2018-2032年按产品类型分列的挪威在ORTHONY Supplices市场上的可变性应用(美元)
表371 2018-2032年按产品类型分列的挪威在ORTHONY供应市场中的滞留者(千)
表372 2018-2032年按产品类型分列的挪威在ORTHONTICS市场中已加工的矫形应用(美元)
表373 2018-2032年按类型分列的挪威在ORTHONY Supplies市场中的损失(千美元)
表374 按构成部分开列的2018至2032年挪威市场中
表375 2018-2032年按类型分列的挪威ORTHONY Supplies市场上的弹药(千分之一)
表376 2018-2032年按产品分列的挪威ORTHONICY供应市场中
表377 按产品类型分列的挪威ORTHONTION SUPLET市场中的电子产品,2018-2032年(千美元)
表378 2018-2032年按Patient类型分列的挪威矫形商品市场(千美元)
表379 2018-2032年按材料类型分列的挪威矫形商品市场(千美元)
表380 按类型分列的2018至2032年挪威在ORTHONY Supplies市场上的车次(千分之)
表381 2018-2032年按类型分列的挪威ORTHONY Supplies市场中的阿瑟尔(10万美元)
表382 2018-2032年按类型分列的挪威ORTHONICY Supplies市场上的
表383 按申请分列的2018-2032年挪威矫形商品市场(千美元)
表384 按申请分列的2018-2032年挪威在ORTHONICALING SUPING市场中受到的治疗(美元)
表385 按终端用户分列的2018-2032年挪威矫形商品市场(千美元)
表386 2018-2032年按分销部门分列的挪威整形商品市场(千美元)
表387 2018-2032年按产品类型分列的芬兰矫形商品市场(千美元)
表388 2018-2032年按产品类型分列的在ORTHONY Supplices市场上的芬兰可再生能源应用量(千分之)
表389 2018-2032年按产品类型分列的在ORTHONICY市场上的芬兰难民(千分之一)
表390 2018-2032年按产品类型分列的在ORTHONY Supplices市场上的芬兰固态应用(千美元)
表391 2018-2032年按类型分列的在ORTHONICY Supplies市场上的芬兰银行(美元)
表392 2018-2032年按构成部分开列的法国在ORTHONICY Supplies市场上的车辆(千)
表393 2018-2032年按类型分列的法国ORTHONY Supplies市场中的弹药(千分之一)
表394 2018-2032年按产品分列的法国进口和进口ORTOTION Supplices市场的情况(千美元)
表395 2018-2032年按产品类型分列的法国出口农产品市场
表396 2018-2032年按农药类型分列的芬兰矫形商品市场(千美元)
表397 2018-2032年按材料类型分列的芬兰矫形商品市场(千美元)
表398 2018-2032年按类型分列的在ORTHONICY Supplies市场上的芬兰银行
表399 2018-2032年按类型分列的法国ORTHONATIC SUPPINE市场中的弹药(千美元)
表400 2018-2032年按类型分列的在ORTHONICY Supplits市场上的芬兰移民和居留者(千)
表401 2018-2032年按申请分列的芬兰矫形商品市场(千美元)
表402 2018-2032年按申请分列的在ORTHONICALING SUPLING市场中接受治疗的情况(美元)
表403 按最终用户分列的2018-2032年芬兰矫形商品市场(千美元)
表404 2018-2032年按分销部门分列的芬兰矫形商品市场(千美元)
表405 2018-2032年按产品类型分列的欧洲矫形产品市场余额(千美元)
表406 2018-2032年按国家分列的亚洲-太平洋矫形市场(千美元)
表407 2018-2032年按产品类型分列的亚洲-太平洋矫形产品市场(千美元)
表408 2018-2032年按产品类型分列的在ORTHONY Supplication市场上的亚洲-PATICO REMOVANTY ONTHOTION Application(美元)
表409 2018-2032年按产品类型分列的ORTHONICT市场中的亚洲-太平洋难民(千美元)
表410 2018-2032年按产品类型分列的半导体市场中亚洲半导体半导体应用量(千美元)
表411 2018-2032年按类型分列的ORTHONICY Supplement市场中的亚洲-PACICBLING 2018-2032年按类别分列的
表412 2018-2032年按构成部分分列的ORTHONICY Supplices市场中的亚洲-PACCLINCERUCETS(美元)
表413 2018-2032年按类型分列的ORTHONICY SUPLES市场中的亚洲-PACIARTIES(美元)
表414 2018至2032年按产品分列的半导体市场中亚洲-太平洋的复苏和准入情况(千美元)
表415 2018-2032年按产品类型分列的有机物市场上的亚洲-全氟电子产品(千美元)
表416 2018-2032年按农药类型分列的亚洲-太平洋矫形产品市场 (千美元)
表417 2018-2032年按材料类型分列的亚洲-太平洋矫形产品市场(千美元)
表418 2018-2032年按类型分列的ORTHONY Supplies市场中的亚洲-PACICBARKETS(美元)
表419 2018-2032年按类型分列的有机物市场中的亚洲-太平洋弹药(千美元)
表420 2018-2032年按类型分列的市场中亚洲-太平洋
表421 2018-2032年按申请分列的亚洲-太平洋矫形产品市场(千美元)
表422 2018-2032年按申请分列的半导体市场对半导体市场的亚洲-全氟化加工处理(千美元)
表423 2018-2032年按终端用户分列的亚洲-太平洋矫形产品市场(千美元)
表424 2018-2032年按分销部门分列的亚洲-太平洋矫形产品市场(千美元)
表425 2018-2032年按产品类型分列的中国ORTHODONTICS市场(美元)
表426 2018-2032年按产品类型分列的中国在ORTHONY Supplices市场上的可移植性器官应用(千分之)
表427 2018-2032年按产品类型分列的中国ORTHODON Supplies市场收留者(美元)
表428 2018-2032年按产品类型分列的中国在ORTHONICY SUPLES市场中固定的矫形应用(美元)
表429 2018-2032年按类型分列的中国ORTHODON Supplies市场中的中国破损情况(美元)
表430 2018-2032年按构成部分分列的中国骨骼制品市场上的破损情况(美元)
表431 2018-2032年按类型分列的中国ORTHONY SUPIES市场中的中国弹药(美元)
表432 2018-2032年按产品分列的中国ORTHONY Supplic SMAKT 市场的补贴和准入情况(千美元)
表433 2018-2032年按产品类型分列的中国ORTHONTHONY Supplic Elastomeric Products Market, P.
表434 2018-2032年按Patient类型分列的中国ORTHONTHONY Supplies市场(美元)
表435 2018-2032年按材料类型分列的中国ORTHONICY Supplies市场(美元)
表436 2018-2032年按类型分列的中国ORTHONY Supplies市场中的436个板块(美元)
表437 2018-2032年按类型分列的中国ORTHONATIC SUPLINE市场中的库存情况(千美元)
表438 2018-2032年按类型分列的中国ORTHONICY SUPLINE MAKTHE THE ALINGER和持有者(美元)
表439 2018-2032年按申请分列的中国ORTHODONTIC SUPUTIES市场(美元)
表440 2018-2032年按申请分列的中国骨骼制品市场上的马来文处理情况(美元)
表441 中国矫形产品市场,按终端用户分列,2018-2032年(千美元)
表442 2018-2032年按分销部门分列的中国ORTHODONTIC SUPINT 市场(千美元)
表443 日本矫形产品市场,按产品类型分列,2018-2032年(美元)
表444 2018-2032年按产品类型分列的日本在ORTHONY SUPLES市场中可改性器官应用(美元)
表445 2018-2032年按产品类型分列的日本ORTHODON Supplies市场收留者(美元)
表446 2018-2032年按产品类型分列的日本在ORTHONITIC SUPLES市场中已加工的矫形应用(美元)
表447 2018-2032年按类型分列的日本ORTHODON SUPLINTHE THERY SUPLES MAKET(美元)
表448 按构成部分分列的日本在ORTHODON Supplies市场中的
表449 2018-2032年按类型分列的日本ORTHONY Supplies市场中的弹药数量(千美元)
表450 2018-2032年按产品分列的日本ORTHONY Supplic SMAKT 市场的自助和准入情况(美元)
表451 2018-2032年按产品类型分列的日本矫形用品市场上的叶片产品(千美元)
表452 2018-2032年日本ORTHODONITIC SUPPINET市场,按Patient类型分列(美元)
表453 按材料类型分列的2018-2032年日本ORTHONY Supplies市场(美元)
2018-2032年按类型分列的日本ORTHODON Supplies市场中454个日本货仓(美元)
表455 2018-2032年按类型分列的日本ORTHONATIC SUPLINE市场中的库存(美元)
表456 2018-2032年按类型分列的日本ORTHONICY Supplies市场中的日本移民和被拘留者(千美元)
表457 按申请分列的2018-2032年日本ORTHONITIC SUPINE 市场(美元)
表458 2018-2032年按申请分列的日本市场对ORTHONICLUTION Supplications市场的治疗(美元)
表459 日本矫形产品市场,按终端用户分列,2018-2032年(美元)
表460 日本ORTHONTION SUPLES Market, 按分配CHANNEL, 2018-2032年 (美元)
表461 2018-2032年按产品类型分列的印度ORTHODONTION SUPUTIES市场(美元)
表462 2018-2032年按产品类型分列的印度在ORTHONY SUPLET市场上的可变性应用(美元)
表463 2018-2032年按产品类型分列的印度在ORTHONY SUPLES市场中的滞留者(美元)
表464 2018-2032年按产品类型分列的印度在ORTHONY SUPLES市场中的固定矫形应用(美元)
表465 2018-2032年按类型分列的印度在ORTHONICY Supplies市场中的车辆(千)
表466 2018-2032年按构成部分分列的印度在ORTHONITIC SUPLES市场中的车辆(千)
表467 2018-2032年按类型分列的印度ORTHONY Supplies市场中的阿瑟克(美元)
表468 2018-2032年按产品分列的印度ORTHONY Supplic SMAK 市场的复苏和准入情况(千美元)
表469 2018-2032年按产品类型分列的印度手工制品市场
表470 2018-2032年印度ORTHONTION SUPINTY SMAKET,按农药类型分列(美元)
表471 2018-2032年印度ORTHODONTION SUPUTIES市场,按材料类型分列(美元)
表472 2018-2032年按类型分列的印度在ORTHONATIC SUPLES市场中的损失(美元)
表473 按类型分列的2018-2032年印度ORTHONTION Supplies市场中的阿瑟尔(美元)
表474 2018-2032年按类型分列的印度房地产市场上的伐木者和滞留者(千美元)
表475 按申请分列的2018-2032年印度ORTHODONTION SUPINT 市场(美元)
表476 按申请分列的2018-2032年印度在矫形用品市场上的治疗情况(美元)
表477 按终端用户分列的印度矫形产品市场,2018-2032年(千美元)
表478 2018-2032年印度ORTHODONTION SUPINTY MANKET,按分销商品分类(美元)
表479 2018-2032年按产品类型分列的韩国南部骨骼市场(千美元)
表 480 按产品类型分列的韩国南方可变性市场应用量,2018-2032年
表481 2018-2032年按产品类型分列的韩国南部ORTHONY Supplies市场收留者(美元)
表482 2018-2032年按产品类型分列的韩国南方在ORTHONY SUPLES市场中已完全矫形应用(美元)
表483 2018-2032年按类型分列的韩国南部ORTHONY Supplies市场中的损失(千美元)
表484 2018-2032年按构成部分开列的韩国南方市场出口
表485 2018-2032年按类型分列的韩国南部ORTHONY Supplies市场上的弹药数量(千美元)
表486 2018-2032年按产品分列的韩国南部出口和进口ORTON Supplies市场的情况(千美元)
表487 2018-2032年按产品类型分列的韩国南方电子产品
表488 韩国南部骨骼市场,按Patient类型分列,2018-2032年(千美元)
表489 2018-2032年按材料类型分列的韩国南方ORTHODON SUPPINT市场(美元)
表490 2018-2032年按类型分列的骨骼产品市场中韩国南部碎裂情况(千美元)
表491 2018-2032年按类型分列的韩国南部ORTHONY Supplies市场中的阿瑟(美元)
表492 2018-2032年按类型分列的韩国南方木材市场供应商和持有者
表493 2018-2032年按申请分列的韩国南部ORTHONICY市场(千美元)
表494 按申请分列的2018-2032年韩国南部市场对矫形用品市场的治疗(千美元)
表495 韩国南方矫形产品市场,按最终用户分列,2018-2032年(千美元)
表496 2018-2032年韩国南方ORTHODONTHINTIC SUPLES Market, 按销售商品分列 (千)
表497 按产品类型分列的2018-2032年澳大利亚ORTHODONTION Supplies市场(美元)
表498 2018-2032年按产品类型分列的澳大利亚在ORTHONTHON SUPLES市场中可变性应用(美元)
表499 2018-2032年按产品类型分列的澳大利亚在ORTHONICY Supplies市场上的滞留者(美元)
表500 2018-2032年按产品类型分列的澳大利亚在ORTHONTION Supplices市场上的固态应用(美元)
表501 2018-2032年按类型分列的澳大利亚在ORTHONICY Supplies市场中的裂口(千美元)
表502 2018-2032年按构成部分分列的澳大利亚在ORTHONICY Supplies市场中的车辆(千)
表503 2018-2032年按类型分列的澳大利亚ORTHONY Supplies市场中的弹药(千美元)
表504 2018-2032年按产品分列的澳大利亚在ORTHONY Supplies市场上的捐赠和获得情况(千美元)
表505 2018-2032年按产品类型分列的澳大利亚手工制品市场
表506 2018-2032年按农药类型分列的澳大利亚矫形产品市场(千美元)
表507 2018-2032年按材料类型分列的澳大利亚矫形商品市场(千美元)
表508 2018-2032年按类型分列的澳大利亚在ORTHONICY Supplies市场中的碎片(美元)
表509 按类型分列的2018-2032年澳大利亚ORTHONTION Supplies市场中的阿图克(美元)
表510 2018-2032年按类型分列的澳大利亚在ORTHONICY SUPPLET市场中的联系人和居留人(美元)
表511 2018-2032年按申请分列的澳大利亚整形商品市场(千美元)
表512 2018-2032年按申请分列的澳大利亚在ORTHONICALS SUPLING市场中的治疗(美元)
表513 2018-2032年按终端用户分列的澳大利亚矫形商品市场(千美元)
表514 2018-2032年按分销部门分列的澳大利亚矫形商品市场(千美元)
表515 按产品类型分列的2018至2032年泰国矫形商品市场(千美元)
表516 2018-2032年按产品类型分列的有机物市场中泰国可变性应用情况(千分之一)
表517 2018-2032年按产品类型列示的棉兰花市场收留者
表518 2018-2032年按产品类型分列的棉兰西岛在棉兰西岛市场中已加工的矫形制剂(美元)
表519 按类型分列的2018至2032年东印度州出口市场中的泰万银行
表520 按构成部分分列的器官供应市场中的泰文板块,2018-2032年(千美元)
表521 2018-2032年按类型分列的器官市场中的泰万弹药(千美元)
表522 2018-2032年按产品分列的有机物供应市场中泰国的复苏和准入情况(千美元)
表523 按产品类型分列的2018-2032年东北大西洋出口市场中
表524 台湾矫形市场,按Patient类型分列,2018-2032年(千美元)
表525 按材料类型分列的2018-2032年泰国矫形商品市场(千美元)
表526 按类型分列的2018至2032年在矫形产品市场上的泰万大桥(千美元)
表527 按类型分列的2018-2032年按器官供应市场分列的泰国阿瑟尔(10万美元)
表528 2018-2032年按类型分列的东北大西洋木材市场上的进口工人和持有者(千美元)
表529 按申请分列的2018-2032年泰国矫形商品市场(千美元)
表530 按申请分列的2018-2032年锡矿市场对锡矿的治疗(美元)
表531 按终端用户分列的泰国矫形商品市场,2018-2032年(千美元)
表532 2018-2032年按分销部门分列的泰国矫形商品市场(千美元)
表533 2018-2032年按产品类型分列的新加坡ORTHODON SUPIES市场(美元)
表534 2018-2032年按产品类型分列的骨骼市场中可改性器官应用情况(美元)
表535 2018-2032年按产品类型分列的ORTHONATICS SUPLINGARE市场滞留者(美元)
表536 2018-2032年按产品类型分列的在ORTHONITIC SUPLE市场中固定的矫形用途(美元)
表537 2018-2032年按类型分列的ORTHONTHONY Supplies市场中的银花板(美元)
表538 2018-2032年按构成部分分列的骨骼制品市场上的锡金帕雷(10万美元)
表539 2018-2032年按类型分列的骨科产品市场上的新加坡阿瑟克(美元)
表540 2018-2032年按产品分列的骨骼制品市场中新药和准入情况(千美元)
表541 2018-2032年按产品类型分列的手工制品市场上的银花电子产品
表542 2018-2032年按Patient类型分列的恒星整形产品市场(千美元)
表543 2018-2032年按材料类型分列的恒星整形产品市场(千美元)
表544 2018-2032年按类型分列的ORTHONY Supplies市场上的SINGAPORE Brackets(美元)
表545 2018-2032年按类型分列的ORTHONTION SUPLE市场中的新阿图克(美元)
表546 2018-2032年按类型分列的骨骼制品市场上的锡加勒人和被拘留者(美元)
表547 2018-2032年按申请分列的新加坡ORTHODONITIC SUPINTHINE市场(美元)
表548 2018-2032年按申请分列的骨骼制品市场上的合成疗法
表549 2018-2032年按终端用户分列的新加坡骨骼制品市场(千美元)
2018-2032年按分销商品分类的表550 SINGAPORE ORTHONTION Supplies Market, 2018-2032年 (美元)
表551 2018-2032年按产品类型分列的泰国矫形商品市场(千美元)
表552 按产品类型分列的2018-2032年泰国市场中可移植的可移植器官(千分之)
表553 按产品类型分列的2018-2032年泰国在矫形产品市场上的滞留人数(千美元)
表554 2018-2032年按产品类型分列的泰国在ORTHONY Supplices市场上的固定矫形应用(美元)
表555 按类型分列的2018-2032年泰国市场中按类别分列的废物(千分之一)
表556 按构成部分分列的2018至2032年泰国出口
表557 按类型分列的2018-2032年泰国ORTHONTIC SUPINE 市场中的弹药(千美元)
表558 2018-2032年按产品分列的泰国进口和进口ORTHONY Supplies市场的情况(千美元)
表559 2018-2032年按产品类型分列的泰国出口农产品
表560 按农药类型分列的泰国矫形产品市场,2018-2032年(千美元)
表561 2018-2032年按材料类型分列的泰国矫形商品市场(千美元)
表562 按类型分列的2018-2032年泰国在ORTHONY Supplies市场中的碎片(美元)
表563 按类型分列的2018-2032年泰国ORTHONATIC SUPINE 市场中的阿图克(美元)
表564 按类型分列的2018-2032年泰国房地产市场注册和持有者(千)
表565 按申请分列的2018-2032年泰国矫形商品市场(千美元)
表566 按申请分列的2018至2032年泰国市场对矫形用品的治疗(千美元)
表567 按终端用户分列的泰国矫形产品市场,2018-2032年(千美元)
表568 2018-2032年泰国矫形市场按分布情况(千)
表569 2018-2032年按产品类型分列的马来西亚ORTHONTHONITY市场(美元)
表570 2018-2032年按产品类型分列的马来亚可变性市场应用量(千美元)
表571 2018-2032年按产品类型分列的马来西亚在ORTHONICY Supplies市场中的滞留者(千)
表572 2018-2032年按产品类型分列的马来西亚在ORTHONITIC SUPLET市场上的半导体应用(美元)
表573 2018-2032年按类型分列的ORTHONY Supplies市场中马来亚公司
表574 按构成部分分列的2018-2032年市场中马来亚公司
表575 2018-2032年按类型分列的日本ORTHONICY Supplies市场中的马来亚军火(美元)
表576 2018-2032年按产品分列的马来西亚ORTHONATINCES 市场上的复苏和准入情况(千美元)
表577 2018-2032年按产品类型分列的马来西亚手工制品市场
表578 2018-2032年按Patient类型分列的马来西亚矫形市场(千美元)
表579 2018-2032年按材料类型分列的马来亚矫形市场(千美元)
表580 马来亚市场中按类型划分的 2018-2032年(千美元)
表581 2018-2032年按类型分列的日本ORTHONITICA SUPPINE市场(美元)
表582 2018-2032年按类型分列的马来西亚在ORTHONICY Supplies市场中的联系人和居留人(美元)
表583 2018-2032年按申请分列的马来西亚矫形商品市场(千美元)
表584 2018-2032年按申请分列的马来亚市场对矫形用品市场进行治疗的情况(美元)
表585 2018-2032年按终端用户分列的马来西亚矫形商品市场(千美元)
表586 2018-2032年马来西亚ORTHONTION SUPINTY 市场,按分销商品分列(千美元)
表587 按产品类型分列的2018-2032年印度矫形产品市场(千美元)
表588 2018-2032年按产品类型分列的工业加工市场中印度尼西亚可变性应用量(千美元)
表589 2018-2032年按产品类型分列的印度在ORTHONY Supplies市场上的滞留者(千)
表590 2018-2032年按产品类型分列的印度在ORTHONITIC SUPLET市场上的固定用途
表591 2018-2032年按类型分列的印度在ORTHONICY Supplies市场上的车辆(千美元)
表592 按构成部分分列的2018至2032年印度市场中
表593 2018-2032年按类型分列的印度在矫形产品市场上的亚美尼亚(千美元)
表594 2018-2032年按产品分类的印度出口和进口
表595 2018-2032年按产品类型分列的印度手工制品市场
表596 2018-2032年按Patient类型分列的印度矫形市场(千美元)
表597 2018-2032年按材料类型分列的印度尼西亚矫形商品市场(千美元)
表598 2018-2032年按类型分列的印度在ORTHONY Supplies市场中的
表599 2018-2032年按类型分列的印度在ORTHONATIC SUPINE市场中的亚美尼亚(千美元)
表600 按类型分列的2018-2032年印度市场上的
表601 按申请分列的2018-2032年印度矫形市场(千美元)
表602 2018-2032年按申请分列的印度在矫形产品市场上的治疗情况(千美元)
表603 按终端用户分列的2018-2032年印度矫形产品市场(千美元)
表604 2018-2032年按分销部门分列的印度矫形产品市场(千美元)
表605 按产品类型分列的2018-2032年菲律宾矫形产品市场(千美元)
表606 2018-2032年按产品类型分列的菲律宾在ORTHONY SUPK市场上的可移植器官应用量(千美元)
表607 2018-2032年按产品类型分列的在ORTHONY Supplies市场上的菲律宾人(千)
表608 2018-2032年按产品类型分列的菲律宾在ORTHONTHON SUPET市场上的半导体应用量
表609 按类型分列的2018-2032年菲律宾ORTHONY Supplies市场中的菲律宾人(美元)
表610 按构成部分分列的2018-2032年菲律宾ORTHONY Supplements市场中的菲律宾人(千人)
表611 2018-2032年按类型分列的菲律宾ORTHONY Supplies市场的弹药数量(千分之一)
表612 2018-2032年按产品分列的ORTHONY Supplines市场中菲律宾的复苏和准入情况(千美元)
表613 2018-2032年按产品类型分列的菲律宾矫形产品市场电子产品
表614 2018-2032年按农药类型分列的菲律宾矫形产品市场(千美元)
表615 2018-2032年按材料类型分列的菲律宾矫形产品市场(千美元)
表616 2018-2032年按类型分列的菲律宾在ORTHONY Supplies市场中出现的情况(美元)
表617 2018-2032年按类型分列的菲律宾ORTHONY Supplies市场中的阿图克(美元)
表618 2018-2032年按类型分列的菲律宾在ORTHONY SUPLINE市场中的居民和被拘留者(千)
表619 按申请分列的2018-2032年菲律宾矫形产品市场 (千美元)
表620 按申请分列的2018-2032年菲律宾在ORTHONY SUPLING市场中的治疗情况(美元)
表621 2018-2032年按终端用户分列的菲律宾矫形产品市场(千美元)
表622 2018-2032年菲律宾按分销商品分类的ORTHODON Supplines市场(美元)
表623 按产品类型分列的2018-2032年新泽西岛整形产品市场(千美元)
表624 2018-2032年按产品类型分列的北美市场中可改性器官应用情况(美元)
表625 2018-2032年按产品类型分列的其他资源市场中新泽地难民情况(千)
表626 2018-2032年按产品类型分列的新泽西岛在ORTHONTIC SUPLES市场中固定的矫形应用(美元)
表627 2018-2032年按类型分列的手术用品市场中新泽西岛碎块(美元)
表628 2018-2032年按构成部分分列的其他资源市场中新泽地碎块(千)
表629 2018-2032年按类型分列的陆地市场中新泽地弹药数量(千美元)
表630 2018-2032年按产品分列的新泽西岛在ORTHONY Supplits市场上的补贴和准入情况(千美元)
表631 2018-2032年按产品类型分列的陆地用品市场中新泽地电子产品
表632 2018-2032年按Patient类型分列的新泽西岛矫形市场(千美元)
表633 2018-2032年按材料类型分列的新泽地矫形产品市场(千美元)
表634 2018-2032年按类型分列的ORTHONICY Supplies市场中的新泽地裂口(美元)
表635 2018-2032年按类型分列的手术用品市场中新泽地弹药(千)
表636 按类型分列的2018-2032年新泽西岛房地产市场中的新泽西岛居民和被拘留者(千)
表637 按申请分列的2018-2032年新泽西岛整形产品市场(千美元)
表638 2018-2032年按申请分列的新泽西岛在ORTHONY SUPLING市场中的治疗(美元)
表639 按终端用户分列的2018-2032年新泽地矫形产品市场情况(千美元)
表640 2018-2032年按分销部门分列的新泽地整形产品市场(千美元)
表641 按产品类型分列的2018-2032年维也纳矫形产品市场(千美元)
表642 2018-2032年按产品类型分列的市场中可移动性肿瘤应用量
表643 2018-2032年按产品类型分列的矫形产品市场上的VIETNAM人员(千)
表644 2018-2032年按产品类型分列的在ORTHONY SUPLET市场上的固定矫形应用(美元)
表645 2018-2032年按类型分列的矫形产品市场上的VIETNAM批次(美元)
表646:按构成部分分列的2018-2032年在ORTHONICY Supplies市场上的VIETNAM Brackets(美元)
表647 2018-2032年按类型分列的表647
表648 2018-2032年按产品分类的ORTHONY Supplices市场的旅游和准入情况(千美元)
表649 2018-2032年按产品类型分列的其他资源市场上的阿片
表650 维也纳矫形产品市场,按倾向类型分列,2018-2032年(千美元)
表651 2018-2032年按材料类型分列的肿瘤市场(千美元)
表652:按类型分列的2018-2032年按矫形产品市场分列的
表653 2018-2032年按类型分列的肿瘤产品市场上的阿瑟尔
表654 2018-2032年按类型分列的在ORTHONICY Supplies市场上的外籍人员和滞留人员(美元)
表655 按申请分列的2018-2032年维也纳矫形市场(千美元)
表656:2018-2032年按申请分列的在ORTHONION SUPLING市场中接受的马来语治疗(美元)
表657:按终端用户分列的2018-2032年维也纳矫形商品市场(千美元)
表658 2018-2032年按分销部门分列的维也纳矫形商品市场(千美元)
表659 2018-2032年按产品类型分列的亚洲-太平洋矫形产品市场份额(千美元)
表660 2018-2032年按国家分列的南美洲矫形市场(千美元)
表661 2018-2032年按产品类型分列的南美洲矫形市场(千美元)
表662 2018-2032年按产品类型分列的南美洲在ORTHONY Supplements市场上的可变性应用(千)
表663 2018-2032年按产品类型分列的在矫形产品市场上的南美洲难民(10万美元)
表664 2018-2032年按产品类型分列的南美洲在ORTHONY SUPLES市场中的固定体外应用(千美元)
表665 2018-2032年按类型分列的北美矫形产品市场中南美洲的碎块(千美元)
表666 2018-2032年按构成部分分列的南美洲在骨骼用品市场上的破损(千美元)
表667 2018-2032年按类型分列的南美洲矫形产品市场上的弹药(千美元)
表668 2018至2032年按产品分列的南美洲在ORTHONY Supplic SMAK 市场上的补贴和准入情况(千美元)
表669 2018-2032年按产品类型分列的北美矫形用品市场上的南美电子产品(千美元)
表670 2018-2032年按Patient类型分列的南美洲矫形市场(千美元)
表671 2018-2032年按材料类型分列的南美洲单体市场(千美元)
表672 2018-2032年按类型分列的北美矫形产品市场上的南美洲碎块(千美元)
表673 2018-2032年按类型分列的南美洲矫形产品市场上的弹药数量(千美元)
表674 2018-2032年按类型分列的北美市场中南部移民和被拘留者(千美元)
表675 2018-2032年按申请分列的南美洲矫形市场(千美元)
表676 2018-2032年按申请分列的南美洲矫形产品市场上的马来文处理情况(美元)
表677 2018-2032年按终端用户分列的南美洲矫形商品市场(千美元)
表678 2018-2032年按分销部门分列的南美洲单体市场(千美元)
表679 按产品类型分列的巴西矫形产品市场,2018-2032年(千美元)
表680 2018-2032年按产品类型分列的半导体市场中巴西可变性应用量(千美元)
表681 2018-2032年按产品类型分列的澳大利亚在ORTHONY Supplies市场中的滞留者(美元)
表682 2018-2032年按产品类型分列的半导体市场巴西固态应用(千分之一)
表683 2018-2032年按类型分列的ORTHONICY Supplies市场中的巴西钻石(10万美元)
表684:按构成部分分列的2018-2032年澳大利亚ORTHONICY产品市场上的巴西钻石(千美元)
表685 2018-2032年按类型分列的澳大利亚ORTHONATIC SUPLES市场中的巴西弹药(千美元)
表686 2018-2032年按产品分列的巴西ORTHONY Supplies市场的复苏和准入情况(千美元)
表687 按产品类型分列的北美市场上巴西电子产品,2018-2032年(千美元)
表688 2018-2032年按农药类型分列的巴西矫形商品市场(千美元)
表689 2018-2032年按材料类型分列的巴西矫形产品市场(千美元)
表690 2018-2032年按类型分列的ORTHONY Supplies市场中的巴西钻石(美元)
表691 2018-2032年按类型分列的ORTHONY Supplies市场中的巴西弹药(千美元)
表692 2018-2032年按类型分列的巴西出口和出口市场中巴西进口商和持有者(千美元)
表693 按申请分列的2018-2032年巴西矫形产品市场(千美元)
表694 2018-2032年按申请分列的澳大利亚在ORTHONY SUPING市场中的治疗(千美元)
表695 巴西矫形产品市场,按最终用户分列,2018-2032年(千美元)
表696 2018-2032年巴西矫形产品市场,按分销商品分列(千美元)
表697 2018-2032年按产品类型分列的阿根廷ORTHONTHONITICS市场(千美元)
表698 2018-2032年按产品类型分列的阿根廷在ORTHONY Supplication市场上的可变性应用(千分之)
表699 2018-2032年按产品类型分列的阿根廷在ORTHONICY Supplies市场上的滞留者(千美元)
表700 2018-2032年按产品类型分列的阿根廷在ORTHONY Supplices市场上的固定矫形应用(美元)
表701 2018-2032年按类型分列的阿根廷在ORTHONY Supplies市场中的损失(千美元)
表702 2018-2032年按构成部分分列的阿根廷在ORTHONY Supplies市场中的
表703 2018-2032年按类型分列的阿根廷ORTHONATINA ARCHENTIES在ORTHONY SUPLES市场(美元)
表704 2018-2032年按产品分列的阿根廷ORTHONY Supplines市场中的理想和准入情况(千美元)
表705 2018-2032年按产品类型分列的阿根廷出口农产品市场
表706 2018-2032年阿根廷ORTHONTION SUPINTY 市场,按PATINTIENT TYPE(美元)分列
表707 按材料类型分列的阿根廷矫形市场,2018-2032年(千美元)
表708 2018-2032年按类型分列的阿根廷在ORTHONY Supplies市场中的损失 (千美元)
表709 按类型分列的2018-2032年阿根廷ORTHONATINA ARCHENTIRE市场(千美元)
表710 2018-2032年按类型分列的阿根廷在ORTHONY SUPLINE市场中的人数和被拘留者(千)
表711 2018-2032年按申请分列的阿根廷ORTHONICY市场(千美元)
表712 2018-2032年按申请分列的阿根廷在ORTHONITICATING SUPLING市场中的治疗(美元)
表713 2018-2032年按最终用户分列的阿根廷ORTHODON SUPIES市场(美元)
表 714 2018-2032年阿根廷ORTHONY Supplices市场,按分布情况分列(千美元)
表715 2018-2032年按产品类型分列的南美洲矫形产品市场份额(千美元)
表716 2018-2032年按国家分列的非洲矫形产品市场(千美元)
表717 2018-2032年按产品类型分列的中东和非洲矫形市场
表 718 2018-2032年按产品类型分列的东部和非洲在ORTHONY SUPK市场上的可移植性器官应用情况(千美元)
表719 2018-2032年按产品类型分列的东部和非洲在矫形产品市场上的
表720 2018-2032年按产品类型分列的东非洲半导体市场中半导体应用量
表721 2018-2032年按类型分列的东方和非洲在ORTHONY Supplement市场中的碎片(千分之一)
表722 2018-2032年按构成部分开列的东部和非洲在ORTHONY Supplices市场中的
表 723 2018-2032年按类型分列的东部和非洲在矫形用品市场上的
表 724 2018-2032年按产品分列的东部和非洲东部和东部地区出口和进口
表725 2018-2032年按产品类型分列的东方和东部非洲电子产品
表726 2018-2032年按Patient类型分列的中东和非洲矫形市场
表727 2018-2032年按材料类型分列的中东和非洲矫形产品市场(千美元)
表728 2018-2032年按类型分列的东方和非洲在ORTHONY Supplits市场上的碎块(千分之一)
表729 2018-2032年按类型分列的东方和非洲市场上的东方和非洲弹药(千美元)
表730 2018-2032年按类型分列的东部和非洲在矫形用品市场上的
表731 2018-2032年按申请分列的中东和非洲矫形产品市场(千美元)
表732 2018-2032年按申请分列的东方和非洲市场对矫形产品进行治疗的情况(10万美元)
表733 2018-2032年按最终用户分列的中东和非洲矫形产品市场(千美元)
表734 2018-2032年按分销部门分列的中东和非洲矫形产品市场(10万美元)
表735 2018-2032年按产品类型分列的南非矫形产品市场(千美元)
表736 2018-2032年按产品类型分列的南非在ORTHONY SUPLET中的可变性应用(千分之)
表737 2018-2032年按产品类型分列的南非在矫形用品市场上的滞留人数(千美元)
表738 2018-2032年按产品类型分列的南非在ORTHONY Supplices市场上的固定用途
表739 2018-2032年按类型分列的南非ORTOTION Supplits市场中的损失 (千美元)
表740 2018-2032年按构成部分分列的南非在ORTHONY Supplies市场中的
表741 2018-2032年按类型分列的南非ORTOTION Supplies市场中的弹药(千分之一)
表742 2018-2032年按产品分列的南非在ORTHONY Supplic SMAK 市场上的
表743 2018-2032年按产品类型分列的南非有机物市场中电子产品(千美元)
表744 2018-2032年按Patient类型分列的南非矫形市场(千美元)
表745 2018-2032年按材料类型分列的南非矫形市场(千美元)
表746 2018-2032年按类型分列的南非在ORTHONY Supplits市场上的车辆(千)
表747 2018-2032年按类型分列的南非在矫形产品市场上的弹药数量(千美元)
表748 2018至2032年按类型分列的东部市场中南非定居者和被拘留者(千人)
表749 2018-2032年按申请分列的南非矫形商品市场(千美元)
表750 2018-2032年按申请分列的南非在ORTHONICLUTION Supplications市场中的治疗情况(千分之)
表751 2018-2032年按最终用户分列的南非矫形产品市场(千美元)
表752 2018-2032年按分销部门分列的南非矫形市场(千美元)
表753 2018-2032年按产品类型分列的南亚矫形市场(千美元)
表754 2018-2032年按产品类型分列的沙特阿拉伯在ORTHONY Supplices市场上的可变性应用(美元)
表755 2018-2032年按产品类型分列的沙特阿拉伯在矫形产品市场上的滞留者(千)
表756 2018-2032年按产品类型分列的沙特阿拉伯在ORTHONITIC SUPLES市场中的固定矫形应用(美元)
表757 2018-2032年按类型分列的沙特阿拉伯在ORTHONY Supplies市场中的损失 (千美元)
表758 2018-2032年按构成部分分列的沙特阿拉伯在ORTHONY Supplies市场中的
表759 2018-2032年按类型分列的沙特阿拉伯在ORTHONATIC SUPLES市场中的阿瑟克(美元)
表760 2018-2032年按产品分列的沙特阿拉伯在ORTHONY Supplic SMAK 市场上的
表761 2018-2032年按产品类型分列的阿拉伯南部电子产品在ORTHONY Supplies市场上的产量(千)
表762 2018-2032年按Patient类型分列的沙特阿拉伯矫形市场(千美元)
表763 2018-2032年按材料类型分列的沙特阿拉伯ORTHODON SUPIES市场(千美元)
表764 2018-2032年按类型分列的沙特阿拉伯在ORTHONICY Supplies市场中的损失 (千美元)
表765 2018-2032年按类型分列的沙特阿拉伯在ORTHONATIC SUPLES市场中的阿图尔(千美元)
表766 2018-2032年按类型分列的沙特阿拉伯在矫形用品市场上的
表767 2018-2032年按申请分列的沙特阿拉伯矫形动物市场(千美元)
表768 2018-2032年按申请分列的沙特阿拉伯在矫形用品市场中的待遇(10万美元)
表769 2018-2032年按终端用户分列的黎巴嫩南部矫形市场(千美元)
表770 2018-2032年按分销部门分列的沙特阿拉伯矫形商品市场(千美元)
表771 2018-2032年按产品类型分列的美国矫形商品市场(美元)
表772 2018-2032年按产品类型分列的美国在ORTHONY SUPLE市场中可变性应用情况(美元)
表773 2018-2032年按产品类型分列的美国ORTHONICY Supplements市场收留者(美元)
表774 2018-2032年按产品类型分列的美国在ORTHONTY Supplices市场上的固态应用(美元)
表775 2018-2032年按类型分列的美国ORTHONY Supplies市场中的损失(美元)
表776 按构成部分分列的2018-2032年美国ORTHONICY Supplies市场中的损失(美元)
表777 2018-2032年按类型分列的美国ORTHONY Supplies市场中的阿瑟克(美元)
表778 2018-2032年按产品分列的美国ORTHONY Supplements市场的捐赠和获得情况(千美元)
表779 2018-2032年按产品类型分列的美国矫形产品市场电子产品
表 780 U.A.E ORTHODONTION SUPINTY SMAKET,按PATINTE TYPE, 2018-2032年 (美元)
表781 2018-2032年按材料类型分列的美国矫形产品市场(美元)
表782 按类型分列的2018-2032年美国ORTHONICY Supplits市场上的破损情况(美元)
表783 2018-2032年按类型分列的美国ORTHONICY Supplies市场中的阿瑟(美元)
表784 按类型分列的2018-2032年美国出口市场中美国进口商和进口商
表785 按申请分列的2018-2032年美国矫形产品市场(千美元)
表786 按申请分列的2018-2032年美国市场对矫形产品的治疗情况(美元)
表787 2018-2032年按终端用户分列的美国矫形产品市场(千分之一)
表788 2018-2032年按分配CHANNEL分列的美国矫形商品市场(美元)
表789 2018-2032年按产品类型分列的埃及矫形商品市场(千美元)
表790 2018-2032年按产品类型分列的在ORTHONY Supplices市场上的埃及可变性应用(美元)
表791 2018-2032年按产品类型分列的ORTHONY Supplies市场中的埃及人(美元)
表792 2018-2032年按产品类型分列的在ORTHONITY SUPLES市场中埃及固定的矫形应用(美元)
表793 2018-2032年按类型分列的矫形产品市场上的埃及钻石
表794:按构成部分分列的2018-2032年骨骼制品市场上的埃及钻石(千美元)
表795 按类型分列的2018-2032年手工制品市场上的埃及弹药(千美元)
表796 2018-2032年按产品分列的输卵管用品市场埃及人和获得者(千)
表797 2018-2032年按产品类型分列的直肠市场埃及电子产品(千美元)
表798 2018-2032年按Patient类型分列的埃及肿瘤市场(千美元)
表799 按材料类型分列的2018-2032年埃及矫形市场(千美元)
表800 EGYPT市场中按类型划分的表格,2018-2032年(千美元)
表801 2018-2032年按类型分列的ORTHONY Supplies市场中的埃及弹药(美元)
表802 2018-2032年按类型分列的ORTHONY Supplies市场中埃及籍移民和被拘留者(千)
表803 按申请分列的2018-2032年埃及矫形市场(千美元)
表804 2018-2032年按申请分列的矫形产品市场上的埃及治疗情况(千美元)
表805 按最终用户分列的2018-2032年埃及矫形商品市场(千美元)
表806 2018-2032年按分销商品分列的埃及整形商品市场(千美元)
表807 2018-2032年按产品类型分列的以色列矫形商品市场(千美元)
表808 2018至2032年按产品类型分列的在ORTHONY SUPLET中以色列可变性应用(美元)
表809 2018-2032年按产品类型分列的以色列的ORTHONY Supplies市场被拘留者(美元)
表810 2018-2032年按产品类型分列的以色列在ORTHONY Supplices市场上的固定用途
表811 2018-2032年按类型分列的以色列在ORTHONY Supplies市场中的碎片(美元)
表812 2018-2032年按构成部分分列的以色列市场中ORTHONY Supplements (美元)
表813 2018-2032年按类型分列的以色列ORTHONY Supplies市场中的以色列弹药(美元)
表814 2018至2032年按产品分列的以色列进口和进口ORTHONY Supplies市场的情况(千美元)
表815 2018-2032年按产品类型分列的以色列手工制品市场
表816 2018-2032年按Patient类型分列的以色列矫形产品市场(10万美元)
表817 2018-2032年按材料类型分列的以色列矫形产品市场(千美元)
表818 2018-2032年按类型分列的以色列在ORTHONY Supplies市场中的碎片(美元)
表819 2018-2032年按类型分列的以色列ORTHONY Supplies市场中的以色列弹药(美元)
表820 2018-2032年按类型分列的以色列房地产市场上的以色列定居者和被拘留者(千人)
表821 2018-2032年按申请分列的以色列矫形商品市场(千美元)
表822 2018至2032年按申请分列的以色列对ORTHONY SUPLING市场的治疗(美元)
表823 按终端用户分列的2018-2032年以色列矫形产品市场(千美元)
表824 2018-2032年以色列ORTHONY Supplies Market,按销售商品分列 (千美元)
表825 2018-2032年按产品类型分列的科威特整形商品市场(千美元)
表826 2018-2032年按产品类型分列的在ORTHONY Supplices市场上的可移植性器官应用(美元)
表827 2018-2032年按产品类型分列的在ORTHONY Supplies市场中滞留的科威特人(美元)
表828 2018-2032年按产品类型分列的在ORTHONY SUPLET市场上的科威特固态应用(美元)
表829 按类型分列的2018-2032年骨骼制品市场上的KUWAIT碎块(美元)
表830 按构成部分分列的2018-2032年骨骼制品市场中的KUWAIT碎块(美元)
表831 2018-2032年按类型分列的骨骼制品市场中的KUWAIT ArCHWIRES(美元)
表832 2018-2032年按产品分列的骨骼制品市场的KUWAIT复苏和准入情况(千)
表833 2018-2032年按产品类型分列的直肠市场上的科威特电子产品(千美元)
表834 2018-2032年按Patient类型分列的科威特矫形商品市场(千美元)
表835 按材料类型分列的2018-2032年科威特整形商品市场(千美元)
表836 按类型分列的2018至2032年按骨骼类产品市场中的KUWAIT批次(美元)
表837 2018-2032年按类型分列的骨骼制品市场中的KUWAIT ArCHWIRE(美元)
表838 2018-2032年按类型分列的骨骼制品市场上的科威特工人和被拘留者 (千)
表839 2018-2032年按申请分列的科威特矫形商品市场(千美元)
表840 2018-2032年按申请分列的骨骼制品市场对科威特的治疗情况(千美元)
表841 按终端用户分列的2018-2032年科威特整形商品市场(千美元)
表842 2018-2032年按分布情况分列的科威特整形商品市场(千美元)
表843:2018-2032年按产品类型分列的QATAR ORTHONTION SUPLES TUPINE Market(美元)
表844 2018-2032年按产品类型分列的在ORTHONY Supplices市场上的可移植性器官应用(美元)
表845:按产品类型分列的2018-2032年在ORTHONY Supplies市场上的卡塔尔被拘留者(千美元)
表846:按产品类型分列的2018-2032年在ORTHONY SUPLET中固定的矫形应用(美元)
表847 表847 按类型分列的2018至2032年
表848:按构成部分分列的2018-2032年骨骼产品市场上的QATAR批量(千美元)
表849 2018-2032年按类型分列的矫形产品市场上的QATAR弹药(千分之一)
表850 按产品分列的2018-2032年市场价值和获得率(千美元)
表851 2018-2032年按产品类型分列的矫形产品市场上的QATAR电子产品
表852 肿瘤市场,按农药类型分列,2018-2032年(美元)
表853 按材料类型分列的质量矫形产品市场,2018-2032年(千美元)
表854 表854 按类型分列的2018-2032年
表855 按类型分列的2018-2032年ORTHONTY Supplies市场中的QATAR ArCHWIRE(美元)
表856:按类型分列的2018-2032年在ORTHONICAL SUPLET市场上的卡塔尔籍和居留者(美元)
表857:2018-2032年按申请分列的QATARORTHODONTION SUPIES Market(美元)
表858 按申请分列的2018至2032年在矫形用品市场接受的定性治疗(美元)
表859 按终端用户分列的2018-2032年QATARORTHONTION SUPIES市场(美元)
表860 2018-2032年按分配部门分列的肿瘤市场(千美元)
表861 2018-2032年按产品类型分列的东方矫形商品市场(千美元)
表862. 2018-2032年按产品类型分列的在ORTHONY SUPLES市场中可改性器官应用情况(美元)
表863 2018-2032年按产品类型分列的在ORTHONICY Supplies市场中的个人滞留人数(千)
表864 2018-2032年按产品类型分列的在ORTHONY SUPLET市场上的人工整形应用情况(千美元)
表865 按类型分列的2018-2032年骨骼制品市场上的Oman批量(千美元)
表866 骨骼制品市场中的Oman brakets,按构成部分分列,2018-2032年(千美元)
表867 按类型分列的2018-2032年奥曼弹药市场情况(千美元)
表868 2018-2032年按产品分列的兽药市场中阿曼的补贴和准入情况(千美元)
表869 按产品类型分列的2018至2032年ORTHONTY 市场上的OMAN电子产品(千美元)
表870 2018-2032年按Patient类型分列的半人半人半人半人半市场(美元)
表871 2018-2032年按材料类型分列的东方矫形商品市场(千美元)
表872 按类型分列的2018-2032年矫形用品市场上的阿曼人破损情况(千美元)
表873 2018-2032年按类型分列的ORTHONATY Supplies市场中的Oman ArCHWIRE(美元)
表874 2018-2032年按类型分列的ORTHONTHON Supplies市场中的人名移民和被拘留者(千)
表875 2018-2032年按申请分列的东方矫形商品市场(美元)
表876 按申请分列的2018至2032年按矫形产品市场分列的阿曼陵园治疗情况(美元)
表877 按最终用户分列的东方矫形市场,2018-2032年(千美元)
表878 2018-2032年按分销部门分列的Oman ORTHONY Supplies市场 (千美元)
表879 2018-2032年按产品类型分列的肉瘤市场(千美元)
表880 2018-2032年按产品类型分列的半导体市场中可移植性器官应用情况(美元)
表881 2018-2032年按产品类型分列的半导体市场保值人(美元)
表882 按产品类型分列的2018-2032年市场中半径整流体应用情况(美元)
表883 按类型分列的2018-2032年骨骼制品市场上的BaHRAIN Brackets(美元)
表884 按构成部分分列的2018-2032年骨骼制品市场上的Baherain Brackets(美元)
表885 按类型分列的2018-2032年骨骼制品市场上的BAHRAIN ArCHWIRES(美元)
表886 2018-2032年按产品分类的ORTHONY Supplices市场的BAHRIN ADHEN ALUSE 和获得者(美元)
表887 2018-2032年按产品类型分列的矫形用品市场上的巴赫拉恩电子产品(10万美元)
表888 2018-2032年按Patient类型分列的BAHRIN ORTHONY SUPLES 市场(美元)
表889 2018-2032年按材料类型分列的巴氏器官市场(千)
表890 表890 按类型分列的2018-2032年骨骼制品市场(千美元)
表891 2018-2032年按类型分列的矫形产品市场上的BAHRAIN ArCHWIRE(美元)
表892 2018-2032年按类型分列的ORTHONICY Supplike市场中的BAHRIN ALIN ALINER和持有者(美元)
表893 2018-2032年按申请分列的巴哈宁整形商品市场(千美元)
表894 2018-2032年按申请分列的半导体市场对半导体的治疗(美元)
表895 按终端用户分列的2018-2032年巴能矫形用品市场(千美元)
表896 2018-2032年按分销商品分类的肉瘤市场(千美元)
表897 2018-2032年按产品类型分列的中东和非洲矫形产品市场余额(千)
图片列表
图1 全球正统产品市场:部分
图2 全球正统市场:数据统计
图3 全球整形产品市场:DROC分析
图4 全球正统市场:全球各区域市场分析
图5 全球整形产品市场:公司研究分析
图6 全球ORTHONTHON Supplements Market:INTEVIE DEGROGRACHICS
图7 全球整形产品市场:DBMR市场位置
图8 全球有机物市场:市场最终使用覆盖资源
图9 全球整形产品市场:Vendor Share分析
图10 全球正统市场:部分
图11 按产品类型分列的全球整形产品市场
图12 全球矫形产品市场执行摘要
图13 战略决定
图14 移动驱动市场需求调查的出现 2025年至2032年全球ORTHONTHOTION SUPLES市场的发展
图15 可用于2025年和2032年全球矫形产品市场份额
图16 北美洲预计在2025至2032年的最近期间,全球整形产品市场和亚太预计将与最高级社区一起增长
图17 亚太是2025年和2032年全球整形产品市场增长最快的市场
图18 全球矫形产品市场:按产品类型分列,2024年
图19 全球矫形产品市场:按产品类型分列,2025-2032年(千美元)
图20 全球正统市场:按产品类型分列,CAGR(2025-2032年)
图21 全球整形产品市场:按产品类型、生命线市场分列
图22 全球兽药市场:按农药类型分列,2024年
图23 全球车辆市场:按农药类型分列,2025-2032年(千美元)
图24 全球兽药市场:按Patient Type, CAGR(2025-2032年)
图25 全球车辆市场:按倾向类型、生命线
图26 全球矫形市场:按材料类型分列,2024年
图27 全球矫形产品市场:按材料类型分列,2025-2032年(千美元)
图28 全球矫形市场:按材料类型,CAGR(2025-2032年)
图29 全球整形产品市场:按材料类型、生命线市场
图30 全球矫形产品市场:按申请分列,2024年
图31 全球矫形产品市场:按申请分列,2025-2032年(美元)
图32 全球矫形市场:按申请分列,CAGR(2025-2032)
图33 全球整形产品市场:按应用、生命线
图34 全球矫形产品市场:按2024年终端用户分列
图35 全球矫形产品市场:按最终用户分列,2025-2032年(千美元)
图36 全球矫形市场:按终端用户分列,Cagr(2025-2032年)
图37 全球矫形产品市场:按终端用户分列
图38 全球矫形产品市场:按分配模式分列,2024年
图39 全球矫形产品市场:2025-2032年按销售市场分列的数据(千美元)
图40 全球矫形产品市场:Cagr公司(2025-2032年)
图41 全球整形产品市场:按分销市场、生命线市场分列
图42 全球整形产品市场:标签(2024年)
图43 全球矫形产品市场:2024年公司股份(%)
图44 北美矫形市场:2024年公司住宅(%)
图45 欧洲矫形产品市场:2024年公司住房(%)
图46 亚洲-太平洋矫形产品市场:2024年公司住房(%)
研究方法
数据收集和基准年分析是使用具有大样本量的数据收集模块完成的。该阶段包括通过各种来源和策略获取市场信息或相关数据。它包括提前检查和规划从过去获得的所有数据。它同样包括检查不同信息源中出现的信息不一致。使用市场统计和连贯模型分析和估计市场数据。此外,市场份额分析和关键趋势分析是市场报告中的主要成功因素。要了解更多信息,请请求分析师致电或下拉您的询问。
DBMR 研究团队使用的关键研究方法是数据三角测量,其中包括数据挖掘、数据变量对市场影响的分析和主要(行业专家)验证。数据模型包括供应商定位网格、市场时间线分析、市场概览和指南、公司定位网格、专利分析、定价分析、公司市场份额分析、测量标准、全球与区域和供应商份额分析。要了解有关研究方法的更多信息,请向我们的行业专家咨询。
可定制
Data Bridge Market Research 是高级形成性研究领域的领导者。我们为向现有和新客户提供符合其目标的数据和分析而感到自豪。报告可定制,包括目标品牌的价格趋势分析、了解其他国家的市场(索取国家列表)、临床试验结果数据、文献综述、翻新市场和产品基础分析。目标竞争对手的市场分析可以从基于技术的分析到市场组合策略进行分析。我们可以按照您所需的格式和数据样式添加您需要的任意数量的竞争对手数据。我们的分析师团队还可以为您提供原始 Excel 文件数据透视表(事实手册)中的数据,或者可以帮助您根据报告中的数据集创建演示文稿。

