Asia Pacific Dandruff Treatment Market
Tamaño del mercado en miles de millones de dólares
Tasa de crecimiento anual compuesta (CAGR) :
% 
 USD
1.65 Billion
USD
2.43 Billion
2024
2032
USD
1.65 Billion
USD
2.43 Billion
2024
2032
| 2025 –2032 | |
| USD 1.65 Billion | |
| USD 2.43 Billion | |
| % | |
|
Segmentación del mercado de tratamientos anticaspa en Asia-Pacífico por tipo (caspa fúngica, caspa relacionada con piel seca, caspa relacionada con cuero cabelludo graso, caspa relacionada con enfermedades), modalidad de prescripción (sin receta, con receta), producto (sin medicamentos, con medicamentos), tipo de fármaco (de marca, genéricos), grupo de edad (adultos, niños, neonatos), género (masculino, femenino), usuario final (atención domiciliaria, centros dermatológicos, clínicas especializadas, otros), tipo de distribución (supermercados/hipermercados, tiendas de conveniencia, farmacias, tiendas minoristas, tiendas en línea, otros), país (Japón, China, Australia, Corea del Sur, India, Singapur, Tailandia, Indonesia, Malasia, Filipinas, Vietnam y resto de Asia-Pacífico): tendencias del sector y pronóstico hasta 2032.
Tamaño del mercado de tratamientos para la caspa
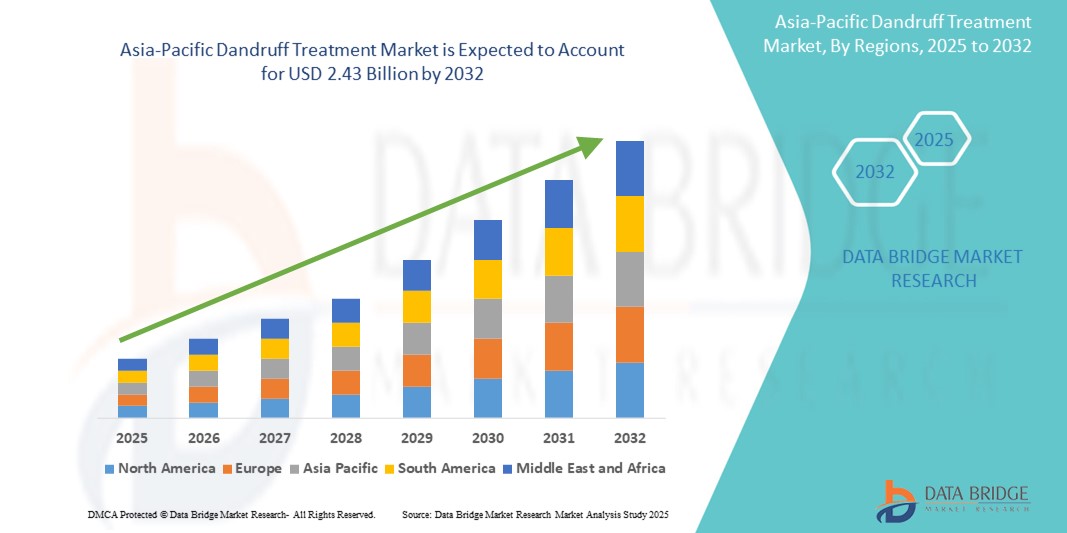
- El tamaño del mercado de tratamiento de la caspa en Asia-Pacífico se valoró en USD 1.650 millones en 2024 y se espera que alcance los USD 2.430 millones para 2032 , con una CAGR del 8,6 % durante el período de pronóstico.
- El mercado de tratamientos anticaspa en Asia-Pacífico abarca una amplia gama de champús medicados, formulaciones tópicas, productos sin aclarado y terapias sistémicas diseñadas para controlar y prevenir la caspa causada por factores como la dermatitis seborreica, el crecimiento excesivo de Malassezia y la sequedad del cuero cabelludo. Estos tratamientos son esenciales para aliviar la descamación, el picor, la irritación y la inflamación del cuero cabelludo en diversas poblaciones de pacientes de la región.
- La creciente prevalencia de trastornos del cuero cabelludo, la mayor concienciación de los consumidores sobre el cuidado personal y la higiene, y la mayor disponibilidad de tratamientos sin receta han impulsado significativamente su adopción en el mercado. Los avances en la tecnología de formulación, como los productos antirrecaída de larga duración, sin sulfatos y con pH equilibrado, están mejorando la eficacia del tratamiento, la adherencia del paciente y los resultados generales en la salud del cuero cabelludo.
Análisis del mercado de tratamientos para la caspa
- El mercado de tratamientos anticaspa en Asia-Pacífico se ve impulsado por la creciente incidencia de afecciones del cuero cabelludo, como la dermatitis seborreica, las infecciones fúngicas y la sequedad del cuero cabelludo, junto con una mayor concienciación de los consumidores sobre el cuidado personal y la salud capilar. El crecimiento de la población urbana, el aumento de los ingresos disponibles y la mayor demanda de productos innovadores recomendados por dermatólogos están acelerando aún más el crecimiento del mercado en toda la región.
- Los avances tecnológicos, como el desarrollo de nuevas fórmulas antifúngicas, champús sin sulfatos y con pH equilibrado, y tratamientos sin aclarado de acción prolongada, están transformando el panorama del tratamiento anticaspa. La adopción de soluciones herbales y naturales con ingredientes como el aceite de árbol de té, el ácido salicílico y el alquitrán de hulla está ganando terreno entre los consumidores que buscan alternativas más seguras y sostenibles.
- India domina el mercado de tratamientos anticaspa en Asia-Pacífico, con la mayor cuota de mercado, un 28,3%, en 2025. Esto se debe a la alta prevalencia de caspa entre la población joven, la sólida presencia de marcas nacionales e internacionales y el rápido crecimiento de los canales de distribución de comercio electrónico. La amplia base de consumidores del país, las frecuentes innovaciones de productos y la creciente influencia del marketing digital y las recomendaciones en redes sociales contribuyen a su liderazgo en el mercado.
- Se prevé que los tratamientos para la caspa relacionados con enfermedades dominen el mercado de Asia-Pacífico, con una cuota de mercado del 41,2 % en 2025, gracias a su eficacia demostrada, facilidad de aplicación y disponibilidad en diferentes rangos de precios. Estos productos siguen siendo la primera opción de tratamiento para casos de caspa leve a moderada, mientras que las terapias combinadas y las soluciones con receta se utilizan cada vez más para afecciones graves o recurrentes.
Alcance del informe y segmentación del mercado de tratamiento de la caspa
|
Atributos |
Análisis clave del mercado del tratamiento de la caspa |
|
Segmentos cubiertos |
|
|
Países cubiertos |
Asia-Pacífico
|
|
Actores clave del mercado |
|
|
Oportunidades de mercado |
|
|
Conjuntos de información de datos de valor añadido |
Además de los conocimientos sobre escenarios de mercado, como valor de mercado, tasa de crecimiento, segmentación, cobertura geográfica y actores principales, los informes de mercado seleccionados por Data Bridge Market Research también incluyen análisis en profundidad de expertos, análisis de precios, análisis de participación de marca, encuesta de consumidores, análisis demográfico, análisis de la cadena de suministro, análisis de la cadena de valor, descripción general de materias primas/consumibles, criterios de selección de proveedores, análisis PESTLE, análisis de Porter y marco regulatorio. |
Tendencias del mercado de tratamientos para la caspa
“Cambio hacia formulaciones naturales, interacción digital y personalización”
- Una tendencia clave en el mercado de tratamientos anticaspa de Asia-Pacífico es la creciente preferencia de los consumidores por productos herbales, naturales y dermatológicamente probados. Las fórmulas con aceite de árbol de té, aloe vera, extractos de neem y otros ingredientes vegetales están ganando popularidad debido a su aparente seguridad y sus mínimos efectos secundarios, especialmente entre los consumidores más jóvenes y las personas con cuero cabelludo sensible.
- Por ejemplo, la gama Anti-Caspa de Himalaya aprovecha ingredientes activos a base de hierbas como el aceite de árbol de té y el romero para combatir el crecimiento de hongos y al mismo tiempo calmar la irritación, en línea con la creciente preferencia por el cuidado holístico y preventivo del cuero cabelludo.
- Las marcas aprovechan cada vez más el marketing digital y los canales de comercio electrónico para educar a los consumidores sobre la salud del cuero cabelludo e impulsar la adopción de productos. Las herramientas interactivas, las colaboraciones con influencers y las campañas específicas en redes sociales están mejorando la concienciación y la interacción de los consumidores en los mercados urbanos y semiurbanos.
- El mercado está experimentando una creciente demanda de tratamientos anticaspa personalizados, adaptados a cada tipo de cuero cabelludo, textura del cabello y gravedad de los síntomas. Las empresas están introduciendo tratamientos personalizables que combinan champús medicados, sérums sin aclarado y exfoliantes para el cuero cabelludo para abordar necesidades específicas.
- La creciente incidencia de la caspa, relacionada con el estrés, la contaminación y los cambios en el estilo de vida, refuerza la demanda de productos para el cuidado del cuero cabelludo como parte de la higiene diaria. Esta dinámica impulsa el crecimiento sostenido de los segmentos de productos de consumo masivo y premium en Asia-Pacífico.
Dinámica del mercado de tratamientos anticaspa
Conductor
Creciente concienciación sobre la salud del cuero cabelludo y demanda de tratamientos eficaces
- La creciente prevalencia de la caspa y la dermatitis seborreica en Asia-Pacífico, impulsada por factores como la contaminación, los climas húmedos, el estrés y los cambios en las rutinas de cuidado del cabello, está impulsando significativamente la demanda de productos de tratamiento efectivos y convenientes.
- Por ejemplo, el aumento de los ingresos disponibles y la urbanización en países como India, China e Indonesia están contribuyendo a un mayor gasto en cuidado personal y tratamientos especializados para el cuero cabelludo.
- La creciente conciencia entre los consumidores sobre la importancia de mantener la higiene del cuero cabelludo y prevenir la recurrencia está impulsando la adopción de champús medicinales, tratamientos sin enjuague y fórmulas a base de hierbas.
- Las campañas de marketing agresivas y las iniciativas educativas de las marcas líderes están desempeñando un papel fundamental a la hora de reducir el estigma en torno a la caspa y fomentar un tratamiento proactivo.
- La expansión de los canales minoristas organizados, las plataformas de comercio electrónico y las clínicas dermatológicas está mejorando la accesibilidad a los productos, especialmente en las economías emergentes, donde las soluciones de venta libre se prefieren cada vez más para casos leves y moderados. La creciente incidencia de sensibilidad cutánea y alergias asociadas a tratamientos químicos agresivos está impulsando la demanda de formulaciones dermatológicamente probadas y sin sulfatos, lo que amplía aún más el segmento premium del mercado.
Restricción/Desafío
Sensibilidad al precio y complejidad regulatoria
- El alto costo de los productos de primera calidad y especializados para el tratamiento de la caspa (en particular las fórmulas recomendadas por dermatólogos y las soluciones con receta) limita la accesibilidad para las poblaciones de bajos ingresos en varios mercados de Asia y el Pacífico.
- Por ejemplo, los champús medicinales que contienen agentes antimicóticos patentados o terapias combinadas suelen tener precios que están fuera del alcance de los consumidores del mercado masivo, lo que restringe su adopción generalizada.
- Los requisitos regulatorios para productos medicinales y cosmecéuticos varían significativamente en la región, lo que genera complejidad para los fabricantes que buscan la aprobación y el acceso al mercado. Países como India, China y Japón aplican estándares específicos de etiquetado, pruebas de seguridad y afirmaciones de marketing, lo que prolonga los plazos de lanzamiento de productos y los costos de cumplimiento.
- La presencia de productos falsificados y de calidad inferior para el tratamiento de la caspa en los canales minoristas informales socava la confianza del consumidor y plantea riesgos de seguridad, lo que dificulta que las marcas reconocidas diferencien sus ofertas y mantengan la integridad de la marca.
- Están surgiendo preocupaciones sobre la privacidad de los datos relacionados con las herramientas de análisis del cuero cabelludo digital, las aplicaciones móviles y las consultas en línea a medida que más marcas integran la tecnología en la personalización del tratamiento, lo que crea desafíos adicionales de cumplimiento y confianza en mercados con regulaciones de protección de datos en evolución.
Alcance del mercado de tratamiento de la caspa
El mercado está segmentado según tipo, modo de prescripción, producto, tipo de medicamento, grupo de edad, género, usuario final y tipo de distribución.
- Por tipo
Según el tipo, el mercado de tratamiento de la caspa se divide en caspa fúngica, caspa relacionada con la piel seca, caspa relacionada con el cuero cabelludo graso y caspa relacionada con enfermedades. Se prevé que el segmento de caspa relacionada con enfermedades domine el mercado con la mayor cuota de ingresos, un 41,2 %, en 2025, debido a la alta prevalencia de afecciones del cuero cabelludo relacionadas con Malassezia y al uso generalizado de champús antimicóticos y tratamientos farmacológicos dirigidos a esta etiología.
Se anticipa que el segmento de caspa relacionada con el cuero cabelludo graso experimentará la tasa de crecimiento más rápida del 5,2 % entre 2025 y 2032, impulsado por los cambios en los estilos de vida, el aumento de los niveles de contaminación y una mayor conciencia de las soluciones específicas para el cuidado del cuero cabelludo para el control del sebo.
- Por modo de prescripción
Según el método de prescripción, el mercado de tratamientos anticaspa se segmenta en productos de venta libre y con receta. El modelo de dos compartimentos obtuvo la mayor cuota de mercado en 2025 gracias a la fuerte presencia de champús antimicóticos y tratamientos para el cuero cabelludo de venta libre, disponibles en farmacias, supermercados y plataformas en línea.
Se espera que la Prescripción experimente la CAGR más rápida entre 2025 y 2032, respaldada por la creciente incidencia de casos de dermatitis seborreica crónica y grave que requieren tratamiento supervisado por dermatólogos.
- Por producto
Según el producto, el mercado de tratamientos anticaspa se segmenta en medicamentos no medicados y medicamentosos. Los medicamentosos obtuvieron la mayor cuota de mercado en 2025, lo que refleja una fuerte demanda de productos clínicamente probados que contienen ingredientes activos como ketoconazol, piritionato de zinc y sulfuro de selenio.
Se espera que el sector no medicado experimente la CAGR más rápida entre 2025 y 2032 y crezca de manera constante, impulsado por el interés de los consumidores en productos naturales, herbales y cosméticos para el control de la caspa.
- Por tipo de fármaco
Según el tipo de medicamento, el mercado de tratamientos anticaspa se segmenta en medicamentos de marca y genéricos. Los medicamentos de marca obtuvieron la mayor cuota de mercado en 2025 gracias a la confianza en la marca, las agresivas campañas de marketing y el posicionamiento premium del producto.
Se espera que los genéricos experimenten la CAGR más rápida entre 2025 y 2032, a medida que la asequibilidad y la expansión de la capacidad de fabricación de genéricos mejoran el acceso a tratamientos efectivos.
- Por grupo de edad
Según el grupo de edad, el mercado de tratamiento anticaspa se segmenta en adultos, niños y neonatos. Los adultos representaron la mayor cuota de mercado en 2025, impulsados por la mayor incidencia de caspa entre la población activa y el uso generalizado de productos preventivos para el cuero cabelludo.
Se espera que la pediatría sea testigo de la CAGR más rápida entre 2025 y 2032, respaldada por la creciente conciencia de las afecciones del cuero cabelludo en los niños y el desarrollo de fórmulas suaves y específicas para niños.
- Por género
En función del género, el mercado de tratamientos anticaspa se segmenta en hombres y mujeres. El segmento masculino obtuvo la mayor cuota de mercado en 2025, ya que la prevalencia de caspa suele ser mayor entre los hombres debido a factores como una mayor producción de sebo y ciclos capilares más cortos.
Se espera que el sector femenino sea testigo de la CAGR más rápida entre 2025 y 2032, creciendo a un ritmo sólido, lo que refleja una mayor adopción de soluciones cosméticas y premium adaptadas a las preferencias de cuidado del cabello y el cuero cabelludo de las mujeres.
- Por los usuarios finales
En función de los usuarios finales, el mercado de tratamiento de la caspa se segmenta en atención domiciliaria, centros dermatológicos, clínicas especializadas y otros. La atención domiciliaria obtuvo la mayor cuota de mercado en 2025, gracias a la comodidad y asequibilidad de los tratamientos autoadministrados.
Se espera que los Centros de Dermatología sean testigos de la CAGR más rápida de 2025 a 2032, un crecimiento significativo, impulsado por el creciente número de pacientes que buscan asesoramiento profesional para afecciones de caspa persistentes y graves.
- Por tipo de distribución
Según el tipo de distribución, el mercado de tratamientos anticaspa se segmenta en supermercados/hipermercados, tiendas de conveniencia, farmacias, tiendas minoristas, tiendas en línea y otros. El segmento de farmacias representó la mayor participación en los ingresos del mercado en 2024, gracias a la sólida confianza de los consumidores y la amplia disponibilidad del producto.
Se espera que el segmento de tiendas en línea experimente la CAGR más rápida entre 2025 y 2032, lo que refleja la rápida adopción de plataformas de comercio electrónico, promociones digitales y servicios de entrega a domicilio en Asia-Pacífico.
Análisis regional del mercado de tratamiento de la caspa
- India domina el mercado de tratamientos anticaspa en Asia-Pacífico, con la mayor cuota de ingresos, un 28,5%, en 2025. Este liderazgo se basa en la gran población del país, la alta prevalencia de caspa debido al clima húmedo y la gran concienciación de los consumidores sobre la higiene del cuero cabelludo. El dinámico sector del cuidado personal en India se caracteriza por la presencia tanto de marcas multinacionales como de empresas nacionales consolidadas como Hindustan Unilever, Marico y Dabur, que innovan y amplían activamente sus carteras de productos anticaspa.
- La amplia disponibilidad de fórmulas medicinales y herbales en farmacias, supermercados y plataformas de comercio electrónico sustenta una demanda constante. Además, las agresivas campañas de marketing y la promoción de celebridades impulsan la visibilidad del producto y su adopción por parte de los consumidores. El auge del comercio minorista organizado, el crecimiento de las clínicas dermatológicas en áreas metropolitanas como Bombay, Delhi y Bangalore, y el aumento de la renta disponible consolidan aún más la posición de la India en el mercado. La transición hacia tratamientos naturales, sin sulfatos y con pH equilibrado es una tendencia destacada que impulsa las ventas de productos premium.
Análisis del mercado de tratamientos anticaspa en China
Se espera que el mercado chino de tratamientos anticaspa experimente un sólido crecimiento durante el período de pronóstico, impulsado por la rápida urbanización, los cambios en el estilo de vida y un mayor gasto en productos premium para el cuidado personal. Grandes centros urbanos como Shanghái, Pekín y Cantón están experimentando una mayor demanda de champús medicados y tratamientos especializados para la caspa y la dermatitis seborreica. El próspero ecosistema de comercio electrónico de China, liderado por plataformas como Tmall y JD.com, facilita una amplia distribución de productos nacionales e importados, incluyendo marcas internacionales como Head & Shoulders, Selsun Blue y Kérastase. El crecimiento de la población de clase media, sumado a una mayor conciencia sobre la salud del cuero cabelludo y la disponibilidad de soluciones recomendadas por dermatólogos, está impulsando la expansión del mercado. Además, las iniciativas regulatorias para mejorar la calidad y los estándares de seguridad de los productos están fortaleciendo la confianza del consumidor en los tratamientos anticaspa, tanto medicados como cosméticos.
Análisis del mercado japonés de tratamientos anticaspa
El mercado japonés de tratamientos anticaspa está en camino de un crecimiento sostenido, impulsado por una población que envejece y busca cada vez más un cuidado del cuero cabelludo suave y eficaz, y por la preferencia de los consumidores por productos de alta calidad y dermatológicamente probados. Fabricantes líderes de productos para el cuidado personal, como Kao Corporation y Shiseido, han introducido fórmulas especializadas para piel sensible, cuero cabelludo seco y caspa crónica. Los consumidores japoneses muestran una fuerte fidelidad a la marca, favoreciendo productos con validación clínica y sistemas de administración innovadores. La demanda se ve reforzada por la popularidad de los tratamientos capilares multifuncionales que combinan la prevención de la caspa con la nutrición capilar y el rejuvenecimiento del cuero cabelludo. Centros urbanos como Tokio, Osaka y Nagoya son centros clave para el lanzamiento de productos y las campañas promocionales. El creciente interés de los consumidores por fórmulas naturales y sin aditivos también impulsa el crecimiento del segmento premium.
Cuota de mercado del tratamiento de la caspa
La industria del tratamiento de la caspa está liderada principalmente por empresas bien establecidas, entre las que se incluyen:
- Hindustan Unilever Limited (India)
- Procter & Gamble (EE. UU.)
- L'Oréal SA (Francia)
- Johnson & Johnson Services, Inc. (EE. UU.)
- La Compañía Farmacéutica Himalaya (India)
- Corporación Kao (Japón)
- Shiseido Company, Limited (Japón)
- Marico Limited (India)
- Unza International Ltd (Singapur)
- Dabur India Ltd. (India)
- Galderma SA (Suiza)
- Cipla Ltd. (India)
- Reckitt Benckiser Group plc (Reino Unido)
- Alpecin (Grupo Dr. Wolff) (Alemania)
- Henkel AG & Co. KGaA (Alemania)
- HeadBlade, Inc. (EE. UU.)
- Phyto – Laboratoire Nativo (Francia)
- VLCC Personal Care Ltd. (India)
- Lotus Herbals Pvt. Ltd. (India)
- Emami Limited (India)
Últimos avances en el mercado de tratamiento de la caspa en Asia-Pacífico
- En mayo de 2025, Hindustan Unilever Limited lanzó el champú anticaspa Clear Complete Care Advanced en India y el Sudeste Asiático. Este champú, con una fórmula de pH equilibrado con carbón activado y principios activos clínicamente probados, combate la caspa persistente a la vez que mantiene la hidratación del cuero cabelludo. Esto refleja la creciente demanda de soluciones multifuncionales y dermatológicamente probadas por los consumidores en la región.
- En febrero de 2025, Marico Limited lanzó en India y Bangladesh un aceite capilar anticaspa ayurvédico avanzado Parachute mejorado, con ingredientes de neem, romero y árbol de té. Este lanzamiento subraya la fuerte tendencia del mercado hacia fórmulas naturales y herbales para el cuidado preventivo del cuero cabelludo.
- En noviembre de 2024, Johnson & Johnson Services, Inc. amplió la disponibilidad del champú terapéutico Neutrogena T/Gel en Japón, Corea del Sur y Australia a través de importantes plataformas de comercio electrónico y cadenas de farmacias, apoyando la creciente preferencia por los tratamientos recomendados por dermatólogos en Asia-Pacífico.
- En agosto de 2024, L'Oréal SA lanzó una nueva gama Kérastase Symbiose en China y Singapur, que combina ácido salicílico y piroctona olamina para el control intensivo de la caspa y la reparación de la barrera del cuero cabelludo, abordando la demanda de tratamientos premium de calidad de salón.
- En marzo de 2024, The Himalaya Drug Company presentó una variante mejorada del champú anticaspa Gentle Care con una eficacia antimicótica mejorada y una fórmula sin sulfatos en India y Malasia, dirigida a los consumidores que buscan productos suaves de uso diario para el cuero cabelludo sensible.
SKU-
Obtenga acceso en línea al informe sobre la primera nube de inteligencia de mercado del mundo

- Panel de análisis de datos interactivo
- Panel de análisis de empresas para oportunidades con alto potencial de crecimiento
- Acceso de analista de investigación para personalización y consultas
- Análisis de la competencia con panel interactivo
- Últimas noticias, actualizaciones y análisis de tendencias
- Aproveche el poder del análisis de referencia para un seguimiento integral de la competencia
Tabla de contenido
1 INTRODUCCIÓN
1.1 OBJETIVOS DEL ESTUDIO
1.2 DEFINICIÓN DE MERCADO
1.3 DESCRIPCIÓN GENERAL DEL MERCADO DE TRATAMIENTOS CONTRA LA CASPA EN ASIA-PACÍFICO
1.4 LIMITACIONES
1.5 MERCADOS CUBIERTOS
2 SEGMENTACIÓN DEL MERCADO
2.1 MERCADOS CUBIERTOS
2.2 ÁMBITO GEOGRÁFICO
2,3 AÑOS CONSIDERADOS PARA EL ESTUDIO
2.4 MONEDA Y PRECIOS
2.5 MODELO DE VALIDACIÓN DE DATOS TRÍPODE DBMR
2.6 MODELADO MULTIVARIADO
2.7 CURVA DE LÍNEA DE VIDA TIPO
2.8 ENTREVISTAS PRINCIPALES CON LÍDERES DE OPINIÓN CLAVE
2.9 CUADRÍCULA DE POSICIÓN DE MERCADO DBMR
2.1 ANÁLISIS DE LA PARTICIPACIÓN DE LOS PROVEEDORES
2.11 FUENTES SECUNDARIAS
2.12 SUPUESTOS
3 RESUMEN EJECUTIVO
4 ESCENARIO REGULADOR PARA EL TRATAMIENTO DE LA CASPA
4.1.1 ESCENARIO REGULADOR DE JAPÓN PARA EL TRATAMIENTO DE LA CASPA
4.1.2 ESCENARIO REGULADOR DE CHINA PARA EL TRATAMIENTO DE LA CASPA
4.1.3 ESCENARIO REGULATORIO EUROPEO PARA EL TRATAMIENTO DE LA CASPA
5 EPIDEMIOLOGÍA
6 PANORAMA GENERAL DEL MERCADO
6.1 CONDUCTORES
6.1.1 AUMENTO DEL NÚMERO DE ESPECIES DE MALASSEZIA EN EL MEDIO AMBIENTE
6.1.2 AUMENTO DE LA PREVALENCIA DEL VIH
6.1.3 CRECIMIENTO DE LA CONCIENCIA SOBRE LA ENFERMEDAD OBJETIVO
6.1.4 AUMENTO DEL NIVEL DE ESTRÉS
6.1.5 CAMBIO DE ESTILO DE VIDA Y CRECIENTE URBANIZACIÓN
6.2 RESTRICCIONES
6.2.1 AUMENTO DE LA ADOPCIÓN DE LA CAMPAÑA NO-POO
6.2.2 DISPONIBILIDAD DE DIVERSOS SUSTITUTOS PARA EL TRATAMIENTO DE LA CASPA
6.2.3 EFECTOS SECUNDARIOS DE LOS PRODUCTOS PARA EL TRATAMIENTO DE LA CASPA
6.3 OPORTUNIDADES
6.3.1 INTRODUCCIÓN DE PRODUCTOS INNOVADORES
6.3.2 INICIATIVAS ESTRATÉGICAS DE LOS AGENTES DEL MERCADO
6.3.3 AUMENTO DEL COMERCIO ELECTRÓNICO DE PRODUCTOS PARA EL CUIDADO DEL CABELLO
6.3.4 AUMENTO DE LA RENTA DISPONIBLE
6.4 DESAFÍOS
6.4.1 RETIRADA DE PRODUCTO
6.4.2 AUMENTO DE LA PREVALENCIA DE LA COVID-19
6.4.3 PROBLEMAS AMBIENTALES CON LA ELIMINACIÓN DE ENVASES DE CHAMPÚ
7 IMPACTO DE LA COVID-19 EN EL MERCADO DE TRATAMIENTOS CONTRA LA CASPA DE ASIA-PACÍFICO
7.1 IMPACTO EN LOS PRECIOS
7.2 IMPACTO EN LA DEMANDA
7.3 IMPACTO EN LA CADENA DE SUMINISTRO
7.4 DECISIONES ESTRATÉGICAS PARA FABRICANTES
7.5 CONCLUSIÓN
8 MERCADO DE TRATAMIENTOS CONTRA LA CASPA EN ASIA-PACÍFICO, POR TIPO
8.1 DESCRIPCIÓN GENERAL
8.2 CASPA POR HONGOS
8.3 CASPA RELACIONADA CON LA PIEL SECA
8.4 CASPA RELACIONADA CON EL CUERO CABELLUDO GRASO
8.5 CASPA RELACIONADA CON ENFERMEDADES
9 MERCADO DE TRATAMIENTOS PARA LA CASPA EN ASIA-PACÍFICO, POR MODO DE PRESCRIPCIÓN
9.1 INFORMACIÓN GENERAL
9.2 OTC
9.3 PRESCRIPCIÓN
10 MERCADO DE TRATAMIENTOS CONTRA LA CASPA EN ASIA-PACÍFICO, POR PRODUCTO
10.1 INFORMACIÓN GENERAL
10.2 NO MEDICADOS
10.2.1 CHAMPÚ
10.2.1.1 Champú anticaspa
10.2.1.1.1 Neem
10.2.1.1.2 Árbol del té
10.2.1.1.3 Reetha
10.2.1.1.4 Extracto de corteza de azufaifa
10.2.1.1.5 Coco
10.2.1.1.6 Hibisco
10.2.1.1.7 Otros
10.2.1.2 Champú normal
10.2.1.2.1 Champú para cabello normal
10.2.1.2.2 Champú para cabello graso
10.2.1.2.3 Champú para cabello seco y dañado
10.2.1.2.4 Champú voluminizador
10.2.1.2.5 Otros
10.2.2 ACEITES
10.2.2.1 Aceite de coco
10.2.2.2 Eucalipto
10.2.2.3 Aceite de limón
10.2.2.4 Girasol
10.2.2.5 Aceite de almendras
10.2.2.6 Aceite de argán
10.2.2.7 Otros
10.2.3 SUERO
10.2.3.1 Árbol del té
10.2.3.2 Eucalipto
10.2.3.3 Piroctona olamina
10.2.3.4 Alcanfor
10.2.3.5 Menta
10.2.3.6 Albahaca y cedro
10.2.3.7 Romero
10.2.3.8 Limón
10.2.3.9 Otros
10.2.4 MASCARILLA CAPILAR
10.2.4.1 Aceite de árbol de té
10.2.4.2 Aceite de limón
10.2.4.3 Aceite de argán
10.2.4.4 Otros
10.2.5 OTROS
10.3 MEDICADO
10.3.1 CHAMPÚ
10.3.1.1 Champús anticaspa
10.3.1.1.1 Champús con piritionato de zinc (Dermazinc, Head & Shoulders, Jason Dandruff Relief 2 en 1, otros)
10.3.1.1.2 Champús con sulfuro de selenio (Head & Shoulders Intensive, Selsun Blue, otros)
10.3.1.1.3 Champús que contienen ácido salicílico (Neutrogena T/Sal Shampoo, Baker's P & S, otros)
10.3.1.1.4 Champús de ketoconazol (Nizoral AD, Extina, otros)
10.3.1.1.5 Champús a base de alquitrán (Neutrogena T/Gel, Scytera, otros)
10.3.1.1.6 Otros
10.3.1.2 Champús normales
10.3.1.2.1 Champús para cabello normal
10.3.1.2.2 Champús para cabello graso
10.3.1.2.3 Champú para cabello seco y dañado
10.3.1.2.4 Champú voluminizador
10.3.1.2.5 Otros
10.3.2 CHAMPÚS SECOS
10.3.2.1 Alcohol desnaturalizado
10.3.2.2 Estearato de magnesio
10.3.2.3 Extracto de Laminaria Saccharina
10.3.2.4 Otros
11 MERCADO DE TRATAMIENTOS CONTRA LA CASPA EN ASIA-PACÍFICO, POR TIPO DE MEDICAMENTO
11.1 INFORMACIÓN GENERAL
11.2 DE MARCA
11.3 GENÉRICOS
12 MERCADO DE TRATAMIENTO DE LA CASPA EN ASIA-PACÍFICO, POR GRUPO DE EDAD
12.1 DESCRIPCIÓN GENERAL
12.2 ADULTOS
12.3 PEDIATRÍA
12.4 NEONATOS
13 MERCADO DE TRATAMIENTOS CONTRA LA CASPA EN ASIA-PACÍFICO, POR GÉNERO
13.1 DESCRIPCIÓN GENERAL
13.2 HOMBRE
13.3 MUJER
14 MERCADO DE TRATAMIENTO DE LA CASPA EN ASIA-PACÍFICO, POR USUARIO FINAL
14.1 7.1 DESCRIPCIÓN GENERAL
15 MERCADO DE TRATAMIENTO DE LA CASPA EN ASIA-PACÍFICO, POR TIPO DE DISTRIBUCIÓN
15.1 INFORMACIÓN GENERAL
15.2 SUPERMERCADOS/HIPERMERCADOS
15.3 TIENDAS DE CONVENIENCIA
15.4 FARMACIAS
15.5 TIENDAS MINORISTAS
15.6 TIENDAS EN LÍNEA
15.7 OTROS
16 MERCADO DE TRATAMIENTO DE LA CASPA EN ASIA-PACÍFICO, POR GEOGRAFÍA
16.1 ASIA-PACÍFICO
16.1.1 CHINA
16.1.2 JAPÓN
16.1.3 INDIA
16.1.4 AUSTRALIA
16.1.5 COREA DEL SUR
16.1.6 SINGAPUR
16.1.7 TAILANDIA
16.1.8 MALASIA
16.1.9 INDONESIA
16.1.10 FILIPINAS
16.1.11 VIETNAM
16.1.12 RESTO DE ASIA-PACÍFICO
17 MERCADO DE TRATAMIENTO DE LA CASPA EN ASIA-PACÍFICO: PANORAMA EMPRESARIAL
17.1 PANORAMA EMPRESARIAL DEL MERCADO DE TRATAMIENTO DE LA CASPA EN ASIA-PACÍFICO
17.1.1 ANÁLISIS DE ACCIONES DE LA EMPRESA: ASIA-PACÍFICO
18 ANÁLISIS FODA
19 PERFILES DE EMPRESAS
19.1 PROCTER & GAMBLE
19.1.1 INSTANTÁNEA DE LA EMPRESA
19.1.2 ANÁLISIS DE INGRESOS
19.1.3 ANÁLISIS DE LAS ACCIONES DE LA EMPRESA
19.1.4 PORTAFOLIO DE PRODUCTOS
19.1.5 DESARROLLO RECIENTE
19.2 UNILEVER
19.2.1 INSTANTÁNEA DE LA EMPRESA
19.2.2 ANÁLISIS DE INGRESOS
19.2.3 ANÁLISIS DE LAS ACCIONES DE LA EMPRESA
19.2.4 PORTAFOLIO DE PRODUCTOS
19.2.5 DESARROLLOS RECIENTES
19.3 L'ORÉAL
19.3.1 INSTANTÁNEA DE LA EMPRESA
19.3.2 ANÁLISIS DE INGRESOS
19.3.3 ANÁLISIS DE LAS ACCIONES DE LA EMPRESA
19.3.4 PORTAFOLIO DE PRODUCTOS
19.3.5 DESARROLLOS RECIENTES
19.4 CORPORACIÓN KAO
19.4.1 INSTANTÁNEA DE LA EMPRESA
19.4.2 ANÁLISIS DE INGRESOS
19.4.3 ANÁLISIS DE LAS ACCIONES DE LA EMPRESA
19.4.4 PORTAFOLIO DE PRODUCTOS
19.4.5 DESARROLLO RECIENTE
19.5 JOHNSON & JOHNSON CONSUMER INC. (UNA SUBSIDIARIA DE JOHNSON & JOHNSON SERVICES, INC.)
19.5.1 INSTANTÁNEA DE LA EMPRESA
19.5.2 ANÁLISIS DE INGRESOS
19.5.3 ANÁLISIS DE LAS ACCIONES DE LA EMPRESA
19.5.4 PORTAFOLIO DE PRODUCTOS
19.5.5 DESARROLLO RECIENTE
19.6 ACTICON CIENCIAS DE LA VIDA
19.6.1 INSTANTÁNEA DE LA EMPRESA
19.6.2 PORTAFOLIO DE PRODUCTOS
19.6.3 DESARROLLO RECIENTE
19.7 ALLIANCE PHARMA PLC
19.7.1 INSTANTÁNEA DE LA EMPRESA
19.7.2 ANÁLISIS DE INGRESOS
19.7.3 PORTAFOLIO DE PRODUCTOS
19.7.4 DESARROLLOS RECIENTES
19.8 ARCADIA ATENCIÓN MÉDICA AL CONSUMIDOR
19.8.1 INSTANTÁNEA DE LA EMPRESA
19.8.2 PORTAFOLIO DE PRODUCTOS
19.8.3 DESARROLLOS RECIENTES
19.9 ARION HEALTHCARE
19.9.1 INSTANTÁNEA DE LA EMPRESA
19.9.2 PORTAFOLIO DE PRODUCTOS
19.9.3 DESARROLLO RECIENTE S
19.1 CIPLA INC.
19.10.1 INSTANTÁNEA DE LA EMPRESA
19.10.2 ANÁLISIS DE INGRESOS
19.10.3 PORTAFOLIO DE PRODUCTOS
19.10.4 DESARROLLO RECIENTE
19.11 DABUR
19.11.1 INSTANTÁNEA DE LA EMPRESA
19.11.2 ANÁLISIS DE INGRESOS
19.11.3 PORTAFOLIO DE PRODUCTOS
19.11.4 DESARROLLO RECIENTE
19.12 GLENMARK PHARMACEUTICALS LIMITED
19.12.1 INSTANTÁNEA DE LA EMPRESA
19.12.2 ANÁLISIS DE INGRESOS
19.12.3 PORTAFOLIO DE PRODUCTOS
19.12.4 DESARROLLO RECIENTE
19.13 HENKEL AG & CO. KGAA
19.13.1 INSTANTÁNEA DE LA EMPRESA
19.13.2 ANÁLISIS DE INGRESOS
19.13.3 PORTAFOLIO DE PRODUCTOS
19.13.4 DESARROLLOS RECIENTES
19.14 JĀSÖN® NATURAL PRODUCTS, INC. (UNA SUBSIDIARIA DE HAIN CELESTIAL)
19.14.1 INSTANTÁNEA DE LA EMPRESA
19.14.2 ANÁLISIS DE INGRESOS
19.14.3 PORTAFOLIO DE PRODUCTOS
19.14.4 DESARROLLO RECIENTE
19.15 SISTEMAS DE JOHN PAUL MITCHELL
19.15.1 INSTANTÁNEA DE LA EMPRESA
19.15.2 PORTAFOLIO DE PRODUCTOS
19.15.3 DESARROLLOS RECIENTES
19.16 L'OCCITANE EN PROVENCE INTERNATIONAL SA. (FILIAL DEL GRUPO L'OCCITANE)
19.16.1 INSTANTÁNEA DE LA EMPRESA
19.16.2 ANÁLISIS DE INGRESOS
19.16.3 PORTAFOLIO DE PRODUCTOS
19.16.4 DESARROLLOS RECIENTES
19,17 MM AYURVEDIC (P) LTD.
19.17.1 INSTANTÁNEA DE LA EMPRESA
19.17.2 PORTAFOLIO DE PRODUCTOS
19.17.3 DESARROLLO RECIENTE
19.18 NIKOLE KOZMETICS
19.18.1 INSTANTÁNEA DE LA EMPRESA
19.18.2 PORTAFOLIO DE PRODUCTOS
19.18.3 DESARROLLO RECIENTE
19.19 PRODUCTOS PHILIP KINGSLEY LTD.
19.19.1 INSTANTÁNEA DE LA EMPRESA
19.19.2 PORTAFOLIO DE PRODUCTOS
19.19.3 ACONTECIMIENTOS RECIENTES
19.2 FITO
19.20.1 INSTANTÁNEA DE LA EMPRESA
19.20.2 PORTAFOLIO DE PRODUCTOS
19.20.3 DESARROLLO RECIENTE
19.21 SEBAPHARMA GMBH & CO. KG
19.21.1 INSTANTÁNEA DE LA EMPRESA
19.21.2 PORTAFOLIO DE PRODUCTOS
19.21.3 DESARROLLO RECIENTE
19.22 PRODUCTOS QUÍMICOS Y COSMÉTICOS SOBERANOS
19.22.1 INSTANTÁNEA DE LA EMPRESA
19.22.2 PORTAFOLIO DE PRODUCTOS
19.22.3 DESARROLLO RECIENTE
19.23 VYOME TERAPÉUTICA INC.
19.23.1 INSTANTÁNEA DE LA EMPRESA
19.23.2 PORTAFOLIO DE PRODUCTOS
19.23.3 ACONTECIMIENTOS RECIENTES
19.24 CIENCIA FARMACÉUTICA VIENCEE
19.24.1 INSTANTÁNEA DE LA EMPRESA
19.24.2 PORTAFOLIO DE PRODUCTOS
19.24.3 DESARROLLO RECIENTE
20 CUESTIONARIO
21 INFORMES RELACIONADOS
Lista de Tablas
LISTA DE TABLAS
TABLA 1 MERCADO DE TRATAMIENTOS CONTRA LA CASPA EN ASIA-PACÍFICO, POR TIPO, 2019-2028 (MILLONES DE USD)
TABLA 2 CASPA HÚMICA EN EL MERCADO DE TRATAMIENTO DE LA CASPA EN ASIA-PACÍFICO, POR REGIÓN, 2019-2028 (MILLONES DE USD)
TABLA 3 CASPA RELACIONADA CON LA PIEL SECA EN EL MERCADO DE TRATAMIENTOS CONTRA LA CASPA DE ASIA-PACÍFICO, POR REGIÓN, 2019-2028 (MILLONES DE USD)
TABLA 4 MERCADO DE TRATAMIENTOS PARA LA CASPA RELACIONADOS CON EL CUERO CABELLUDO GRASO EN ASIA-PACÍFICO, POR REGIÓN, 2019-2028 (MILLONES DE USD)
TABLA 5 MERCADO DE TRATAMIENTO DE LA CASPA RELACIONADO CON ENFERMEDADES EN ASIA-PACÍFICO, POR REGIÓN, 2019-2028 (MILLONES DE USD)
TABLA 6 MERCADO DE TRATAMIENTOS CONTRA LA CASPA EN ASIA-PACÍFICO, POR MODO DE PRESCRIPCIÓN, 2019-2028 (MILLONES DE USD)
TABLA 7 MERCADO DE TRATAMIENTOS PARA LA CASPA DE VENTA LIBRE EN ASIA-PACÍFICO, POR REGIÓN, 2019-2028 (MILLONES DE USD)
TABLA 8 MERCADO DE PRESCRIPCIÓN DE TRATAMIENTOS CONTRA LA CASPA EN ASIA-PACÍFICO, POR REGIÓN, 2019-2028 (MILLONES DE USD)
TABLA 9 MERCADO DE TRATAMIENTOS CONTRA LA CASPA EN ASIA-PACÍFICO, POR TIPO, 2018-2028 (MILLONES DE USD)
TABLA 10 MERCADO DE TRATAMIENTOS PARA LA CASPA SIN MEDICAMENTOS DE ASIA-PACÍFICO, POR REGIÓN, 2017-2027 (MILLONES DE USD)
TABLA 11 MERCADO DE TRATAMIENTOS PARA LA CASPA SIN MEDICAMENTOS DE ASIA-PACÍFICO, POR PRODUCTO, 2019-2028 (MILLONES DE USD)
TABLA 12 CHAMPÚ EN EL MERCADO DE TRATAMIENTOS CONTRA LA CASPA (NO MEDICADOS) DE ASIA-PACÍFICO, POR PRODUCTO, 2019-2028 (MILLONES DE USD)
TABLA 13 CHAMPÚS ANTICASPA DE ASIA-PACÍFICO EN EL MERCADO DE TRATAMIENTOS ANTICASPA (NO MEDICADOS), POR PRODUCTO, 2019-2028 (MILLONES DE USD)
TABLA 14 CHAMPÚS NORMALES DE ASIA-PACÍFICO EN EL MERCADO DE TRATAMIENTOS CONTRA LA CASPA (NO MEDICADOS), POR PRODUCTO, 2019-2028 (MILLONES DE USD)
TABLA 15 ACEITES DE ASIA-PACÍFICO EN EL MERCADO DE TRATAMIENTO DE LA CASPA, POR PRODUCTO, 2019-2028 (MILLONES DE USD)
TABLA 16 MERCADO DE SUERO PARA EL TRATAMIENTO DE LA CASPA EN ASIA-PACÍFICO, POR PRODUCTO, 2019-2028 (MILLONES DE USD)
TABLA 17 MASCARILLA CAPILAR EN EL MERCADO DE TRATAMIENTO ANTICASPA DE ASIA-PACÍFICO, POR PRODUCTO, 2019-2028 (MILLONES DE USD)
TABLA 18 MERCADO DE TRATAMIENTOS PARA LA CASPA MEDICADOS EN ASIA-PACÍFICO, POR REGIÓN, 2017-2027 (MILLONES DE USD)
TABLA 19 MERCADO DE TRATAMIENTOS ANTICASPA MEDICADOS EN ASIA-PACÍFICO, POR PRODUCTO, 2019-2028 (MILLONES DE USD)
TABLA 20 MERCADO DE CHAMPÚS PARA EL TRATAMIENTO DE LA CASPA (MEDICADOS), ASIA-PACÍFICO, POR PRODUCTO, 2019-2028 (MILLONES DE USD)
TABLA 21 CHAMPÚS ANTICASPA EN EL MERCADO DE TRATAMIENTOS ANTICASPA DE ASIA-PACÍFICO (MEDICADOS), POR PRODUCTO, 2019-2028 (MILLONES DE USD)
TABLA 22 CHAMPÚS NORMALES DE ASIA-PACÍFICO EN EL MERCADO DE TRATAMIENTO DE LA CASPA (MEDICADOS), POR PRODUCTO, 2019-2028 (MILLONES DE USD)
TABLA 23 CHAMPÚS SECOS EN EL MERCADO DE TRATAMIENTOS CONTRA LA CASPA (MEDICADOS) DE ASIA-PACÍFICO, POR PRODUCTO, 2019-2028 (MILLONES DE USD)
TABLA 24 MERCADO DE TRATAMIENTOS CONTRA LA CASPA EN ASIA-PACÍFICO, POR TIPO DE MEDICAMENTO, 2019-2028 (MILLONES DE USD)
TABLA 25 MARCAS DE ASIA-PACÍFICO EN EL MERCADO DE TRATAMIENTOS CONTRA LA CASPA, POR REGIÓN, 2019-2028 (MILLONES DE USD)
TABLA 26 MERCADO DE GENÉRICOS DE ASIA-PACÍFICO PARA EL TRATAMIENTO DE LA CASPA, POR REGIÓN, 2019-2028 (MILLONES DE USD)
TABLA 27 MERCADO DE TRATAMIENTOS CONTRA LA CASPA EN ASIA-PACÍFICO, POR GRUPO DE EDAD, 2019-2028 (MILLONES DE USD)
TABLA 28. INGRESOS ADULTOS EN EL MERCADO DE TRATAMIENTOS CONTRA LA CASPA EN ASIA-PACÍFICO, POR REGIÓN, 2019-2028 (MILLONES DE USD)
TABLA 29 MERCADO DE PEDIATRÍA PARA EL TRATAMIENTO DE LA CASPA EN ASIA-PACÍFICO, POR REGIÓN, 2019-2028 (MILLONES DE USD)
TABLA 30 MERCADO DE TRATAMIENTO DE LA CASPA EN NEONATOS DE ASIA-PACÍFICO, POR REGIÓN, 2019-2028 (MILLONES DE USD)
TABLA 31 MERCADO DE TRATAMIENTOS CONTRA LA CASPA EN ASIA-PACÍFICO, POR GÉNERO, 2019-2028 (MILLONES DE USD)
TABLA 32. MERCADO DE TRATAMIENTOS PARA LA CASPA EN ASIA-PACÍFICO, POR REGIÓN, 2019-2028 (MILLONES DE USD)
TABLA 33. MERCADO DE TRATAMIENTOS PARA LA CASPA FEMENINOS EN ASIA-PACÍFICO, POR REGIÓN, 2019-2028 (MILLONES DE USD)
TABLA 34 MERCADO DE TRATAMIENTOS CONTRA LA CASPA EN ASIA-PACÍFICO, POR USUARIO FINAL, 2019-2028 (MILLONES DE USD)
TABLA 35 MERCADO DE TRATAMIENTO DE LA CASPA EN EL HOGAR DE ASIA-PACÍFICO, POR REGIÓN, 2019-2028 (MILLONES DE USD)
TABLA 36 CENTROS DE DERMATOLOGÍA DE ASIA-PACÍFICO EN EL MERCADO DE TRATAMIENTO DE LA CASPA, POR REGIÓN, 2019-2028 (MILLONES DE USD)
TABLA 37 CLÍNICAS ESPECIALIZADAS DE ASIA-PACÍFICO EN EL MERCADO DE TRATAMIENTO DE LA CASPA, POR REGIÓN, 2019-2028 (MILLONES DE USD)
TABLA 38 OTROS MERCADOS DE TRATAMIENTO DE LA CASPA EN ASIA-PACÍFICO, POR REGIÓN, 2019-2028 (MILLONES DE USD)
TABLA 39 MERCADO DE TRATAMIENTOS CONTRA LA CASPA EN ASIA-PACÍFICO, POR TIPO DE DISTRIBUCIÓN, 2019-2028 (MILLONES DE USD)
TABLA 40 SUPERMERCADOS/HIPERMERCADOS DE ASIA-PACÍFICO EN EL MERCADO DE TRATAMIENTO DE LA CASPA, POR REGIÓN, 2019-2028 (MILLONES DE USD)
TABLA 41 TIENDAS DE CONVENIENCIA DE ASIA-PACÍFICO EN EL MERCADO DE TRATAMIENTO DE LA CASPA, POR REGIÓN, 2019-2028 (MILLONES DE USD)
TABLA 42 FARMACIAS DE ASIA-PACÍFICO EN EL MERCADO DE TRATAMIENTO DE LA CASPA, POR REGIÓN, 2019-2028 (MILLONES DE USD)
TABLA 43 TIENDAS MINORISTAS DE ASIA-PACÍFICO EN EL MERCADO DE TRATAMIENTO DE LA CASPA, POR REGIÓN, 2019-2028 (MILLONES DE USD)
TABLA 44 TIENDAS EN LÍNEA DE ASIA-PACÍFICO EN EL MERCADO DE TRATAMIENTO DE LA CASPA, POR REGIÓN, 2019-2028 (MILLONES DE USD)
TABLA 45 OTROS MERCADOS DE TRATAMIENTO DE LA CASPA EN ASIA-PACÍFICO, POR REGIÓN, 2019-2028 (MILLONES DE USD)
TABLA 46 MERCADO DE TRATAMIENTOS CONTRA LA CASPA EN ASIA-PACÍFICO, POR PAÍS, 2019-2028 (MILLONES DE USD)
TABLA 47 MERCADO DE TRATAMIENTOS CONTRA LA CASPA EN ASIA-PACÍFICO, POR TIPO, 2019-2028 (MILLONES DE USD)
TABLA 48 MERCADO DE TRATAMIENTOS CONTRA LA CASPA EN ASIA-PACÍFICO, POR MODO DE PRESCRIPCIÓN, 2019-2028 (MILLONES DE USD)
TABLA 49 MERCADO DE TRATAMIENTOS CONTRA LA CASPA DE SIA-PACIFIC, POR PRODUCTO, 2019-2028 (MILLONES DE USD)
TABLA 50 MERCADO DE TRATAMIENTOS PARA LA CASPA SIN MEDICAMENTOS DE ASIA-PACÍFICO, POR PRODUCTO, 2019-2028 (MILLONES DE USD)
TABLA 51 CHAMPÚ DE ASIA-PACÍFICO EN EL MERCADO DE TRATAMIENTO DE LA CASPA (NO MEDICADO), POR PRODUCTO, 2019-2028 (MILLONES DE USD)
TABLA 52 CHAMPÚS ANTICASPA DE ASIA-PACÍFICO EN EL MERCADO DE TRATAMIENTOS ANTICASPA (NO MEDICADOS), POR PRODUCTO, 2019-2028 (MILLONES DE USD)
TABLA 53 CHAMPÚS NORMALES DE ASIA-PACÍFICO EN EL MERCADO DE TRATAMIENTO DE LA CASPA (NO MEDICADOS), POR PRODUCTO, 2019-2028 (MILLONES DE USD)
TABLA 54 ACEITES DE ASIA-PACÍFICO EN EL MERCADO DE TRATAMIENTO DE LA CASPA, POR PRODUCTO, 2019-2028 (MILLONES DE USD)
TABLA 55 MERCADO DE SUERO PARA EL TRATAMIENTO DE LA CASPA EN ASIA-PACÍFICO, POR PRODUCTO, 2019-2028 (MILLONES DE USD)
TABLA 56 MASCARILLA CAPILAR EN EL MERCADO DE TRATAMIENTO ANTICASPA DE ASIA-PACÍFICO, POR PRODUCTO, 2019-2028 (MILLONES DE USD)
TABLA 57 MERCADO DE TRATAMIENTOS PARA LA CASPA MEDICADOS EN ASIA-PACÍFICO, POR PRODUCTO, 2019-2028 (MILLONES DE USD)
TABLA 58 MERCADO DE CHAMPÚS PARA EL TRATAMIENTO DE LA CASPA (MEDICADOS), ASIA-PACÍFICO, POR PRODUCTO, 2019-2028 (MILLONES DE USD)
TABLA 59 CHAMPÚS ANTICASPA EN EL MERCADO DE TRATAMIENTOS ANTICASPA DE ASIA-PACÍFICO (MEDICADOS), POR PRODUCTO, 2019-2028 (MILLONES DE USD)
TABLA 60 CHAMPÚS SECOS EN EL MERCADO DE TRATAMIENTO DE LA CASPA (MEDICADOS) DE ASIA-PACÍFICO, POR PRODUCTO, 2019-2028 (MILLONES DE USD)
TABLA 61 CHAMPÚS NORMALES DE ASIA-PACÍFICO EN EL MERCADO DE TRATAMIENTO DE LA CASPA (MEDICADOS), POR PRODUCTO, 2019-2028 (MILLONES DE USD)
TABLA 62 MERCADO DE TRATAMIENTOS CONTRA LA CASPA EN ASIA-PACÍFICO, POR TIPO DE MEDICAMENTO, 2019-2028 (MILLONES DE USD)
TABLA 63 MERCADO DE TRATAMIENTOS PARA LA CASPA MEDICADOS EN ASIA-PACÍFICO, POR GRUPO DE EDAD, 2019-2028 (MILLONES DE USD)
TABLA 64 MERCADO DE TRATAMIENTOS CONTRA LA CASPA EN ASIA-PACÍFICO, POR GÉNERO, 2019-2028 (MILLONES DE USD)
TABLA 65 MERCADO DE TRATAMIENTOS CONTRA LA CASPA EN ASIA-PACÍFICO, POR USUARIO FINAL, 2019-2028 (MILLONES DE USD)
TABLA 66 MERCADO DE TRATAMIENTOS CONTRA LA CASPA DE ASIA-PACÍFICO, POR TIPO DE DISTRIBUCIÓN, 2019-2028 (MILLONES DE USD)
TABLA 67 MERCADO DE TRATAMIENTOS ANTICASPA EN CHINA, POR TIPO, 2019-2028 (MILLONES DE USD)
TABLA 68 MERCADO DE TRATAMIENTOS ANTICASPA EN CHINA, POR MODO DE PRESCRIPCIÓN, 2019-2028 (MILLONES DE USD)
TABLA 69 MERCADO DE TRATAMIENTOS ANTICASPA EN CHINA, POR PRODUCTO, 2019-2028 (MILLONES DE USD)
TABLA 70 MERCADO DE TRATAMIENTOS ANTICASPA NO MEDICADOS EN CHINA, POR PRODUCTO, 2019-2028 (MILLONES DE USD)
TABLA 71 CHAMPÚ DE CHINA EN EL MERCADO DE TRATAMIENTOS ANTICASPA (NO MEDICADOS), POR PRODUCTO, 2019-2028 (MILLONES DE USD)
TABLA 72 CHAMPÚS ANTICASPA DE CHINA EN EL MERCADO DE TRATAMIENTOS ANTICASPA (NO MEDICADOS), POR PRODUCTO, 2019-2028 (MILLONES DE USD)
TABLA 73 CHAMPÚS NORMALES DE CHINA EN EL MERCADO DE TRATAMIENTOS ANTICASPA (NO MEDICADOS), POR PRODUCTO, 2019-2028 (MILLONES DE USD)
TABLA 74 ACEITES DE CHINA EN EL MERCADO DE TRATAMIENTO DE LA CASPA, POR PRODUCTO, 2019-2028 (MILLONES DE USD)
TABLA 75 SUERO DE CHINA EN EL MERCADO DE TRATAMIENTOS CONTRA LA CASPA, POR PRODUCTO, 2019-2028 (MILLONES DE USD)
TABLA 76 MASCARILLA CAPILAR DE CHINA EN EL MERCADO DE TRATAMIENTO ANTICASPA, POR PRODUCTO, 2019-2028 (MILLONES DE USD)
TABLA 77 MERCADO DE TRATAMIENTOS ANTICASPA MEDICADOS EN CHINA, POR PRODUCTO, 2019-2028 (MILLONES DE USD)
TABLA 78 CHAMPÚ DE CHINA EN EL MERCADO DE TRATAMIENTO DE LA CASPA (MEDICADO), POR PRODUCTO, 2019-2028 (MILLONES DE USD)
TABLA 79 CHAMPÚS ANTICASPA DE CHINA EN EL MERCADO DE TRATAMIENTOS ANTICASPA (MEDICADOS), POR PRODUCTO, 2019-2028 (MILLONES DE USD)
TABLA 80 CHAMPÚS SECOS DE CHINA EN EL MERCADO DE TRATAMIENTOS ANTICASPA (MEDICADOS), POR PRODUCTO, 2019-2028 (MILLONES DE USD)
TABLA 81 CHAMPÚS NORMALES DE CHINA EN EL MERCADO DE TRATAMIENTOS CONTRA LA CASPA (MEDICADOS), POR PRODUCTO, 2019-2028 (MILLONES DE USD)
TABLA 82 MERCADO DE TRATAMIENTOS CONTRA LA CASPA EN CHINA, POR TIPO DE MEDICAMENTO, 2019-2028 (MILLONES DE USD)
TABLA 83 MERCADO DE TRATAMIENTO DE LA CASPA MEDICADO EN CHINA, POR GRUPO DE EDAD, 2019-2028 (MILLONES DE USD)
TABLA 84 MERCADO DE TRATAMIENTOS ANTICASPA EN CHINA, POR GÉNERO, 2019-2028 (MILLONES DE USD)
TABLA 85 MERCADO DE TRATAMIENTOS ANTICASPA EN CHINA, POR USUARIO FINAL, 2019-2028 (MILLONES DE USD)
TABLA 86 MERCADO DE TRATAMIENTOS ANTICASPA EN CHINA, POR TIPO DE DISTRIBUCIÓN, 2019-2028 (MILLONES DE USD)
TABLA 87 MERCADO DE TRATAMIENTOS ANTICASPA EN JAPÓN, POR TIPO, 2019-2028 (MILLONES DE USD)
TABLA 88 MERCADO DE TRATAMIENTOS CONTRA LA CASPA EN JAPÓN, POR MODO DE PRESCRIPCIÓN, 2019-2028 (MILLONES DE USD)
TABLA 89 MERCADO DE TRATAMIENTOS ANTICASPA EN JAPÓN, POR PRODUCTO, 2019-2028 (MILLONES DE USD)
TABLA 90 MERCADO DE TRATAMIENTOS PARA LA CASPA SIN MEDICAMENTOS EN JAPÓN, POR PRODUCTO, 2019-2028 (MILLONES DE USD)
TABLA 91 CHAMPÚ JAPÓN EN EL MERCADO DE TRATAMIENTOS CONTRA LA CASPA (NO MEDICADOS), POR PRODUCTO, 2019-2028 (MILLONES DE USD)
TABLA 92 CHAMPÚS ANTICASPA DE JAPÓN EN EL MERCADO DE TRATAMIENTOS ANTICASPA (NO MEDICADOS), POR PRODUCTO, 2019-2028 (MILLONES DE USD)
TABLA 93 CHAMPÚS NORMALES DE JAPÓN EN EL MERCADO DE TRATAMIENTOS ANTICASPA (NO MEDICADOS), POR PRODUCTO, 2019-2028 (MILLONES DE USD)
TABLA 94 ACEITES JAPONESES EN EL MERCADO DE TRATAMIENTOS ANTICASPA, POR PRODUCTO, 2019-2028 (MILLONES DE USD)
TABLA 95 MERCADO DE SUERO JAPONÉS EN EL TRATAMIENTO DE LA CASPA, POR PRODUCTO, 2019-2028 (MILLONES DE USD)
TABLA 96 MASCARILLA CAPILAR JAPONESA EN EL MERCADO DE TRATAMIENTOS ANTICASPA, POR PRODUCTO, 2019-2028 (MILLONES DE USD)
TABLA 97 MERCADO DE TRATAMIENTOS ANTICASPA MEDICADOS EN JAPÓN, POR PRODUCTO, 2019-2028 (MILLONES DE USD)
TABLA 98 CHAMPÚ JAPÓN EN EL MERCADO DE TRATAMIENTO DE LA CASPA (MEDICADO), POR PRODUCTO, 2019-2028 (MILLONES DE USD)
TABLA 99 CHAMPÚS ANTICASPA DE JAPÓN EN EL MERCADO DE TRATAMIENTOS ANTICASPA (MEDICADOS), POR PRODUCTO, 2019-2028 (MILLONES DE USD)
TABLA 100 CHAMPÚS SECOS EN EL MERCADO DE TRATAMIENTO CASPA (MEDICADOS) DE JAPÓN, POR PRODUCTO, 2019-2028 (MILLONES DE USD)
TABLA 101 CHAMPÚS NORMALES DE JAPÓN EN EL MERCADO DE TRATAMIENTOS ANTICASPA (MEDICADOS), POR PRODUCTO, 2019-2028 (MILLONES DE USD)
TABLA 102 MERCADO DE TRATAMIENTOS CONTRA LA CASPA EN JAPÓN, POR TIPO DE MEDICAMENTO, 2019-2028 (MILLONES DE USD)
TABLA 103 MERCADO DE TRATAMIENTOS ANTICASPA MEDICADOS EN JAPÓN, POR GRUPO DE EDAD, 2019-2028 (MILLONES DE USD)
TABLA 104 MERCADO DE TRATAMIENTOS ANTICASPA EN JAPÓN, POR GÉNERO, 2019-2028 (MILLONES DE USD)
TABLA 105 MERCADO DE TRATAMIENTOS ANTICASPA EN JAPÓN, POR USUARIO FINAL, 2019-2028 (MILLONES DE USD)
TABLA 106 MERCADO DE TRATAMIENTOS ANTICASPA EN JAPÓN, POR TIPO DE DISTRIBUCIÓN, 2019-2028 (MILLONES DE USD)
TABLA 107 MERCADO DE TRATAMIENTOS ANTICASPA EN LA INDIA, POR TIPO, 2019-2028 (MILLONES DE USD)
TABLA 108 MERCADO DE TRATAMIENTOS ANTICASPA EN INDIA, POR MODO DE PRESCRIPCIÓN, 2019-2028 (MILLONES DE USD)
TABLA 109 MERCADO DE TRATAMIENTOS ANTICASPA EN LA INDIA, POR PRODUCTO, 2019-2028 (MILLONES DE USD)
TABLA 110 MERCADO DE TRATAMIENTOS ANTICASPA SIN MEDICAMENTOS EN LA INDIA, POR PRODUCTO, 2019-2028 (MILLONES DE USD)
TABLA 111 CHAMPÚ EN EL MERCADO DE TRATAMIENTOS ANTICASPA (NO MEDICADOS) DE INDIA, POR PRODUCTO, 2019-2028 (MILLONES DE USD)
TABLA 112 CHAMPÚS ANTICASPA EN EL MERCADO DE TRATAMIENTOS ANTICASPA (NO MEDICADOS) DE LA INDIA, POR PRODUCTO, 2019-2028 (MILLONES DE USD)
TABLA 113 CHAMPÚS NORMALES EN EL MERCADO DE TRATAMIENTOS ANTICASPA (NO MEDICADOS) DE LA INDIA, POR PRODUCTO, 2019-2028 (MILLONES DE USD)
TABLA 114 ACEITES EN EL MERCADO DE TRATAMIENTOS ANTICASPA DE LA INDIA, POR PRODUCTO, 2019-2028 (MILLONES DE USD)
TABLA 115 INDIA: MERCADO DE SUERO PARA EL TRATAMIENTO DE LA CASPA, POR PRODUCTO, 2019-2028 (MILLONES DE USD)
TABLA 116 MASCARILLA CAPILAR EN EL MERCADO DE TRATAMIENTOS ANTICASPA DE LA INDIA, POR PRODUCTO, 2019-2028 (MILLONES DE USD)
TABLA 117 INDIA, MERCADO DE TRATAMIENTOS CONTRA LA CASPA MEDICADOS, POR PRODUCTO, 2019-2028 (MILLONES DE USD)
TABLA 118 CHAMPÚ EN EL MERCADO DE TRATAMIENTOS ANTICASPA (MEDICADOS), POR PRODUCTO, 2019-2028 (MILLONES DE USD)
TABLA 119 CHAMPÚS ANTICASPA EN EL MERCADO DE TRATAMIENTOS ANTICASPA (MEDICADOS) DE LA INDIA, POR PRODUCTO, 2019-2028 (MILLONES DE USD)
TABLA 120 CHAMPÚS SECOS EN EL MERCADO DE TRATAMIENTOS ANTICASPA (MEDICADOS), POR PRODUCTO, 2019-2028 (MILLONES DE USD)
TABLA 121 CHAMPÚS NORMALES EN EL MERCADO DE TRATAMIENTOS ANTICASPA (MEDICADOS), POR PRODUCTO, 2019-2028 (MILLONES DE USD)
TABLA 122 MERCADO DE TRATAMIENTOS CONTRA LA CASPA EN INDIA, POR TIPO DE MEDICAMENTO, 2019-2028 (MILLONES DE USD)
TABLA 123 INDIA, MERCADO DE TRATAMIENTOS CONTRA LA CASPA MEDICADOS, POR GRUPO DE EDAD, 2019-2028 (MILLONES DE USD)
TABLA 124 MERCADO DE TRATAMIENTOS CONTRA LA CASPA EN LA INDIA, POR GÉNERO, 2019-2028 (MILLONES DE USD)
TABLA 125 MERCADO DE TRATAMIENTOS ANTICASPA EN INDIA, POR USUARIO FINAL, 2019-2028 (MILLONES DE USD)
TABLA 126 MERCADO DE TRATAMIENTOS ANTICASPA EN LA INDIA, POR TIPO DE DISTRIBUCIÓN, 2019-2028 (MILLONES DE USD)
TABLA 127 MERCADO AUSTRALIANO DE TRATAMIENTOS CONTRA LA CASPA, POR TIPO, 2019-2028 (MILLONES DE USD)
TABLA 128 MERCADO AUSTRALIANO DE TRATAMIENTOS CONTRA LA CASPA, POR MODO DE PRESCRIPCIÓN, 2019-2028 (MILLONES DE USD)
TABLA 129 MERCADO DE TRATAMIENTOS ANTICASPA DE AUSTRALIA, POR PRODUCTO, 2019-2028 (MILLONES DE USD)
TABLA 130 MERCADO DE TRATAMIENTOS ANTICASPA NO MEDICADOS DE AUSTRALIA, POR PRODUCTO, 2019-2028 (MILLONES DE USD)
TABLA 131 AUSTRALIA CHAMPÚ EN EL MERCADO DE TRATAMIENTOS CONTRA LA CASPA (NO MEDICADOS), POR PRODUCTO, 2019-2028 (MILLONES DE USD)
TABLA 132 CHAMPÚS ANTICASPA DE AUSTRALIA EN EL MERCADO DE TRATAMIENTOS ANTICASPA (NO MEDICADOS), POR PRODUCTO, 2019-2028 (MILLONES DE USD)
TABLA 133 AUSTRALIA CHAMPÚS NORMALES EN EL MERCADO DE TRATAMIENTOS CONTRA LA CASPA (NO MEDICADOS), POR PRODUCTO, 2019-2028 (MILLONES DE USD)
TABLA 134 ACEITES DE AUSTRALIA EN EL MERCADO DE TRATAMIENTO DE LA CASPA, POR PRODUCTO, 2019-2028 (MILLONES DE USD)
TABLA 135 MERCADO AUSTRALIANO DE SUERO PARA EL TRATAMIENTO DE LA CASPA, POR PRODUCTO, 2019-2028 (MILLONES DE USD)
TABLA 136 AUSTRALIA MASCARILLA CAPILAR EN EL MERCADO DE TRATAMIENTOS ANTICASPA, POR PRODUCTO, 2019-2028 (MILLONES DE USD)
TABLA 137 MERCADO DE TRATAMIENTOS ANTICASPA MEDICADOS EN AUSTRALIA, POR PRODUCTO, 2019-2028 (MILLONES DE USD)
TABLA 138 AUSTRALIA CHAMPÚ EN EL MERCADO DE TRATAMIENTO DE LA CASPA (MEDICADO), POR PRODUCTO, 2019-2028 (MILLONES DE USD)
TABLA 139 AUSTRALIA CHAMPÚS ANTICASPA EN EL MERCADO DE TRATAMIENTOS ANTICASPA (MEDICADOS), POR PRODUCTO, 2019-2028 (MILLONES DE USD)
TABLA 140 AUSTRALIA CHAMPÚS SECOS EN EL MERCADO DE TRATAMIENTOS CONTRA LA CASPA (MEDICADOS), POR PRODUCTO, 2019-2028 (MILLONES DE USD)
TABLA 141 AUSTRALIA CHAMPÚS NORMALES EN EL MERCADO DE TRATAMIENTO DE LA CASPA (MEDICADOS), POR PRODUCTO, 2019-2028 (MILLONES DE USD)
TABLA 142 MERCADO AUSTRALIANO DE TRATAMIENTOS CONTRA LA CASPA, POR TIPO DE MEDICAMENTO, 2019-2028 (MILLONES DE USD)
TABLA 143 MERCADO DE TRATAMIENTOS ANTICASPA MEDICADOS EN AUSTRALIA, POR GRUPO DE EDAD, 2019-2028 (MILLONES DE USD)
TABLA 144 MERCADO DE TRATAMIENTOS CONTRA LA CASPA EN AUSTRALIA, POR GÉNERO, 2019-2028 (MILLONES DE USD)
TABLA 145 MERCADO AUSTRALIANO DE TRATAMIENTOS CONTRA LA CASPA, POR USUARIO FINAL, 2019-2028 (MILLONES DE USD)
TABLA 146 MERCADO AUSTRALIANO DE TRATAMIENTOS CONTRA LA CASPA, POR TIPO DE DISTRIBUCIÓN, 2019-2028 (MILLONES DE USD)
TABLA 147 MERCADO DE TRATAMIENTOS ANTICASPA DE COREA DEL SUR, POR TIPO, 2019-2028 (MILLONES DE USD)
TABLA 148 MERCADO DE TRATAMIENTOS ANTICASPA DE COREA DEL SUR, POR MODO DE PRESCRIPCIÓN, 2019-2028 (MILLONES DE USD)
TABLA 149 MERCADO DE TRATAMIENTOS ANTICASPA DE COREA DEL SUR, POR PRODUCTO, 2019-2028 (MILLONES DE USD)
TABLA 150 MERCADO DE TRATAMIENTOS ANTICASPA NO MEDICADOS DE COREA DEL SUR, POR PRODUCTO, 2019-2028 (MILLONES DE USD)
TABLA 151 CHAMPÚ DE COREA DEL SUR EN EL MERCADO DE TRATAMIENTOS ANTICASPA (NO MEDICADOS), POR PRODUCTO, 2019-2028 (MILLONES DE USD)
TABLA 152 CHAMPÚS ANTICASPA DE COREA DEL SUR EN EL MERCADO DE TRATAMIENTOS ANTICASPA (NO MEDICADOS), POR PRODUCTO, 2019-2028 (MILLONES DE USD)
TABLA 153 CHAMPÚS NORMALES DE COREA DEL SUR EN EL MERCADO DE TRATAMIENTOS ANTICASPA (NO MEDICADOS), POR PRODUCTO, 2019-2028 (MILLONES DE USD)
TABLA 154 ACEITES DE COREA DEL SUR EN EL MERCADO DE TRATAMIENTOS ANTICASPA, POR PRODUCTO, 2019-2028 (MILLONES DE USD)
TABLA 155 MERCADO DE SUERO DE COREA DEL SUR PARA EL TRATAMIENTO DE LA CASPA, POR PRODUCTO, 2019-2028 (MILLONES DE USD)
TABLA 156 MASCARILLA CAPILAR DE COREA DEL SUR EN EL MERCADO DE TRATAMIENTOS ANTICASPA, POR PRODUCTO, 2019-2028 (MILLONES DE USD)
TABLA 157 MERCADO DE TRATAMIENTOS ANTICASPA MEDICADOS EN COREA DEL SUR, POR PRODUCTO, 2019-2028 (MILLONES DE USD)
TABLA 158 CHAMPÚ DE COREA DEL SUR EN EL MERCADO DE TRATAMIENTOS ANTICASPA (MEDICADOS), POR PRODUCTO, 2019-2028 (MILLONES DE USD)
TABLA 159 CHAMPÚS ANTICASPA DE COREA DEL SUR EN EL MERCADO DE TRATAMIENTOS ANTICASPA (MEDICADOS), POR PRODUCTO, 2019-2028 (MILLONES DE USD)
TABLA 160 CHAMPÚS SECOS DE COREA DEL SUR EN EL MERCADO DE TRATAMIENTOS ANTICASPA (MEDICADOS), POR PRODUCTO, 2019-2028 (MILLONES DE USD)
TABLA 161 CHAMPÚS NORMALES DE COREA DEL SUR EN EL MERCADO DE TRATAMIENTOS ANTICASPA (MEDICADOS), POR PRODUCTO, 2019-2028 (MILLONES DE USD)
TABLA 162 MERCADO DE TRATAMIENTOS CONTRA LA CASPA EN COREA DEL SUR, POR TIPO DE MEDICAMENTO, 2019-2028 (MILLONES DE USD)
TABLA 163 COREA DEL SUR MEDICADO EN EL MERCADO DE TRATAMIENTO DE LA CASPA, POR GRUPO DE EDAD, 2019-2028 (MILLONES DE USD)
TABLA 164 MERCADO DE TRATAMIENTOS ANTICASPA EN COREA DEL SUR, POR GÉNERO, 2019-2028 (MILLONES DE USD)
TABLA 165 MERCADO DE TRATAMIENTOS ANTICASPA DE COREA DEL SUR, POR USUARIO FINAL, 2019-2028 (MILLONES DE USD)
TABLA 166 MERCADO DE TRATAMIENTOS ANTICASPA DE COREA DEL SUR, POR TIPO DE DISTRIBUCIÓN, 2019-2028 (MILLONES DE USD)
TABLA 167 MERCADO DE TRATAMIENTOS ANTICASPA DE SINGAPUR, POR TIPO, 2019-2028 (MILLONES DE USD)
TABLA 168 MERCADO DE TRATAMIENTOS CONTRA LA CASPA EN SINGAPUR, POR MODO DE PRESCRIPCIÓN, 2019-2028 (MILLONES DE USD)
TABLA 169 MERCADO DE TRATAMIENTOS ANTICASPA DE SINGAPUR, POR PRODUCTO, 2019-2028 (MILLONES DE USD)
TABLA 170 MERCADO DE TRATAMIENTOS PARA LA CASPA SIN MEDICACIÓN EN SINGAPUR, POR PRODUCTO, 2019-2028 (MILLONES DE USD)
TABLA 171 CHAMPÚ DE SINGAPUR EN EL MERCADO DE TRATAMIENTOS CONTRA LA CASPA (NO MEDICADOS), POR PRODUCTO, 2019-2028 (MILLONES DE USD)
TABLA 172 CHAMPÚS ANTICASPA DE SINGAPUR EN EL MERCADO DE TRATAMIENTOS ANTICASPA (NO MEDICADOS), POR PRODUCTO, 2019-2028 (MILLONES DE USD)
TABLA 173 CHAMPÚS NORMALES DE SINGAPUR EN EL MERCADO DE TRATAMIENTOS ANTICASPA (NO MEDICADOS), POR PRODUCTO, 2019-2028 (MILLONES DE USD)
TABLA 174 ACEITES DE SINGAPUR EN EL MERCADO DE TRATAMIENTOS ANTICASPA, POR PRODUCTO, 2019-2028 (MILLONES DE USD)
TABLA 175 MERCADO DE SUERO DE SINGAPUR PARA EL TRATAMIENTO DE LA CASPA, POR PRODUCTO, 2019-2028 (MILLONES DE USD)
TABLA 176 MASCARILLA CAPILAR DE SINGAPUR EN EL MERCADO DE TRATAMIENTOS ANTICASPA, POR PRODUCTO, 2019-2028 (MILLONES DE USD)
TABLA 177 MERCADO DE TRATAMIENTOS CONTRA LA CASPA MEDICADOS EN SINGAPUR, POR PRODUCTO, 2019-2028 (MILLONES DE USD)
TABLA 178 CHAMPÚ DE SINGAPUR EN EL MERCADO DE TRATAMIENTOS CONTRA LA CASPA (MEDICADOS), POR PRODUCTO, 2019-2028 (MILLONES DE USD)
TABLA 179 CHAMPÚS ANTICASPA DE SINGAPUR EN EL MERCADO DE TRATAMIENTOS ANTICASPA (MEDICADOS), POR PRODUCTO, 2019-2028 (MILLONES DE USD)
TABLA 180 CHAMPÚS SECOS DE SINGAPUR EN EL MERCADO DE TRATAMIENTOS ANTICASPA (MEDICADOS), POR PRODUCTO, 2019-2028 (MILLONES DE USD)
TABLA 181 CHAMPÚS NORMALES DE SINGAPUR EN EL MERCADO DE TRATAMIENTOS ANTICASPA (MEDICADOS), POR PRODUCTO, 2019-2028 (MILLONES DE USD)
TABLA 182 MERCADO DE TRATAMIENTOS CONTRA LA CASPA DE SINGAPUR, POR TIPO DE MEDICAMENTO, 2019-2028 (MILLONES DE USD)
TABLA 183 MERCADO DE TRATAMIENTOS CONTRA LA CASPA EN SINGAPUR, POR GRUPO DE EDAD, 2019-2028 (MILLONES DE USD)
TABLA 184 MERCADO DE TRATAMIENTOS CONTRA LA CASPA EN SINGAPUR, POR GÉNERO, 2019-2028 (MILLONES DE USD)
TABLA 185 MERCADO DE TRATAMIENTOS ANTICASPA DE SINGAPUR, POR USUARIO FINAL, 2019-2028 (MILLONES DE USD)
TABLA 186 MERCADO DE TRATAMIENTOS ANTICASPA DE SINGAPUR, POR TIPO DE DISTRIBUCIÓN, 2019-2028 (MILLONES DE USD)
TABLA 187 MERCADO DE TRATAMIENTOS ANTICASPA DE TAILANDIA, POR TIPO, 2019-2028 (MILLONES DE USD)
TABLA 188 MERCADO DE TRATAMIENTOS ANTICASPA DE TAILANDIA, POR MODO DE PRESCRIPCIÓN, 2019-2028 (MILLONES DE USD)
TABLA 189 MERCADO DE TRATAMIENTOS ANTICASPA DE TAILANDIA, POR PRODUCTO, 2019-2028 (MILLONES DE USD)
TABLA 190 MERCADO DE TRATAMIENTOS ANTICASPA NO MEDICADOS DE TAILANDIA, POR PRODUCTO, 2019-2028 (MILLONES DE USD)
TABLA 191 CHAMPÚ DE TAILANDIA EN EL MERCADO DE TRATAMIENTOS ANTICASPA (NO MEDICADOS), POR PRODUCTO, 2019-2028 (MILLONES DE USD)
TABLA 192 CHAMPÚS ANTICASPA DE TAILANDIA EN EL MERCADO DE TRATAMIENTOS ANTICASPA (NO MEDICADOS), POR PRODUCTO, 2019-2028 (MILLONES DE USD)
TABLA 193 CHAMPÚS NORMALES DE TAILANDIA EN EL MERCADO DE TRATAMIENTOS ANTICASPA (NO MEDICADOS), POR PRODUCTO, 2019-2028 (MILLONES DE USD)
TABLA 194 ACEITES DE TAILANDIA EN EL MERCADO DE TRATAMIENTO DE LA CASPA, POR PRODUCTO, 2019-2028 (MILLONES DE USD)
TABLA 195 SUERO DE TAILANDIA EN EL MERCADO DE TRATAMIENTOS CONTRA LA CASPA, POR PRODUCTO, 2019-2028 (MILLONES DE USD)
TABLA 196 MASCARILLA CAPILAR DE TAILANDIA EN EL MERCADO DE TRATAMIENTOS ANTICASPA, POR PRODUCTO, 2019-2028 (MILLONES DE USD)
TABLA 197 MERCADO DE TRATAMIENTOS ANTICASPA MEDICADOS EN TAILANDIA, POR PRODUCTO, 2019-2028 (MILLONES DE USD)
TABLA 198 CHAMPÚ DE TAILANDIA EN EL MERCADO DE TRATAMIENTOS ANTICASPA (MEDICADOS), POR PRODUCTO, 2019-2028 (MILLONES DE USD)
TABLA 199 CHAMPÚS ANTICASPA DE TAILANDIA EN EL MERCADO DE TRATAMIENTOS ANTICASPA (MEDICADOS), POR PRODUCTO, 2019-2028 (MILLONES DE USD)
TABLA 200 CHAMPÚS SECOS DE TAILANDIA EN EL MERCADO DE TRATAMIENTOS ANTICASPA (MEDICADOS), POR PRODUCTO, 2019-2028 (MILLONES DE USD)
TABLA 201 CHAMPÚS NORMALES DE TAILANDIA EN EL MERCADO DE TRATAMIENTO DE LA CASPA (MEDICADOS), POR PRODUCTO, 2019-2028 (MILLONES DE USD)
TABLA 202 MERCADO DE TRATAMIENTOS CONTRA LA CASPA EN TAILANDIA, POR TIPO DE MEDICAMENTO, 2019-2028 (MILLONES DE USD)
TABLA 203 MERCADO DE TRATAMIENTOS ANTICASPA EN TAILANDIA, POR GRUPO DE EDAD, 2019-2028 (MILLONES DE USD)
TABLA 204 MERCADO DE TRATAMIENTOS ANTICASPA EN TAILANDIA, POR GÉNERO, 2019-2028 (MILLONES DE USD)
TABLA 205 MERCADO DE TRATAMIENTOS ANTICASPA DE TAILANDIA, POR USUARIO FINAL, 2019-2028 (MILLONES DE USD)
TABLA 206 MERCADO DE TRATAMIENTOS ANTICASPA DE TAILANDIA, POR TIPO DE DISTRIBUCIÓN, 2019-2028 (MILLONES DE USD)
TABLA 207 MERCADO DE TRATAMIENTOS CONTRA LA CASPA EN MALASIA, POR TIPO, 2019-2028 (MILLONES DE USD)
TABLA 208 MERCADO DE TRATAMIENTOS CONTRA LA CASPA EN MALASIA, POR MODO DE PRESCRIPCIÓN, 2019-2028 (MILLONES DE USD)
TABLA 209 MERCADO DE TRATAMIENTOS ANTICASPA DE MALASIA, POR PRODUCTO, 2019-2028 (MILLONES DE USD)
TABLA 210 MERCADO DE TRATAMIENTOS ANTICASPA NO MEDICADOS DE MALASIA, POR PRODUCTO, 2019-2028 (MILLONES DE USD)
TABLA 211 CHAMPÚ DE MALASIA EN EL MERCADO DE TRATAMIENTOS ANTICASPA (NO MEDICADOS), POR PRODUCTO, 2019-2028 (MILLONES DE USD)
TABLA 212 CHAMPÚS ANTICASPA DE MALASIA EN EL MERCADO DE TRATAMIENTOS ANTICASPA (NO MEDICADOS), POR PRODUCTO, 2019-2028 (MILLONES DE USD)
TABLA 213 CHAMPÚS NORMALES DE MALASIA EN EL MERCADO DE TRATAMIENTOS ANTICASPA (NO MEDICADOS), POR PRODUCTO, 2019-2028 (MILLONES DE USD)
TABLA 214 ACEITES DE MALASIA EN EL MERCADO DE TRATAMIENTO DE LA CASPA, POR PRODUCTO, 2019-2028 (MILLONES DE USD)
TABLA 215 MERCADO DE SUERO DE MALASIA PARA EL TRATAMIENTO DE LA CASPA, POR PRODUCTO, 2019-2028 (MILLONES DE USD)
TABLA 216 MASCARILLA CAPILAR DE MALASIA EN EL MERCADO DE TRATAMIENTOS ANTICASPA, POR PRODUCTO, 2019-2028 (MILLONES DE USD)
TABLA 217 MERCADO DE TRATAMIENTOS CONTRA LA CASPA MEDICADOS EN MALASIA, POR PRODUCTO, 2019-2028 (MILLONES DE USD)
TABLA 218 CHAMPÚ DE MALASIA EN EL MERCADO DE TRATAMIENTOS ANTICASPA (MEDICADOS), POR PRODUCTO, 2019-2028 (MILLONES DE USD)
TABLA 219 CHAMPÚS ANTICASPA DE MALASIA EN EL MERCADO DE TRATAMIENTOS ANTICASPA (MEDICADOS), POR PRODUCTO, 2019-2028 (MILLONES DE USD)
TABLA 220 CHAMPÚS SECOS DE MALASIA EN EL MERCADO DE TRATAMIENTOS ANTICASPA (MEDICADOS), POR PRODUCTO, 2019-2028 (MILLONES DE USD)
TABLA 221 CHAMPÚS NORMALES DE MALASIA EN EL MERCADO DE TRATAMIENTO DE LA CASPA (MEDICADOS), POR PRODUCTO, 2019-2028 (MILLONES DE USD)
TABLA 222 MERCADO DE TRATAMIENTOS CONTRA LA CASPA EN MALASIA, POR TIPO DE MEDICAMENTO, 2019-2028 (MILLONES DE USD)
TABLA 223 MALASIA MEDICADA EN EL MERCADO DE TRATAMIENTO DE LA CASPA, POR GRUPO DE EDAD, 2019-2028 (MILLONES DE USD)
TABLA 224 MERCADO DE TRATAMIENTOS CONTRA LA CASPA EN MALASIA, POR GÉNERO, 2019-2028 (MILLONES DE USD)
TABLA 225 MERCADO DE TRATAMIENTOS ANTICASPA DE MALASIA, POR USUARIO FINAL, 2019-2028 (MILLONES DE USD)
TABLA 226 MERCADO DE TRATAMIENTOS ANTICASPA DE MALASIA, POR TIPO DE DISTRIBUCIÓN, 2019-2028 (MILLONES DE USD)
TABLA 227 MERCADO DE TRATAMIENTOS ANTICASPA DE INDONESIA, POR TIPO, 2019-2028 (MILLONES DE USD)
TABLA 228 MERCADO DE TRATAMIENTOS CONTRA LA CASPA EN INDONESIA, POR MODO DE PRESCRIPCIÓN, 2019-2028 (MILLONES DE USD)
TABLA 229 MERCADO DE TRATAMIENTOS ANTICASPA EN INDONESIA, POR PRODUCTO, 2019-2028 (MILLONES DE USD)
TABLA 230 MERCADO DE TRATAMIENTOS ANTICASPA NO MEDICADOS EN INDONESIA, POR PRODUCTO, 2019-2028 (MILLONES DE USD)
TABLA 231 CHAMPÚ EN EL MERCADO DE TRATAMIENTOS ANTICASPA (NO MEDICADOS) DE INDONESIA, POR PRODUCTO, 2019-2028 (MILLONES DE USD)
TABLA 232 CHAMPÚS ANTICASPA EN EL MERCADO DE TRATAMIENTOS ANTICASPA DE INDONESIA (NO MEDICADOS), POR PRODUCTO, 2019-2028 (MILLONES DE USD)
TABLA 233 CHAMPÚS NORMALES EN EL MERCADO DE TRATAMIENTOS ANTICASPA DE INDONESIA (NO MEDICADOS), POR PRODUCTO, 2019-2028 (MILLONES DE USD)
TABLA 234 ACEITES DE INDONESIA EN EL MERCADO DE TRATAMIENTO DE LA CASPA, POR PRODUCTO, 2019-2028 (MILLONES DE USD)
TABLA 235 MERCADO DE SUERO PARA EL TRATAMIENTO DE LA CASPA EN INDONESIA, POR PRODUCTO, 2019-2028 (MILLONES DE USD)
TABLA 236 MASCARILLA CAPILAR EN EL MERCADO DE TRATAMIENTO ANTICASPA DE INDONESIA, POR PRODUCTO, 2019-2028 (MILLONES DE USD)
TABLA 237 INDONESIA MERCADO DE TRATAMIENTOS MEDICADOS CONTRA LA CASPA, POR PRODUCTO, 2019-2028 (MILLONES DE USD)
TABLA 238 CHAMPÚ EN EL MERCADO DE TRATAMIENTO CASPA (MEDICADO) DE INDONESIA, POR PRODUCTO, 2019-2028 (MILLONES DE USD)
TABLA 239 CHAMPÚS ANTICASPA EN EL MERCADO DE TRATAMIENTOS ANTICASPA DE INDONESIA (MEDICADOS), POR PRODUCTO, 2019-2028 (MILLONES DE USD)
TABLA 240 CHAMPÚS SECOS EN EL MERCADO DE TRATAMIENTO CASPA (MEDICADOS) DE INDONESIA, POR PRODUCTO, 2019-2028 (MILLONES DE USD)
TABLA 241 CHAMPÚS NORMALES EN EL MERCADO DE TRATAMIENTO DE LA CASPA (MEDICADOS) DE INDONESIA, POR PRODUCTO, 2019-2028 (MILLONES DE USD)
TABLA 242 MERCADO DE TRATAMIENTOS CONTRA LA CASPA EN INDONESIA, POR TIPO DE MEDICAMENTO, 2019-2028 (MILLONES DE USD)
TABLA 243 INDONESIA MERCADO DE TRATAMIENTOS CONTRA LA CASPA MEDICADOS, POR GRUPO DE EDAD, 2019-2028 (MILLONES DE USD)
TABLA 244 MERCADO DE TRATAMIENTOS CONTRA LA CASPA EN INDONESIA, POR GÉNERO, 2019-2028 (MILLONES DE USD)
TABLA 245 MERCADO DE TRATAMIENTOS ANTICASPA EN INDONESIA, POR USUARIO FINAL, 2019-2028 (MILLONES DE USD)
TABLA 246 MERCADO DE TRATAMIENTOS ANTICASPA DE INDONESIA, POR TIPO DE DISTRIBUCIÓN, 2019-2028 (MILLONES DE USD)
TABLA 247 MERCADO DE TRATAMIENTOS ANTICASPA EN FILIPINAS, POR TIPO, 2019-2028 (MILLONES DE USD)
TABLA 248 MERCADO DE TRATAMIENTOS ANTICASPA EN FILIPINAS, POR MODO DE PRESCRIPCIÓN, 2019-2028 (MILLONES DE USD)
TABLA 249 MERCADO DE TRATAMIENTOS ANTICASPA DE FILIPINAS, POR PRODUCTO, 2019-2028 (MILLONES DE USD)
TABLA 250 MERCADO DE TRATAMIENTOS ANTICASPA NO MEDICADOS EN FILIPINAS, POR PRODUCTO, 2019-2028 (MILLONES DE USD)
TABLA 251 CHAMPÚ EN EL MERCADO DE TRATAMIENTOS ANTICASPA (NO MEDICADOS) DE FILIPINAS, POR PRODUCTO, 2019-2028 (MILLONES DE USD)
TABLA 252 CHAMPÚS ANTICASPA EN EL MERCADO DE TRATAMIENTOS ANTICASPA (NO MEDICADOS) DE FILIPINAS, POR PRODUCTO, 2019-2028 (MILLONES DE USD)
TABLA 253 CHAMPÚS NORMALES EN EL MERCADO DE TRATAMIENTOS ANTICASPA (NO MEDICADOS) DE FILIPINAS, POR PRODUCTO, 2019-2028 (MILLONES DE USD)
TABLA 254 ACEITES DE FILIPINAS EN EL MERCADO DE TRATAMIENTO DE LA CASPA, POR PRODUCTO, 2019-2028 (MILLONES DE USD)
TABLA 255 MERCADO DE SUERO PARA EL TRATAMIENTO DE LA CASPA EN FILIPINAS, POR PRODUCTO, 2019-2028 (MILLONES DE USD)
TABLA 256 MASCARILLA CAPILAR EN EL MERCADO DE TRATAMIENTOS ANTICASPA DE FILIPINAS, POR PRODUCTO, 2019-2028 (MILLONES DE USD)
TABLA 257 FILIPINAS MEDICADAS EN EL MERCADO DE TRATAMIENTO DE LA CASPA, POR PRODUCTO, 2019-2028 (MILLONES DE USD)
TABLA 258 CHAMPÚ EN EL MERCADO DE TRATAMIENTOS ANTICASPA (MEDICADOS) DE FILIPINAS, POR PRODUCTO, 2019-2028 (MILLONES DE USD)
TABLA 259 CHAMPÚS ANTICASPA EN EL MERCADO DE TRATAMIENTOS ANTICASPA (MEDICADOS) DE FILIPINAS, POR PRODUCTO, 2019-2028 (MILLONES DE USD)
TABLA 260 CHAMPÚS SECOS EN EL MERCADO DE TRATAMIENTOS ANTICASPA (MEDICADOS) DE FILIPINAS, POR PRODUCTO, 2019-2028 (MILLONES DE USD)
TABLA 261 CHAMPÚS NORMALES EN EL MERCADO DE TRATAMIENTOS CONTRA LA CASPA (MEDICADOS), POR PRODUCTO, 2019-2028 (MILLONES DE USD)
TABLA 262 MERCADO DE TRATAMIENTOS CONTRA LA CASPA EN FILIPINAS, POR TIPO DE MEDICAMENTO, 2019-2028 (MILLONES DE USD)
TABLA 263 FILIPINAS MEDICADAS EN EL MERCADO DE TRATAMIENTO DE LA CASPA, POR GRUPO DE EDAD, 2019-2028 (MILLONES DE USD)
TABLA 264 MERCADO DE TRATAMIENTOS CONTRA LA CASPA EN FILIPINAS, POR GÉNERO, 2019-2028 (MILLONES DE USD)
TABLA 265 MERCADO DE TRATAMIENTOS ANTICASPA EN FILIPINAS, POR USUARIO FINAL, 2019-2028 (MILLONES DE USD)
TABLA 266 MERCADO DE TRATAMIENTOS ANTICASPA EN FILIPINAS, POR TIPO DE DISTRIBUCIÓN, 2019-2028 (MILLONES DE USD)
TABLA 267 MERCADO DE TRATAMIENTOS CONTRA LA CASPA EN VIETNAM, POR TIPO, 2019-2028 (MILLONES DE USD)
TABLA 268 MERCADO DE TRATAMIENTOS CONTRA LA CASPA EN VIETNAM, POR MODO DE PRESCRIPCIÓN, 2019-2028 (MILLONES DE USD)
TABLA 269 MERCADO DE TRATAMIENTOS ANTICASPA DE VIETNAM, POR PRODUCTO, 2019-2028 (MILLONES DE USD)
TABLA 270 MERCADO DE TRATAMIENTOS ANTICASPA NO MEDICADOS DE VIETNAM, POR PRODUCTO, 2019-2028 (MILLONES DE USD)
TABLA 271 CHAMPÚ DE VIETNAM EN EL MERCADO DE TRATAMIENTOS ANTICASPA (NO MEDICADOS), POR PRODUCTO, 2019-2028 (MILLONES DE USD)
TABLA 272 CHAMPÚS ANTICASPA DE VIETNAM EN EL MERCADO DE TRATAMIENTOS ANTICASPA (NO MEDICADOS), POR PRODUCTO, 2019-2028 (MILLONES DE USD)
TABLA 273 VIETNAM CHAMPÚS NORMALES EN EL MERCADO DE TRATAMIENTOS ANTICASPA (NO MEDICADOS), POR PRODUCTO, 2019-2028 (MILLONES DE USD)
TABLA 274 ACEITES DE VIETNAM EN EL MERCADO DE TRATAMIENTOS ANTICASPA, POR PRODUCTO, 2019-2028 (MILLONES DE USD)
TABLA 275 MERCADO DE SUERO PARA EL TRATAMIENTO DE LA CASPA EN VIETNAM, POR PRODUCTO, 2019-2028 (MILLONES DE USD)
TABLA 276 MASCARILLA CAPILAR DE VIETNAM EN EL MERCADO DE TRATAMIENTOS ANTICASPA, POR PRODUCTO, 2019-2028 (MILLONES DE USD)
TABLA 277 VIETNAM MERCADO DE TRATAMIENTOS MEDICADOS CONTRA LA CASPA, POR PRODUCTO, 2019-2028 (MILLONES DE USD)
TABLA 278 CHAMPÚ DE VIETNAM EN EL MERCADO DE TRATAMIENTOS CONTRA LA CASPA (MEDICADOS), POR PRODUCTO, 2019-2028 (MILLONES DE USD)
TABLA 279 CHAMPÚS ANTICASPA DE VIETNAM EN EL MERCADO DE TRATAMIENTOS ANTICASPA (MEDICADOS), POR PRODUCTO, 2019-2028 (MILLONES DE USD)
TABLA 280 CHAMPÚS SECOS DE VIETNAM EN EL MERCADO DE TRATAMIENTOS ANTICASPA (MEDICADOS), POR PRODUCTO, 2019-2028 (MILLONES DE USD)
TABLA 281 CHAMPÚS NORMALES DE VIETNAM EN EL MERCADO DE TRATAMIENTOS CONTRA LA CASPA (MEDICADOS), POR PRODUCTO, 2019-2028 (MILLONES DE USD)
TABLA 282 MERCADO DE TRATAMIENTOS CONTRA LA CASPA EN VIETNAM, POR TIPO DE MEDICAMENTO, 2019-2028 (MILLONES DE USD)
TABLA 283 VIETNAM MERCADO DE TRATAMIENTOS MEDICADOS CONTRA LA CASPA, POR GRUPO DE EDAD, 2019-2028 (MILLONES DE USD)
TABLA 284 MERCADO DE TRATAMIENTOS CONTRA LA CASPA DE IETNAM, POR GÉNERO, 2019-2028 (MILLONES DE USD)
TABLA 285 MERCADO DE TRATAMIENTOS CONTRA LA CASPA EN VIETNAM, POR USUARIO FINAL, 2019-2028 (MILLONES DE USD)
TABLA 286 MERCADO DE TRATAMIENTOS ANTICASPA DE VIETNAM, POR TIPO DE DISTRIBUCIÓN, 2019-2028 (MILLONES DE USD)
TABLA 287 RESTO DEL MERCADO DE TRATAMIENTOS CONTRA LA CASPA DE ASIA-PACÍFICO, POR TIPO, 2019-2028 (MILLONES DE USD)
Lista de figuras
LISTA DE FIGURAS
FIGURA 1 MERCADO DE TRATAMIENTOS CONTRA LA CASPA DE ASIA-PACÍFICO: SEGMENTACIÓN
FIGURA 2 MERCADO DE TRATAMIENTOS CONTRA LA CASPA EN ASIA-PACÍFICO: TRIANGULACIÓN DE DATOS
FIGURA 3 MERCADO DE TRATAMIENTOS CONTRA LA CASPA EN ASIA-PACÍFICO: ANÁLISIS DE DROC
FIGURA 4 MERCADO DE TRATAMIENTOS CONTRA LA CASPA EN ASIA-PACÍFICO: ANÁLISIS DEL MERCADO DE ASIA-PACÍFICO VS. REGIONAL
FIGURA 5 MERCADO DE TRATAMIENTOS CONTRA LA CASPA EN ASIA-PACÍFICO: ANÁLISIS DE INVESTIGACIÓN DE EMPRESAS
FIGURA 6 MERCADO DE TRATAMIENTOS CONTRA LA CASPA EN ASIA-PACÍFICO: MODELADO MULTIVARIADO
FIGURA 7 MERCADO DE TRATAMIENTOS CONTRA LA CASPA DE ASIA-PACÍFICO: DATOS DEMOGRÁFICOS DE LAS ENTREVISTAS
FIGURA 8 MERCADO DE TRATAMIENTOS CONTRA LA CASPA EN ASIA-PACÍFICO: CUADRÍCULA DE POSICIÓN DE MERCADO DE DBMR
FIGURA 9 MERCADO DE TRATAMIENTOS CONTRA LA CASPA DE ASIA-PACÍFICO: ANÁLISIS DE LA PARTICIPACIÓN DE LOS PROVEEDORES
FIGURA 10 MERCADO DE TRATAMIENTOS CONTRA LA CASPA DE ASIA-PACÍFICO: SEGMENTACIÓN
FIGURA 11 EL AUMENTO DEL NÚMERO DE ESPECIES DE MALASSEZIA EN EL MEDIO AMBIENTE Y LA AUMENTO DE LA PREVALENCIA DEL VIH ESTÁN IMPULSANDO EL MERCADO DE TRATAMIENTOS CONTRA LA CASPA EN ASIA-PACÍFICO EN EL PERÍODO DE PRONÓSTICO DE 2021 A 2028
FIGURA 12 SE ESPERA QUE EL SEGMENTO DE TRATAMIENTO DE LA CASPA POR HONGOS REPRESENTE LA MAYOR PARTICIPACIÓN DEL MERCADO DE TRATAMIENTO DE LA CASPA DE ASIA-PACÍFICO EN 2021 Y 2028
FIGURA 13 ASIA-PACÍFICO ES EL MERCADO DE MÁS RÁPIDO CRECIMIENTO EN EL MERCADO DE TRATAMIENTOS CONTRA LA CASPA EN ASIA-PACÍFICO EN EL PERÍODO DE PRONÓSTICO DE 2021 A 2028
FIGURA 14 IMPULSORES, RESTRICCIONES, OPORTUNIDADES Y DESAFÍOS DEL MERCADO DE TRATAMIENTOS CONTRA LA CASPA EN ASIA-PACÍFICO
FIGURA 15 INFECCIÓN POR VIH EN 2018 EN DIFERENTES REGIONES DEL MUNDO
FIGURA 16 PORCENTAJE DE USUARIOS DE INTERNET EN 2016 Y 2019
FIGURA 17 MERCADO DE TRATAMIENTOS CONTRA LA CASPA EN ASIA-PACÍFICO: POR TIPO, 2020
FIGURA 18 MERCADO DE TRATAMIENTOS CONTRA LA CASPA EN ASIA-PACÍFICO: POR TIPO, 2020-2028 (MILLONES DE USD)
FIGURA 19 MERCADO DE TRATAMIENTOS CONTRA LA CASPA EN ASIA-PACÍFICO: POR TIPO, CAGR (2021-2028)
FIGURA 20 MERCADO DE TRATAMIENTOS CONTRA LA CASPA DE ASIA-PACÍFICO: POR TIPO, CURVA DE LÍNEA DE VIDA
FIGURA 21 MERCADO DE TRATAMIENTOS CONTRA LA CASPA EN ASIA-PACÍFICO: POR MODO DE PRESCRIPCIÓN, 2020
FIGURA 22 MERCADO DE TRATAMIENTOS CONTRA LA CASPA EN ASIA-PACÍFICO: POR MODO DE PRESCRIPCIÓN, 2020-2028 (MILLONES DE USD)
FIGURA 23 MERCADO DE TRATAMIENTOS CONTRA LA CASPA DE ASIA-PACÍFICO: POR MODO DE PRESCRIPCIÓN, CAGR (2021-2028).
FIGURA 24 MERCADO DE TRATAMIENTOS PARA LA CASPA EN ASIA-PACÍFICO: POR MODO DE PRESCRIPCIÓN, CURVA DE LÍNEA DE VIDA
FIGURA 25 MERCADO DE TRATAMIENTOS CONTRA LA CASPA EN ASIA-PACÍFICO: POR TIPO, 2020
FIGURA 26 MERCADO DE TRATAMIENTOS CONTRA LA CASPA EN ASIA-PACÍFICO: POR TIPO, 2020-2028 (MILLONES DE USD)
FIGURA 27 MERCADO DE TRATAMIENTOS CONTRA LA CASPA EN ASIA-PACÍFICO: POR TIPO, CAGR (2021-2028)
FIGURA 28 MERCADO DE TRATAMIENTOS CONTRA LA CASPA DE ASIA-PACÍFICO: POR TIPO, CURVA DE LÍNEA DE VIDA
FIGURA 29 MERCADO DE TRATAMIENTOS CONTRA LA CASPA EN ASIA-PACÍFICO: POR TIPO DE MEDICAMENTO, 2020
FIGURA 30 MERCADO DE TRATAMIENTO DE LA CASPA EN ASIA-PACÍFICO: POR TIPO DE MEDICAMENTO, 2020-2028 (MILLONES DE USD)
FIGURA 31 MERCADO DE TRATAMIENTOS CONTRA LA CASPA EN ASIA-PACÍFICO: POR TIPO DE MEDICAMENTO, CAGR (2021-2028)
FIGURA 32 MERCADO DE TRATAMIENTO DE LA CASPA EN ASIA-PACÍFICO: POR TIPO DE MEDICAMENTO, CURVA DE LÍNEA DE VIDA
FIGURA 33 MERCADO DE TRATAMIENTOS CONTRA LA CASPA EN ASIA-PACÍFICO: POR GRUPO DE EDAD, 2020
FIGURA 34 MERCADO DE TRATAMIENTOS CONTRA LA CASPA EN ASIA-PACÍFICO: POR GRUPO DE EDAD, 2020-2028 (MILLONES DE USD)
FIGURA 35 MERCADO DE TRATAMIENTOS CONTRA LA CASPA EN ASIA-PACÍFICO: POR GRUPO DE EDAD, CAGR (2021-2028)
FIGURA 36 MERCADO DE TRATAMIENTO DE LA CASPA EN ASIA-PACÍFICO: POR GRUPO DE EDAD, CURVA DE LÍNEA DE VIDA
FIGURA 37 MERCADO DE TRATAMIENTOS CONTRA LA CASPA EN ASIA-PACÍFICO: POR GÉNERO, 2020
FIGURA 38 MERCADO DE TRATAMIENTOS CONTRA LA CASPA EN ASIA-PACÍFICO: POR GÉNERO, 2020-2028 (MILLONES DE USD)
FIGURA 39 MERCADO DE TRATAMIENTOS CONTRA LA CASPA EN ASIA-PACÍFICO: POR GÉNERO, CAGR (2021-2028)
FIGURA 40 MERCADO DE TRATAMIENTOS CONTRA LA CASPA DE ASIA-PACÍFICO: POR GÉNERO, CURVA DE LÍNEA DE VIDA
FIGURA 41 MERCADO DE TRATAMIENTOS CONTRA LA CASPA DE ASIA-PACÍFICO: POR USUARIO FINAL, 2020
FIGURA 42 MERCADO DE TRATAMIENTOS CONTRA LA CASPA EN ASIA-PACÍFICO: POR USUARIO FINAL, 2020-2028 (MILLONES DE USD)
FIGURA 43 MERCADO DE TRATAMIENTOS CONTRA LA CASPA EN ASIA-PACÍFICO: POR USUARIO FINAL, CAGR (2021-2028)
FIGURA 44 MERCADO DE TRATAMIENTOS CONTRA LA CASPA DE ASIA-PACÍFICO: POR USUARIO FINAL, CURVA LIFELINE
FIGURA 45 MERCADO DE TRATAMIENTOS CONTRA LA CASPA DE ASIA-PACÍFICO: POR TIPO DE DISTRIBUCIÓN, 2020
FIGURA 46 MERCADO DE TRATAMIENTOS CONTRA LA CASPA EN ASIA-PACÍFICO: POR TIPO DE DISTRIBUCIÓN, 2020-2028 (MILLONES DE USD)
FIGURA 47 MERCADO DE TRATAMIENTOS CONTRA LA CASPA EN ASIA-PACÍFICO: POR TIPO DE DISTRIBUCIÓN, CAGR (2021-2028)
FIGURA 48 MERCADO DE TRATAMIENTO DE LA CASPA EN ASIA-PACÍFICO: POR TIPO DE DISTRIBUCIÓN, CURVA DE LÍNEA DE VIDA
FIGURA 49 MERCADO DE TRATAMIENTOS CONTRA LA CASPA EN ASIA-PACÍFICO: INSTANTÁNEA (2020)
FIGURA 50 MERCADO DE TRATAMIENTOS CONTRA LA CASPA EN ASIA-PACÍFICO: POR PAÍS (2020)
FIGURA 51 MERCADO DE TRATAMIENTOS CONTRA LA CASPA EN ASIA-PACÍFICO: POR PAÍS (2021 Y 2028)
FIGURA 52 MERCADO DE TRATAMIENTOS CONTRA LA CASPA EN ASIA-PACÍFICO: POR PAÍS (2020 Y 2028)
FIGURA 53 MERCADO DE TRATAMIENTOS CONTRA LA CASPA EN ASIA-PACÍFICO: POR TIPO (2021-2028)
FIGURA 54 MERCADO DE TRATAMIENTOS CONTRA LA CASPA DE ASIA-PACÍFICO: PARTICIPACIÓN DE LA EMPRESA 2020 (%)
Metodología de investigación
La recopilación de datos y el análisis del año base se realizan utilizando módulos de recopilación de datos con muestras de gran tamaño. La etapa incluye la obtención de información de mercado o datos relacionados a través de varias fuentes y estrategias. Incluye el examen y la planificación de todos los datos adquiridos del pasado con antelación. Asimismo, abarca el examen de las inconsistencias de información observadas en diferentes fuentes de información. Los datos de mercado se analizan y estiman utilizando modelos estadísticos y coherentes de mercado. Además, el análisis de la participación de mercado y el análisis de tendencias clave son los principales factores de éxito en el informe de mercado. Para obtener más información, solicite una llamada de un analista o envíe su consulta.
La metodología de investigación clave utilizada por el equipo de investigación de DBMR es la triangulación de datos, que implica la extracción de datos, el análisis del impacto de las variables de datos en el mercado y la validación primaria (experto en la industria). Los modelos de datos incluyen cuadrícula de posicionamiento de proveedores, análisis de línea de tiempo de mercado, descripción general y guía del mercado, cuadrícula de posicionamiento de la empresa, análisis de patentes, análisis de precios, análisis de participación de mercado de la empresa, estándares de medición, análisis global versus regional y de participación de proveedores. Para obtener más información sobre la metodología de investigación, envíe una consulta para hablar con nuestros expertos de la industria.
Personalización disponible
Data Bridge Market Research es líder en investigación formativa avanzada. Nos enorgullecemos de brindar servicios a nuestros clientes existentes y nuevos con datos y análisis que coinciden y se adaptan a sus objetivos. El informe se puede personalizar para incluir análisis de tendencias de precios de marcas objetivo, comprensión del mercado de países adicionales (solicite la lista de países), datos de resultados de ensayos clínicos, revisión de literatura, análisis de mercado renovado y base de productos. El análisis de mercado de competidores objetivo se puede analizar desde análisis basados en tecnología hasta estrategias de cartera de mercado. Podemos agregar tantos competidores sobre los que necesite datos en el formato y estilo de datos que esté buscando. Nuestro equipo de analistas también puede proporcionarle datos en archivos de Excel sin procesar, tablas dinámicas (libro de datos) o puede ayudarlo a crear presentaciones a partir de los conjuntos de datos disponibles en el informe.

