Asia Pacific Mainframe Market
Tamaño del mercado en miles de millones de dólares
Tasa de crecimiento anual compuesta (CAGR) :
% 
 USD
7.31 Billion
USD
9.83 Billion
2024
2032
USD
7.31 Billion
USD
9.83 Billion
2024
2032
| 2025 –2032 | |
| USD 7.31 Billion | |
| USD 9.83 Billion | |
| % | |
|
Segmentación del mercado de mainframes en Asia-Pacífico por sistemas (mainframes y sistemas de gama media), componentes (hardware, servicios y software), tamaño de la organización (grandes empresas y pequeñas y medianas empresas [pymes]), uso final (servicios financieros, TI y telecomunicaciones, atención médica, sector público, automoción y manufactura, comercio minorista y bienes de consumo envasados [CPG], viajes, medios de comunicación y entretenimiento, entre otros): tendencias y pronóstico del sector hasta 2032.
Tamaño del mercado de mainframes
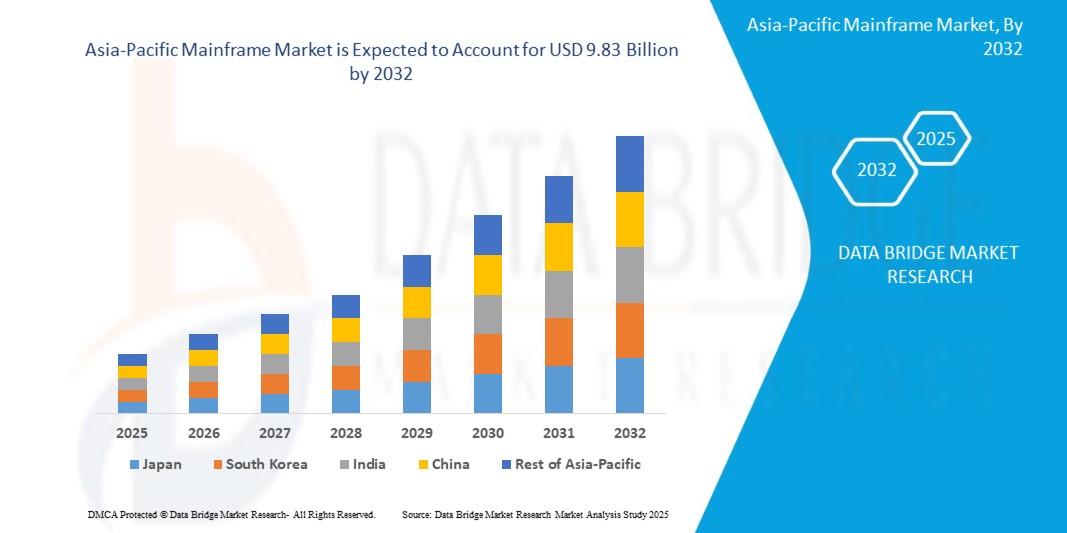
- El mercado global de mainframes se valoró en USD 7.310 millones en 2024 y se espera que alcance los USD 9.830 millones en 2032.
- Durante el período de pronóstico de 2025 a 2032, es probable que el mercado crezca a una CAGR del 3,8%, impulsado principalmente por la digitalización acelerada en todas las industrias y las crecientes amenazas de ciberseguridad y violaciones de datos.
- Este crecimiento está impulsado por factores como las crecientes necesidades de procesamiento de datos, la integración de la nube, las demandas de ciberseguridad, la adopción de IA y la creciente transformación digital empresarial.
Análisis del mercado de mainframes en Asia-Pacífico
- Los mainframes son sistemas informáticos críticos utilizados en diversas industrias, que proporcionan procesamiento de alto rendimiento, seguridad y fiabilidad para operaciones complejas. Se utilizan ampliamente en los sectores de banca, servicios financieros y seguros (BFSI), salud y gobierno.
- La demanda de mainframes se ve impulsada significativamente por la creciente tendencia a la digitalización, las crecientes amenazas a la ciberseguridad y la necesidad de procesamiento de datos de alta velocidad. Industrias como BFSI dependen de mainframes para el procesamiento de transacciones, los sistemas bancarios centrales, la gestión de riesgos y el cumplimiento normativo.
- La región de América del Norte se destaca como uno de los mercados dominantes para mainframes, impulsado por una sólida infraestructura de TI empresarial, crecientes inversiones en ciberseguridad y una alta adopción en instituciones financieras y operaciones gubernamentales.
- Por ejemplo, los principales bancos y proveedores de atención médica de EE. UU. dependen en gran medida de los mainframes para el procesamiento de transacciones en tiempo real y el almacenamiento seguro de datos, lo que garantiza operaciones ininterrumpidas y cumplimiento normativo.
- En Asia-Pacífico, los mainframes se encuentran entre los sistemas informáticos más esenciales, reconocidos por sus características de seguridad superiores, que incluyen cifrado, control de acceso, monitoreo de seguridad y alta disponibilidad, lo que los convierte en la opción preferida para aplicaciones de misión crítica en los sectores de finanzas, atención médica y gobierno.
Alcance del informe y segmentación del mercado
|
Atributos |
Perspectivas clave del mercado de mainframes en Asia-Pacífico |
|
Segmentos cubiertos |
|
|
Países cubiertos |
Asia-Pacífico
|
|
Actores clave del mercado |
|
|
Oportunidades de mercado |
|
|
Conjuntos de información de datos de valor añadido |
Además de los conocimientos sobre escenarios de mercado, como valor de mercado, tasa de crecimiento, segmentación, cobertura geográfica y actores principales, los informes de mercado seleccionados por Data Bridge Market Research también incluyen análisis en profundidad de expertos, análisis de precios, análisis de participación de marca, encuesta de consumidores, análisis demográfico, análisis de la cadena de suministro, análisis de la cadena de valor, descripción general de materias primas/consumibles, criterios de selección de proveedores, análisis PESTLE, análisis de Porter y marco regulatorio. |
Tendencias del mercado de mainframes en Asia-Pacífico
Creciente demanda de informática de alto rendimiento
- La creciente demanda de sistemas informáticos potentes está impulsada por la explosión de datos en la era digital, lo que requiere soluciones HPC capaces de procesar y analizar conjuntos de datos masivos y complejos.
- El auge de la inteligencia artificial (IA) y el aprendizaje automático (ML) ha contribuido significativamente a la creciente necesidad de HPC, ya que los algoritmos de IA y ML requieren una inmensa potencia computacional para entrenar y optimizar los modelos de manera eficiente.
- Por ejemplo, en abril de 2023, TechDay publicó un artículo que afirmaba que el gobierno de los Emiratos Árabes Unidos comenzó a impulsar los objetivos de transformación digital. Muchos de estos se conocen como Smart Dubai y Smart Abu Dhabi. Se espera que estas actividades aumenten la demanda de computación de alto rendimiento.
- Más allá de las aplicaciones científicas, HPC está revolucionando el análisis de negocios, permitiendo a las empresas procesar grandes cantidades de datos para optimizar las cadenas de suministro, predecir el comportamiento de los clientes e identificar tendencias del mercado, lo que conduce a una toma de decisiones más informada y a ventajas competitivas.
Dinámica del mercado de mainframes en Asia-Pacífico
Conductores
“ Digitalización acelerada en todas las industrias ”
- La creciente tendencia a la digitalización en los sectores bancario, de servicios financieros y seguros (BFSI) y de la salud está impulsando significativamente la demanda de mainframes, ya que las organizaciones requieren una infraestructura informática segura y confiable.
- Los mainframes desempeñan un papel fundamental en las aplicaciones de procesamiento de transacciones de gran volumen, incluidas las transacciones en cajeros automáticos, el procesamiento de tarjetas de crédito y la negociación de acciones, donde la escalabilidad, la confiabilidad y la seguridad son esenciales.
- En el sector bancario, los mainframes sirven como columna vertebral de los sistemas bancarios centrales y respaldan funciones clave como la gestión de cuentas de clientes, el procesamiento de préstamos y el procesamiento de pagos, lo que garantiza operaciones financieras fluidas.
- La industria de la salud depende cada vez más de mainframes para manejar registros médicos electrónicos (EMR), que proporcionan la potencia de procesamiento, la seguridad y la disponibilidad necesarias para gestionar grandes volúmenes de datos confidenciales de pacientes.
- A medida que las instituciones financieras y los proveedores de atención médica continúan adoptando soluciones digitales, crece la necesidad de sistemas informáticos de alto rendimiento, como mainframes, que garanticen operaciones seguras, eficientes e ininterrumpidas.
Por ejemplo,
- Según un informe de IBM, un mainframe se utiliza como cajero automático (ATM) para interactuar con la cuenta bancaria del cliente. Las empresas utilizan mainframes para aplicaciones que requieren escalabilidad y fiabilidad. Por ejemplo, una institución bancaria podría usar un mainframe para alojar la base de datos de las cuentas de sus clientes, cuyas transacciones pueden enviarse desde miles de cajeros automáticos en todo el mundo. El informe también menciona que en la banca, las finanzas, la sanidad, los seguros, los servicios públicos, la administración pública y muchas otras empresas públicas y privadas, el mainframe sigue siendo la base de los negocios modernos.
- En diciembre de 2020, Maintec Technologies publicó un artículo que afirmaba que el requisito de intercambiar los historiales clínicos de los pacientes entre las organizaciones ha generado una demanda de historiales clínicos electrónicos (HCE) estandarizados, lo que requiere un mayor almacenamiento similar al de un mainframe, así como estándares web similares a Linux. También se menciona que el mainframe ofrece altos estándares de seguridad y cumplimiento normativo. El sector sanitario necesita los sistemas más seguros disponibles para proteger estos datos. Los mainframes tienen la reputación de ser la plataforma más segura. Los servidores y el software de mainframe ahora cuentan con un cifrado de datos generalizado. Estas medidas de seguridad ayudan a las organizaciones sanitarias a proteger los datos y la privacidad de sus pacientes.
Oportunidades
“ Creciente enfoque en la modernización del mainframe ”
- La integración de la nube híbrida está transformando el mercado de mainframe, permitiendo a las empresas conectar sin problemas los sistemas locales con los entornos de nube manteniendo un alto rendimiento, seguridad y escalabilidad.
- Las organizaciones están adoptando cada vez más arquitecturas de nube híbrida para optimizar las cargas de trabajo, administrar grandes volúmenes de datos y respaldar aplicaciones de misión crítica, garantizando operaciones eficientes e ininterrumpidas.
- Los mainframes desempeñan un papel crucial en el procesamiento de datos en tiempo real y las transacciones seguras, lo que los hace esenciales para industrias como la banca, los seguros y el comercio minorista, donde la seguridad de los datos y la continuidad operativa son las principales prioridades.
- Las soluciones de nube híbrida permiten a las organizaciones conservar datos confidenciales en sus instalaciones y, al mismo tiempo, aprovechar la rentabilidad y la flexibilidad de la computación en la nube, mejorando la modernización de la infraestructura de TI.
Restricciones/Desafíos
“ Intensa competencia de las plataformas basadas en la nube ”
- A pesar del auge de la computación en la nube, los mainframes siguen siendo una parte esencial de la infraestructura de TI y ofrecen beneficios únicos que las soluciones en la nube no pueden reemplazar por completo.
- La computación en la nube proporciona una mayor flexibilidad que la tecnología mainframe, lo que permite a las organizaciones ampliar o reducir los recursos según la demanda, mejorando la eficiencia y reduciendo los costos.
- Para cargas de trabajo específicas, la computación en la nube puede ser una opción más rentable, ya que los modelos de precios de pago por uso permiten a las organizaciones pagar solo por los recursos que utilizan.
- La computación en la nube mejora la accesibilidad, permitiendo a las organizaciones con presencia en Asia-Pacífico acceder a recursos informáticos desde cualquier lugar del mundo, facilitando las operaciones remotas.
- Los proveedores de la nube gestionan el mantenimiento de la infraestructura, lo que reduce la carga de las organizaciones y libera tiempo y recursos para las funciones comerciales principales.
Por ejemplo,
- En septiembre de 2022, InfoWorld publicó un artículo que afirmaba que FedEx había anunciado que para 2024 cerraría sus centros de datos y los mainframes que los acompañaban para pasar "todo" a la nube (probablemente Microsoft Azure, si los hábitos de compra anteriores continúan).
- En marzo de 2022, Fujitsu publicó un artículo que afirmaba que la compañía dejaría de fabricar soluciones mainframe en los próximos nueve años. Recientemente, Fujitsu reveló que finalizaría la venta de sus mainframes en abril de 2031 y que suspendería el soporte cinco años después. La dirección de la compañía afirmó que Fujitsu mantiene un gran interés en el mercado de mainframes, con un nuevo modelo aún en su hoja de ruta para 2024 y un proceso en marcha para migrar sus mainframes y servidores UNIX a la nube, mejorando gradualmente sus sistemas empresariales existentes para optimizar la experiencia de sus usuarios finales. Este desarrollo explica que las organizaciones están perdiendo la confianza en las soluciones mainframe.
- En diciembre de 2021, Informa USA Inc. publicó un informe sobre mainframes. En este informe, se menciona que AWS anunció un nuevo servicio gestionado que permite a las empresas migrar cargas de trabajo de mainframes a la nube. Las empresas están logrando integrar mainframes en la nube.
Alcance del mercado de mainframes
El mercado está segmentado en función de los sistemas, los componentes, el tamaño de la organización y el uso final.
|
Segmentación |
Subsegmentación |
|
Por sistemas |
|
|
Por componente |
|
|
Por tamaño de la organización |
|
|
Por uso final
|
|
Análisis regional del mercado de mainframes
China es la región dominante en el mercado de mainframes
- China lidera el mercado de mainframes, impulsada por una fuerte presencia de actores clave de la industria, la adopción temprana de infraestructura de TI avanzada e inversiones significativas en transformación digital.
“Se proyecta que China registre la tasa de crecimiento más alta”
- Se espera que China sea testigo de un crecimiento significativo en el mercado de mainframes, impulsado por la adopción temprana de infraestructura de TI avanzada, el aumento de las inversiones en transformación digital y una fuerte demanda de soluciones informáticas seguras.
Cuota de mercado de mainframes
El panorama competitivo del mercado ofrece detalles por competidor. Se incluye información general de la empresa, sus estados financieros, ingresos generados, potencial de mercado, inversión en investigación y desarrollo, nuevas iniciativas de mercado, presencia en Asia-Pacífico, plantas de producción, capacidad de producción, fortalezas y debilidades de la empresa, lanzamiento de productos, alcance y variedad de productos, y dominio de las aplicaciones. Los datos anteriores se refieren únicamente al enfoque de mercado de las empresas.
Los principales líderes del mercado que operan en el mercado son:
- IBM Corporation (EE. UU.)
- Unisys (EE. UU.)
- Fujitsu (Japón)
- Corporación NEC (Japón)
- BMC Software, Inc. (EE. UU.)
- Hitachi Vantara LLC (EE. UU.)
- Dell Inc. (EE. UU.)
- Broadcom (EE. UU.)
- Atos SE (Francia)
- Cognizant (EE. UU.)
- Compañía de tecnología DXC (EE. UU.)
- HCL Technologies Limited (India)
- Tieotoevry (Finlandia)
- Infosys Limited (India)
- Hewlett Packard Enterprise Development LP (EE. UU.)
Últimos avances en el mercado de mainframes en Asia-Pacífico
- En septiembre de 2024, IBM lanzó su nuevo IBM DS8000, diseñado para mejorar el almacenamiento de clase empresarial para arquitecturas mainframe IBM Z. Ofrece alta confiabilidad, alcanzando una disponibilidad de hasta el 99,999999% y protegiendo datos críticos de ciberataques con funciones de seguridad integradas. El DS8000 admite cargas de trabajo de última generación, mejorando el rendimiento al reducir la latencia y aumentar la capacidad de procesamiento para transacciones de alto volumen. También mejora la eficiencia del centro de datos, duplicando la capacidad de almacenamiento con módulos FlashCore avanzados. Esta innovación garantiza que las empresas puedan escalar eficazmente, manteniendo la resiliencia de los datos y proporcionando una infraestructura ágil y segura para cargas de trabajo críticas.
- En agosto de 2024, IBM anunció el desarrollo del procesador Telum II y el acelerador Spyre, diseñados para mejorar las capacidades de IA en los mainframes IBM Z. Estas innovaciones buscan acelerar las cargas de trabajo de IA, en particular la compatibilidad con modelos de lenguaje grandes (LLM) e IA generativa. Mejorarán la gestión de la memoria, el manejo de datos y la potencia de procesamiento, lo que permitirá a las empresas procesar eficientemente tareas complejas como la detección de fraudes y la gestión de riesgos financieros. Los beneficios incluyen soluciones de IA escalables, seguras y de alto rendimiento que ayudan a las empresas a afrontar los retos de uso intensivo de datos, optimizar la toma de decisiones y fomentar la innovación, manteniendo al mismo tiempo la robusta seguridad del mainframe.
- En agosto de 2023, IBM presentó Watsonx Code Assistant para Z, una herramienta de IA generativa diseñada para acelerar la modernización de aplicaciones mainframe. Este desarrollo está diseñado para ayudar a las organizaciones a refactorizar y transformar código COBOL a Java, impulsando así la productividad de los desarrolladores. Al aprovechar un modelo de lenguaje de 20 mil millones de parámetros, la herramienta automatiza y optimiza la traducción de código, lo que permite a las empresas modernizar aplicaciones críticas con mayor rapidez, manteniendo el rendimiento, la seguridad y la resiliencia. Además, mejora las habilidades de los desarrolladores y acelera la incorporación, solucionando la brecha de habilidades. Se espera que la solución reduzca significativamente el tiempo de modernización y mejore la calidad del código en todos los sistemas empresariales.
- En febrero de 2025, Unisys se asoció con el Chicago Quantum Exchange (CQE) para impulsar las aplicaciones de la tecnología cuántica. Esta colaboración permite a Unisys interactuar con talentos líderes, participar en eventos de innovación cuántica, formar alianzas estratégicas para el desarrollo conjunto de soluciones cuánticas específicas para cada sector y compartir experiencia dentro de la red del CQE.
- En enero de 2025, Unisys amplió su red en Asia-Pacífico al incorporar Finnair Cargo a su plataforma Cargo Portal Services (CPS). Esta colaboración fortalece la presencia digital de Finnair Cargo, optimiza las operaciones y brinda acceso a una base de clientes más amplia. CPS ofrece a las aerolíneas de Asia-Pacífico un portal confiable de reservas de carga aérea para múltiples aerolíneas, lo que aumenta la eficiencia operativa.
SKU-
Obtenga acceso en línea al informe sobre la primera nube de inteligencia de mercado del mundo

- Panel de análisis de datos interactivo
- Panel de análisis de empresas para oportunidades con alto potencial de crecimiento
- Acceso de analista de investigación para personalización y consultas
- Análisis de la competencia con panel interactivo
- Últimas noticias, actualizaciones y análisis de tendencias
- Aproveche el poder del análisis de referencia para un seguimiento integral de la competencia
Tabla de contenido
1 INTRODUCCIÓN
1.1 OBJETIVOS DEL ESTUDIO
1.2 DEFINICIÓN DE MERCADO
1.3 INFORMACIÓN GENERAL
1.4 LIMITACIONES
1.5 MERCADOS CUBIERTOS
2 SEGMENTACIÓN DEL MERCADO
2.1 MERCADOS CUBIERTOS
2.2 ÁMBITO GEOGRÁFICO
2,3 AÑOS CONSIDERADOS PARA EL ESTUDIO
2.4 MONEDA Y PRECIOS
2.5 MODELO DE VALIDACIÓN DE DATOS TRÍPODE DBMR
2.6 MODELADO MULTIVARIADO
2.7 ENTREVISTAS PRINCIPALES CON LÍDERES DE OPINIÓN CLAVE
2.8 CUADRÍCULA DE POSICIÓN DE MERCADO DBMR
2.9 ANÁLISIS DE PARTICIPACIÓN DE PROVEEDORES DE DBMR
2.1 CUADRÍCULA DE COBERTURA DE APLICACIONES DEL MERCADO
2.11 FUENTES SECUNDARIAS
2.12 SUPUESTOS
3 RESUMEN EJECUTIVO
4 INFORMACIÓN PREMIUM
4.1 ANÁLISIS PESTEL
4.1.1 FACTORES POLÍTICOS
4.1.2 FACTORES ECONÓMICOS
4.1.3 FACTORES SOCIALES
4.1.4 FACTORES TECNOLÓGICOS
4.1.5 FACTORES AMBIENTALES
4.1.6 FACTORES LEGALES
4.2 LAS CINCO FUERZAS DE PORTER
4.2.1 AMENAZA DE NUEVOS ENTRANTES
4.2.2 PODER DE NEGOCIACIÓN DE LOS PROVEEDORES
4.2.3 PODER DE NEGOCIACIÓN DE LOS COMPRADORES
4.2.4 AMENAZA DE PRODUCTOS SUSTITUTOS
4.2.5 RIVALIDAD EN LA INDUSTRIA
4.2.6 CONCLUSIÓN
4.3 ANÁLISIS COMPARATIVO DE EMPRESAS
4.3.1 IBM CORPORATION
4.3.2 FUJITSU
4.3.3 CORPORACIÓN NEC
4.3.4 UNISYS
4.3.5 BMC SOFTWARE, INC.
4.3.6 CONCLUSIÓN
4.4 ANÁLISIS DE LA INDUSTRIA Y ESCENARIO FUTURISTA
4.4.1 DESCRIPCIÓN GENERAL DE LA INDUSTRIA
4.4.2 TENDENCIAS Y DINÁMICA DEL MERCADO
4.4.3 ESCENARIO FUTURISTA
4.4.4 CONCLUSIÓN
4.5 INFORMACIÓN PRINCIPAL CLAVE: POR PAÍSES PRINCIPALES
4.5.1 AMÉRICA DEL NORTE Y AMÉRICA DEL SUR
4.5.1.1 EE. UU.
4.5.1.2 CANADÁ
4.5.1.3 MÉXICO, BRASIL Y ARGENTINA
4.5.2 EUROPA
4.5.2.1 Reino Unido
4.5.2.2 ALEMANIA
4.5.2.3 FRANCIA E ITALIA
4.5.3 ASIA-PACÍFICO
4.5.3.1 CHINA
4.5.3.2 JAPÓN
4.5.3.3 INDIA
4.5.3.4 COREA DEL SUR Y AUSTRALIA
4.5.4 ORIENTE MEDIO Y ÁFRICA
4.5.4.1 ARABIA SAUDITA Y EAU
4.5.4.2 ISRAEL
4.5.4.3 SUDÁFRICA Y EGIPTO
4.6 ANÁLISIS DE TECNOLOGÍA
4.6.1 CRECIMIENTO DEL MERCADO Y PROYECCIONES
4.6.1.1 FACTORES CLAVE DE LA MODERNIZACIÓN DEL MAINFRAME
4.6.1.1.1 Eficiencia de costos
4.6.1.1.2 Escalabilidad y rendimiento
4.6.1.1.3 Seguridad y cumplimiento
4.6.1.1.4 Integración con tecnologías emergentes
4.6.1.1.5 Iniciativas de transformación digital
4.6.1.2 TENDENCIAS DE LA INDUSTRIA
4.6.1.2.1 Adopción de la nube
4.6.1.2.2 Entornos híbridos
4.6.1.2.3 Integración de IA y ML
4.6.2 RESULTADOS EMPRESARIALES CLAVE Y CASOS DE USO DE LA INDUSTRIA
4.6.2.1 SERVICIOS FINANCIEROS
4.6.2.2 ATENCIÓN SANITARIA
4.6.2.3 VENTA AL POR MENOR
4.6.2.4 FABRICACIÓN
4.6.2.5 GOBIERNO
4.6.3 DESAFÍOS Y CONSIDERACIONES
4.6.3.1 ESCASEZ DE HABILIDADES
4.6.3.2 COMPLEJIDAD DE LA INTEGRACIÓN
4.6.3.3 RIESGOS DE TIEMPO DE INACTIVIDAD
4.6.3.4 PREOCUPACIONES DE SEGURIDAD
4.6.4 CONCLUSIÓN
5 COBERTURA REGULATORIA
6 PANORAMA GENERAL DEL MERCADO
6.1 CONDUCTORES
6.1.1 DIGITALIZACIÓN ACELERADA EN TODAS LAS INDUSTRIAS
6.1.2 AUMENTO DE LAS AMENAZAS A LA CIBERSEGURIDAD Y LAS VIOLACIONES DE DATOS
6.1.3 CRECIENTE DEMANDA DE COMPUTACIÓN DE ALTO RENDIMIENTO
6.1.4 CRECIENTE NECESIDAD DE PROCESAMIENTO DE TRANSACCIONES A GRAN ESCALA Y ANÁLISIS EN TIEMPO REAL
6.2 RESTRICCIONES
6.2.1 INTENSA COMPETENCIA DE LAS PLATAFORMAS BASADAS EN LA NUBE
6.2.2 ALTOS COSTOS ASOCIADOS CON LA INSTALACIÓN DEL MAINFRAME
6.3 OPORTUNIDADES
6.3.1 ENFOQUE CRECIENTE EN LA MODERNIZACIÓN DEL MAINFRAME
6.3.2 AMPLIACIÓN DE LA ADOPCIÓN DE SOLUCIONES DE NUBE HÍBRIDA
6.3.3 CRECIENTE DEMANDA DE SOLUCIONES DE SEGURIDAD AVANZADAS
6.4 DESAFÍOS
6.4.1 GARANTIZAR LA SEGURIDAD Y EL CUMPLIMIENTO EN ECOSISTEMAS HÍBRIDOS DINÁMICOS E INTERCONECTADOS EN MEDIO DE LAS REGULACIONES EN EVOLUCIÓN DE ASIA-PACÍFICO
6.4.2 ESCASEZ DE PROFESIONALES CALIFICADOS EN MAINFRAME
7 MERCADO DE MAINFRAME DE ASIA-PACÍFICO, POR SISTEMAS
7.1 INFORMACIÓN GENERAL
7.2 MAINFRAME
7.3 SISTEMAS DE RANGO MEDIO
8 MERCADO DE MAINFRAME DE ASIA-PACÍFICO, POR COMPONENTE
8.1 DESCRIPCIÓN GENERAL
8.2 HARDWARE
8.3 SERVICIOS
8.4 SOFTWARE
9 MERCADO DE MAINFRAME DE ASIA-PACÍFICO, POR TAMAÑO DE LA ORGANIZACIÓN
9.1 INFORMACIÓN GENERAL
9.2 GRANDES EMPRESAS
9.3 PEQUEÑAS Y MEDIANAS EMPRESAS (PYMES)
10 MERCADO DE MAINFRAME DE ASIA-PACÍFICO, POR USO FINAL
10.1 INFORMACIÓN GENERAL
10.2 SERVICIOS FINANCIEROS
10.3 TI Y TELECOMUNICACIONES
10.4 ATENCIÓN SANITARIA
10.5 SECTOR PÚBLICO
10.6 AUTOMOCIÓN Y FABRICACIÓN
10.7 BIENES DE CONSUMO ENVASADOS Y DE VENTA AL POR MENOR (CPG)
10.8 VIAJES, MEDIOS Y ENTRETENIMIENTO
10.9 OTROS
11 MERCADO DE MAINFRAME DE ASIA-PACÍFICO, POR REGIÓN
11.1 ASIA-PACÍFICO
11.1.1 CHINA
11.1.2 JAPÓN
11.1.3 INDIA
11.1.4 COREA DEL SUR
11.1.5 AUSTRALIA
11.1.6 SINGAPUR
11.1.7 MALASIA
11.1.8 TAILANDIA
11.1.9 INDONESIA
11.1.10 FILIPINAS
11.1.11 RESTO DE ASIA-PACÍFICO
12 MERCADO DE MAINFRAME DE ASIA-PACÍFICO: PANORAMA EMPRESARIAL
12.1 ANÁLISIS DE ACCIONES DE LA EMPRESA: ASIA-PACÍFICO
13 ANÁLISIS FODA
14 PERFILES DE EMPRESAS
14.1 IBM CORPORATION
14.1.1 PERFILES DE EMPRESAS
14.1.2 ANÁLISIS DE INGRESOS
14.1.3 ANÁLISIS DE LAS ACCIONES DE LA EMPRESA
14.1.4 PORTAFOLIO DE PRODUCTOS
14.1.5 DESARROLLO RECIENTE/NOTICIAS
14.2 UNISYS
14.2.1 INSTANTÁNEA DE LA EMPRESA
14.2.2 ANÁLISIS DE INGRESOS
14.2.3 ANÁLISIS DE LAS ACCIONES DE LA EMPRESA
14.2.4 PORTAFOLIO DE PRODUCTOS
14.2.5 DESARROLLO RECIENTE
14.3 BMC SOFTWARE, INC.
14.3.1 INSTANTÁNEA DE LA EMPRESA
14.3.2 ANÁLISIS DE LAS ACCIONES DE LA EMPRESA
14.3.3 PORTAFOLIO DE PRODUCTOS
14.3.4 DESARROLLO RECIENTE
14.4 CONOCEDOR
14.4.1 INSTANTÁNEA DE LA EMPRESA
14.4.2 ANÁLISIS DE INGRESOS
14.4.3 ANÁLISIS DE LAS ACCIONES DE LA EMPRESA
14.4.4 PORTAFOLIO DE PRODUCTOS
14.4.5 DESARROLLO RECIENTE/NOTICIAS
14.5 CORPORACIÓN NEC
14.5.1 INSTANTÁNEAS DE LA EMPRESA
14.5.2 ANÁLISIS DE INGRESOS
14.5.3 ANÁLISIS DE LAS ACCIONES DE LA EMPRESA
14.5.4 PORTAFOLIO DE PRODUCTOS
14.5.5 DESARROLLO RECIENTE
14.6 ATOS SE
14.6.1 INSTANTÁNEA DE LA EMPRESA
14.6.2 ANÁLISIS DE INGRESOS
14.6.3 PORTAFOLIO DE PRODUCTOS
14.6.4 DESARROLLO RECIENTE/NOTICIAS
14.7 BROADCOM
14.7.1 PERFILES DE EMPRESAS
14.7.2 ANÁLISIS DE INGRESOS
14.7.3 PORTAFOLIO DE PRODUCTOS
14.7.4 DESARROLLO RECIENTE/NOTICIAS
14.8 DELL INC
14.8.1 INSTANTÁNEA DE LA EMPRESA
14.8.2 ANÁLISIS DE INGRESOS
14.8.3 PORTAFOLIO DE PRODUCTOS
14.8.4 DESARROLLO RECIENTE
14.9 DXC TECHNOLOGY COMPANY
14.9.1 INSTANTÁNEA DE LA EMPRESA
14.9.2 ANÁLISIS DE INGRESOS
14.9.3 PORTAFOLIO DE PRODUCTOS
14.9.4 DESARROLLO RECIENTE/NOTICIAS
14.1 FUJITSU
14.10.1 INSTANTÁNEA DE LA EMPRESA
14.10.2 ANÁLISIS DE INGRESOS
14.10.3 PORTAFOLIO DE PRODUCTOS
14.10.4 DESARROLLO RECIENTE/NOTICIAS
14.11 HCL TECHNOLOGIES LIMITADA
14.11.1 INSTANTÁNEA DE LA EMPRESA
14.11.2 ANÁLISIS DE INGRESOS
14.11.3 PORTAFOLIO DE PRODUCTOS
14.11.4 DESARROLLO RECIENTE/NOTICIAS
14.12 HEWLETT PACKARD DESARROLLO EMPRESARIAL LP
14.12.1 INSTANTÁNEA DE LA EMPRESA
14.12.2 ANÁLISIS DE INGRESOS
14.12.3 PORTAFOLIO DE PRODUCTOS
14.12.4 DESARROLLO RECIENTE/NOTICIAS
14.13 HITACHI VANTARA LLC
14.13.1 INSTANTÁNEA DE LA EMPRESA
14.13.2 PORTAFOLIO DE PRODUCTOS
14.13.3 DESARROLLO RECIENTE/NOTICIAS
14.14 INFOSYS LIMITADA
14.14.1 INSTANTÁNEAS DE LA EMPRESA
14.14.2 ANÁLISIS DE INGRESOS
14.14.3 PORTAFOLIO DE PRODUCTOS
14.14.4 DESARROLLO RECIENTE
14.15 TIEOTOÉVRY
14.15.1 INSTANTÁNEAS DE LA EMPRESA
14.15.2 ANÁLISIS DE INGRESOS
14.15.3 PORTAFOLIO DE PRODUCTOS
14.15.4 DESARROLLO RECIENTE
15 CUESTIONARIO
16 INFORMES RELACIONADOS
Lista de Tablas
TABLA 1 ANÁLISIS COMPARATIVO DE EMPRESAS
CUADRO 2 COBERTURA REGULATORIA
TABLA 3 IMPACTO EN EL TIEMPO DE INACTIVIDAD NO PLANIFICADO Y LA SEGURIDAD
TABLA 4 MERCADO DE MAINFRAME DE ASIA-PACÍFICO, POR SISTEMAS, 2018-2032 (MILLONES DE USD)
TABLA 5 MAINFRAMES DE ASIA-PACÍFICO EN EL MERCADO DE MAINFRAME, POR REGIÓN, 2018-2032 (MILLONES DE USD)
TABLA 6 MAINFRAMES DE ASIA-PACÍFICO EN EL MERCADO DE MAINFRAME, POR TIPO, 2018-2032 (MILLONES DE USD)
TABLA 7 SISTEMAS IBM Z EN EL MERCADO DE MAINFRAME DE ASIA-PACÍFICO, POR TIPO, 2018-2032 (MILLONES DE USD)
TABLA 8 FUJITSU SERIE GS EN EL MERCADO DE MAINFRAME DE ASIA-PACÍFICO, POR TIPO, 2018-2032 (MILLONES DE USD)
TABLA 9 OTROS MAINFRAMES DE ASIA-PACÍFICO EN EL MERCADO DE MAINFRAME, POR TIPO, 2018-2032 (MILLONES DE USD)
TABLA 10 SISTEMAS DE RANGO MEDIO DE ASIA-PACÍFICO EN EL MERCADO DE MAINFRAME, POR REGIÓN, 2018-2032 (MILLONES DE USD)
TABLA 11 MERCADO DE MAINFRAME DE RANGO MEDIO DE ASIA-PACÍFICO, POR TIPO, 2018-2032 (MILLONES DE USD)
TABLA 12 SISTEMAS DE ENERGÍA IBM (AIX, AS/400) EN EL MERCADO DE MAINFRAME DE ASIA-PACÍFICO, POR TIPO, 2018-2032 (MILLONES DE USD)
TABLA 13 SERVIDORES HPE DE ASIA-PACÍFICO EN EL MERCADO DE MAINFRAME, POR TIPO, 2018-2032 (MILLONES DE USD)
TABLA 14 SERVIDORES ORACLE SUN (SOLARIS) DE ASIA-PACÍFICO EN EL MERCADO DE MAINFRAME, POR TIPO, 2018-2032 (MILLONES DE USD)
TABLA 15 MERCADO DE MAINFRAME DE ASIA-PACÍFICO, POR COMPONENTE, 2018-2032 (MILLONES DE USD)
TABLA 16 MERCADO DE HARDWARE DE MAINFRAME DE ASIA-PACÍFICO, POR REGIÓN, 2018-2032 (MILLONES DE USD)
TABLA 17 MERCADO DE HARDWARE DE ASIA-PACÍFICO EN MAINFRAME, POR CATEGORÍA, 2018-2032 (MILLONES DE USD)
TABLA 18 SERVICIOS DE ASIA-PACÍFICO EN EL MERCADO DE MAINFRAME, POR REGIÓN, 2018-2032 (MILLONES DE USD)
TABLA 19 SERVICIOS DE ASIA-PACÍFICO EN EL MERCADO DE MAINFRAME, POR CATEGORÍA, 2018-2032 (MILLONES DE USD)
TABLA 20 MERCADO DE SOFTWARE DE MAINFRAME DE ASIA-PACÍFICO, POR REGIÓN, 2018-2032 (MILLONES DE USD)
TABLA 21 MERCADO DE SOFTWARE DE ASIA-PACÍFICO EN MAINFRAME, POR CATEGORÍA, 2018-2032 (MILLONES DE USD)
TABLA 22 MERCADO DE MAINFRAME DE ASIA-PACÍFICO, POR TAMAÑO DE LA ORGANIZACIÓN, 2018-2032 (MILLONES DE USD)
TABLA 23 GRANDES EMPRESAS DE ASIA-PACÍFICO EN EL MERCADO DE MAINFRAME, POR REGIÓN, 2018-2032 (MILLONES DE USD)
CUADRO 24 PEQUEÑAS Y MEDIANAS EMPRESAS (PYMES) DE ASIA-PACÍFICO EN EL MERCADO DE MAINFRAME, POR REGIÓN, 2018-2032 (MILLONES DE USD)
TABLA 25 MERCADO DE MAINFRAME DE ASIA-PACÍFICO, POR USO FINAL, 2018-2032 (MILLONES DE USD)
TABLA 26 SERVICIOS FINANCIEROS DE ASIA-PACÍFICO EN EL MERCADO DE MAINFRAME, POR REGIÓN, 2018-2032 (MILLONES DE USD)
TABLA 27 SERVICIOS FINANCIEROS DE ASIA-PACÍFICO EN EL MERCADO DE MAINFRAME, POR TIPO, 2018-2032 (MILLONES DE USD)
TABLA 28 BANCA Y MERCADOS DE CAPITALES DE ASIA-PACÍFICO EN EL MERCADO DE MAINFRAME, POR COMPONENTE, 2018-2032 (MILLONES DE USD)
TABLA 29 MERCADO DE SEGUROS EN MAINFRAME DE ASIA-PACÍFICO, POR COMPONENTE, 2018-2032 (MILLONES DE USD)
TABLA 30 PAGOS DE ASIA-PACÍFICO EN EL MERCADO DE MAINFRAME, POR COMPONENTE, 2018-2032 (MILLONES DE USD)
TABLA 31 SERVICIOS FINANCIEROS DE ASIA-PACÍFICO EN EL MERCADO DE MAINFRAME, POR COMPONENTE, 2018-2032 (MILLONES DE USD)
TABLA 32 ASIA-PACÍFICO TI Y TELECOMUNICACIONES EN EL MERCADO DE MAINFRAME, POR REGIÓN, 2018-2032 (MILLONES DE USD)
TABLA 33 ASIA-PACÍFICO TI Y TELECOMUNICACIONES EN EL MERCADO DE MAINFRAME, POR COMPONENTE, 2018-2032 (MILLONES DE USD)
TABLA 34 MERCADO DE ASIA-PACÍFICO DE ATENCIÓN MÉDICA EN MAINFRAME, POR REGIÓN, 2018-2032 (MILLONES DE USD)
TABLA 35 MERCADO DE ASIA-PACÍFICO DE ATENCIÓN MÉDICA EN MAINFRAME, POR COMPONENTE, 2018-2032 (MILLONES DE USD)
TABLA 36 MERCADO DE MAINFRAME DEL SECTOR PÚBLICO DE ASIA-PACÍFICO, POR REGIÓN, 2018-2032 (MILLONES DE USD)
TABLA 37 SECTOR PÚBLICO DE ASIA-PACÍFICO EN EL MERCADO DE MAINFRAME, POR COMPONENTE, 2018-2032 (MILLONES DE USD)
TABLA 38 MERCADO DE AUTOMOCIÓN Y MANUFACTURA DE ASIA-PACÍFICO EN MAINFRAME, POR REGIÓN, 2018-2032 (MILLONES DE USD)
TABLA 39 MERCADO DE AUTOMOCIÓN Y MANUFACTURA DE ASIA-PACÍFICO EN MAINFRAME, POR COMPONENTE, 2018-2032 (MILLONES DE USD)
TABLA 40 VENTAS MINORISTAS Y BIENES DE CONSUMO EMPAQUETADOS (CPG) EN EL MERCADO DE MAINFRAME DE ASIA-PACÍFICO, POR REGIÓN, 2018-2032 (MILLONES DE USD)
TABLA 41 VENTAS MINORISTAS Y BIENES DE CONSUMO EMPAQUETADOS (CPG) EN EL MERCADO DE MAINFRAME DE ASIA-PACÍFICO, POR COMPONENTE, 2018-2032 (MILLONES DE USD)
TABLA 42 MERCADO DE VIAJES, MEDIOS Y ENTRETENIMIENTO EN ASIA-PACÍFICO, POR REGIÓN, 2018-2032 (MILLONES DE USD)
TABLA 43 MERCADO DE VIAJES, MEDIOS Y ENTRETENIMIENTO EN ASIA-PACÍFICO, POR COMPONENTE, 2018-2032 (MILLONES DE USD)
TABLA 44 OTROS MERCADOS DE MAINFRAME DE ASIA-PACÍFICO, POR REGIÓN, 2018-2032 (MILLONES DE USD)
TABLA 45 OTROS PAÍSES DE ASIA-PACÍFICO EN EL MERCADO DE MAINFRAME, POR COMPONENTE, 2018-2032 (MILLONES DE USD)
TABLA 46 MERCADO DE MAINFRAME DE ASIA-PACÍFICO, POR PAÍS, 2018-2032 (MILLONES DE USD)
TABLA 47 MERCADO DE MAINFRAME DE ASIA-PACÍFICO, POR SISTEMAS, 2018-2032 (MILLONES DE USD)
TABLA 48 MAINFRAMES DE ASIA-PACÍFICO EN EL MERCADO DE MAINFRAME, POR TIPO, 2018-2032 (MILLONES DE USD)
TABLA 49 SISTEMAS IBM Z EN EL MERCADO DE MAINFRAME DE ASIA-PACÍFICO, POR TIPO, 2018-2032 (MILLONES DE USD)
TABLA 50 FUJITSU SERIE GS EN EL MERCADO DE MAINFRAME DE ASIA-PACÍFICO, POR TIPO, 2018-2032 (MILLONES DE USD)
TABLA 51 OTROS MAINFRAMES DE ASIA-PACÍFICO EN EL MERCADO DE MAINFRAME, POR TIPO, 2018-2032 (MILLONES DE USD)
TABLA 52 SISTEMAS DE RANGO MEDIO DE ASIA-PACÍFICO EN EL MERCADO DE MAINFRAME, POR TIPO, 2018-2032 (MILLONES DE USD)
TABLA 53 SISTEMAS DE ENERGÍA IBM (AIX, AS/400) EN EL MERCADO DE MAINFRAME DE ASIA-PACÍFICO, POR TIPO, 2018-2032 (MILLONES DE USD)
TABLA 54 SERVIDORES HPE DE ASIA-PACÍFICO EN EL MERCADO DE MAINFRAME, POR TIPO, 2018-2032 (MILLONES DE USD)
TABLA 55 SERVIDORES ORACLE SUN (SOLARIS) DE ASIA-PACÍFICO EN EL MERCADO DE MAINFRAME, POR TIPO, 2018-2032 (MILLONES DE USD)
TABLA 56 MERCADO DE MAINFRAME DE ASIA-PACÍFICO, POR COMPONENTE, 2018-2032 (MILLONES DE USD)
TABLA 57 MERCADO DE HARDWARE DE ASIA-PACÍFICO EN MAINFRAME, POR CATEGORÍA, 2018-2032 (MILLONES DE USD)
TABLA 58 SERVICIOS DE ASIA-PACÍFICO EN EL MERCADO DE MAINFRAME, POR CATEGORÍA, 2018-2032 (MILLONES DE USD)
TABLA 59 MERCADO DE SOFTWARE DE ASIA-PACÍFICO EN MAINFRAME, POR CATEGORÍA, 2018-2032 (MILLONES DE USD)
TABLA 60 MERCADO DE MAINFRAME DE ASIA-PACÍFICO, POR TAMAÑO DE LA ORGANIZACIÓN, 2018-2032 (MILLONES DE USD)
TABLA 61 MERCADO DE MAINFRAME DE ASIA-PACÍFICO, POR USO FINAL, 2018-2032 (MILLONES DE USD)
TABLA 62 SERVICIOS FINANCIEROS DE ASIA-PACÍFICO EN EL MERCADO DE MAINFRAME, POR TIPO, 2018-2032 (MILLONES DE USD)
TABLA 63 BANCA Y MERCADOS DE CAPITALES DE ASIA-PACÍFICO EN EL MERCADO DE MAINFRAME, POR COMPONENTE, 2018-2032 (MILLONES DE USD)
TABLA 64 MERCADO DE SEGUROS EN MAINFRAME DE ASIA-PACÍFICO, POR COMPONENTE, 2018-2032 (MILLONES DE USD)
TABLA 65 PAGOS DE ASIA-PACÍFICO EN EL MERCADO DE MAINFRAME, POR COMPONENTE, 2018-2032 (MILLONES DE USD)
TABLA 66 SERVICIOS FINANCIEROS DE ASIA-PACÍFICO EN EL MERCADO DE MAINFRAME, POR COMPONENTE, 2018-2032 (MILLONES DE USD)
TABLA 67 ASIA-PACÍFICO TI Y TELECOMUNICACIONES EN EL MERCADO DE MAINFRAME, POR COMPONENTE, 2018-2032 (MILLONES DE USD)
TABLA 68 MERCADO DE ASIA-PACÍFICO DE ATENCIÓN MÉDICA EN MAINFRAME, POR COMPONENTE, 2018-2032 (MILLONES DE USD)
TABLA 69 SECTOR PÚBLICO DE ASIA-PACÍFICO EN EL MERCADO DE MAINFRAME, POR COMPONENTE, 2018-2032 (MILLONES DE USD)
TABLA 70 MERCADO DE AUTOMOCIÓN Y MANUFACTURA DE ASIA-PACÍFICO EN MAINFRAME, POR COMPONENTE, 2018-2032 (MILLONES DE USD)
TABLA 71 VENTAS MINORISTAS Y BIENES DE CONSUMO EMPAQUETADOS (CPG) EN EL MERCADO DE MAINFRAME DE ASIA-PACÍFICO, POR COMPONENTE, 2018-2032 (MILLONES DE USD)
TABLA 72 MERCADO DE VIAJES, MEDIOS Y ENTRETENIMIENTO EN MAINFRAME DE ASIA-PACÍFICO, POR COMPONENTE, 2018-2032 (MILLONES DE USD)
TABLA 73 OTROS PAÍSES DE ASIA-PACÍFICO EN EL MERCADO DE MAINFRAME, POR COMPONENTE, 2018-2032 (MILLONES DE USD)
TABLA 74 MERCADO DE MAINFRAME DE CHINA, POR SISTEMAS, 2018-2032 (MILLONES DE USD)
TABLA 75 MAINFRAMES DE CHINA EN EL MERCADO DE MAINFRAME, POR TIPO, 2018-2032 (MILLONES DE USD)
TABLA 76 SISTEMAS IBM Z EN EL MERCADO DE MAINFRAME DE CHINA, POR TIPO, 2018-2032 (MILLONES DE USD)
TABLA 77 FUJITSU SERIE GS DE CHINA EN EL MERCADO DE MAINFRAME, POR TIPO, 2018-2032 (MILLONES DE USD)
TABLA 78 OTROS MAINFRAMES DE CHINA EN EL MERCADO DE MAINFRAME, POR TIPO, 2018-2032 (MILLONES DE USD)
TABLA 79 SISTEMAS DE RANGO MEDIO DE CHINA EN EL MERCADO DE MAINFRAME, POR TIPO, 2018-2032 (MILLONES DE USD)
TABLA 80 SISTEMAS DE ENERGÍA IBM (AIX, AS/400) EN CHINA EN EL MERCADO DE MAINFRAME, POR TIPO, 2018-2032 (MILLONES DE USD)
TABLA 81 SERVIDORES HPE DE CHINA EN EL MERCADO DE MAINFRAME, POR TIPO, 2018-2032 (MILLONES DE USD)
TABLA 82 SERVIDORES ORACLE SUN (SOLARIS) DE CHINA EN EL MERCADO DE MAINFRAME, POR TIPO, 2018-2032 (MILLONES DE USD)
TABLA 83 MERCADO DE MAINFRAME DE CHINA, POR COMPONENTE, 2018-2032 (MILLONES DE USD)
TABLA 84 HARDWARE DE CHINA EN EL MERCADO DE MAINFRAME, POR CATEGORÍA, 2018-2032 (MILLONES DE USD)
TABLA 85 SERVICIOS DE CHINA EN EL MERCADO DE MAINFRAME, POR CATEGORÍA, 2018-2032 (MILLONES DE USD)
TABLA 86 MERCADO DE SOFTWARE DE MAINFRAME DE CHINA, POR CATEGORÍA, 2018-2032 (MILLONES DE USD)
TABLA 87 MERCADO DE MAINFRAME EN CHINA, POR TAMAÑO DE LA ORGANIZACIÓN, 2018-2032 (MILLONES DE USD)
TABLA 88 MERCADO DE MAINFRAME DE CHINA, POR USO FINAL, 2018-2032 (MILLONES DE USD)
TABLA 89 SERVICIOS FINANCIEROS DE CHINA EN EL MERCADO DE MAINFRAME, POR TIPO, 2018-2032 (MILLONES DE USD)
TABLA 90 BANCA Y MERCADOS DE CAPITALES DE CHINA EN EL MERCADO DE MAINFRAME, POR COMPONENTE, 2018-2032 (MILLONES DE USD)
TABLA 91 SEGUROS EN EL MERCADO DE MAINFRAME EN CHINA, POR COMPONENTE, 2018-2032 (MILLONES DE USD)
TABLA 92 PAGOS DE CHINA EN EL MERCADO DE MAINFRAME, POR COMPONENTE, 2018-2032 (MILLONES DE USD)
TABLA 93 SERVICIOS FINANCIEROS DE CHINA EN EL MERCADO DE MAINFRAME, POR COMPONENTE, 2018-2032 (MILLONES DE USD)
TABLA 94 MERCADO DE TI Y TELECOMUNICACIONES EN CHINA, POR COMPONENTE, 2018-2032 (MILLONES DE USD)
TABLA 95 MERCADO DE ATENCIÓN MÉDICA EN MAINFRAME DE CHINA, POR COMPONENTE, 2018-2032 (MILLONES DE USD)
TABLA 96 SECTOR PÚBLICO DE CHINA EN EL MERCADO DE MAINFRAME, POR COMPONENTE, 2018-2032 (MILLONES DE USD)
TABLA 97 MERCADO DE AUTOMOCIÓN Y MANUFACTURA DE CHINA EN MAINFRAME, POR COMPONENTE, 2018-2032 (MILLONES DE USD)
TABLA 98 VENTA MINORISTA Y BIENES DE CONSUMO EMPAQUETADOS (CPG) EN EL MERCADO DE MAINFRAME DE CHINA, POR COMPONENTE, 2018-2032 (MILLONES DE USD)
TABLA 99 MERCADO DE VIAJES, MEDIOS Y ENTRETENIMIENTO EN CHINA, POR COMPONENTE, 2018-2032 (MILLONES DE USD)
TABLA 100 OTROS PARTICIPANTES DE CHINA EN EL MERCADO DE MAINFRAME, POR COMPONENTE, 2018-2032 (MILLONES DE USD)
TABLA 101 MERCADO DE MAINFRAME DE JAPÓN, POR SISTEMAS, 2018-2032 (MILLONES DE USD)
TABLA 102 MAINFRAMES DE JAPÓN EN EL MERCADO DE MAINFRAME, POR TIPO, 2018-2032 (MILLONES DE USD)
TABLA 103 SISTEMAS IBM Z EN EL MERCADO DE MAINFRAME DE JAPÓN, POR TIPO, 2018-2032 (MILLONES DE USD)
TABLA 104 FUJITSU SERIE GS DE JAPÓN EN EL MERCADO DE MAINFRAME, POR TIPO, 2018-2032 (MILLONES DE USD)
TABLA 105 OTROS MAINFRAMES DE JAPÓN EN EL MERCADO DE MAINFRAME, POR TIPO, 2018-2032 (MILLONES DE USD)
TABLA 106 SISTEMAS DE RANGO MEDIO DE JAPÓN EN EL MERCADO DE MAINFRAME, POR TIPO, 2018-2032 (MILLONES DE USD)
TABLA 107 SISTEMAS DE ENERGÍA IBM (AIX, AS/400) EN JAPÓN EN EL MERCADO DE MAINFRAME, POR TIPO, 2018-2032 (MILLONES DE USD)
TABLA 108 SERVIDORES HPE DE JAPÓN EN EL MERCADO DE MAINFRAME, POR TIPO, 2018-2032 (MILLONES DE USD)
TABLA 109 SERVIDORES ORACLE SUN (SOLARIS) DE JAPÓN EN EL MERCADO DE MAINFRAME, POR TIPO, 2018-2032 (MILLONES DE USD)
TABLA 110 MERCADO DE MAINFRAME DE JAPÓN, POR COMPONENTE, 2018-2032 (MILLONES DE USD)
TABLA 111 HARDWARE DE JAPÓN EN EL MERCADO DE MAINFRAME, POR CATEGORÍA, 2018-2032 (MILLONES DE USD)
TABLA 112 SERVICIOS DE JAPÓN EN EL MERCADO DE MAINFRAME, POR CATEGORÍA, 2018-2032 (MILLONES DE USD)
TABLA 113 MERCADO DE SOFTWARE DE MAINFRAME EN JAPÓN, POR CATEGORÍA, 2018-2032 (MILLONES DE USD)
TABLA 114 MERCADO DE MAINFRAME EN JAPÓN, POR TAMAÑO DE LA ORGANIZACIÓN, 2018-2032 (MILLONES DE USD)
TABLA 115 MERCADO DE MAINFRAME EN JAPÓN, POR USO FINAL, 2018-2032 (MILLONES DE USD)
TABLA 116 SERVICIOS FINANCIEROS EN EL MERCADO DE MAINFRAME DE JAPÓN, POR TIPO, 2018-2032 (MILLONES DE USD)
TABLA 117 BANCA Y MERCADOS DE CAPITALES DE JAPÓN EN EL MERCADO DE MAINFRAME, POR COMPONENTE, 2018-2032 (MILLONES DE USD)
TABLA 118 SEGUROS EN EL MERCADO DE MAINFRAME EN JAPÓN, POR COMPONENTE, 2018-2032 (MILLONES DE USD)
TABLA 119 PAGOS DE JAPÓN EN EL MERCADO DE MAINFRAME, POR COMPONENTE, 2018-2032 (MILLONES DE USD)
TABLA 120 SERVICIOS FINANCIEROS EN EL MERCADO DE MAINFRAME DE JAPÓN, POR COMPONENTE, 2018-2032 (MILLONES DE USD)
TABLA 121 MERCADO DE TI Y TELECOMUNICACIONES EN MAINFRAME DE JAPÓN, POR COMPONENTE, 2018-2032 (MILLONES DE USD)
TABLA 122 MERCADO DE ATENCIÓN MÉDICA EN MAINFRAME DE JAPÓN, POR COMPONENTE, 2018-2032 (MILLONES DE USD)
TABLA 123 SECTOR PÚBLICO DE JAPÓN EN EL MERCADO DE MAINFRAME, POR COMPONENTE, 2018-2032 (MILLONES DE USD)
TABLA 124 MERCADO DE AUTOMOCIÓN Y MANUFACTURA DE MAINFRAME EN JAPÓN, POR COMPONENTE, 2018-2032 (MILLONES DE USD)
TABLA 125 VENTA MINORISTA Y BIENES DE CONSUMO EMPAQUETADOS (CPG) EN EL MERCADO DE MAINFRAME DE JAPÓN, POR COMPONENTE, 2018-2032 (MILLONES DE USD)
TABLA 126 MERCADO DE VIAJES, MEDIOS Y ENTRETENIMIENTO EN MAINFRAME EN JAPÓN, POR COMPONENTE, 2018-2032 (MILLONES DE USD)
TABLA 127 JAPÓN OTROS EN EL MERCADO DE MAINFRAME, POR COMPONENTE, 2018-2032 (MILLONES DE USD)
TABLA 128 MERCADO DE MAINFRAME EN INDIA, POR SISTEMAS, 2018-2032 (MILLONES DE USD)
TABLA 129 MAINFRAMES EN EL MERCADO DE MAINFRAME DE INDIA, POR TIPO, 2018-2032 (MILLONES DE USD)
TABLA 130 SISTEMAS IBM Z EN EL MERCADO DE MAINFRAME DE INDIA, POR TIPO, 2018-2032 (MILLONES DE USD)
TABLA 131 FUJITSU SERIE GS EN EL MERCADO DE MAINFRAME DE INDIA, POR TIPO, 2018-2032 (MILLONES DE USD)
TABLA 132 OTROS MAINFRAMES EN EL MERCADO DE MAINFRAME DE INDIA, POR TIPO, 2018-2032 (MILLONES DE USD)
TABLA 133 SISTEMAS DE RANGO MEDIO EN EL MERCADO DE MAINFRAME DE INDIA, POR TIPO, 2018-2032 (MILLONES DE USD)
TABLA 134 SISTEMAS DE ENERGÍA IBM (AIX, AS/400) EN LA INDIA EN EL MERCADO DE MAINFRAME, POR TIPO, 2018-2032 (MILLONES DE USD)
TABLA 135 SERVIDORES HPE EN EL MERCADO DE MAINFRAME DE INDIA, POR TIPO, 2018-2032 (MILLONES DE USD)
TABLA 136 SERVIDORES ORACLE SUN (SOLARIS) EN EL MERCADO DE MAINFRAME DE INDIA, POR TIPO, 2018-2032 (MILLONES DE USD)
TABLA 137 MERCADO DE MAINFRAME EN INDIA, POR COMPONENTE, 2018-2032 (MILLONES DE USD)
TABLA 138 MERCADO DE HARDWARE DE MAINFRAME EN INDIA, POR CATEGORÍA, 2018-2032 (MILLONES DE USD)
TABLA 139 SERVICIOS EN EL MERCADO DE MAINFRAME DE INDIA, POR CATEGORÍA, 2018-2032 (MILLONES DE USD)
TABLA 140 MERCADO DE SOFTWARE DE MAINFRAME EN INDIA, POR CATEGORÍA, 2018-2032 (MILLONES DE USD)
TABLA 141 MERCADO DE MAINFRAME EN INDIA, POR TAMAÑO DE LA ORGANIZACIÓN, 2018-2032 (MILLONES DE USD)
TABLA 142 MERCADO DE MAINFRAME EN INDIA, POR USO FINAL, 2018-2032 (MILLONES DE USD)
TABLA 143 SERVICIOS FINANCIEROS EN EL MERCADO DE MAINFRAME DE INDIA, POR TIPO, 2018-2032 (MILLONES DE USD)
TABLA 144 BANCA Y MERCADOS DE CAPITAL DE INDIA EN EL MERCADO DE MAINFRAME, POR COMPONENTE, 2018-2032 (MILLONES DE USD)
TABLA 145 SEGUROS EN EL MERCADO DE MAINFRAME EN INDIA, POR COMPONENTE, 2018-2032 (MILLONES DE USD)
TABLA 146 PAGOS EN EL MERCADO DE MAINFRAME DE INDIA, POR COMPONENTE, 2018-2032 (MILLONES DE USD)
TABLA 147 SERVICIOS FINANCIEROS EN EL MERCADO DE MAINFRAME DE INDIA, POR COMPONENTE, 2018-2032 (MILLONES DE USD)
TABLA 148 MERCADO DE TI Y TELECOMUNICACIONES EN MAINFRAME DE INDIA, POR COMPONENTE, 2018-2032 (MILLONES DE USD)
TABLA 149 MERCADO DE ATENCIÓN MÉDICA EN MAINFRAME DE INDIA, POR COMPONENTE, 2018-2032 (MILLONES DE USD)
TABLA 150 EL SECTOR PÚBLICO DE LA INDIA EN EL MERCADO DE MAINFRAME, POR COMPONENTE, 2018-2032 (MILLONES DE USD)
TABLA 151 MERCADO DE AUTOMOCIÓN Y MANUFACTURA DE MAINFRAME EN INDIA, POR COMPONENTE, 2018-2032 (MILLONES DE USD)
TABLA 152 VENTA MINORISTA Y DE BIENES DE CONSUMO EMPAQUETADOS (CPG) EN EL MERCADO DE MAINFRAME DE INDIA, POR COMPONENTE, 2018-2032 (MILLONES DE USD)
TABLA 153 MERCADO DE VIAJES, MEDIOS Y ENTRETENIMIENTO EN MAINFRAME DE INDIA, POR COMPONENTE, 2018-2032 (MILLONES DE USD)
TABLA 154 INDIA OTROS EN EL MERCADO DE MAINFRAME, POR COMPONENTE, 2018-2032 (MILLONES DE USD)
TABLA 155 MERCADO DE MAINFRAME DE COREA DEL SUR, POR SISTEMAS, 2018-2032 (MILLONES DE USD)
TABLA 156 MAINFRAMES DE COREA DEL SUR EN EL MERCADO DE MAINFRAME, POR TIPO, 2018-2032 (MILLONES DE USD)
TABLA 157 SISTEMAS IBM Z EN COREA DEL SUR EN EL MERCADO DE MAINFRAME, POR TIPO, 2018-2032 (MILLONES DE USD)
TABLA 158 FUJITSU SERIE GS DE COREA DEL SUR EN EL MERCADO DE MAINFRAME, POR TIPO, 2018-2032 (MILLONES DE USD)
TABLA 159 OTROS MAINFRAMES DE COREA DEL SUR EN EL MERCADO DE MAINFRAME, POR TIPO, 2018-2032 (MILLONES DE USD)
TABLA 160 SISTEMAS DE RANGO MEDIO DE COREA DEL SUR EN EL MERCADO DE MAINFRAME, POR TIPO, 2018-2032 (MILLONES DE USD)
TABLA 161 COREA DEL SUR IBM POWER SYSTEMS (AIX, AS/400) EN EL MERCADO DE MAINFRAME, POR TIPO, 2018-2032 (MILLONES DE USD)
TABLA 162 SERVIDORES HPE DE COREA DEL SUR EN EL MERCADO DE MAINFRAME, POR TIPO, 2018-2032 (MILLONES DE USD)
TABLA 163 SERVIDORES ORACLE SUN (SOLARIS) DE COREA DEL SUR EN EL MERCADO DE MAINFRAME, POR TIPO, 2018-2032 (MILLONES DE USD)
TABLA 164 MERCADO DE MAINFRAME DE COREA DEL SUR, POR COMPONENTE, 2018-2032 (MILLONES DE USD)
TABLA 165 MERCADO DE HARDWARE DE COREA DEL SUR EN MAINFRAME, POR CATEGORÍA, 2018-2032 (MILLONES DE USD)
TABLA 166 SERVICIOS DE COREA DEL SUR EN EL MERCADO DE MAINFRAME, POR CATEGORÍA, 2018-2032 (MILLONES DE USD)
TABLA 167 MERCADO DE SOFTWARE DE COREA DEL SUR EN MAINFRAME, POR CATEGORÍA, 2018-2032 (MILLONES DE USD)
TABLA 168 MERCADO DE MAINFRAME DE COREA DEL SUR, POR TAMAÑO DE LA ORGANIZACIÓN, 2018-2032 (MILLONES DE USD)
TABLA 169 MERCADO DE MAINFRAME DE COREA DEL SUR, POR USO FINAL, 2018-2032 (MILLONES DE USD)
TABLA 170 SERVICIOS FINANCIEROS DE COREA DEL SUR EN EL MERCADO DE MAINFRAME, POR TIPO, 2018-2032 (MILLONES DE USD)
TABLA 171 MERCADOS BANCARIOS Y DE CAPITALES DE COREA DEL SUR EN EL MERCADO DE MAINFRAME, POR COMPONENTE, 2018-2032 (MILLONES DE USD)
TABLA 172 SEGUROS EN EL MERCADO DE MAINFRAME DE COREA DEL SUR, POR COMPONENTE, 2018-2032 (MILLONES DE USD)
TABLA 173 PAGOS DE COREA DEL SUR EN EL MERCADO DE MAINFRAME, POR COMPONENTE, 2018-2032 (MILLONES DE USD)
TABLA 174 SERVICIOS FINANCIEROS DE COREA DEL SUR EN EL MERCADO DE MAINFRAME, POR COMPONENTE, 2018-2032 (MILLONES DE USD)
TABLA 175 MERCADO DE TI Y TELECOMUNICACIONES EN MAINFRAME DE COREA DEL SUR, POR COMPONENTE, 2018-2032 (MILLONES DE USD)
TABLA 176 MERCADO DE ATENCIÓN MÉDICA EN MAINFRAME DE COREA DEL SUR, POR COMPONENTE, 2018-2032 (MILLONES DE USD)
TABLA 177 PARTICIPACIÓN DEL SECTOR PÚBLICO DE COREA DEL SUR EN EL MERCADO DE MAINFRAME, POR COMPONENTE, 2018-2032 (MILLONES DE USD)
TABLA 178 MERCADO DE AUTOMOCIÓN Y MANUFACTURA DE COREA DEL SUR EN MAINFRAME, POR COMPONENTE, 2018-2032 (MILLONES DE USD)
TABLA 179 VENTAS MINORISTAS Y BIENES DE CONSUMO EMPAQUETADOS (CPG) DE COREA DEL SUR EN EL MERCADO DE MAINFRAME, POR COMPONENTE, 2018-2032 (MILLONES DE USD)
TABLA 180 MERCADO DE VIAJES, MEDIOS Y ENTRETENIMIENTO EN MAINFRAME DE COREA DEL SUR, POR COMPONENTE, 2018-2032 (MILLONES DE USD)
TABLA 181 COREA DEL SUR OTROS EN EL MERCADO DE MAINFRAME, POR COMPONENTE, 2018-2032 (MILLONES DE USD)
TABLA 182 MERCADO DE MAINFRAME DE AUSTRALIA, POR SISTEMAS, 2018-2032 (MILLONES DE USD)
TABLA 183 MAINFRAMES DE AUSTRALIA EN EL MERCADO DE MAINFRAME, POR TIPO, 2018-2032 (MILLONES DE USD)
TABLA 184 SISTEMAS IBM Z EN EL MERCADO DE MAINFRAME DE AUSTRALIA, POR TIPO, 2018-2032 (MILLONES DE USD)
TABLA 185 FUJITSU SERIE GS DE AUSTRALIA EN EL MERCADO DE MAINFRAME, POR TIPO, 2018-2032 (MILLONES DE USD)
TABLA 186 OTROS MAINFRAMES DE AUSTRALIA EN EL MERCADO DE MAINFRAME, POR TIPO, 2018-2032 (MILLONES DE USD)
TABLA 187 SISTEMAS DE RANGO MEDIO EN EL MERCADO DE MAINFRAME DE AUSTRALIA, POR TIPO, 2018-2032 (MILLONES DE USD)
TABLA 188 AUSTRALIA IBM POWER SYSTEMS (AIX, AS/400) EN EL MERCADO DE MAINFRAME, POR TIPO, 2018-2032 (MILLONES DE USD)
TABLA 189 SERVIDORES HPE DE AUSTRALIA EN EL MERCADO DE MAINFRAME, POR TIPO, 2018-2032 (MILLONES DE USD)
TABLA 190 SERVIDORES ORACLE SUN (SOLARIS) DE AUSTRALIA EN EL MERCADO DE MAINFRAME, POR TIPO, 2018-2032 (MILLONES DE USD)
TABLA 191 MERCADO DE MAINFRAME DE AUSTRALIA, POR COMPONENTE, 2018-2032 (MILLONES DE USD)
TABLA 192 MERCADO DE HARDWARE DE MAINFRAME DE AUSTRALIA, POR CATEGORÍA, 2018-2032 (MILLONES DE USD)
TABLA 193 MERCADO DE MAINFRAME DE SINGAPUR, POR SISTEMAS, 2018-2032 (MILLONES DE USD)
TABLA 194 MAINFRAMES DE SINGAPUR EN EL MERCADO DE MAINFRAME, POR TIPO, 2018-2032 (MILLONES DE USD)
TABLA 195 SISTEMAS IBM Z DE SINGAPUR EN EL MERCADO DE MAINFRAME, POR TIPO, 2018-2032 (MILLONES DE USD)
TABLA 196 FUJITSU SERIE GS DE SINGAPUR EN EL MERCADO DE MAINFRAME, POR TIPO, 2018-2032 (MILLONES DE USD)
TABLA 197 OTROS MAINFRAMES DE SINGAPUR EN EL MERCADO DE MAINFRAME, POR TIPO, 2018-2032 (MILLONES DE USD)
TABLA 198 SISTEMAS DE RANGO MEDIO DE SINGAPUR EN EL MERCADO DE MAINFRAME, POR TIPO, 2018-2032 (MILLONES DE USD)
TABLA 199 SERVIDORES HPE DE SINGAPUR EN EL MERCADO DE MAINFRAME, POR TIPO, 2018-2032 (MILLONES DE USD)
TABLA 200 SERVIDORES ORACLE SUN (SOLARIS) DE SINGAPUR EN EL MERCADO DE MAINFRAME, POR TIPO, 2018-2032 (MILLONES DE USD)
TABLA 201 MERCADO DE MAINFRAME DE SINGAPUR, POR COMPONENTE, 2018-2032 (MILLONES DE USD)
TABLA 202 MERCADO DE HARDWARE DE MAINFRAME DE SINGAPUR, POR CATEGORÍA, 2018-2032 (MILLONES DE USD)
TABLA 203 SERVICIOS DE SINGAPUR EN EL MERCADO DE MAINFRAME, POR CATEGORÍA, 2018-2032 (MILLONES DE USD)
TABLA 204 MERCADO DE SOFTWARE DE MAINFRAME DE SINGAPUR, POR CATEGORÍA, 2018-2032 (MILLONES DE USD)
TABLA 205 MERCADO DE MAINFRAME DE SINGAPUR, POR TAMAÑO DE LA ORGANIZACIÓN, 2018-2032 (MILLONES DE USD)
TABLA 206 MERCADO DE MAINFRAME DE SINGAPUR, POR USO FINAL, 2018-2032 (MILLONES DE USD)
TABLA 207 SERVICIOS FINANCIEROS DE SINGAPUR EN EL MERCADO DE MAINFRAME, POR TIPO, 2018-2032 (MILLONES DE USD)
TABLA 208 BANCA Y MERCADOS DE CAPITALES DE SINGAPUR EN EL MERCADO DE MAINFRAME, POR COMPONENTE, 2018-2032 (MILLONES DE USD)
TABLA 209 SEGUROS EN EL MERCADO DE MAINFRAME DE SINGAPUR, POR COMPONENTE, 2018-2032 (MILLONES DE USD)
TABLA 210 PAGOS DE SINGAPUR EN EL MERCADO DE MAINFRAME, POR COMPONENTE, 2018-2032 (MILLONES DE USD)
TABLA 211 SERVICIOS FINANCIEROS DE SINGAPUR EN EL MERCADO DE MAINFRAME, POR COMPONENTE, 2018-2032 (MILLONES DE USD)
TABLA 212 MERCADO DE TI Y TELECOMUNICACIONES EN MAINFRAME DE SINGAPUR, POR COMPONENTE, 2018-2032 (MILLONES DE USD)
TABLA 213 MERCADO DE ATENCIÓN MÉDICA EN MAINFRAME DE SINGAPUR, POR COMPONENTE, 2018-2032 (MILLONES DE USD)
TABLA 214 EL SECTOR PÚBLICO DE SINGAPUR EN EL MERCADO DE MAINFRAME, POR COMPONENTE, 2018-2032 (MILLONES DE USD)
TABLA 215 SINGAPUR, MERCADO DE AUTOMOCIÓN Y MANUFACTURA EN MAINFRAME, POR COMPONENTE, 2018-2032 (MILLONES DE USD)
TABLA 216 VENTA MINORISTA Y BIENES DE CONSUMO EMPAQUETADOS (CPG) EN EL MERCADO DE MAINFRAME DE SINGAPUR, POR COMPONENTE, 2018-2032 (MILLONES DE USD)
TABLA 217 MERCADO DE VIAJES, MEDIOS Y ENTRETENIMIENTO EN SINGAPUR EN MAINFRAME, POR COMPONENTE, 2018-2032 (MILLONES DE USD)
TABLA 218 SINGAPUR OTROS EN EL MERCADO DE MAINFRAME, POR COMPONENTE, 2018-2032 (MILLONES DE USD)
TABLA 219 MERCADO DE MAINFRAME DE MALASIA, POR SISTEMAS, 2018-2032 (MILLONES DE USD)
TABLA 220 MAINFRAMES DE MALASIA EN EL MERCADO DE MAINFRAME, POR TIPO, 2018-2032 (MILLONES DE USD)
TABLA 221 SISTEMAS IBM Z DE MALASIA EN EL MERCADO DE MAINFRAME, POR TIPO, 2018-2032 (MILLONES DE USD)
TABLA 222 FUJITSU SERIE GS DE MALASIA EN EL MERCADO DE MAINFRAME, POR TIPO, 2018-2032 (MILLONES DE USD)
TABLA 223 OTROS MAINFRAMES DE MALASIA EN EL MERCADO DE MAINFRAME, POR TIPO, 2018-2032 (MILLONES DE USD)
TABLA 224 SISTEMAS DE RANGO MEDIO DE MALASIA EN EL MERCADO DE MAINFRAME, POR TIPO, 2018-2032 (MILLONES DE USD)
TABLA 225 SISTEMAS DE ENERGÍA IBM (AIX, AS/400) DE MALASIA EN EL MERCADO DE MAINFRAME, POR TIPO, 2018-2032 (MILLONES DE USD)
TABLA 226 SERVIDORES HPE DE MALASIA EN EL MERCADO DE MAINFRAME, POR TIPO, 2018-2032 (MILLONES DE USD)
TABLA 227 SERVIDORES ORACLE SUN (SOLARIS) DE MALASIA EN EL MERCADO DE MAINFRAME, POR TIPO, 2018-2032 (MILLONES DE USD)
TABLA 228 MERCADO DE MAINFRAME DE MALASIA, POR COMPONENTE, 2018-2032 (MILLONES DE USD)
TABLA 229 MERCADO DE HARDWARE DE MAINFRAME DE MALASIA, POR CATEGORÍA, 2018-2032 (MILLONES DE USD)
TABLA 230 SERVICIOS DE MALASIA EN EL MERCADO DE MAINFRAME, POR CATEGORÍA, 2018-2032 (MILLONES DE USD)
TABLA 231 MERCADO DE SOFTWARE DE MAINFRAME DE MALASIA, POR CATEGORÍA, 2018-2032 (MILLONES DE USD)
TABLA 232 MERCADO DE MAINFRAME DE MALASIA, POR TAMAÑO DE LA ORGANIZACIÓN, 2018-2032 (MILLONES DE USD)
TABLA 233 MERCADO DE MAINFRAME DE MALASIA, POR USO FINAL, 2018-2032 (MILLONES DE USD)
TABLA 234 SERVICIOS FINANCIEROS EN EL MERCADO DE MAINFRAME DE MALASIA, POR TIPO, 2018-2032 (MILLONES DE USD)
TABLA 235 BANCA Y MERCADOS DE CAPITALES DE MALASIA EN EL MERCADO DE MAINFRAME, POR COMPONENTE, 2018-2032 (MILLONES DE USD)
TABLA 236 SEGUROS EN EL MERCADO DE MAINFRAME DE MALASIA, POR COMPONENTE, 2018-2032 (MILLONES DE USD)
TABLA 237 PAGOS DE MALASIA EN EL MERCADO DE MAINFRAME, POR COMPONENTE, 2018-2032 (MILLONES DE USD)
TABLA 238 SERVICIOS FINANCIEROS EN EL MERCADO DE MAINFRAME DE MALASIA, POR COMPONENTE, 2018-2032 (MILLONES DE USD)
TABLA 239 MERCADO DE TI Y TELECOMUNICACIONES EN MAINFRAME DE MALASIA, POR COMPONENTE, 2018-2032 (MILLONES DE USD)
TABLA 240 MERCADO DE ATENCIÓN MÉDICA EN MAINFRAME DE MALASIA, POR COMPONENTE, 2018-2032 (MILLONES DE USD)
TABLA 241 MERCADO DE MAINFRAME DEL SECTOR PÚBLICO DE MALASIA, POR COMPONENTE, 2018-2032 (MILLONES DE USD)
TABLA 242 MERCADO DE AUTOMOCIÓN Y MANUFACTURA DE MALASIA EN MAINFRAME, POR COMPONENTE, 2018-2032 (MILLONES DE USD)
TABLA 243 VENTA MINORISTA Y BIENES DE CONSUMO EMPAQUETADOS (CPG) EN EL MERCADO DE MAINFRAME DE MALASIA, POR COMPONENTE, 2018-2032 (MILLONES DE USD)
TABLA 244 MERCADO DE VIAJES, MEDIOS Y ENTRETENIMIENTO EN MAINFRAME DE MALASIA, POR COMPONENTE, 2018-2032 (MILLONES DE USD)
TABLA 245 MALASIA OTROS EN EL MERCADO DE MAINFRAME, POR COMPONENTE, 2018-2032 (MILLONES DE USD)
TABLA 246 MERCADO DE MAINFRAME DE TAILANDIA, POR SISTEMAS, 2018-2032 (MILLONES DE USD)
TABLA 247 MAINFRAMES DE TAILANDIA EN EL MERCADO DE MAINFRAME, POR TIPO, 2018-2032 (MILLONES DE USD)
TABLA 248 SISTEMAS IBM Z EN EL MERCADO DE MAINFRAME DE TAILANDIA, POR TIPO, 2018-2032 (MILLONES DE USD)
TABLA 249 FUJITSU SERIE GS DE TAILANDIA EN EL MERCADO DE MAINFRAME, POR TIPO, 2018-2032 (MILLONES DE USD)
TABLA 250 OTROS MAINFRAMES DE TAILANDIA EN EL MERCADO DE MAINFRAME, POR TIPO, 2018-2032 (MILLONES DE USD)
TABLA 251 SISTEMAS DE RANGO MEDIO DE TAILANDIA EN EL MERCADO DE MAINFRAME, POR TIPO, 2018-2032 (MILLONES DE USD)
TABLA 252 SISTEMAS DE ENERGÍA IBM DE TAILANDIA (AIX, AS/400) EN EL MERCADO DE MAINFRAME, POR TIPO, 2018-2032 (MILLONES DE USD)
TABLA 253 SERVIDORES HPE DE TAILANDIA EN EL MERCADO DE MAINFRAME, POR TIPO, 2018-2032 (MILLONES DE USD)
TABLA 254 SERVIDORES ORACLE SUN (SOLARIS) DE TAILANDIA EN EL MERCADO DE MAINFRAME, POR TIPO, 2018-2032 (MILLONES DE USD)
TABLA 255 MERCADO DE MAINFRAME DE TAILANDIA, POR COMPONENTE, 2018-2032 (MILLONES DE USD)
TABLA 256 HARDWARE DE TAILANDIA EN EL MERCADO DE MAINFRAME, POR CATEGORÍA, 2018-2032 (MILLONES DE USD)
TABLA 257 SERVICIOS DE TAILANDIA EN EL MERCADO DE MAINFRAME, POR CATEGORÍA, 2018-2032 (MILLONES DE USD)
TABLA 258 MERCADO DE SOFTWARE DE MAINFRAME DE TAILANDIA, POR CATEGORÍA, 2018-2032 (MILLONES DE USD)
TABLA 259 MERCADO DE MAINFRAME DE TAILANDIA, POR TAMAÑO DE LA ORGANIZACIÓN, 2018-2032 (MILLONES DE USD)
TABLA 260 MERCADO DE MAINFRAME DE TAILANDIA, POR USO FINAL, 2018-2032 (MILLONES DE USD)
TABLA 261 SERVICIOS FINANCIEROS DE TAILANDIA EN EL MERCADO DE MAINFRAME, POR TIPO, 2018-2032 (MILLONES DE USD)
TABLA 262 BANCA Y MERCADOS DE CAPITALES DE TAILANDIA EN EL MERCADO DE MAINFRAME, POR COMPONENTE, 2018-2032 (MILLONES DE USD)
TABLA 263 SEGUROS EN EL MERCADO DE MAINFRAME DE TAILANDIA, POR COMPONENTE, 2018-2032 (MILLONES DE USD)
TABLA 264 PAGOS DE TAILANDIA EN EL MERCADO DE MAINFRAME, POR COMPONENTE, 2018-2032 (MILLONES DE USD)
TABLA 265 SERVICIOS FINANCIEROS DE TAILANDIA EN EL MERCADO DE MAINFRAME, POR COMPONENTE, 2018-2032 (MILLONES DE USD)
TABLA 266 TI Y TELECOMUNICACIONES EN EL MERCADO DE MAINFRAME DE TAILANDIA, POR COMPONENTE, 2018-2032 (MILLONES DE USD)
TABLA 267 MERCADO DE ATENCIÓN MÉDICA EN MAINFRAME DE TAILANDIA, POR COMPONENTE, 2018-2032 (MILLONES DE USD)
TABLA 268 SECTOR PÚBLICO DE TAILANDIA EN EL MERCADO DE MAINFRAME, POR COMPONENTE, 2018-2032 (MILLONES DE USD)
TABLA 269 MERCADO DE AUTOMOCIÓN Y MANUFACTURA DE TAILANDIA EN MAINFRAME, POR COMPONENTE, 2018-2032 (MILLONES DE USD)
TABLA 270 VENTAS MINORISTAS Y BIENES DE CONSUMO EMPAQUETADOS (CPG) EN EL MERCADO DE MAINFRAME DE TAILANDIA, POR COMPONENTE, 2018-2032 (MILLONES DE USD)
TABLA 271 TAILANDIA OTROS EN EL MERCADO DE MAINFRAME, POR COMPONENTE, 2018-2032 (MILLONES DE USD)
TABLA 272 MERCADO DE MAINFRAME DE INDONESIA, POR SISTEMAS, 2018-2032 (MILLONES DE USD)
TABLA 273 MAINFRAMES DE INDONESIA EN EL MERCADO DE MAINFRAME, POR TIPO, 2018-2032 (MILLONES DE USD)
TABLA 274 SISTEMAS IBM Z EN EL MERCADO DE MAINFRAME DE INDONESIA, POR TIPO, 2018-2032 (MILLONES DE USD)
TABLA 275 FUJITSU SERIE GS EN EL MERCADO DE MAINFRAME DE INDONESIA, POR TIPO, 2018-2032 (MILLONES DE USD)
TABLA 276 OTROS MAINFRAMES DE INDONESIA EN EL MERCADO DE MAINFRAME, POR TIPO, 2018-2032 (MILLONES DE USD)
TABLA 277 SISTEMAS DE RANGO MEDIO EN EL MERCADO DE MAINFRAME DE INDONESIA, POR TIPO, 2018-2032 (MILLONES DE USD)
TABLA 278 SISTEMAS DE ENERGÍA IBM (AIX, AS/400) EN EL MERCADO DE MAINFRAME DE INDONESIA, POR TIPO, 2018-2032 (MILLONES DE USD)
TABLA 279 SERVIDORES HPE DE INDONESIA EN EL MERCADO DE MAINFRAME, POR TIPO, 2018-2032 (MILLONES DE USD)
TABLA 280 SERVIDORES ORACLE SUN (SOLARIS) DE INDONESIA EN EL MERCADO DE MAINFRAME, POR TIPO, 2018-2032 (MILLONES DE USD)
TABLA 281 MERCADO DE MAINFRAME DE INDONESIA, POR COMPONENTE, 2018-2032 (MILLONES DE USD)
TABLA 282 MERCADO DE HARDWARE DE MAINFRAME DE INDONESIA, POR CATEGORÍA, 2018-2032 (MILLONES DE USD)
TABLA 283 SERVICIOS DE INDONESIA EN EL MERCADO DE MAINFRAME, POR CATEGORÍA, 2018-2032 (MILLONES DE USD)
TABLA 284 MERCADO DE SOFTWARE DE MAINFRAME DE INDONESIA, POR CATEGORÍA, 2018-2032 (MILLONES DE USD)
TABLA 285 MERCADO DE MAINFRAME DE INDONESIA, POR TAMAÑO DE LA ORGANIZACIÓN, 2018-2032 (MILLONES DE USD)
TABLA 286 MERCADO DE MAINFRAME DE INDONESIA, POR USO FINAL, 2018-2032 (MILLONES DE USD)
TABLA 287 SERVICIOS FINANCIEROS EN EL MERCADO DE MAINFRAME DE INDONESIA, POR TIPO, 2018-2032 (MILLONES DE USD)
TABLA 288 BANCA Y MERCADOS DE CAPITALES DE INDONESIA EN EL MERCADO DE MAINFRAME, POR COMPONENTE, 2018-2032 (MILLONES DE USD)
TABLA 289 SEGUROS EN EL MERCADO DE MAINFRAME DE INDONESIA, POR COMPONENTE, 2018-2032 (MILLONES DE USD)
TABLA 290 PAGOS DE INDONESIA EN EL MERCADO DE MAINFRAME, POR COMPONENTE, 2018-2032 (MILLONES DE USD)
TABLA 291 SERVICIOS FINANCIEROS EN EL MERCADO DE MAINFRAME DE INDONESIA, POR COMPONENTE, 2018-2032 (MILLONES DE USD)
TABLA 292 INDONESIA TI Y TELECOMUNICACIONES EN EL MERCADO DE MAINFRAME, POR COMPONENTE, 2018-2032 (MILLONES DE USD)
TABLA 293 MERCADO DE ATENCIÓN MÉDICA EN MAINFRAME DE INDONESIA, POR COMPONENTE, 2018-2032 (MILLONES DE USD)
TABLA 294 EL SECTOR PÚBLICO DE INDONESIA EN EL MERCADO DE MAINFRAME, POR COMPONENTE, 2018-2032 (MILLONES DE USD)
TABLA 295 INDONESIA MERCADO DE AUTOMOCIÓN Y MANUFACTURA EN MAINFRAME, POR COMPONENTE, 2018-2032 (MILLONES DE USD)
TABLA 296 VENTA MINORISTA Y BIENES DE CONSUMO EMPAQUETADOS (CPG) EN EL MERCADO DE MAINFRAME DE INDONESIA, POR COMPONENTE, 2018-2032 (MILLONES DE USD)
TABLA 297 MERCADO DE VIAJES, MEDIOS Y ENTRETENIMIENTO EN MAINFRAME DE INDONESIA, POR COMPONENTE, 2018-2032 (MILLONES DE USD)
TABLA 298 INDONESIA OTROS EN EL MERCADO DE MAINFRAME, POR COMPONENTE, 2018-2032 (MILLONES DE USD)
TABLA 299 MERCADO DE MAINFRAME DE FILIPINAS, POR SISTEMAS, 2018-2032 (MILLONES DE USD)
TABLA 300 MAINFRAMES DE FILIPINAS EN EL MERCADO DE MAINFRAME, POR TIPO, 2018-2032 (MILLONES DE USD)
TABLA 301 SISTEMAS IBM Z EN EL MERCADO DE MAINFRAME DE FILIPINAS, POR TIPO, 2018-2032 (MILLONES DE USD)
TABLA 302 FUJITSU SERIE GS EN EL MERCADO DE MAINFRAME DE FILIPINAS, POR TIPO, 2018-2032 (MILLONES DE USD)
TABLA 303 OTROS MAINFRAMES DE FILIPINAS EN EL MERCADO DE MAINFRAME, POR TIPO, 2018-2032 (MILLONES DE USD)
TABLA 304 SISTEMAS DE RANGO MEDIO DE FILIPINAS EN EL MERCADO DE MAINFRAME, POR TIPO, 2018-2032 (MILLONES DE USD)
TABLA 305 SISTEMAS DE ENERGÍA IBM (AIX, AS/400) EN FILIPINAS EN EL MERCADO DE MAINFRAME, POR TIPO, 2018-2032 (MILLONES DE USD)
TABLA 306 SERVIDORES HPE DE FILIPINAS EN EL MERCADO DE MAINFRAME, POR TIPO, 2018-2032 (MILLONES DE USD)
TABLA 307 SERVIDORES ORACLE SUN (SOLARIS) DE FILIPINAS EN EL MERCADO DE MAINFRAME, POR TIPO, 2018-2032 (MILLONES DE USD)
TABLA 308 MERCADO DE MAINFRAME DE FILIPINAS, POR COMPONENTE, 2018-2032 (MILLONES DE USD)
TABLA 309 MERCADO DE HARDWARE DE MAINFRAME DE FILIPINAS, POR CATEGORÍA, 2018-2032 (MILLONES DE USD)
TABLA 310 SERVICIOS DE FILIPINAS EN EL MERCADO DE MAINFRAME, POR CATEGORÍA, 2018-2032 (MILLONES DE USD)
TABLA 311 MERCADO DE SOFTWARE DE MAINFRAME DE FILIPINAS, POR CATEGORÍA, 2018-2032 (MILLONES DE USD)
TABLA 312 MERCADO DE MAINFRAME DE FILIPINAS, POR TAMAÑO DE LA ORGANIZACIÓN, 2018-2032 (MILLONES DE USD)
TABLA 313 MERCADO DE MAINFRAME DE FILIPINAS, POR USO FINAL, 2018-2032 (MILLONES DE USD)
TABLA 314 SERVICIOS FINANCIEROS EN EL MERCADO DE MAINFRAME DE FILIPINAS, POR TIPO, 2018-2032 (MILLONES DE USD)
TABLA 315 BANCA Y MERCADOS DE CAPITALES DE FILIPINAS EN EL MERCADO DE MAINFRAME, POR COMPONENTE, 2018-2032 (MILLONES DE USD)
TABLA 316 SEGUROS EN EL MERCADO DE MAINFRAME DE FILIPINAS, POR COMPONENTE, 2018-2032 (MILLONES DE USD)
TABLA 317 PAGOS DE FILIPINAS EN EL MERCADO DE MAINFRAME, POR COMPONENTE, 2018-2032 (MILLONES DE USD)
TABLA 318 SERVICIOS FINANCIEROS EN EL MERCADO DE MAINFRAME DE FILIPINAS, POR COMPONENTE, 2018-2032 (MILLONES DE USD)
TABLA 319 TI Y TELECOMUNICACIONES EN EL MERCADO DE MAINFRAME DE FILIPINAS, POR COMPONENTE, 2018-2032 (MILLONES DE USD)
TABLA 320 MERCADO DE ATENCIÓN MÉDICA EN MAINFRAME DE FILIPINAS, POR COMPONENTE, 2018-2032 (MILLONES DE USD)
TABLA 321 EL SECTOR PÚBLICO DE FILIPINAS EN EL MERCADO DE MAINFRAME, POR COMPONENTE, 2018-2032 (MILLONES DE USD)
TABLA 322 MERCADO DE AUTOMOCIÓN Y MANUFACTURA DE FILIPINAS EN MAINFRAME, POR COMPONENTE, 2018-2032 (MILLONES DE USD)
TABLA 323 VENTA MINORISTA Y BIENES DE CONSUMO EMPAQUETADOS (CPG) EN EL MERCADO DE MAINFRAME DE FILIPINAS, POR COMPONENTE, 2018-2032 (MILLONES DE USD)
TABLA 324 MERCADO DE VIAJES, MEDIOS Y ENTRETENIMIENTO EN FILIPINAS, POR COMPONENTE, 2018-2032 (MILLONES DE USD)
TABLA 325 OTROS EN EL MERCADO DE MAINFRAME DE FILIPINAS, POR COMPONENTE, 2018-2032 (MILLONES DE USD)
TABLA 326 RESTO DEL MERCADO DE MAINFRAME DE ASIA-PACÍFICO, POR SISTEMAS, 2018-2032 (MILLONES DE USD)
Lista de figuras
FIGURA 1 MERCADO DE MAINFRAME DE ASIA-PACÍFICO
FIGURA 2 MERCADO DE MAINFRAME DE ASIA-PACÍFICO: TRIANGULACIÓN DE DATOS
FIGURA 3 MERCADO DE MAINFRAME DE ASIA-PACÍFICO: ANÁLISIS DE DROC
FIGURA 4 MERCADO DE MAINFRAME DE ASIA-PACÍFICO: ANÁLISIS DEL MERCADO DE ASIA-PACÍFICO VS. REGIONAL
FIGURA 5 MERCADO DE MAINFRAME DE ASIA-PACÍFICO: ANÁLISIS DE INVESTIGACIÓN DE EMPRESAS
FIGURA 6 MERCADO DE MAINFRAME DE ASIA-PACÍFICO: MULTIVARIATE MODELL INC.ING
FIGURA 7 MERCADO DE MAINFRAME DE ASIA-PACÍFICO: DATOS DEMOGRÁFICOS DE LA ENTREVISTA
FIGURA 8 MERCADO DE MAINFRAME DE ASIA-PACÍFICO: CUADRÍCULA DE POSICIÓN DE MERCADO DE DBMR
FIGURA 9 MERCADO DE MAINFRAME DE ASIA-PACÍFICO: ANÁLISIS DE LA PARTICIPACIÓN DE LOS PROVEEDORES
FIGURA 10 CUADRÍCULA DE COBERTURA DE APLICACIONES DEL MERCADO
FIGURA 11 MERCADO DE MAINFRAME DE ASIA-PACÍFICO: SEGMENTACIÓN
FIGURA 12 MERCADO DE MAINFRAME DE ASIA-PACÍFICO: RESUMEN EJECUTIVO
FIGURA 13 DOS SEGMENTOS COMPRENDEN EL MERCADO DE MAINFRAME DE ASIA-PACÍFICO, POR SISTEMAS (2024)
FIGURA 14 DECISIONES ESTRATÉGICAS
FIGURA 15 SE ESPERA QUE LA DIGITALIZACIÓN ACELERADA EN TODAS LAS INDUSTRIAS IMPULSE EL MERCADO DE MAINFRAME DE ASIA-PACÍFICO EN EL PERÍODO PRONOSTICADO DE 2025 A 2032
FIGURA 16 SE ESPERA QUE EL SEGMENTO DE MAINFRAME REPRESENTE LA MAYOR PARTICIPACIÓN DE MERCADO DE MAINFRAME DE ASIA-PACÍFICO EN 2025 Y 2032
FIGURA 17 ANÁLISIS PESTEL
FIGURA 18 LAS CINCO FUERZAS DE PORTER
FIGURA 19 IMPULSORES, RESTRICCIONES, OPORTUNIDADES Y DESAFÍOS DEL MERCADO DE MAINFRAME DE ASIA-PACÍFICO
FIGURA 20 BENEFICIOS DE LA MODERNIZACIÓN DEL MAINFRAME
FIGURA 21 ADOPCIÓN DE DIFERENTES CAMINOS DE MODERNIZACIÓN
FIGURA 22 ADOPCIÓN DE DIFERENTES NUBES EN VARIAS INDUSTRIAS
FIGURA 23 MERCADO DE MAINFRAME DE ASIA-PACÍFICO: POR SISTEMAS, 2024
FIGURA 24 MERCADO DE MAINFRAME DE ASIA-PACÍFICO, POR COMPONENTE, 2024
FIGURA 25 MERCADO DE MAINFRAME DE ASIA-PACÍFICO: POR TAMAÑO DE LA ORGANIZACIÓN, 2024
FIGURA 26 MERCADO DE MAINFRAME DE ASIA-PACÍFICO, POR USO FINAL, 2024
FIGURA 27 MERCADO DE MAINFRAME DE ASIA-PACÍFICO: INSTANTÁNEA (2024)
FIGURA 28 MERCADO DE MAINFRAME DE ASIA-PACÍFICO: PARTICIPACIÓN DE LA EMPRESA 2024 (%)
Metodología de investigación
La recopilación de datos y el análisis del año base se realizan utilizando módulos de recopilación de datos con muestras de gran tamaño. La etapa incluye la obtención de información de mercado o datos relacionados a través de varias fuentes y estrategias. Incluye el examen y la planificación de todos los datos adquiridos del pasado con antelación. Asimismo, abarca el examen de las inconsistencias de información observadas en diferentes fuentes de información. Los datos de mercado se analizan y estiman utilizando modelos estadísticos y coherentes de mercado. Además, el análisis de la participación de mercado y el análisis de tendencias clave son los principales factores de éxito en el informe de mercado. Para obtener más información, solicite una llamada de un analista o envíe su consulta.
La metodología de investigación clave utilizada por el equipo de investigación de DBMR es la triangulación de datos, que implica la extracción de datos, el análisis del impacto de las variables de datos en el mercado y la validación primaria (experto en la industria). Los modelos de datos incluyen cuadrícula de posicionamiento de proveedores, análisis de línea de tiempo de mercado, descripción general y guía del mercado, cuadrícula de posicionamiento de la empresa, análisis de patentes, análisis de precios, análisis de participación de mercado de la empresa, estándares de medición, análisis global versus regional y de participación de proveedores. Para obtener más información sobre la metodología de investigación, envíe una consulta para hablar con nuestros expertos de la industria.
Personalización disponible
Data Bridge Market Research es líder en investigación formativa avanzada. Nos enorgullecemos de brindar servicios a nuestros clientes existentes y nuevos con datos y análisis que coinciden y se adaptan a sus objetivos. El informe se puede personalizar para incluir análisis de tendencias de precios de marcas objetivo, comprensión del mercado de países adicionales (solicite la lista de países), datos de resultados de ensayos clínicos, revisión de literatura, análisis de mercado renovado y base de productos. El análisis de mercado de competidores objetivo se puede analizar desde análisis basados en tecnología hasta estrategias de cartera de mercado. Podemos agregar tantos competidores sobre los que necesite datos en el formato y estilo de datos que esté buscando. Nuestro equipo de analistas también puede proporcionarle datos en archivos de Excel sin procesar, tablas dinámicas (libro de datos) o puede ayudarlo a crear presentaciones a partir de los conjuntos de datos disponibles en el informe.

