Europe Antibody Drug Conjugates Market
Tamaño del mercado en miles de millones de dólares
Tasa de crecimiento anual compuesta (CAGR) :
% 
 USD
2.90 Billion
USD
9.73 Billion
2024
2032
USD
2.90 Billion
USD
9.73 Billion
2024
2032
| 2025 –2032 | |
| USD 2.90 Billion | |
| USD 9.73 Billion | |
| % | |
|
Segmentación del mercado europeo de conjugados de anticuerpos y fármacos (ADC), por producto (Enhertu, Kadcyla, Trodelvy, Polivy, Adcetris, Padcev, Besponsa, Elahere, Zylonta, Mylotarg, Tivdak y otros), componente antigénico (receptor HER2, Trop-2, CD79B, CD30, nectina 4, CD22, CD19, CD33, factores tisulares y otros), componente de anticuerpo (ADC de tercera generación, ADC de segunda generación, ADC de cuarta generación y ADC de primera generación), componente de enlaces (enlazadores escindibles y no escindibles), componente de cargas citotóxicas o cabezas nucleares (agentes que dañan el ADN y agentes disruptores de microtúbulos), tecnología de enlaces (enlazadores peptídicos, enlaces tioéter, enlaces hidrazona y enlaces disulfuro), tecnología de conjugación (Conjugación específica de sitio y conjugación química), indicación (cáncer de mama, cáncer de sangre (leucemia, linfoma), cáncer de pulmón, cáncer ginecológico, cáncer gastrointestinal, cáncer genitourinario y otros), usuario final (hospitales, centros de especialidad, clínicas, centros ambulatorios, atención médica domiciliaria y otros), canal de distribución (licitaciones directas, ventas minoristas y otros): tendencias y pronóstico de la industria hasta 2032
Tamaño del mercado europeo de conjugados de anticuerpos y fármacos (ADC)
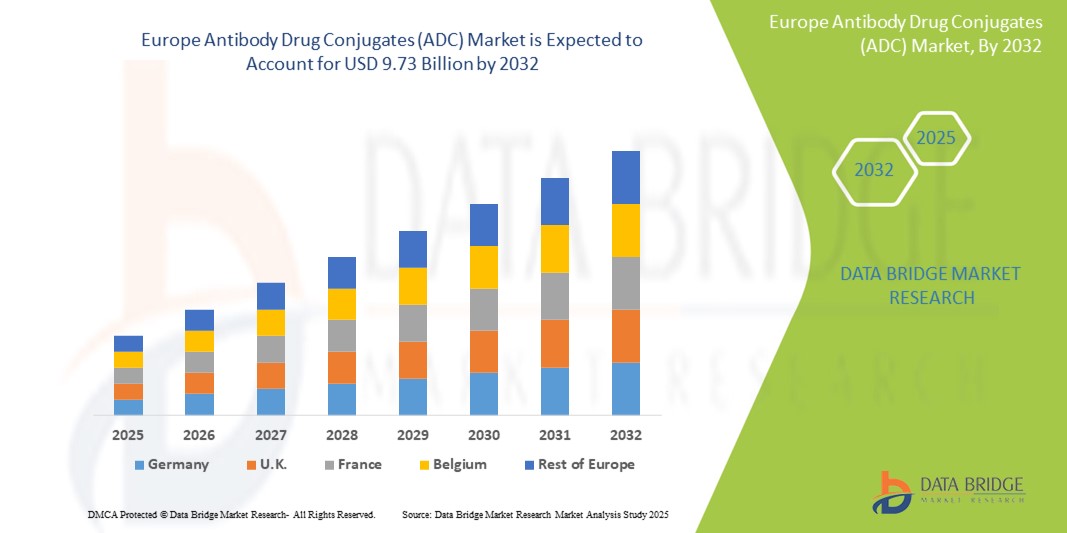
- El tamaño del mercado europeo de conjugados de anticuerpos y fármacos (ADC) se valoró en USD 2.90 mil millones en 2024 y se espera que alcance los USD 9.73 mil millones para 2032 , con una CAGR del 16,30% durante el período de pronóstico.
- El crecimiento del mercado está impulsado en gran medida por la creciente prevalencia del cáncer y la creciente demanda de terapias dirigidas que combinan anticuerpos monoclonales con fármacos citotóxicos, ofreciendo una mayor eficacia con efectos secundarios reducidos.
- Además, la creciente inversión en I+D biofarmacéutica, junto con la expansión de las líneas de productos clínicos y el apoyo regulatorio para los tratamientos oncológicos avanzados, están acelerando el desarrollo y la adopción de los ADC en toda Europa. Estos factores convergentes están posicionando a los ADC como un pilar de la terapia oncológica de nueva generación, impulsando así significativamente el crecimiento del mercado en la región.
Análisis del mercado europeo de conjugados de anticuerpos y fármacos (ADC)
- Los conjugados anticuerpo-fármaco (ADC), que combinan la capacidad de focalización de los anticuerpos monoclonales con la potencia anticancerígena de los fármacos citotóxicos, se están convirtiendo en componentes esenciales del tratamiento oncológico de precisión en Europa debido a su mecanismo dirigido, toxicidad sistémica minimizada y creciente adopción en terapias hematológicas y de tumores sólidos.
- La creciente demanda de ADC se debe principalmente a la creciente carga de cáncer en los países europeos, un cambio hacia la medicina personalizada y una creciente conciencia y aceptación de nuevas terapias biológicas entre los proveedores de atención médica.
- Alemania dominó el mercado de conjugados de anticuerpos y fármacos (ADC) con la mayor participación en los ingresos del 30,4 % en 2024, atribuido a su sólida industria farmacéutica, alto gasto en atención médica y participación activa en ensayos clínicos, con empresas biofarmacéuticas líderes e instituciones de investigación acelerando el desarrollo y la comercialización de ADC.
- Se espera que Francia sea el país de más rápido crecimiento en el mercado de conjugados de anticuerpos y fármacos (ADC) durante el período de pronóstico debido a la expansión de los programas de investigación oncológica, políticas de reembolso favorables y un mayor acceso de los pacientes a terapias innovadoras contra el cáncer.
- El segmento de cáncer de mama lideró el mercado de conjugados de anticuerpos y fármacos (ADC) con una participación de mercado del 39,5 % en 2024, impulsado por la alta prevalencia de la enfermedad y el éxito de los ADC aprobados, como trastuzumab deruxtecan, para abordar los subtipos HER2 positivo y HER2 bajo.
Alcance del informe y segmentación del mercado europeo de conjugados de anticuerpos y fármacos (ADC)
|
Atributos |
Perspectivas clave del mercado europeo de conjugados anticuerpo-fármaco (ADC) |
|
Segmentos cubiertos |
|
|
Países cubiertos |
Europa
|
|
Actores clave del mercado |
|
|
Oportunidades de mercado |
|
|
Conjuntos de información de datos de valor añadido |
Además de los conocimientos sobre escenarios de mercado, como valor de mercado, tasa de crecimiento, segmentación, cobertura geográfica y actores principales, los informes de mercado seleccionados por Data Bridge Market Research también incluyen análisis en profundidad de expertos, análisis de precios, análisis de participación de marca, encuesta de consumidores, análisis demográfico, análisis de la cadena de suministro, análisis de la cadena de valor, descripción general de materias primas/consumibles, criterios de selección de proveedores, análisis PESTLE, análisis de Porter y marco regulatorio. |
Tendencias del mercado europeo de conjugados de anticuerpos y fármacos (ADC)
“ADC de última generación que impulsan la oncología de precisión”
- Una tendencia importante y en aceleración en el mercado europeo de ADC es la aparición de ADC de próxima generación que cuentan con nuevos enlazadores, mecanismos mejorados de administración de carga útil y una especificidad tumoral mejorada, lo que aumenta significativamente su índice terapéutico y su eficacia clínica en el tratamiento del cáncer.
- Por ejemplo, Enhertu (trastuzumab deruxtecan) de AstraZeneca, codesarrollado con Daiichi Sankyo, ha demostrado resultados superiores en cánceres de mama con HER2 positivo y HER2 bajo, lo que marca un cambio de paradigma en la utilidad de los ADC. De igual manera, Elahere de ImmunoGen ha cobrado impulso en los centros oncológicos europeos por su acción dirigida al receptor de folato α en el cáncer de ovario.
- Los avances en la tecnología de ADC permiten ahora el uso de ligadores más estables que liberan citotoxinas únicamente en las células cancerosas diana, lo que reduce los efectos no deseados y la toxicidad. Además, se están adaptando nuevos ADC para cánceres que antes eran difíciles de tratar, como el cáncer de mama triple negativo y ciertas neoplasias hematológicas.
- La creciente disponibilidad de diagnósticos complementarios y biomarcadores respalda aún más la estratificación de los pacientes y el uso optimizado de ADC, creando regímenes de tratamiento del cáncer más personalizados y efectivos.
- Esta tendencia hacia la precisión, la eficacia y la seguridad está redefiniendo el desarrollo de ADC en toda Europa. Grandes compañías farmacéuticas como Roche, GSK y ADC Therapeutics están invirtiendo fuertemente en el perfeccionamiento de las tecnologías de enlace y la ampliación de sus líneas de productos ADC, con el objetivo de ampliar las indicaciones y mejorar la respuesta general al tratamiento.
- A medida que los especialistas en oncología prefieren cada vez más terapias dirigidas y tolerables, la demanda de ADC de última generación está aumentando en los sistemas de salud europeos, lo que impulsa el crecimiento del mercado y está transformando el futuro de la atención del cáncer.
Dinámica del mercado europeo de conjugados de anticuerpos y fármacos (ADC)
Conductor
Aumento de la carga de cáncer junto con avances en terapias dirigidas
- La creciente incidencia del cáncer en los países europeos, junto con el papel cada vez mayor de las terapias dirigidas en oncología, es un factor clave que acelera la demanda de ADC.
- Por ejemplo, en 2024, la Agencia Europea de Medicamentos (EMA) aprobó múltiples ADC para nuevas indicaciones, lo que refleja el compromiso de la región con la aceleración del acceso a productos biológicos innovadores. Países como Alemania, el Reino Unido y Francia lideran la iniciativa con sólidas redes de ensayos clínicos y programas de I+D en oncología.
- Los ADC brindan la precisión de los anticuerpos monoclonales combinados con potentes citotoxinas, lo que permite a los oncólogos atacar las células tumorales sin afectar el tejido sano, lo que ofrece un perfil de seguridad favorable y mejores resultados para los pacientes.
- Los planes nacionales contra el cáncer en Europa apoyan cada vez más la integración de terapias de precisión, como los ADC, en los protocolos oncológicos estándar. El impulso a los tratamientos específicos para cada paciente y la recopilación de evidencia práctica impulsan aún más la adopción de los ADC.
- Además, el creciente número de esfuerzos de colaboración entre el mundo académico y las empresas farmacéuticas está impulsando la investigación clínica y los programas de acceso temprano, mejorando la aceptación en el mercado de nuevos productos ADC.
Restricción/Desafío
“Complejidad de fabricación y altos costes de desarrollo”
- Uno de los principales desafíos que limitan una adopción más amplia de ADC en Europa es el complejo y costoso proceso de fabricación, que requiere infraestructura avanzada, instalaciones especializadas y estrictos controles de calidad para la conjugación y purificación.
- Por ejemplo, la producción de enlaces estables y técnicas de conjugación de sitios específicos exige personal altamente calificado y un bioprocesamiento intensivo en capital, lo que puede restringir la escalabilidad de la producción y limitar la disponibilidad.
- Los obstáculos regulatorios también plantean restricciones significativas, ya que los ADC deben cumplir con pautas rigurosas que abarcan productos biológicos, citotóxicos y productos combinados, lo que a menudo conduce a plazos de desarrollo y procesos de aprobación más largos.
- Además, el alto costo de las terapias con ADC puede sobrecargar los presupuestos de salud, especialmente en países con marcos de reembolso limitados o controles estrictos de precios. Si bien países de Europa Occidental como Alemania y los Países Bajos ofrecen un sólido apoyo al reembolso, otros enfrentan dificultades para obtener financiación para productos biológicos oncológicos de alta calidad.
- Para superar estos obstáculos será necesaria una mayor armonización regulatoria, avances en la fabricación rentable y una inclusión más amplia de los ADC en la cobertura de atención médica pública en los mercados europeos.
Alcance del mercado europeo de conjugados de anticuerpos y fármacos (ADC)
El mercado está segmentado según el producto, el componente antigénico, el componente de anticuerpo, el componente enlazador, las cargas citotóxicas, la tecnología enlazadora, la tecnología de conjugación, la indicación, el usuario final y el canal de distribución.
- Por producto
En cuanto a producto, el mercado europeo de conjugados anticuerpo-fármaco (ADC) se segmenta en Enhertu, Kadcyla, Trodelvy, Polivy, Adcetris, Padcev, Besponsa, Elahere, Zylonta, Mylotarg, Tivdak y otros. El segmento Enhertu dominó el mercado con la mayor cuota de mercado en 2024, gracias a su eficacia demostrada en el tratamiento del cáncer de mama con HER2 positivo y HER2 bajo. Su rápida adopción clínica en los principales centros oncológicos europeos está respaldada por las favorables aprobaciones de la EMA y su rendimiento en condiciones reales.
Se prevé que el segmento Elahere experimente el mayor crecimiento entre 2025 y 2032, impulsado por su uso innovador en el cáncer de ovario con receptor de folato α positivo. Su mecanismo de acción diferenciado y la expansión de su uso clínico en países como Francia e Italia contribuyen a su rápido crecimiento en el mercado.
- Por componente de antígeno
En función del componente antigénico, el mercado europeo de conjugados anticuerpo-fármaco (ADC) se segmenta en receptor HER2, Trop-2, CD79B, CD30, nectina 4, CD22, CD19, CD33, factores tisulares y otros. El segmento del receptor HER2 dominó el mercado con la mayor cuota de mercado en 2024, gracias al éxito de los ADC dirigidos a HER2, como Enhertu y Kadcyla, especialmente en Alemania y el Reino Unido, donde el cáncer de mama HER2-positivo sigue siendo una indicación importante.
Se espera que el segmento Trop-2 sea testigo de la tasa de crecimiento más rápida entre 2025 y 2032, impulsado por el aumento del uso clínico de Trodelvy en cánceres de mama y vejiga metastásicos, con una creciente cobertura de aprobación en las naciones europeas.
- Por componente de anticuerpo
En función del componente de anticuerpo, el mercado europeo de conjugados anticuerpo-fármaco (ADC) se segmenta en ADC de primera generación, ADC de segunda generación, ADC de tercera generación y ADC de cuarta generación. El segmento de ADC de segunda generación obtuvo la mayor cuota de mercado en 2024, gracias a la fiabilidad clínica y el éxito comercial de productos como Kadcyla y Adcetris. Estos ADC ofrecen un perfil equilibrado de eficacia y seguridad.
Se anticipa que el segmento de ADC de cuarta generación crecerá a la CAGR más rápida entre 2025 y 2032, respaldado por un desarrollo innovador en conjugación específica del sitio y mecanismos optimizados de liberación de carga útil, que ofrecen una mejor focalización y una toxicidad reducida.
- Por componente enlazador
Sobre la base del componente enlazador, el mercado europeo de conjugados de anticuerpos y fármacos (ADC) está segmentado en enlazadores escindibles y enlazadores no escindibles. El segmento de enlazadores escindibles dominó el mercado con la mayor participación en ingresos de mercado en 2024, debido a su capacidad de liberación selectiva de carga útil dentro de los microambientes tumorales, mejorando el efecto terapéutico y minimizando la toxicidad fuera del objetivo.
Se proyecta que el segmento de enlaces no escindibles crecerá al ritmo más rápido, especialmente en neoplasias hematológicas, donde el procesamiento intracelular y la estabilidad son fundamentales para la activación del fármaco y la consistencia de la respuesta.
- Por cargas citotóxicas
En función de las cargas citotóxicas o cabezas nucleares, el mercado europeo de conjugados anticuerpo-fármaco (ADC) se segmenta en agentes que dañan el ADN y agentes disruptores de microtúbulos. El segmento de agentes disruptores de microtúbulos registró la mayor cuota de mercado en 2024, ampliamente utilizado en ADC aprobados como Kadcyla y Adcetris, que ofrecen una actividad antitumoral demostrada tanto en tumores hematológicos como sólidos.
Se espera que el segmento de agentes que dañan el ADN experimente el crecimiento más rápido entre 2025 y 2032, debido a la creciente adopción de ADC como Enhertu que utilizan estos potentes agentes para tratar tipos de cáncer agresivos y resistentes.
- Por Linker Technology
Gracias a la tecnología de ligadores, el mercado europeo de conjugados anticuerpo-fármaco (ADC) se segmenta en ligadores peptídicos, ligadores tioéter, ligadores hidrazona y ligadores disulfuro. El segmento de ligadores peptídicos dominó el mercado con la mayor cuota de mercado en 2024, gracias a su capacidad de escisión enzimática y a su capacidad para liberar selectivamente citotoxinas dentro de las células cancerosas, mejorando así la especificidad del tratamiento.
Se proyecta que el segmento de enlaces de disulfuro crecerá al ritmo más rápido durante el período de pronóstico, impulsado por la innovación en sistemas de administración sensibles a redox y una mayor inclusión en nuevas líneas de productos clínicos de ADC dirigidos a tumores sólidos.
- Por tecnología de conjugación
Basándose en la tecnología de conjugación, el mercado europeo de conjugados anticuerpo-fármaco (ADC) se segmenta en conjugación específica de sitio y conjugación química. El segmento de conjugación química obtuvo la mayor cuota de mercado en 2024, gracias a su uso generalizado en ADC de primera generación y a los protocolos de fabricación consolidados.
Se espera que el segmento de conjugación específica del sitio registre la tasa de crecimiento más rápida entre 2025 y 2032, respaldado por la creciente demanda de ADC homogéneos con farmacocinética consistente y efectos fuera del objetivo reducidos.
- Por indicación
Según las indicaciones, el mercado europeo de conjugados anticuerpo-fármaco (ADC) se segmenta en cáncer de mama, cáncer hematológico (leucemia, linfoma), cáncer de pulmón, cáncer ginecológico, cáncer gastrointestinal, cáncer genitourinario, entre otros. El segmento de cáncer de mama dominó el mercado con la mayor cuota de mercado, con un 39,5%, en 2024, impulsado por la alta carga de enfermedad en Europa y la amplia adopción de ADC dirigidos a HER2.
Se prevé que el segmento de cáncer ginecológico experimente la tasa de crecimiento más rápida entre 2025 y 2032, impulsada por la expansión de las aprobaciones para Elahere y un mayor enfoque en el tratamiento del cáncer de ovario en Francia, España e Italia.
- Por el usuario final
En función del usuario final, el mercado europeo de conjugados anticuerpo-fármaco (ADC) se segmenta en hospitales, centros especializados, clínicas, centros ambulatorios, atención médica domiciliaria, entre otros. El segmento Hospitales registró la mayor participación en los ingresos del mercado en 2024, gracias a una infraestructura avanzada para el diagnóstico y tratamiento del cáncer, la adquisición centralizada de medicamentos y equipos de atención multidisciplinarios.
Se espera que el segmento de Centros Especializados crezca a la CAGR más rápida entre 2025 y 2032, impulsado por la creciente preferencia por la atención oncológica especializada y la administración optimizada de terapias complejas como los ADC.
- Por canal de distribución
Según el canal de distribución, el mercado europeo de conjugados anticuerpo-fármaco (ADC) se segmenta en licitaciones directas, ventas minoristas y otros. El segmento de Licitaciones Directas dominó el mercado con la mayor cuota de mercado en 2024, especialmente en países con sistemas de salud públicos como Alemania y el Reino Unido, donde la adquisición centralizada garantiza el acceso a productos biológicos de alto costo.
Se prevé que el segmento de ventas minoristas sea testigo de la tasa de crecimiento más rápida entre 2025 y 2032, respaldado por un mayor acceso a terapias ADC para pacientes ambulatorios y la expansión de las farmacias oncológicas en los centros urbanos de Europa.
Análisis regional del mercado europeo de conjugados de anticuerpos y fármacos (ADC)
- Alemania dominó el mercado de conjugados de anticuerpos y fármacos (ADC) con la mayor participación en los ingresos del 30,4 % en 2024, atribuido a su sólida industria farmacéutica, alto gasto en atención médica y participación activa en ensayos clínicos, con empresas biofarmacéuticas líderes e instituciones de investigación acelerando el desarrollo y la comercialización de ADC.
- Los médicos e investigadores en Alemania priorizan la medicina de precisión, con ADC cada vez más integrados en los protocolos de tratamiento del cáncer de mama, de sangre y ginecológico, respaldados por marcos de reembolso favorables y acceso a herramientas de diagnóstico avanzadas.
- Este liderazgo en el mercado se ve reforzado aún más por la participación activa de Alemania en ensayos clínicos, las colaboraciones entre empresas de biotecnología e instituciones académicas y la eficiencia regulatoria, posicionando al país a la vanguardia de la innovación y comercialización de ADC en toda Europa.
Análisis del mercado alemán de conjugados de anticuerpos y fármacos (ADC)
El mercado alemán de conjugados anticuerpo-fármaco (ADC) capturó la mayor cuota de ingresos en Europa en 2024, gracias a su avanzado sistema de salud, su sólida infraestructura oncológica y su activo papel en la investigación clínica. Con una alta tasa de adopción de terapias oncológicas de nueva generación y la presencia de importantes compañías farmacéuticas, Alemania lidera la región tanto en innovación como en acceso al tratamiento. Las alianzas estratégicas entre empresas biotecnológicas e instituciones académicas impulsan aún más la expansión de su cartera de productos.
Perspectivas del mercado de conjugados anticuerpo-fármaco (ADC) en Francia
Se prevé que el mercado francés de conjugados anticuerpo-fármaco (ADC) crezca a una tasa de crecimiento anual compuesta (TCAC) notable durante el período de pronóstico, gracias a una sólida red de atención oncológica e iniciativas gubernamentales en investigación en ciencias de la vida. La creciente adopción de ADC para cánceres ginecológicos y de mama, junto con sólidos mecanismos de reembolso y programas de acceso temprano al mercado, está contribuyendo a este crecimiento. El compromiso de Francia con la oncología de precisión está impulsando el desarrollo clínico y la agilización de las aprobaciones.
Perspectivas del mercado de conjugados de anticuerpos y fármacos (ADC) en el Reino Unido
Se prevé una expansión sostenida del mercado británico de conjugados anticuerpo-fármaco (ADC), impulsado por la creciente demanda de terapias innovadoras contra el cáncer y la priorización de los fármacos biológicos específicos en el Servicio Nacional de Salud (NHS). La alta prevalencia del cáncer, especialmente de mama y hematológico, está impulsando la adopción de los ADC aprobados por la EMA. Además, el dinámico sector biofarmacéutico del Reino Unido y su participación en ensayos clínicos multinacionales están contribuyendo a fortalecer su posición en el mercado de los ADC.
Análisis del mercado italiano de conjugados de anticuerpos y fármacos (ADC)
El mercado italiano de conjugados anticuerpo-fármaco (ADC) está experimentando un creciente interés, impulsado por el aumento de casos de cáncer y el enfoque nacional en mejorar las vías de atención oncológica. La disponibilidad de fármacos oncológicos de vanguardia en centros de tratamiento hospitalarios, sumada a la creciente concienciación entre los oncólogos sobre los beneficios de los ADC, está impulsando su adopción. Italia también está invirtiendo en ensayos clínicos y en la armonización regulatoria para apoyar tratamientos oncológicos innovadores.
Cuota de mercado de conjugados de anticuerpos y fármacos (ADC) en Europa
La industria europea de conjugados de anticuerpos y fármacos (ADC) está liderada principalmente por empresas bien establecidas, entre las que se incluyen:
- AstraZeneca (Reino Unido)
- F. Hoffmann-La Roche Ltd. (Suiza)
- BioNTech SE (Alemania)
- ADC Therapeutics SA (Suiza)
- GSK plc (Reino Unido)
- Mablink Bioscience SAS (Francia)
- Synaffix BV (Países Bajos)
- Seagen Inc. (EE. UU.)
- Daiichi Sankyo Company, Limited (Japón)
- Pfizer Inc. (EE. UU.)
- Gilead Sciences, Inc. (EE. UU.)
- AbbVie Inc. (EE. UU.)
- Amgen Inc. (EE. UU.)
- ImmunoGen, Inc. (EE. UU.)
- Takeda Pharmaceutical Company Limited (Japón)
- Laboratorios Pierre Fabre (Francia)
- Philogen SpA (Italia)
- Sobi (Suecia)
- Sartorius AG (Alemania)
- Bayer AG (Alemania)
¿Cuáles son los últimos avances en el mercado global de conjugados de anticuerpos y fármacos (ADC) en Europa?
- En mayo de 2024, AstraZeneca y Daiichi Sankyo anunciaron la expansión de su red europea de ensayos clínicos para Enhertu (trastuzumab deruxtecan), dirigido a pacientes con cáncer de mama con HER2 bajo y cáncer de pulmón de células no pequeñas. Este avance subraya el compromiso de las compañías con el avance de la investigación sobre ADC en países clave de la UE, como Alemania, Francia y España, a la vez que amplía el acceso de los pacientes a terapias dirigidas de nueva generación en la región.
- En abril de 2024, ADC Therapeutics SA, con sede en Suiza, se asoció con instituciones italianas de investigación oncológica para iniciar ensayos de fase II de su novedoso ADC dirigido a CD25 en linfoma de Hodgkin recidivante. Esta colaboración refleja un creciente énfasis en ensayos oncológicos específicos de cada región y refuerza el papel de las redes clínicas europeas en la aceleración de la innovación en ADC.
- En marzo de 2024, la Agencia Europea de Medicamentos (EMA) otorgó la autorización de evaluación acelerada a Elahere (mirvetuximab soravtansina) de ImmunoGen para el tratamiento del cáncer de ovario resistente al platino. Este hito pone de manifiesto el creciente apoyo de la EMA a las terapias innovadoras con ADC y se espera que agilice la revisión regulatoria y su disponibilidad en los Estados miembros de la UE.
- En febrero de 2024, el Instituto Nacional para la Excelencia en la Salud y la Atención (NICE) del Reino Unido emitió un borrador de recomendación favorable para Polivy (polatuzumab vedotina) en terapias combinadas para el linfoma difuso de células B grandes (LDCBG). Esta medida demuestra un fuerte respaldo nacional a la integración de los ADC en los regímenes de tratamiento estándar y a la ampliación del acceso de los pacientes a fármacos biológicos avanzados.
- En enero de 2024, BioNTech SE, con sede en Alemania, anunció su entrada en el sector de los ADC mediante la adquisición estratégica de una empresa de biotecnología europea especializada en tecnologías de conjugación de sitio específico. Esta adquisición busca fortalecer la cartera de productos oncológicos de BioNTech y subraya el creciente interés de los líderes biofarmacéuticos europeos en las plataformas de ADC como área clave para el tratamiento dirigido del cáncer.
SKU-
Obtenga acceso en línea al informe sobre la primera nube de inteligencia de mercado del mundo

- Panel de análisis de datos interactivo
- Panel de análisis de empresas para oportunidades con alto potencial de crecimiento
- Acceso de analista de investigación para personalización y consultas
- Análisis de la competencia con panel interactivo
- Últimas noticias, actualizaciones y análisis de tendencias
- Aproveche el poder del análisis de referencia para un seguimiento integral de la competencia
Tabla de contenido
1 INTRODUCCIÓN
1.1 OBJETIVOS DEL ESTUDIO
1.2 DEFINICIÓN DE MERCADO
1.3 DESCRIPCIÓN GENERAL DEL MERCADO EUROPEO DE CONJUGADOS DE ANTICUERPOS Y FÁRMACOS (ADC)
1.4 MONEDA Y PRECIOS
1.5 LIMITACIONES
1.6 MERCADOS CUBIERTOS
2 SEGMENTACIÓN DEL MERCADO
2.1 MERCADOS CUBIERTOS
2.2 ÁMBITO GEOGRÁFICO
2,3 AÑOS CONSIDERADOS PARA EL ESTUDIO
2.4 MODELO DE VALIDACIÓN DE DATOS TRIPOD DBMR
2.5 ENTREVISTAS PRINCIPALES CON LÍDERES DE OPINIÓN CLAVE
2.6 MODELADO MULTIVARIADO
2.7 CUADRÍCULA DE COBERTURA DE APLICACIONES DEL MERCADO
2.8 CURVA DE VIDA DEL PRODUCTO
2.9 CUADRÍCULA DE POSICIÓN DE MERCADO DBMR
2.1 ANÁLISIS DE LA PARTICIPACIÓN DE LOS PROVEEDORES
2.11 FUENTES SECUNDARIAS
2.12 SUPUESTOS
3 RESUMEN EJECUTIVO
4 INFORMACIÓN PREMIUM
4.1 ANÁLISIS PESTAL
4.2 LAS CINCO FUERZAS DE PORTER
4.3 ANÁLISIS PESTEL
5 ANÁLISIS DE LA ESTRUCTURA DE COSTOS DE LA FABRICACIÓN DE CONJUGADOS ANTICUERPO-FÁRMACO (ADC)
5.1 ANTICUERPOS
5.1.1 DESCRIPCIÓN GENERAL DE LA PRODUCCIÓN DE ANTICUERPOS
5.1.1.1 Interno vs. Subcontratado:
5.1.2 FACTORES DE PRECIO DE LOS ANTICUERPOS
5.2 ENLACES
5.2.1 FUNCIÓN Y TIPOS DE ENLACEDORES
5.2.1.1 Impacto en los costos por tipo de enlazador:
5.3 AGENTES CITOTÓXICOS
5.3.1 CONSIDERACIONES DE COSTOS:
5.3.2 TAMPONES Y DISOLVENTES
5.4 DESGLOSE DE COSTOS POR ETAPA DE FABRICACIÓN
5.4.1 COSTOS DE PREPRODUCCIÓN
5.4.2 PROCESO DE CONJUGACIÓN
5.4.3 PURIFICACIÓN Y FILTRACIÓN
5.4.4 CONTROL DE CALIDAD
5.5 PROYECCIONES DE COSTOS Y TENDENCIAS DE PRECIOS (2024-2030)
5.5.1 FLUCTUACIONES DE COSTOS PROYECTADAS
5.5.2 IMPACTO EN EL COSTO DE LA ESCALABILIDAD
5.6 TENDENCIAS DE PRECIOS DE PROVEEDORES Y POR ÁREA GEOGRÁFICA
5.6.1 VARIACIONES DE COSTOS GEOGRÁFICOS
5.6.2 ANÁLISIS DE PROVEEDORES
5.6.3 CONCLUSIÓN
6 MERCADO EUROPEO DE CONJUGADOS DE ANTICUERPOS Y FÁRMACOS (ADC): REGULACIONES
7 DESCRIPCIÓN GENERAL DEL MERCADO
7.1 CONTROLADORES
7.1.1 AUMENTO DE LA PREVALENCIA DEL CÁNCER
7.1.2 AVANCES EN LA TECNOLOGÍA DE CONJUGADOS ANTICUERPO-FÁRMACO (ADC)
7.1.3 AUMENTO DE LA DEMANDA DE TERAPIAS DIRIGIDAS
7.1.4 AVANCES EN LA INVESTIGACIÓN EN PROTEÓMICA Y GENÓMICA
7.2 RESTRICCIONES
7.2.1 ALTOS COSTOS DE DESARROLLO Y COMPLEJIDADES DE FABRICACIÓN
7.2.2 PROBLEMAS DE SEGURIDAD Y TOXICIDAD DE LOS CONJUGADOS ANTICUERPO-FÁRMACO
7.3 OPORTUNIDADES
7.3.1 CRECIMIENTO DE LA LÍNEA DE PRODUCCIÓN DE CONJUGADOS ANTICUERPO-FÁRMACO (ADCS) EN ONCOLOGÍA
7.3.2 AUMENTO DE LA INVERSIÓN EN LA INVESTIGACIÓN DEL CÁNCER
7.3.3 AUMENTO DE LA COLABORACIÓN CON INSTITUCIONES DE INVESTIGACIÓN PARA CONJUGADOS ANTICUERPO-FÁRMACO
7.4 DESAFÍOS
7.4.1 FRACASOS DE ENSAYOS CLÍNICOS PARA EL DESARROLLO DE CONJUGADOS DE ANTICUERPOS Y FÁRMACOS
7.4.2 ENSAYOS CLÍNICOS DE LARGA DURACIÓN Y FASES DE DESARROLLO
8 MERCADO EUROPEO DE CONJUGADOS DE ANTICUERPOS Y FÁRMACOS (ADC), POR PRODUCTO
8.1 DESCRIPCIÓN GENERAL
8.2 ENHERTU
8.3 KADCYLA
8.4 TRODELVY
8.5 POLÍTICA
8.6 ADCETRIS
8.7 PADCEV
8.8 RESPONSABILIDAD
8.9 ELAHERE
8.1 ZYLONTA
8.11 MYLOTARG
8.12 TIVDAK
8.13 OTROS
9 MERCADO EUROPEO DE CONJUGADOS DE ANTICUERPOS Y FÁRMACOS (ADC), POR COMPONENTE ANTÍGENO
9.1 INFORMACIÓN GENERAL
9.2 RECEPTOR HER2
9.3 TROP-2
9.4 CD79B
9.5 CD30
9.6 NECTINA 4
9.7 CD22
9.8 CD19
9.9 CD33
9.1 FACTORES TISURALES
9.11 OTROS
10 MERCADO EUROPEO DE CONJUGADOS DE ANTICUERPOS Y FÁRMACOS (ADC), POR COMPONENTE DE ANTICUERPO
10.1 INFORMACIÓN GENERAL
10.2 ADCS DE TERCERA GENERACIÓN
10.3 ADCS DE SEGUNDA GENERACIÓN
10.4 ADCS DE CUARTA GENERACIÓN
10.5 ADCS DE PRIMERA GENERACIÓN
11 MERCADO EUROPEO DE CONJUGADOS DE ANTICUERPOS Y FÁRMACOS (ADC), POR COMPONENTE DE ENLACE
11.1 INFORMACIÓN GENERAL
11.2 ENLACES ESCIPTABLES
11.2.1 BASADO EN PÉPTIDOS
11.2.2 SENSIBLE AL ÁCIDO O LÁBIL AL ÁCIDO
11.2.3 DISULFURO SENSIBLE AL GLUTATION
11.3 ENLACES NO ESCIBIBLES
12 MERCADO EUROPEO DE CONJUGADOS DE ANTICUERPOS Y FÁRMACOS (ADC), POR COMPONENTE DE CARGAS CITOTÓXICAS O DE OJIVAS
12.1 DESCRIPCIÓN GENERAL
12.2 AGENTES DAÑINOS DEL ADN
12.2.1 CAMPTOTECINA
12.2.2 CALICEAMICINA
12.2.3 PIRROLOBENZODIAZEPINAS
12.3 AGENTES DISRUPTOROS DE MICROTÚBULOS
12.3.1 AURISTATIN
12.3.2 MAYTANSINOIDES
13 MERCADO EUROPEO DE CONJUGADOS ANTICUERPO-FÁRMACO (ADC), POR TECNOLOGÍA DE ENLACE
13.1 DESCRIPCIÓN GENERAL
13.2 ENLACES PÉPTIDOS
13.3 ENLACES DE TIOÉTER
13.4 ENLACES DE HIDRAZONA
13.5 ENLACES DISULFURO
14 MERCADO EUROPEO DE CONJUGADOS DE ANTICUERPOS Y FÁRMACOS (ADC), POR TECNOLOGÍA DE CONJUGACIÓN
14.1 INFORMACIÓN GENERAL
14.2 CONJUGACIÓN ESPECÍFICA DEL SITIO
14.3 CONJUGACIÓN QUÍMICA
15 MERCADO EUROPEO DE CONJUGADOS DE ANTICUERPOS Y FÁRMACOS (ADC), POR INDICACIÓN
15.1 INFORMACIÓN GENERAL
15.2 CÁNCER DE MAMA
15.3 CÁNCER DE SANGRE (LEUCEMIA, LINFOMA)
15.4 CÁNCER DE PULMÓN
15.5 CÁNCER GINECOLÓGICO
15.6 CÁNCER GASTROINTESTINAL
15.7 CÁNCER GENITOURINARIO
15.8 OTROS
16 MERCADO EUROPEO DE CONJUGADOS DE ANTICUERPOS Y FÁRMACOS (ADC), POR USUARIO FINAL
16.1 DESCRIPCIÓN GENERAL
16.2 HOSPITALES
16.3 CENTRO DE ESPECIALIDADES
16.4 CLÍNICAS
16.5 CENTROS AMBULATORIOS
16.6 ATENCIÓN MÉDICA DOMICILIARIA
16.7 OTROS
17 MERCADO EUROPEO DE CONJUGADOS DE ANTICUERPOS Y FÁRMACOS (ADC), POR CANAL DE DISTRIBUCIÓN
17.1 INFORMACIÓN GENERAL
17.2 LICITACIONES DIRECTAS
17.3 VENTAS AL POR MENOR
17.3.1 FARMACIA HOSPITALARIA
17.3.2 FARMACIA MINORISTA
17.3.3 FARMACIA EN LÍNEA
17.4 OTROS
18 MERCADO EUROPEO DE CONJUGADOS DE ANTICUERPOS Y FÁRMACOS (ADC), POR REGIÓN
18.1 EUROPA
18.1.1 ALEMANIA
18.1.2 Reino Unido
18.1.3 FRANCIA
18.1.4 ITALIA
18.1.5 ESPAÑA
18.1.6 RUSIA
18.1.7 BÉLGICA
18.1.8 PAÍSES BAJOS
18.1.9 SUIZA
18.1.10 AUSTRIA
18.1.11 IRLANDA
18.1.12 POLONIA
18.1.13 NORUEGA
18.1.14 HUNGRÍA
18.1.15 LITUANIA
18.1.16 RESTO DE EUROPA
19 EUROPA CONJUGADOS ANTICUERPO-FÁRMACO (ADC): PANORAMA EMPRESARIAL
19.1 ANÁLISIS DE ACCIONES DE EMPRESAS: EUROPA
20 ANÁLISIS FODA
21 PERFILES DE EMPRESAS
21.1 DAIICHI SANKYO, INC.
21.1.1 INSTANTÁNEA DE LA EMPRESA
21.1.2 ANÁLISIS DE INGRESOS
21.1.3 PORTAFOLIO DE PRODUCTOS
21.1.4 DESARROLLO RECIENTE
21.2 F. HOFFMANN-LA ROCHE LTD
21.2.1 INSTANTÁNEA DE LA EMPRESA
21.2.2 ANÁLISIS DE INGRESOS
21.2.3 PORTAFOLIO DE PRODUCTOS
21.2.4 DESARROLLO RECIENTE
21.3 GILEAD SCIENCES, INC.
21.3.1 INSTANTÁNEA DE LA EMPRESA
21.3.2 INGRESOS
21.3.3 PORTAFOLIO DE PRODUCTOS
21.3.4 DESARROLLO RECIENTE
21.4 ASTELLAS PHARMA INC.
21.4.1 INSTANTÁNEA DE LA EMPRESA
21.4.2 ANÁLISIS DE INGRESOS
21.4.3 PORTAFOLIO DE PRODUCTOS
21.4.4 DESARROLLO RECIENTE
21.5 TAKEDA PHARMACEUTICAL COMPANY LIMITED
21.5.1 INSTANTÁNEA DE LA EMPRESA
21.5.2 ANÁLISIS DE INGRESOS
21.5.3 PORTAFOLIO DE PRODUCTOS
21.5.4 DESARROLLO RECIENTE
21.6 ABBVIE INC.
21.6.1 INSTANTÁNEA DE LA EMPRESA
21.6.2 INGRESOS
21.6.3 PORTAFOLIO DE PRODUCTOS
21.6.4 DESARROLLO RECIENTE
21.7 ADC TERAPÉUTICA SA
21.7.1 6.1 INSTANTÁNEA DE LA EMPRESA
21.7.2 ANÁLISIS DE INGRESOS
21.7.3 PORTAFOLIO DE PRODUCTOS
21.7.4 DESARROLLO RECIENTE
21.8 AMGEN, INC.
21.8.1 INSTANTÁNEA DE LA EMPRESA
21.8.2 ANÁLISIS DE INGRESOS
21.8.3 PORTAFOLIO DE PRODUCTOS
21.8.4 DESARROLLO RECIENTE
21.9 ASTRAZENECA
21.9.1 INSTANTÁNEA DE LA EMPRESA
21.9.2 ANÁLISIS DE INGRESOS
21.9.3 PORTAFOLIO DE PRODUCTOS
21.9.4 DESARROLLO RECIENTE
21.1 BAYER
21.10.1 INSTANTÁNEA DE LA EMPRESA
21.10.2 ANÁLISIS DE INGRESOS
21.10.3 PORTAFOLIO DE PRODUCTOS
21.10.4 DESARROLLO RECIENTE
21.11 BYONDIS
21.11.1 INSTANTÁNEA DE LA EMPRESA
21.11.2 PORTAFOLIO DE PRODUCTOS
21.11.3 DESARROLLO RECIENTE
21.12 EISAI INC
21.12.1 INSTANTÁNEA DE LA EMPRESA
21.12.2 ANÁLISIS DE INGRESOS
21.12.3 PORTAFOLIO DE PRODUCTOS
21.12.4 DESARROLLO RECIENTE
21.13 GSK PLC
21.13.1 INSTANTÁNEA DE LA EMPRESA
21.13.2 ANÁLISIS DE INGRESOS
21.13.3 PORTAFOLIO DE PRODUCTOS
21.13.4 DESARROLLO RECIENTE
21.14 JOHNSON & JOHNSON SERVICES, INC.
21.14.1 INSTANTÁNEA DE LA EMPRESA
21.14.2 ANÁLISIS DE INGRESOS
21.14.3 PORTAFOLIO DE PRODUCTOS
21.14.4 DESARROLLO RECIENTE
21.15 OXFORD BIOTERAPÉUTICA
21.15.1 INSTANTÁNEA DE LA EMPRESA
21.15.2 PORTAFOLIO DE PRODUCTOS
21.15.3 DESARROLLO RECIENTE
21.16 PFIZER INC.
21.16.1 INSTANTÁNEA DE LA EMPRESA
21.16.2 ANÁLISIS DE INGRESOS
21.16.3 PORTAFOLIO DE PRODUCTOS
21.16.4 ACTUALIZACIONES RECIENTES
21.17 REMEGEN
21.17.1 INSTANTÁNEA DE LA EMPRESA
21.17.2 PORTAFOLIO DE PRODUCTOS
21.17.3 ACONTECIMIENTOS RECIENTES
21.18 Sanofi
21.18.1 INSTANTÁNEA DE LA EMPRESA
21.18.2 ANÁLISIS DE INGRESOS
21.18.3 PORTAFOLIO DE PRODUCTOS
21.18.4 DESARROLLO RECIENTE
21.19 SUTRO BIOPHARMA, INC.
21.19.1 INSTANTÁNEA DE LA EMPRESA
21.19.2 ANÁLISIS DE INGRESOS
21.19.3 PORTAFOLIO DE PRODUCTOS
21.19.4 ACTUALIZACIONES RECIENTES
22 CUESTIONARIO
23 INFORMES RELACIONADOS
Lista de Tablas
TABLA 1 CAMBIO DE PRECIOS PROYECTADO (2024-2030)
TABLA 2 MERCADO EUROPEO DE CONJUGADOS DE ANTICUERPOS Y FÁRMACOS (ADC), POR PRODUCTO, 2022-2031 (MILLONES DE USD)
TABLA 3 MERCADO EUROPEO DE CONJUGADOS DE ANTICUERPOS Y FÁRMACOS (ADC), POR PRODUCTO, 2022-2031 (VOLUMEN EN UNIDADES)
TABLA 4. MERCADO EUROPEO DE CONJUGADOS ANTICUERPO-FÁRMACO (ADC), POR REGIÓN, 2022-2031 (MILLONES DE USD)
TABLA 5 MERCADO EUROPEO DE CONJUGADOS DE ANTICUERPO-FÁRMACO (ADC), POR REGIÓN, 2022-2031 (MILLONES DE USD)
TABLA 6 MERCADO EUROPEO DE CONJUGADOS ANTICUERPO-FÁRMACO (ADC), POR REGIÓN, 2022-2031 (MILLONES DE USD)
TABLA 7 POLÍTICA EUROPEA EN EL MERCADO DE CONJUGADOS ANTICUERPO-FÁRMACO (ADC), POR REGIÓN, 2022-2031 (MILLONES DE USD)
TABLA 8 MERCADO EUROPEO DE ADCETRIS EN CONJUGADOS ANTICUERPO-FÁRMACO (ADC), POR REGIÓN, 2022-2031 (MILLONES DE USD)
TABLA 9 PADCEV EN EL MERCADO EUROPEO DE CONJUGADOS ANTICUERPO-FÁRMACO (ADC), POR REGIÓN, 2022-2031 (MILLONES DE USD)
TABLA 10 RESPONSABILIDAD EUROPEA EN EL MERCADO DE CONJUGADOS ANTICUERPO-FÁRMACO (ADC), POR REGIÓN, 2022-2031 (MILLONES DE USD)
TABLA 11. MERCADO EUROPEO DE CONJUGADOS ANTICUERPO-FÁRMACO (ADC), POR REGIÓN, 2022-2031 (MILLONES DE USD)
TABLA 12 MERCADO EUROPEO DE ZYLONTA EN CONJUGADOS DE ANTICUERPO Y FÁRMACO (ADC), POR REGIÓN, 2022-2031 (MILLONES DE USD)
TABLA 13 MERCADO EUROPEO DE CONJUGADOS DE ANTICUERPO-FÁRMACO (ADC), POR REGIÓN, 2022-2031 (MILLONES DE USD)
TABLA 14 MERCADO EUROPEO DE TIVDAK EN CONJUGADOS DE ANTICUERPOS Y FÁRMACOS (ADC), POR REGIÓN, 2022-2031 (MILLONES DE USD)
TABLA 15 OTROS MERCADOS DE CONJUGADOS DE ANTICUERPOS Y FÁRMACOS (ADC) EN EUROPA, POR REGIÓN, 2022-2031 (MILLONES DE USD)
TABLA 16 MERCADO EUROPEO DE CONJUGADOS DE ANTICUERPOS Y FÁRMACOS (ADC), POR COMPONENTE ANTÍGENO, 2022-2031 (MILLONES DE USD)
TABLA 17 MERCADO EUROPEO DE CONJUGADOS DE ANTICUERPOS Y FÁRMACOS (ADC), POR REGIÓN, 2022-2031 (MILLONES DE USD)
TABLA 18 MERCADO EUROPEO DE CONJUGADOS DE ANTICUERPOS Y FÁRMACOS (ADC), POR REGIÓN, 2022-2031 (MILLONES DE USD)
TABLA 19 MERCADO EUROPEO DE CD79B EN CONJUGADOS DE ANTICUERPOS Y FÁRMACOS (ADC), POR REGIÓN, 2022-2031 (MILLONES DE USD)
TABLA 20 MERCADO EUROPEO DE CD30 EN CONJUGADOS DE ANTICUERPOS Y FÁRMACOS (ADC), POR REGIÓN, 2022-2031 (MILLONES DE USD)
TABLA 21 MERCADO EUROPEO DE NECTINA 4 EN CONJUGADOS DE ANTICUERPOS Y FÁRMACOS (ADC), POR REGIÓN, 2022-2031 (MILLONES DE USD)
TABLA 22 MERCADO EUROPEO DE CD22 EN CONJUGADOS DE ANTICUERPOS Y FÁRMACOS (ADC), POR REGIÓN, 2022-2031 (MILLONES DE USD)
TABLA 23 MERCADO EUROPEO DE CD19 EN CONJUGADOS DE ANTICUERPOS Y FÁRMACOS (ADC), POR REGIÓN, 2022-2031 (MILLONES DE USD)
TABLA 24 MERCADO EUROPEO DE CD33 EN CONJUGADOS DE ANTICUERPOS Y FÁRMACOS (ADC), POR REGIÓN, 2022-2031 (MILLONES DE USD)
TABLA 25 FACTORES TIPOS DE TEJIDO EN EL MERCADO EUROPEO DE CONJUGADOS ANTICUERPO-FÁRMACO (ADC), POR REGIÓN, 2022-2031 (MILLONES DE USD)
TABLA 26 OTROS MERCADOS DE CONJUGADOS DE ANTICUERPOS Y FÁRMACOS (ADC) EN EUROPA, POR REGIÓN, 2022-2031 (MILLONES DE USD)
TABLA 27 MERCADO EUROPEO DE CONJUGADOS DE ANTICUERPOS Y FÁRMACOS (ADC), POR COMPONENTE DE ANTICUERPOS, 2022-2031 (MILLONES DE USD)
TABLA 28 MERCADO EUROPEO DE CONJUGADOS ANTICUERPO-FÁRMACO (ADC) DE TERCERA GENERACIÓN, POR REGIÓN, 2022-2031 (MILLONES DE USD)
TABLA 29 MERCADO EUROPEO DE ADCS DE SEGUNDA GENERACIÓN EN CONJUGADOS ANTICUERPO-FÁRMACO (ADC), POR REGIÓN, 2022-2031 (MILLONES DE USD)
TABLA 30 MERCADO EUROPEO DE ADCS DE CUARTA GENERACIÓN EN CONJUGADOS ANTICUERPO-FÁRMACO (ADC), POR REGIÓN, 2022-2031 (MILLONES DE USD)
TABLA 31 MERCADO EUROPEO DE ADCS DE PRIMERA GENERACIÓN EN OFTALMOLOGÍA, POR REGIÓN, 2022-2031 (MILLONES DE USD)
TABLA 32 MERCADO EUROPEO DE CONJUGADOS ANTICUERPO-FÁRMACO (ADC), POR COMPONENTE DE ENLACE, 2022-2031 (MILLONES DE USD)
TABLA 33 MERCADO EUROPEO DE ENLACES ESCIPTABLES EN CONJUGADOS ANTICUERPO-FÁRMACO (ADC), POR REGIÓN, 2022-2031 (MILLONES DE USD)
TABLA 34 MERCADO EUROPEO DE ENLACES ESCIPTABLES EN CONJUGADOS ANTICUERPO-FÁRMACO (ADC), POR COMPONENTE, 2022-2031 (MILLONES DE USD)
TABLA 35 MERCADO EUROPEO DE ENLACES NO ESCIPTABLES EN CONJUGADOS ANTICUERPO-FÁRMACO (ADC), POR REGIÓN, 2022-2031 (MILLONES DE USD)
TABLA 36 MERCADO EUROPEO DE CONJUGADOS DE ANTICUERPOS Y FÁRMACOS (ADC), POR COMPONENTE DE CARGAS U OBJETIVOS CITOTÓXICOS, 2022-2031 (MILLONES DE USD)
TABLA 37 AGENTES DAÑINOS DEL ADN EN EL MERCADO EUROPEO DE CONJUGADOS DE ANTICUERPOS Y FÁRMACOS (ADC), POR REGIÓN, 2022-2031 (MILLONES DE USD)
TABLA 38 MERCADO EUROPEO DE AGENTES DAÑINOS DEL ADN EN CONJUGADOS ANTICUERPO-FÁRMACO (ADC), POR COMPONENTE, 2022-2031 (MILLONES DE USD)
TABLA 39 MERCADO EUROPEO DE AGENTES DISRUPTOROS DE MICROTÚBULOS EN CONJUGADOS ANTICUERPO-FÁRMACO (ADC), POR REGIÓN, 2022-2031 (MILLONES DE USD)
TABLA 40 MERCADO EUROPEO DE AGENTES DISRUPTOROS DE MICROTÚBULOS EN CONJUGADOS ANTICUERPO-FÁRMACO (ADC), POR COMPONENTE, 2022-2031 (MILLONES DE USD)
TABLA 41 MERCADO EUROPEO DE CONJUGADOS ANTICUERPO-FÁRMACO (ADC), POR TECNOLOGÍA DE ENLACE, 2022-2031 (MILLONES DE USD)
TABLA 42 ENLACES PÉPTIDOS EN EL MERCADO EUROPEO DE CONJUGADOS ANTICUERPO-FÁRMACO (ADC), POR REGIÓN, 2022-2031 (MILLONES DE USD)
TABLA 43 MERCADO EUROPEO DE ENLACE DE TIOETERES EN CONJUGADOS ANTICUERPO-FÁRMACO (ADC), POR REGIÓN, 2022-2031 (MILLONES DE USD)
TABLA 44 ENLACES DE HIDRAZONA EN EL MERCADO EUROPEO DE CONJUGADOS ANTICUERPO-FÁRMACO (ADC), POR REGIÓN, 2022-2031 (MILLONES DE USD)
TABLA 45 MERCADO EUROPEO DE ENLACES DE DISULFURO EN CONJUGADOS ANTICUERPO-FÁRMACO (ADC), POR REGIÓN, 2022-2031 (MILLONES DE USD)
TABLA 46 MERCADO EUROPEO DE CONJUGADOS DE ANTICUERPOS Y FÁRMACOS (ADC), POR TECNOLOGÍA DE CONJUGACIÓN, 2022-2031 (MILLONES DE USD)
TABLA 47 MERCADO EUROPEO DE CONJUGACIÓN ESPECÍFICA DE SITIO EN CONJUGADOS ANTICUERPO-FÁRMACO (ADC), POR REGIÓN, 2022-2031 (MILLONES DE USD)
TABLA 48 MERCADO EUROPEO DE CONJUGACIÓN QUÍMICA EN CONJUGADOS ANTICUERPO-FÁRMACO (ADC), POR REGIÓN, 2022-2031 (MILLONES DE USD)
TABLA 49 MERCADO EUROPEO DE CONJUGADOS DE ANTICUERPOS Y FÁRMACOS (ADC), POR INDICACIÓN, 2022-2031 (MILLONES DE USD)
TABLA 50 MERCADO EUROPEO DE CONJUGADOS DE ANTICUERPOS Y FÁRMACOS (ADC) PARA EL CÁNCER DE MAMA, POR REGIÓN, 2022-2031 (MILLONES DE USD)
TABLA 51 MERCADO EUROPEO DE CONJUGADOS DE ANTICUERPOS Y FÁRMACOS (ADC) PARA EL CÁNCER DE SANGRE (LEUCEMIA, LINFOMA), POR REGIÓN, 2022-2031 (MILLONES DE USD)
TABLA 52 MERCADO EUROPEO DE CONJUGADOS DE ANTICUERPOS Y FÁRMACOS (ADC) CONTRA EL CÁNCER DE PULMÓN, POR REGIÓN, 2022-2031 (MILLONES DE USD)
TABLA 53 MERCADO EUROPEO DE CONJUGADOS DE ANTICUERPOS Y FÁRMACOS (ADC) PARA EL CÁNCER GINECOLÓGICO, POR REGIÓN, 2022-2031 (MILLONES DE USD)
TABLA 54 MERCADO EUROPEO DE CONJUGADOS DE ANTICUERPOS Y FÁRMACOS (ADC) PARA EL CÁNCER GASTROINTESTINAL, POR REGIÓN, 2022-2031 (MILLONES DE USD)
TABLA 55 MERCADO EUROPEO DE CONJUGADOS DE ANTICUERPOS Y FÁRMACOS (ADC) PARA EL CÁNCER GENITOURINARIO, POR REGIÓN, 2022-2031 (MILLONES DE USD)
TABLA 56 OTROS MERCADOS DE OFTALMOLOGÍA EN EUROPA, POR REGIÓN, 2022-2031 (MILLONES DE USD)
TABLA 57 MERCADO EUROPEO DE CONJUGADOS ANTICUERPO-FÁRMACO (ADC), POR USUARIO FINAL, 2022-2031 (MILLONES DE USD)
TABLA 58 HOSPITALES EUROPEOS EN EL MERCADO DE CONJUGADOS ANTICUERPO-FÁRMACO (ADC), POR REGIÓN, 2022-2031 (MILLONES DE USD)
TABLA 59 CENTROS ESPECIALIZADOS EN EUROPA EN EL MERCADO DE CONJUGADOS ANTICUERPO-FÁRMACO (ADC), POR REGIÓN, 2022-2031 (MILLONES DE USD)
TABLA 60 CLÍNICAS EUROPEAS EN EL MERCADO DE CONJUGADOS ANTICUERPO-FÁRMACO (ADC), POR REGIÓN, 2022-2031 (MILLONES DE USD)
TABLA 61 CENTROS AMBULATORIOS EUROPEOS EN EL MERCADO DE CONJUGADOS ANTICUERPO-FÁRMACO (ADC), POR REGIÓN, 2022-2031 (MILLONES DE USD)
TABLA 62 MERCADO EUROPEO DE CONJUGADOS ANTICUERPO-FÁRMACO (ADC) DE ATENCIÓN MÉDICA DOMICILIARIA, POR REGIÓN, 2022-2031 (MILLONES DE USD)
TABLA 63 OTROS MERCADOS DE CONJUGADOS ANTICUERPO-FÁRMACO (ADC) EN EUROPA, POR REGIÓN, 2022-2031 (MILLONES DE USD)
TABLA 64 MERCADO EUROPEO DE CONJUGADOS ANTICUERPO-FÁRMACO (ADC), POR CANAL DE DISTRIBUCIÓN, 2022-2031 (MILLONES DE USD)
TABLA 65 LICITACIONES DIRECTAS EN EUROPA EN EL MERCADO DE CONJUGADOS ANTICUERPO-FÁRMACO (ADC), POR REGIÓN, 2022-2031 (MILLONES DE USD)
TABLA 66 VENTAS MINORISTAS EN EUROPA DEL MERCADO DE CONJUGADOS DE ANTICUERPOS Y FÁRMACOS (ADC), POR REGIÓN, 2022-2031 (MILLONES DE USD)
TABLA 67 VENTAS MINORISTAS EN EUROPA EN EL MERCADO DE CONJUGADOS DE ANTICUERPOS Y FÁRMACOS (ADC), POR CANAL DE DISTRIBUCIÓN, 2022-2031 (MILLONES DE USD)
TABLA 68 OTROS MERCADOS DE CONJUGADOS DE ANTICUERPOS Y FÁRMACOS (ADC) EN EUROPA, POR REGIÓN, 2022-2031 (MILLONES DE USD)
TABLA 69 MERCADO EUROPEO DE CONJUGADOS ANTICUERPO-FÁRMACO (ADC), POR PAÍS, 2022-2031 (MILLONES DE USD)
TABLA 70 MERCADO EUROPEO DE CONJUGADOS ANTICUERPO-FÁRMACO (ADC), POR PAÍS, 2022-2031 (MILLONES DE USD)
TABLA 71 MERCADO EUROPEO DE CONJUGADOS DE ANTICUERPOS Y FÁRMACOS (ADC), POR PRODUCTO, 2022-2031 (MILLONES DE USD)
TABLA 72 MERCADO EUROPEO DE CONJUGADOS DE ANTICUERPOS Y FÁRMACOS (ADC), POR PRODUCTO, 2022-2031 (VOLUMEN EN UNIDADES)
TABLA 73 MERCADO EUROPEO DE CONJUGADOS DE ANTICUERPOS Y FÁRMACOS (ADC), POR PRODUCTO, 2022-2031 (ASP)
TABLA 74 MERCADO EUROPEO DE CONJUGADOS DE ANTICUERPOS Y FÁRMACOS (ADC), POR COMPONENTE ANTÍGENO, 2022-2031 (MILLONES DE USD)
TABLA 75 MERCADO EUROPEO DE CONJUGADOS DE ANTICUERPOS Y FÁRMACOS (ADC), POR COMPONENTE DE ANTICUERPO, 2022-2031 (MILLONES DE USD)
TABLA 76 MERCADO EUROPEO DE CONJUGADOS ANTICUERPO-FÁRMACO (ADC), POR COMPONENTE DE ENLACE, 2022-2031 (MILLONES DE USD)
TABLA 77 MERCADO EUROPEO DE ENLACES ESCIPTABLES EN CONJUGADOS ANTICUERPO-FÁRMACO (ADC), POR COMPONENTE, 2022-2031 (MILLONES DE USD)
TABLA 78 MERCADO EUROPEO DE CONJUGADOS DE ANTICUERPOS Y FÁRMACOS (ADC), POR COMPONENTE DE CARGAS U OJIVAS CITOTÓXICAS, 2022-2031 (MILLONES DE USD)
TABLA 79 MERCADO EUROPEO DE AGENTES DAÑINOS DEL ADN EN CONJUGADOS ANTICUERPO-FÁRMACO (ADC), POR COMPONENTE, 2022-2031 (MILLONES DE USD)
TABLA 80 MERCADO EUROPEO DE AGENTES DISRUPTOROS DE MICROTÚBULOS EN CONJUGADOS ANTICUERPO-FÁRMACO (ADC), POR COMPONENTE, 2022-2031 (MILLONES DE USD)
TABLA 81 MERCADO EUROPEO DE CONJUGADOS ANTICUERPO-FÁRMACO (ADC), POR TECNOLOGÍA DE ENLACE, 2022-2031 (MILLONES DE USD)
TABLA 82 MERCADO EUROPEO DE CONJUGADOS DE ANTICUERPOS Y FÁRMACOS (ADC), POR TECNOLOGÍA DE CONJUGACIÓN, 2022-2031 (MILLONES DE USD)
TABLA 83 MERCADO EUROPEO DE CONJUGADOS ANTICUERPO-FÁRMACO (ADC), POR INDICACIÓN, 2022-2031 (MILLONES DE USD)
TABLA 84 MERCADO EUROPEO DE CONJUGADOS DE ANTICUERPOS Y FÁRMACOS (ADC), POR USUARIO FINAL, 2022-2031 (MILLONES DE USD)
TABLA 85 MERCADO EUROPEO DE CONJUGADOS DE ANTICUERPOS Y FÁRMACOS (ADC), POR CANAL DE DISTRIBUCIÓN, 2022-2031 (MILLONES DE USD)
TABLA 86 VENTAS MINORISTAS EN EUROPA EN EL MERCADO DE CONJUGADOS DE ANTICUERPOS Y FÁRMACOS (ADC), POR CANAL DE DISTRIBUCIÓN, 2022-2031 (MILLONES DE USD)
TABLA 87 MERCADO DE CONJUGADOS DE ANTICUERPOS Y FÁRMACOS (ADC) DE ALEMANIA, POR PRODUCTO, 2022-2031 (MILLONES DE USD)
TABLA 88 MERCADO DE CONJUGADOS DE ANTICUERPOS Y FÁRMACOS (ADC) DE ALEMANIA, POR PRODUCTO, 2022-2031 (VOLUMEN EN UNIDADES)
TABLA 89 MERCADO DE CONJUGADOS DE ANTICUERPOS Y FÁRMACOS (ADC) DE ALEMANIA, POR PRODUCTO, 2022-2031 (ASP)
TABLA 90 MERCADO DE CONJUGADOS DE ANTICUERPOS Y FÁRMACOS (ADC) DE ALEMANIA, POR COMPONENTE DE ANTÍGENO, 2022-2031 (MILLONES DE USD)
TABLA 91 MERCADO DE CONJUGADOS DE ANTICUERPOS Y FÁRMACOS (ADC) DE ALEMANIA, POR COMPONENTE DE ANTICUERPO, 2022-2031 (MILLONES DE USD)
TABLA 92 MERCADO DE CONJUGADOS DE ANTICUERPOS Y FÁRMACOS (ADC) DE ALEMANIA, POR COMPONENTE DE ENLACE, 2022-2031 (MILLONES DE USD)
TABLA 93 ENLACES ESCIPTABLES EN EL MERCADO DE CONJUGADOS ANTICUERPO-FÁRMACO (ADC) DE ALEMANIA, POR COMPONENTE, 2022-2031 (MILLONES DE USD)
TABLA 94 MERCADO DE CONJUGADOS DE ANTICUERPOS Y FÁRMACOS (ADC) DE ALEMANIA, POR COMPONENTE DE CARGAS U OJIVAS CITOTÓXICAS, 2022-2031 (MILLONES DE USD)
TABLA 95 AGENTES DAÑINOS DEL ADN EN EL MERCADO DE CONJUGADOS DE ANTICUERPOS Y FÁRMACOS (ADC) DE ALEMANIA, POR COMPONENTE, 2022-2031 (MILLONES DE USD)
TABLA 96 MERCADO DE AGENTES DISRUPTOROS DE MICROTÚBULOS EN CONJUGADOS ANTICUERPO-FÁRMACO (ADC) DE ALEMANIA, POR COMPONENTE, 2022-2031 (MILLONES DE USD)
TABLA 97 MERCADO DE CONJUGADOS DE ANTICUERPOS Y FÁRMACOS (ADC) DE ALEMANIA, POR TECNOLOGÍA DE ENLACE, 2022-2031 (MILLONES DE USD)
TABLA 98 MERCADO DE CONJUGADOS DE ANTICUERPOS Y FÁRMACOS (ADC) DE ALEMANIA, POR TECNOLOGÍA DE CONJUGACIÓN, 2022-2031 (MILLONES DE USD)
TABLA 99 MERCADO DE CONJUGADOS DE ANTICUERPOS Y FÁRMACOS (ADC) DE ALEMANIA, POR INDICACIÓN, 2022-2031 (MILLONES DE USD)
TABLA 100 MERCADO DE CONJUGADOS DE ANTICUERPOS Y FÁRMACOS (ADC) DE ALEMANIA, POR USUARIO FINAL, 2022-2031 (MILLONES DE USD)
TABLA 101 MERCADO DE CONJUGADOS DE ANTICUERPOS Y FÁRMACOS (ADC) DE ALEMANIA, POR CANAL DE DISTRIBUCIÓN, 2022-2031 (MILLONES DE USD)
TABLA 102 VENTAS MINORISTAS EN ALEMANIA EN EL MERCADO DE CONJUGADOS DE ANTICUERPOS Y FÁRMACOS (ADC), POR CANAL DE DISTRIBUCIÓN, 2022-2031 (MILLONES DE USD)
TABLA 103 MERCADO DE CONJUGADOS DE ANTICUERPOS Y FÁRMACOS (ADC) DEL REINO UNIDO, POR PRODUCTO, 2022-2031 (MILLONES DE USD)
TABLA 104 MERCADO DE CONJUGADOS DE ANTICUERPOS Y FÁRMACOS (ADC) DEL REINO UNIDO, POR PRODUCTO, 2022-2031 (VOLUMEN EN UNIDADES)
TABLA 105 MERCADO DE CONJUGADOS DE ANTICUERPOS Y FÁRMACOS (ADC) DEL REINO UNIDO, POR PRODUCTO, 2022-2031 (ASP)
TABLA 106 MERCADO DE CONJUGADOS DE ANTICUERPOS Y FÁRMACOS (ADC) DEL REINO UNIDO, POR COMPONENTE DE ANTÍGENO, 2022-2031 (MILLONES DE USD)
TABLA 107 MERCADO DE CONJUGADOS DE ANTICUERPOS Y FÁRMACOS (ADC) DEL REINO UNIDO, POR COMPONENTE DE ANTICUERPO, 2022-2031 (MILLONES DE USD)
TABLA 108 MERCADO DE CONJUGADOS DE ANTICUERPOS Y FÁRMACOS (ADC) EN EL REINO UNIDO, POR COMPONENTE DE ENLACE, 2022-2031 (MILLONES DE USD)
TABLA 109 ENLACES ESCIPTABLES EN EL MERCADO DE CONJUGADOS ANTICUERPO-FÁRMACO (ADC) DEL REINO UNIDO, POR COMPONENTE, 2022-2031 (MILLONES DE USD)
TABLA 110 MERCADO DE CONJUGADOS DE ANTICUERPOS Y FÁRMACOS (ADC) DEL REINO UNIDO, POR COMPONENTE DE CARGAS U OJIVAS CITOTÓXICAS, 2022-2031 (MILLONES DE USD)
TABLA 111 AGENTES DAÑINOS DEL ADN EN EL MERCADO DE CONJUGADOS DE ANTICUERPOS Y FÁRMACOS (ADC) DEL REINO UNIDO, POR COMPONENTE, 2022-2031 (MILLONES DE USD)
TABLA 112 MERCADO DE AGENTES DISRUPTOROS DE MICROTÚBULOS EN CONJUGADOS DE ANTICUERPOS Y FÁRMACOS (ADC) DEL REINO UNIDO, POR COMPONENTE, 2022-2031 (MILLONES DE USD)
TABLA 113 MERCADO DE CONJUGADOS DE ANTICUERPOS Y FÁRMACOS (ADC) DEL REINO UNIDO, POR TECNOLOGÍA DE ENLACE, 2022-2031 (MILLONES DE USD)
TABLA 114 MERCADO DE CONJUGADOS DE ANTICUERPOS Y FÁRMACOS (ADC) DEL REINO UNIDO, POR TECNOLOGÍA DE CONJUGACIÓN, 2022-2031 (MILLONES DE USD)
TABLA 115 MERCADO DE CONJUGADOS DE ANTICUERPOS Y FÁRMACOS (ADC) DEL REINO UNIDO, POR INDICACIÓN, 2022-2031 (MILLONES DE USD)
TABLA 116 MERCADO DE CONJUGADOS DE ANTICUERPOS Y FÁRMACOS (ADC) DEL REINO UNIDO, POR USUARIO FINAL, 2022-2031 (MILLONES DE USD)
TABLA 117 MERCADO DE CONJUGADOS DE ANTICUERPOS Y FÁRMACOS (ADC) DEL REINO UNIDO, POR CANAL DE DISTRIBUCIÓN, 2022-2031 (MILLONES DE USD)
TABLA 118 VENTAS MINORISTAS EN EL REINO UNIDO EN EL MERCADO DE CONJUGADOS DE ANTICUERPOS Y FÁRMACOS (ADC), POR CANAL DE DISTRIBUCIÓN, 2022-2031 (MILLONES DE USD)
TABLA 119 MERCADO DE CONJUGADOS DE ANTICUERPOS Y FÁRMACOS (ADC) EN FRANCIA, POR PRODUCTO, 2022-2031 (MILLONES DE USD)
TABLA 120 MERCADO DE CONJUGADOS DE ANTICUERPOS Y FÁRMACOS (ADC) EN FRANCIA, POR PRODUCTO, 2022-2031 (VOLUMEN EN UNIDADES)
TABLA 121 MERCADO DE CONJUGADOS DE ANTICUERPOS Y FÁRMACOS (ADC) EN FRANCIA, POR PRODUCTO, 2022-2031 (ASP)
TABLA 122 MERCADO DE CONJUGADOS ANTICUERPO-FÁRMACO (ADC) EN FRANCIA, POR COMPONENTE ANTÍGENO, 2022-2031 (MILLONES DE USD)
TABLA 123 MERCADO DE CONJUGADOS DE ANTICUERPOS Y FÁRMACOS (ADC) EN FRANCIA, POR COMPONENTE DE ANTICUERPOS, 2022-2031 (MILLONES DE USD)
TABLA 124 MERCADO FRANCESO DE CONJUGADOS ANTICUERPO-FÁRMACO (ADC), POR COMPONENTE DE ENLACE, 2022-2031 (MILLONES DE USD)
TABLA 125 ENLACES ESCIPTABLES EN EL MERCADO DE CONJUGADOS ANTICUERPO-FÁRMACO (ADC) EN FRANCIA, POR COMPONENTE, 2022-2031 (MILLONES DE USD)
TABLA 126 MERCADO FRANCESO DE CONJUGADOS ANTICUERPO-FÁRMACO (ADC), POR COMPONENTE DE CARGAS U OJIVAS CITOTÓXICAS, 2022-2031 (MILLONES DE USD)
TABLA 127 AGENTES DAÑINOS DEL ADN EN EL MERCADO DE CONJUGADOS ANTICUERPO-FÁRMACO (ADC) EN FRANCIA, POR COMPONENTE, 2022-2031 (MILLONES DE USD)
TABLA 128 MERCADO FRANCESO DE AGENTES DISRUPTOROS DE MICROTÚBULOS EN CONJUGADOS ANTICUERPO-FÁRMACO (ADC), POR COMPONENTE, 2022-2031 (MILLONES DE USD)
TABLA 129 MERCADO FRANCESO DE CONJUGADOS ANTICUERPO-FÁRMACO (ADC), POR TECNOLOGÍA DE ENLACE, 2022-2031 (MILLONES DE USD)
TABLA 130 MERCADO FRANCESO DE CONJUGADOS DE ANTICUERPOS Y FÁRMACOS (ADC), POR TECNOLOGÍA DE CONJUGACIÓN, 2022-2031 (MILLONES DE USD)
TABLA 131 MERCADO FRANCESO DE CONJUGADOS DE ANTICUERPOS Y FÁRMACOS (ADC), POR INDICACIÓN, 2022-2031 (MILLONES DE USD)
TABLA 132 MERCADO FRANCESO DE CONJUGADOS ANTICUERPO-FÁRMACO (ADC), POR USUARIO FINAL, 2022-2031 (MILLONES DE USD)
TABLA 133 MERCADO FRANCESO DE CONJUGADOS ANTICUERPO-FÁRMACO (ADC), POR CANAL DE DISTRIBUCIÓN, 2022-2031 (MILLONES DE USD)
TABLA 134 VENTAS MINORISTAS EN FRANCIA EN EL MERCADO DE CONJUGADOS DE ANTICUERPOS Y FARMACÉUTICOS (ADC), POR CANAL DE DISTRIBUCIÓN, 2022-2031 (MILLONES DE USD)
TABLA 135 MERCADO DE CONJUGADOS DE ANTICUERPOS Y FÁRMACOS (ADC) DE ITALIA, POR PRODUCTO, 2022-2031 (MILLONES DE USD)
TABLA 136 MERCADO DE CONJUGADOS DE ANTICUERPOS Y FÁRMACOS (ADC) EN ITALIA, POR PRODUCTO, 2022-2031 (VOLUMEN EN UNIDADES)
TABLA 137 MERCADO DE CONJUGADOS DE ANTICUERPOS Y FÁRMACOS (ADC) EN ITALIA, POR PRODUCTO, 2022-2031 (ASP)
TABLA 138 MERCADO DE CONJUGADOS DE ANTICUERPOS Y FÁRMACOS (ADC) EN ITALIA, POR COMPONENTE ANTÍGENO, 2022-2031 (MILLONES DE USD)
TABLA 139 MERCADO DE CONJUGADOS DE ANTICUERPOS Y FÁRMACOS (ADC) EN ITALIA, POR COMPONENTE DE ANTICUERPOS, 2022-2031 (MILLONES DE USD)
TABLA 140 MERCADO DE CONJUGADOS DE ANTICUERPOS Y FÁRMACOS (ADC) EN ITALIA, POR COMPONENTE DE ENLACE, 2022-2031 (MILLONES DE USD)
TABLA 141 ENLACES ESCIPTABLES EN EL MERCADO DE CONJUGADOS ANTICUERPO-FÁRMACO (ADC) DE ITALIA, POR COMPONENTE, 2022-2031 (MILLONES DE USD)
TABLA 142 MERCADO DE CONJUGADOS DE ANTICUERPOS Y FARMACO (ADC) EN ITALIA, POR COMPONENTE DE CARGAS U OJIVAS CITOTÓXICAS, 2022-2031 (MILLONES DE USD)
TABLA 143 AGENTES DAÑINOS DEL ADN EN EL MERCADO DE CONJUGADOS ANTICUERPO-FÁRMACO (ADC) DE ITALIA, POR COMPONENTE, 2022-2031 (MILLONES DE USD)
TABLA 144 MERCADO DE AGENTES DISRUPTOROS DE MICROTÚBULOS EN CONJUGADOS DE ANTICUERPOS Y FÁRMACOS (ADC) EN ITALIA, POR COMPONENTE, 2022-2031 (MILLONES DE USD)
TABLA 145 MERCADO DE CONJUGADOS DE ANTICUERPOS Y FÁRMACOS (ADC) EN ITALIA, POR TECNOLOGÍA DE ENLACE, 2022-2031 (MILLONES DE USD)
TABLA 146 MERCADO DE CONJUGADOS DE ANTICUERPOS Y FÁRMACOS (ADC) EN ITALIA, POR TECNOLOGÍA DE CONJUGACIÓN, 2022-2031 (MILLONES DE USD)
TABLA 147 MERCADO DE CONJUGADOS DE ANTICUERPOS Y FARMACO (ADC) EN ITALIA, POR INDICACIÓN, 2022-2031 (MILLONES DE USD)
TABLA 148 MERCADO DE CONJUGADOS DE ANTICUERPOS Y FÁRMACOS (ADC) EN ITALIA, POR USUARIO FINAL, 2022-2031 (MILLONES DE USD)
TABLA 149 MERCADO DE CONJUGADOS DE ANTICUERPOS Y FÁRMACOS (ADC) EN ITALIA, POR CANAL DE DISTRIBUCIÓN, 2022-2031 (MILLONES DE USD)
TABLA 150 VENTAS MINORISTAS EN ITALIA EN EL MERCADO DE CONJUGADOS DE ANTICUERPOS Y FÁRMACOS (ADC), POR CANAL DE DISTRIBUCIÓN, 2022-2031 (MILLONES DE USD)
TABLA 151 MERCADO ESPAÑOL DE CONJUGADOS ANTICUERPO-FÁRMACO (ADC), POR PRODUCTO, 2022-2031 (MILLONES DE USD)
TABLA 152 MERCADO ESPAÑOL DE CONJUGADOS ANTICUERPO-FÁRMACO (ADC), POR PRODUCTO, 2022-2031 (VOLUMEN EN UNIDADES)
TABLA 153 MERCADO ESPAÑOL DE CONJUGADOS ANTICUERPO-FÁRMACO (ADC), POR PRODUCTO, 2022-2031 (ASP)
TABLA 154 MERCADO ESPAÑOL DE CONJUGADOS ANTICUERPO-FÁRMACO (ADC), POR COMPONENTE ANTÍGENO, 2022-2031 (MILLONES DE USD)
TABLA 155 MERCADO ESPAÑOL DE CONJUGADOS ANTICUERPO-FÁRMACO (ADC), POR COMPONENTE DE ANTICUERPO, 2022-2031 (MILLONES DE USD)
TABLA 156 MERCADO ESPAÑOL DE CONJUGADOS ANTICUERPO-FÁRMACO (ADC), POR COMPONENTE ENLAZADOR, 2022-2031 (MILLONES DE USD)
TABLA 157 MERCADO ESPAÑOL DE ENLACES ESCIPTABLES EN CONJUGADOS ANTICUERPO-FÁRMACO (ADC), POR COMPONENTE, 2022-2031 (MILLONES DE USD)
TABLA 158 MERCADO ESPAÑOL DE CONJUGADOS ANTICUERPO-FÁRMACO (ADC), POR COMPONENTE DE CARGAS U OJIVAS CITOTÓXICAS, 2022-2031 (MILLONES DE USD)
TABLA 159 MERCADO ESPAÑOL DE AGENTES DAÑINOS DEL ADN EN CONJUGADOS ANTICUERPO-FÁRMACO (ADC), POR COMPONENTE, 2022-2031 (MILLONES DE USD)
TABLA 160 MERCADO ESPAÑOL DE AGENTES DISRUPTOROS DE MICROTÚBULOS EN CONJUGADOS ANTICUERPO-FÁRMACO (ADC), POR COMPONENTE, 2022-2031 (MILLONES DE USD)
TABLA 161 MERCADO ESPAÑOL DE CONJUGADOS ANTICUERPO-FÁRMACO (ADC), POR TECNOLOGÍA DE ENLACE, 2022-2031 (MILLONES DE USD)
TABLA 162 MERCADO ESPAÑOL DE CONJUGADOS ANTICUERPO-FÁRMACO (ADC), POR TECNOLOGÍA DE CONJUGACIÓN, 2022-2031 (MILLONES DE USD)
TABLA 163 MERCADO ESPAÑOL DE CONJUGADOS ANTICUERPO-FÁRMACO (ADC), POR INDICACIÓN, 2022-2031 (MILLONES DE USD)
TABLA 164 MERCADO ESPAÑOL DE CONJUGADOS ANTICUERPO-FÁRMACO (ADC), POR USUARIO FINAL, 2022-2031 (MILLONES DE USD)
TABLA 165 MERCADO ESPAÑOL DE CONJUGADOS ANTICUERPO-FÁRMACO (ADC), POR CANAL DE DISTRIBUCIÓN, 2022-2031 (MILLONES DE USD)
TABLA 166 VENTAS AL POR MENOR EN ESPAÑA EN EL MERCADO DE CONJUGADOS ANTICUERPO-FÁRMACO (ADC), POR CANAL DE DISTRIBUCIÓN, 2022-2031 (MILLONES DE USD)
TABLA 167 MERCADO DE CONJUGADOS DE ANTICUERPOS Y FÁRMACOS (ADC) DE RUSIA, POR PRODUCTO, 2022-2031 (MILLONES DE USD)
TABLA 168 MERCADO DE CONJUGADOS DE ANTICUERPOS Y FÁRMACOS (ADC) DE RUSIA, POR PRODUCTO, 2022-2031 (VOLUMEN EN UNIDADES)
TABLA 169 MERCADO DE CONJUGADOS DE ANTICUERPOS Y FÁRMACOS (ADC) DE RUSIA, POR PRODUCTO, 2022-2031 (ASP)
TABLA 170 MERCADO DE CONJUGADOS DE ANTICUERPOS Y FÁRMACOS (ADC) EN RUSIA, POR COMPONENTE DE ANTÍGENO, 2022-2031 (MILLONES DE USD)
TABLA 171 MERCADO DE CONJUGADOS DE ANTICUERPOS Y FÁRMACOS (ADC) EN RUSIA, POR COMPONENTE DE ANTICUERPOS, 2022-2031 (MILLONES DE USD)
TABLA 172 MERCADO DE CONJUGADOS DE ANTICUERPOS Y FÁRMACOS (ADC) EN RUSIA, POR COMPONENTE DE ENLACE, 2022-2031 (MILLONES DE USD)
TABLA 173 ENLACES ESCIPTABLES DE RUSIA EN EL MERCADO DE CONJUGADOS ANTICUERPO-FÁRMACO (ADC), POR COMPONENTE, 2022-2031 (MILLONES DE USD)
TABLA 174 MERCADO RUSO DE CONJUGADOS DE ANTICUERPOS Y FÁRMACOS (ADC), POR COMPONENTE DE CARGAS U OJIVAS CITOTÓXICAS, 2022-2031 (MILLONES DE USD)
TABLA 175 AGENTES DAÑINOS DEL ADN EN EL MERCADO DE CONJUGADOS DE ANTICUERPOS Y FÁRMACOS (ADC) DE RUSIA, POR COMPONENTE, 2022-2031 (MILLONES DE USD)
TABLA 176 AGENTES DISRUPTOROS DE MICROTÚBULOS EN EL MERCADO DE CONJUGADOS ANTICUERPO-FÁRMACO (ADC) DE RUSIA, POR COMPONENTE, 2022-2031 (MILLONES DE USD)
TABLA 177 MERCADO DE CONJUGADOS DE ANTICUERPOS Y FÁRMACOS (ADC) EN RUSIA, POR TECNOLOGÍA DE ENLACE, 2022-2031 (MILLONES DE USD)
TABLA 178 MERCADO DE CONJUGADOS DE ANTICUERPOS Y FÁRMACOS (ADC) DE RUSIA, POR TECNOLOGÍA DE CONJUGACIÓN, 2022-2031 (MILLONES DE USD)
TABLA 179 MERCADO DE CONJUGADOS DE ANTICUERPOS Y FÁRMACOS (ADC) DE RUSIA, POR INDICACIÓN, 2022-2031 (MILLONES DE USD)
TABLA 180 MERCADO DE CONJUGADOS DE ANTICUERPOS Y FÁRMACOS (ADC) DE RUSIA, POR USUARIO FINAL, 2022-2031 (MILLONES DE USD)
TABLA 181 MERCADO RUSO DE CONJUGADOS DE ANTICUERPOS Y FÁRMACOS (ADC), POR CANAL DE DISTRIBUCIÓN, 2022-2031 (MILLONES DE USD)
TABLA 182 VENTAS MINORISTAS EN RUSIA EN EL MERCADO DE CONJUGADOS DE ANTICUERPOS Y FÁRMACOS (ADC), POR CANAL DE DISTRIBUCIÓN, 2022-2031 (MILLONES DE USD)
TABLA 183 MERCADO DE CONJUGADOS DE ANTICUERPOS Y FÁRMACOS (ADC) DE BÉLGICA, POR PRODUCTO, 2022-2031 (MILLONES DE USD)
TABLA 184 MERCADO DE CONJUGADOS DE ANTICUERPOS Y FÁRMACOS (ADC) DE BÉLGICA, POR PRODUCTO, 2022-2031 (VOLUMEN EN UNIDADES)
TABLA 185 MERCADO DE CONJUGADOS DE ANTICUERPOS Y FÁRMACOS (ADC) DE BÉLGICA, POR PRODUCTO, 2022-2031 (ASP)
TABLA 186 MERCADO DE CONJUGADOS DE ANTICUERPOS Y FÁRMACOS (ADC) DE BÉLGICA, POR COMPONENTE DE ANTÍGENO, 2022-2031 (MILLONES DE USD)
TABLA 187 MERCADO BÉLGICO DE CONJUGADOS DE ANTICUERPOS Y FÁRMACOS (ADC), POR COMPONENTE DE ANTICUERPOS, 2022-2031 (MILLONES DE USD)
TABLA 188 MERCADO DE CONJUGADOS ANTICUERPO-FÁRMACO (ADC) DE BÉLGICA, POR COMPONENTE DE ENLACE, 2022-2031 (MILLONES DE USD)
TABLA 189 ENLACES ESCIPTABLES EN EL MERCADO DE CONJUGADOS ANTICUERPO-FÁRMACO (ADC) DE BÉLGICA, POR COMPONENTE, 2022-2031 (MILLONES DE USD)
TABLA 190 MERCADO BÉLGICO DE CONJUGADOS DE ANTICUERPOS Y FÁRMACOS (ADC), POR COMPONENTE DE CARGAS U OJIVAS CITOTÓXICAS, 2022-2031 (MILLONES DE USD)
TABLA 191 AGENTES DAÑINOS DEL ADN EN EL MERCADO DE CONJUGADOS ANTICUERPO-FÁRMACO (ADC) DE BÉLGICA, POR COMPONENTE, 2022-2031 (MILLONES DE USD)
TABLA 192 MERCADO BÉLGICO DE AGENTES DISRUPTOROS DE MICROTÚBULOS EN CONJUGADOS DE ANTICUERPOS Y FÁRMACOS (ADC), POR COMPONENTE, 2022-2031 (MILLONES DE USD)
TABLA 193 MERCADO DE CONJUGADOS DE ANTICUERPOS Y FÁRMACOS (ADC) DE BÉLGICA, POR TECNOLOGÍA DE ENLACE, 2022-2031 (MILLONES DE USD)
TABLA 194 MERCADO BÉLGICO DE CONJUGADOS DE ANTICUERPOS Y FÁRMACOS (ADC), POR TECNOLOGÍA DE CONJUGACIÓN, 2022-2031 (MILLONES DE USD)
TABLA 195 MERCADO DE CONJUGADOS DE ANTICUERPOS Y FÁRMACOS (ADC) DE BÉLGICA, POR INDICACIÓN, 2022-2031 (MILLONES DE USD)
TABLA 196 MERCADO DE CONJUGADOS DE ANTICUERPOS Y FÁRMACOS (ADC) DE BÉLGICA, POR USUARIO FINAL, 2022-2031 (MILLONES DE USD)
TABLA 197 MERCADO DE CONJUGADOS DE ANTICUERPOS Y FÁRMACOS (ADC) DE BÉLGICA, POR CANAL DE DISTRIBUCIÓN, 2022-2031 (MILLONES DE USD)
TABLA 198 VENTAS MINORISTAS EN BÉLGICA EN EL MERCADO DE CONJUGADOS DE ANTICUERPOS Y FÁRMACOS (ADC), POR CANAL DE DISTRIBUCIÓN, 2022-2031 (MILLONES DE USD)
TABLA 199 MERCADO DE CONJUGADOS DE ANTICUERPOS Y FÁRMACOS (ADC) DE LOS PAÍSES BAJOS, POR PRODUCTO, 2022-2031 (MILLONES DE USD)
TABLA 200 MERCADO DE CONJUGADOS DE ANTICUERPOS Y FÁRMACOS (ADC) DE LOS PAÍSES BAJOS, POR PRODUCTO, 2022-2031 (VOLUMEN EN UNIDADES)
TABLA 201 MERCADO DE CONJUGADOS DE ANTICUERPOS Y FÁRMACOS (ADC) DE LOS PAÍSES BAJOS, POR PRODUCTO, 2022-2031 (ASP)
TABLA 202 MERCADO DE CONJUGADOS DE ANTICUERPOS Y FÁRMACOS (ADC) DE LOS PAÍSES BAJOS, POR COMPONENTE DE ANTÍGENO, 2022-2031 (MILLONES DE USD)
TABLA 203 MERCADO DE CONJUGADOS DE ANTICUERPOS Y FÁRMACOS (ADC) DE LOS PAÍSES BAJOS, POR COMPONENTE DE ANTICUERPO, 2022-2031 (MILLONES DE USD)
TABLA 204 MERCADO DE CONJUGADOS ANTICUERPO-FÁRMACO (ADC) DE LOS PAÍSES BAJOS, POR COMPONENTE DE ENLACE, 2022-2031 (MILLONES DE USD)
TABLA 205 ENLACES ESCIPTABLES EN EL MERCADO DE CONJUGADOS ANTICUERPO-FÁRMACO (ADC) DE LOS PAÍSES BAJOS, POR COMPONENTE, 2022-2031 (MILLONES DE USD)
TABLA 206 MERCADO DE CONJUGADOS ANTICUERPO-FÁRMACO (ADC) DE LOS PAÍSES BAJOS, POR COMPONENTE DE CARGAS U OJIVAS CITOTÓXICAS, 2022-2031 (MILLONES DE USD)
TABLA 207 MERCADO DE AGENTES DAÑINOS DEL ADN EN CONJUGADOS ANTICUERPO-FÁRMACO (ADC) DE LOS PAÍSES BAJOS, POR COMPONENTE, 2022-2031 (MILLONES DE USD)
TABLA 208 MERCADO DE AGENTES DISRUPTOROS DE MICROTÚBULOS EN CONJUGADOS ANTICUERPO-FÁRMACO (ADC) DE LOS PAÍSES BAJOS, POR COMPONENTE, 2022-2031 (MILLONES DE USD)
TABLA 209 MERCADO DE CONJUGADOS ANTICUERPO-FÁRMACO (ADC) DE LOS PAÍSES BAJOS, POR TECNOLOGÍA DE ENLACE, 2022-2031 (MILLONES DE USD)
TABLA 210 MERCADO DE CONJUGADOS DE ANTICUERPOS Y FÁRMACOS (ADC) DE LOS PAÍSES BAJOS, POR TECNOLOGÍA DE CONJUGACIÓN, 2022-2031 (MILLONES DE USD)
TABLA 211 MERCADO DE CONJUGADOS ANTICUERPO-FÁRMACO (ADC) DE LOS PAÍSES BAJOS, POR INDICACIÓN, 2022-2031 (MILLONES DE USD)
TABLA 212 MERCADO DE CONJUGADOS DE ANTICUERPOS Y FÁRMACOS (ADC) DE LOS PAÍSES BAJOS, POR USUARIO FINAL, 2022-2031 (MILLONES DE USD)
TABLA 213 MERCADO DE CONJUGADOS ANTICUERPO-FÁRMACO (ADC) DE LOS PAÍSES BAJOS, POR CANAL DE DISTRIBUCIÓN, 2022-2031 (MILLONES DE USD)
TABLA 214 VENTAS MINORISTAS EN EL MERCADO DE CONJUGADOS DE ANTICUERPOS Y FÁRMACOS (ADC) EN LOS PAÍSES BAJOS, POR CANAL DE DISTRIBUCIÓN, 2022-2031 (MILLONES DE USD)
TABLA 215 MERCADO SUIZO DE CONJUGADOS ANTICUERPO-FÁRMACO (ADC), POR PRODUCTO, 2022-2031 (MILLONES DE USD)
TABLA 216 MERCADO SUIZO DE CONJUGADOS DE ANTICUERPOS Y FÁRMACOS (ADC), POR PRODUCTO, 2022-2031 (VOLUMEN EN UNIDADES)
TABLA 217 MERCADO SUIZO DE CONJUGADOS DE ANTICUERPOS Y FÁRMACOS (ADC), POR PRODUCTO, 2022-2031 (ASP)
TABLA 218 MERCADO SUIZO DE CONJUGADOS ANTICUERPO-FÁRMACO (ADC), POR COMPONENTE ANTÍGENO, 2022-2031 (MILLONES DE USD)
TABLA 219 MERCADO SUIZO DE CONJUGADOS DE ANTICUERPOS Y FÁRMACOS (ADC), POR COMPONENTE DE ANTICUERPOS, 2022-2031 (MILLONES DE USD)
TABLA 220 MERCADO SUIZO DE CONJUGADOS ANTICUERPO-FÁRMACO (ADC), POR COMPONENTE DE ENLACE, 2022-2031 (MILLONES DE USD)
TABLA 221 ENLACES ESCIPTABLES EN EL MERCADO DE CONJUGADOS ANTICUERPO-FÁRMACO (ADC) DE SUIZA, POR COMPONENTE, 2022-2031 (MILLONES DE USD)
TABLA 222 MERCADO SUIZO DE CONJUGADOS ANTICUERPO-FÁRMACO (ADC), POR COMPONENTE DE CARGAS U OJIVAS CITOTÓXICAS, 2022-2031 (MILLONES DE USD)
TABLA 223 AGENTES DAÑINOS DEL ADN EN EL MERCADO DE CONJUGADOS ANTICUERPO-FÁRMACO (ADC) DE SUIZA, POR COMPONENTE, 2022-2031 (MILLONES DE USD)
TABLA 224 MERCADO SUIZO DE AGENTES DISRUPTOROS DE MICROTÚBULOS EN CONJUGADOS ANTICUERPO-FÁRMACO (ADC), POR COMPONENTE, 2022-2031 (MILLONES DE USD)
TABLA 225 MERCADO SUIZO DE CONJUGADOS ANTICUERPO-FÁRMACO (ADC), POR TECNOLOGÍA DE ENLACE, 2022-2031 (MILLONES DE USD)
TABLA 226 MERCADO SUIZO DE CONJUGADOS DE ANTICUERPOS Y FÁRMACOS (ADC), POR TECNOLOGÍA DE CONJUGACIÓN, 2022-2031 (MILLONES DE USD)
TABLA 227 MERCADO SUIZO DE CONJUGADOS ANTICUERPO-FÁRMACO (ADC), POR INDICACIÓN, 2022-2031 (MILLONES DE USD)
TABLA 228 MERCADO SUIZO DE CONJUGADOS ANTICUERPO-FÁRMACO (ADC), POR USUARIO FINAL, 2022-2031 (MILLONES DE USD)
TABLA 229 MERCADO SUIZO DE CONJUGADOS ANTICUERPO-FÁRMACO (ADC), POR CANAL DE DISTRIBUCIÓN, 2022-2031 (MILLONES DE USD)
TABLA 230 VENTAS MINORISTAS EN SUIZA EN EL MERCADO DE CONJUGADOS DE ANTICUERPOS Y FÁRMACOS (ADC), POR CANAL DE DISTRIBUCIÓN, 2022-2031 (MILLONES DE USD)
TABLA 231 MERCADO DE CONJUGADOS DE ANTICUERPOS Y FÁRMACOS (ADC) DE AUSTRIA, POR PRODUCTO, 2022-2031 (MILLONES DE USD)
TABLA 232 MERCADO DE CONJUGADOS DE ANTICUERPOS Y FÁRMACOS (ADC) DE AUSTRIA, POR PRODUCTO, 2022-2031 (VOLUMEN EN UNIDADES)
TABLA 233 MERCADO DE CONJUGADOS DE ANTICUERPOS Y FÁRMACOS (ADC) DE AUSTRIA, POR PRODUCTO, 2022-2031 (ASP)
TABLA 234 MERCADO DE CONJUGADOS DE ANTICUERPOS Y FÁRMACOS (ADC) DE AUSTRIA, POR COMPONENTE DE ANTÍGENO, 2022-2031 (MILLONES DE USD)
TABLA 235 MERCADO DE CONJUGADOS DE ANTICUERPOS Y FÁRMACOS (ADC) DE AUSTRIA, POR COMPONENTE DE ANTICUERPO, 2022-2031 (MILLONES DE USD)
TABLA 236 MERCADO DE CONJUGADOS ANTICUERPO-FÁRMACO (ADC) DE AUSTRIA, POR COMPONENTE DE ENLACE, 2022-2031 (MILLONES DE USD)
TABLA 237 ENLACES ESCIPTABLES DE AUSTRIA EN EL MERCADO DE CONJUGADOS ANTICUERPO-FÁRMACO (ADC), POR COMPONENTE, 2022-2031 (MILLONES DE USD)
TABLA 238 MERCADO DE CONJUGADOS DE ANTICUERPOS Y FÁRMACOS (ADC) DE AUSTRIA, POR COMPONENTE DE CARGAS U OJIVAS CITOTÓXICAS, 2022-2031 (MILLONES DE USD)
TABLA 239 AGENTES DAÑINOS DEL ADN EN EL MERCADO DE CONJUGADOS ANTICUERPO-FÁRMACO (ADC) DE AUSTRIA, POR COMPONENTE, 2022-2031 (MILLONES DE USD)
TABLA 240 MERCADO DE AGENTES DISRUPTOROS DE MICROTÚBULOS EN CONJUGADOS ANTICUERPO-FÁRMACO (ADC) DE AUSTRIA, POR COMPONENTE, 2022-2031 (MILLONES DE USD)
TABLA 241 MERCADO DE CONJUGADOS DE ANTICUERPOS Y FÁRMACOS (ADC) DE AUSTRIA, POR TECNOLOGÍA DE ENLACE, 2022-2031 (MILLONES DE USD)
TABLA 242 MERCADO DE CONJUGADOS DE ANTICUERPOS Y FÁRMACOS (ADC) DE AUSTRIA, POR TECNOLOGÍA DE CONJUGACIÓN, 2022-2031 (MILLONES DE USD)
TABLA 243 MERCADO DE CONJUGADOS DE ANTICUERPOS Y FÁRMACOS (ADC) DE AUSTRIA, POR INDICACIÓN, 2022-2031 (MILLONES DE USD)
TABLA 244 MERCADO DE CONJUGADOS DE ANTICUERPOS Y FÁRMACOS (ADC) DE AUSTRIA, POR USUARIO FINAL, 2022-2031 (MILLONES DE USD)
TABLA 245 MERCADO DE CONJUGADOS DE ANTICUERPOS Y FÁRMACOS (ADC) DE AUSTRIA, POR CANAL DE DISTRIBUCIÓN, 2022-2031 (MILLONES DE USD)
TABLA 246 VENTAS MINORISTAS EN AUSTRIA EN EL MERCADO DE CONJUGADOS DE ANTICUERPOS Y FÁRMACOS (ADC), POR CANAL DE DISTRIBUCIÓN, 2022-2031 (MILLONES DE USD)
TABLA 247 MERCADO IRLANDÉS DE CONJUGADOS DE ANTICUERPOS Y FÁRMACOS (ADC), POR PRODUCTO, 2022-2031 (MILLONES DE USD)
TABLA 248 MERCADO IRLANDÉS DE CONJUGADOS DE ANTICUERPOS Y FÁRMACOS (ADC), POR PRODUCTO, 2022-2031 (VOLUMEN EN UNIDADES)
TABLA 249 MERCADO IRLANDÉS DE CONJUGADOS DE ANTICUERPOS Y FÁRMACOS (ADC), POR PRODUCTO, 2022-2031 (ASP)
TABLA 250 MERCADO IRLANDÉS DE CONJUGADOS ANTICUERPO-FÁRMACO (ADC), POR COMPONENTE ANTÍGENO, 2022-2031 (MILLONES DE USD)
TABLA 251 MERCADO IRLANDÉS DE CONJUGADOS DE ANTICUERPOS Y FÁRMACOS (ADC), POR COMPONENTE DE ANTICUERPOS, 2022-2031 (MILLONES DE USD)
TABLA 252 MERCADO IRLANDÉS DE CONJUGADOS ANTICUERPO-FÁRMACO (ADC), POR COMPONENTE DE ENLACE, 2022-2031 (MILLONES DE USD)
TABLA 253 ENLACES ESCIPTABLES EN EL MERCADO DE CONJUGADOS ANTICUERPO-FÁRMACO (ADC) DE IRLANDA, POR COMPONENTE, 2022-2031 (MILLONES DE USD)
TABLA 254 MERCADO IRLANDÉS DE CONJUGADOS ANTICUERPO-FÁRMACO (ADC), POR COMPONENTE DE CARGAS U OJIVAS CITOTÓXICAS, 2022-2031 (MILLONES DE USD)
TABLA 255 MERCADO IRLANDÉS DE AGENTES DAÑINOS DEL ADN EN CONJUGADOS ANTICUERPO-FÁRMACO (ADC), POR COMPONENTE, 2022-2031 (MILLONES DE USD)
TABLA 256 MERCADO IRLANDÉS DE AGENTES DISRUPTOROS DE MICROTÚBULOS EN CONJUGADOS ANTICUERPO-FÁRMACO (ADC), POR COMPONENTE, 2022-2031 (MILLONES DE USD)
TABLA 257 MERCADO IRLANDÉS DE CONJUGADOS ANTICUERPO-FÁRMACO (ADC), POR TECNOLOGÍA DE ENLACE, 2022-2031 (MILLONES DE USD)
TABLA 258 MERCADO IRLANDÉS DE CONJUGADOS DE ANTICUERPOS Y FÁRMACOS (ADC), POR TECNOLOGÍA DE CONJUGACIÓN, 2022-2031 (MILLONES DE USD)
TABLA 259 MERCADO IRLANDÉS DE CONJUGADOS DE ANTICUERPOS Y FÁRMACOS (ADC), POR INDICACIÓN, 2022-2031 (MILLONES DE USD)
TABLA 260 MERCADO IRLANDÉS DE CONJUGADOS DE ANTICUERPOS Y FÁRMACOS (ADC), POR USUARIO FINAL, 2022-2031 (MILLONES DE USD)
TABLA 261 MERCADO IRLANDÉS DE CONJUGADOS DE ANTICUERPOS Y FÁRMACOS (ADC), POR CANAL DE DISTRIBUCIÓN, 2022-2031 (MILLONES DE USD)
TABLA 262 VENTAS MINORISTAS EN IRLANDA EN EL MERCADO DE CONJUGADOS DE ANTICUERPOS Y FÁRMACOS (ADC), POR CANAL DE DISTRIBUCIÓN, 2022-2031 (MILLONES DE USD)
TABLA 263 MERCADO DE CONJUGADOS DE ANTICUERPOS Y FÁRMACOS (ADC) DE POLONIA, POR PRODUCTO, 2022-2031 (MILLONES DE USD)
TABLA 264 MERCADO DE CONJUGADOS DE ANTICUERPOS Y FÁRMACOS (ADC) DE POLONIA, POR PRODUCTO, 2022-2031 (VOLUMEN EN UNIDADES)
TABLA 265 MERCADO DE CONJUGADOS DE ANTICUERPOS Y FÁRMACOS (ADC) DE POLONIA, POR PRODUCTO, 2022-2031 (ASP)
TABLA 266 MERCADO DE CONJUGADOS DE ANTICUERPOS Y FÁRMACOS (ADC) DE POLONIA, POR COMPONENTE DE ANTÍGENO, 2022-2031 (MILLONES DE USD)
TABLA 267 MERCADO DE CONJUGADOS DE ANTICUERPOS Y FÁRMACOS (ADC) DE POLONIA, POR COMPONENTE DE ANTICUERPO, 2022-2031 (MILLONES DE USD)
TABLA 268 MERCADO DE CONJUGADOS ANTICUERPO-FÁRMACO (ADC) DE POLONIA, POR COMPONENTE DE ENLACE, 2022-2031 (MILLONES DE USD)
TABLA 269 ENLACES ESCIPTABLES EN EL MERCADO DE CONJUGADOS ANTICUERPO-FÁRMACO (ADC) DE POLONIA, POR COMPONENTE, 2022-2031 (MILLONES DE USD)
TABLA 270 MERCADO DE CONJUGADOS ANTICUERPO-FÁRMACO (ADC) DE POLONIA, POR COMPONENTE DE CARGAS U OJIVAS CITOTÓXICAS, 2022-2031 (MILLONES DE USD)
TABLA 271 MERCADO DE AGENTES DAÑINOS DEL ADN EN CONJUGADOS DE ANTICUERPOS Y FÁRMACOS (ADC) EN POLONIA, POR COMPONENTE, 2022-2031 (MILLONES DE USD)
TABLA 272 MERCADO DE AGENTES DISRUPTOROS DE MICROTÚBULOS EN CONJUGADOS ANTICUERPO-FÁRMACO (ADC) DE POLONIA, POR COMPONENTE, 2022-2031 (MILLONES DE USD)
TABLA 273 MERCADO DE CONJUGADOS ANTICUERPO-FÁRMACO (ADC) DE POLONIA, POR TECNOLOGÍA DE ENLACE, 2022-2031 (MILLONES DE USD)
TABLA 274 MERCADO DE CONJUGADOS DE ANTICUERPOS Y FÁRMACOS (ADC) DE POLONIA, POR TECNOLOGÍA DE CONJUGACIÓN, 2022-2031 (MILLONES DE USD)
TABLA 275 MERCADO DE CONJUGADOS DE ANTICUERPOS Y FÁRMACOS (ADC) DE POLONIA, POR INDICACIÓN, 2022-2031 (MILLONES DE USD)
TABLA 276 MERCADO DE CONJUGADOS DE ANTICUERPOS Y FÁRMACOS (ADC) DE POLONIA, POR USUARIO FINAL, 2022-2031 (MILLONES DE USD)
TABLA 277 MERCADO DE CONJUGADOS DE ANTICUERPOS Y FÁRMACOS (ADC) DE POLONIA, POR CANAL DE DISTRIBUCIÓN, 2022-2031 (MILLONES DE USD)
TABLA 278 VENTAS MINORISTAS EN POLONIA EN EL MERCADO DE CONJUGADOS DE ANTICUERPOS Y FÁRMACOS (ADC), POR CANAL DE DISTRIBUCIÓN, 2022-2031 (MILLONES DE USD)
TABLA 279 MERCADO NORUEGO DE CONJUGADOS DE ANTICUERPOS Y FÁRMACOS (ADC), POR PRODUCTO, 2022-2031 (MILLONES DE USD)
TABLA 280 MERCADO NORUEGO DE CONJUGADOS DE ANTICUERPOS Y FÁRMACOS (ADC), POR PRODUCTO, 2022-2031 (VOLUMEN EN UNIDADES)
TABLA 281 MERCADO NORUEGO DE CONJUGADOS DE ANTICUERPOS Y FÁRMACOS (ADC), POR PRODUCTO, 2022-2031 (ASP)
TABLA 282 MERCADO NORUEGO DE CONJUGADOS DE ANTICUERPOS Y FÁRMACOS (ADC), POR COMPONENTE ANTÍGENO, 2022-2031 (MILLONES DE USD)
TABLA 283 MERCADO NORUEGO DE CONJUGADOS DE ANTICUERPOS Y FÁRMACOS (ADC), POR COMPONENTE DE ANTICUERPO, 2022-2031 (MILLONES DE USD)
TABLA 284 MERCADO NORUEGO DE CONJUGADOS DE ANTICUERPOS Y FÁRMACOS (ADC), POR COMPONENTE DE ENLACE, 2022-2031 (MILLONES DE USD)
TABLA 285 ENLACES ESCIPTABLES EN EL MERCADO DE CONJUGADOS ANTICUERPO-FÁRMACO (ADC) DE NORUEGA, POR COMPONENTE, 2022-2031 (MILLONES DE USD)
TABLA 286 MERCADO NORUEGO DE CONJUGADOS DE ANTICUERPOS Y FÁRMACOS (ADC), POR COMPONENTE DE CARGAS U OJIVAS CITOTÓXICAS, 2022-2031 (MILLONES DE USD)
TABLA 287 MERCADO NORUEGO DE AGENTES DAÑINOS DEL ADN EN CONJUGADOS ANTICUERPO-FÁRMACO (ADC), POR COMPONENTE, 2022-2031 (MILLONES DE USD)
TABLA 288 MERCADO NORUEGO DE AGENTES DISRUPTOROS DE MICROTÚBULOS EN CONJUGADOS ANTICUERPO-FÁRMACO (ADC), POR COMPONENTE, 2022-2031 (MILLONES DE USD)
TABLA 289 MERCADO NORUEGO DE CONJUGADOS DE ANTICUERPOS Y FÁRMACOS (ADC), POR TECNOLOGÍA DE ENLACE, 2022-2031 (MILLONES DE USD)
TABLA 290 MERCADO NORUEGO DE CONJUGADOS DE ANTICUERPOS Y FÁRMACOS (ADC), POR TECNOLOGÍA DE CONJUGACIÓN, 2022-2031 (MILLONES DE USD)
TABLA 291 MERCADO NORUEGO DE CONJUGADOS DE ANTICUERPOS Y FÁRMACOS (ADC), POR INDICACIÓN, 2022-2031 (MILLONES DE USD)
TABLA 292 MERCADO NORUEGO DE CONJUGADOS DE ANTICUERPOS Y FÁRMACOS (ADC), POR USUARIO FINAL, 2022-2031 (MILLONES DE USD)
TABLA 293 MERCADO NORUEGO DE CONJUGADOS DE ANTICUERPOS Y FÁRMACOS (ADC), POR CANAL DE DISTRIBUCIÓN, 2022-2031 (MILLONES DE USD)
TABLA 294 VENTAS MINORISTAS EN NORUEGA EN EL MERCADO DE CONJUGADOS DE ANTICUERPOS Y FÁRMACOS (ADC), POR CANAL DE DISTRIBUCIÓN, 2022-2031 (MILLONES DE USD)
TABLA 295 MERCADO DE CONJUGADOS DE ANTICUERPOS Y FÁRMACOS (ADC) DE HUNGRÍA, POR PRODUCTO, 2022-2031 (MILLONES DE USD)
TABLA 296 MERCADO DE CONJUGADOS DE ANTICUERPOS Y FÁRMACOS (ADC) DE HUNGRÍA, POR PRODUCTO, 2022-2031 (VOLUMEN EN UNIDADES)
TABLA 297 MERCADO DE CONJUGADOS DE ANTICUERPOS Y FÁRMACOS (ADC) DE HUNGRÍA, POR PRODUCTO, 2022-2031 (ASP)
TABLA 298 MERCADO DE CONJUGADOS DE ANTICUERPOS Y FÁRMACOS (ADC) DE HUNGRÍA, POR COMPONENTE DE ANTÍGENO, 2022-2031 (MILLONES DE USD)
TABLA 299 MERCADO DE CONJUGADOS DE ANTICUERPOS Y FÁRMACOS (ADC) DE HUNGRÍA, POR COMPONENTE DE ANTICUERPO, 2022-2031 (MILLONES DE USD)
TABLA 300 MERCADO DE CONJUGADOS ANTICUERPO-FÁRMACO (ADC) DE HUNGRÍA, POR COMPONENTE DE ENLACE, 2022-2031 (MILLONES DE USD)
TABLA 301 ENLACES ESCIPTABLES EN EL MERCADO DE CONJUGADOS ANTICUERPO-FÁRMACO (ADC) DE HUNGRÍA, POR COMPONENTE, 2022-2031 (MILLONES DE USD)
TABLA 302 MERCADO DE CONJUGADOS ANTICUERPO-FÁRMACO (ADC) EN HUNGRÍA, POR COMPONENTE DE CARGAS U OJIVAS CITOTÓXICAS, 2022-2031 (MILLONES DE USD)
TABLA 303 AGENTES DAÑINOS DEL ADN EN EL MERCADO DE CONJUGADOS ANTICUERPO-FÁRMACO (ADC) DE HUNGRÍA, POR COMPONENTE, 2022-2031 (MILLONES DE USD)
TABLA 304 MERCADO DE AGENTES DISRUPTOROS DE MICROTÚBULOS EN CONJUGADOS ANTICUERPO-FÁRMACO (ADC) EN HUNGRÍA, POR COMPONENTE, 2022-2031 (MILLONES DE USD)
TABLA 305 MERCADO DE CONJUGADOS ANTICUERPO-FÁRMACO (ADC) DE HUNGRÍA, POR TECNOLOGÍA DE ENLACE, 2022-2031 (MILLONES DE USD)
TABLA 306 MERCADO DE CONJUGADOS DE ANTICUERPOS Y FÁRMACOS (ADC) DE HUNGRÍA, POR TECNOLOGÍA DE CONJUGACIÓN, 2022-2031 (MILLONES DE USD)
TABLA 307 MERCADO DE CONJUGADOS DE ANTICUERPOS Y FÁRMACOS (ADC) DE HUNGRÍA, POR INDICACIÓN, 2022-2031 (MILLONES DE USD)
TABLA 308 MERCADO DE CONJUGADOS DE ANTICUERPOS Y FÁRMACOS (ADC) DE HUNGRÍA, POR USUARIO FINAL, 2022-2031 (MILLONES DE USD)
TABLA 309 MERCADO DE CONJUGADOS DE ANTICUERPOS Y FÁRMACOS (ADC) DE HUNGRÍA, POR CANAL DE DISTRIBUCIÓN, 2022-2031 (MILLONES DE USD)
TABLA 310 VENTAS MINORISTAS EN HUNGRÍA EN EL MERCADO DE CONJUGADOS DE ANTICUERPOS Y FÁRMACOS (ADC), POR CANAL DE DISTRIBUCIÓN, 2022-2031 (MILLONES DE USD)
TABLA 311 MERCADO DE CONJUGADOS DE ANTICUERPOS Y FÁRMACOS (ADC) DE LITUANIA, POR PRODUCTO, 2022-2031 (MILLONES DE USD)
TABLA 312 MERCADO DE CONJUGADOS DE ANTICUERPOS Y FÁRMACOS (ADC) DE LITUANIA, POR PRODUCTO, 2022-2031 (VOLUMEN EN UNIDADES)
TABLA 313 MERCADO DE CONJUGADOS DE ANTICUERPOS Y FÁRMACOS (ADC) DE LITUANIA, POR PRODUCTO, 2022-2031 (ASP)
TABLA 314 MERCADO DE CONJUGADOS DE ANTICUERPOS Y FÁRMACOS (ADC) DE LITUANIA, POR COMPONENTE DE ANTÍGENO, 2022-2031 (MILLONES DE USD)
TABLA 315 MERCADO DE CONJUGADOS DE ANTICUERPOS Y FÁRMACOS (ADC) DE LITUANIA, POR COMPONENTE DE ANTICUERPO, 2022-2031 (MILLONES DE USD)
TABLA 316 MERCADO DE CONJUGADOS DE ANTICUERPOS Y FÁRMACOS (ADC) DE LITUANIA, POR COMPONENTE DE ENLACE, 2022-2031 (MILLONES DE USD)
TABLA 317 ENLACES ESCIPTABLES EN EL MERCADO DE CONJUGADOS ANTICUERPO-FÁRMACO (ADC) DE LITUANIA, POR COMPONENTE, 2022-2031 (MILLONES DE USD)
TABLA 318 MERCADO DE CONJUGADOS DE ANTICUERPOS Y FÁRMACOS (ADC) DE LITUANIA, POR COMPONENTE DE CARGAS U OJIVAS CITOTÓXICAS, 2022-2031 (MILLONES DE USD)
TABLA 319 AGENTES DAÑINOS DEL ADN EN EL MERCADO DE CONJUGADOS ANTICUERPO-FÁRMACO (ADC) DE LITUANIA, POR COMPONENTE, 2022-2031 (MILLONES DE USD)
TABLA 320 MERCADO DE AGENTES DISRUPTOROS DE MICROTÚBULOS EN CONJUGADOS ANTICUERPO-FÁRMACO (ADC) DE LITUANIA, POR COMPONENTE, 2022-2031 (MILLONES DE USD)
TABLA 321 MERCADO DE CONJUGADOS DE ANTICUERPOS Y FÁRMACOS (ADC) DE LITUANIA, POR TECNOLOGÍA DE ENLACE, 2022-2031 (MILLONES DE USD)
TABLA 322 MERCADO DE CONJUGADOS DE ANTICUERPOS Y FÁRMACOS (ADC) DE LITUANIA, POR TECNOLOGÍA DE CONJUGACIÓN, 2022-2031 (MILLONES DE USD)
TABLA 323 MERCADO DE CONJUGADOS DE ANTICUERPOS Y FÁRMACOS (ADC) DE LITUANIA, POR INDICACIÓN, 2022-2031 (MILLONES DE USD)
TABLA 324 MERCADO DE CONJUGADOS DE ANTICUERPOS Y FÁRMACOS (ADC) DE LITUANIA, POR USUARIO FINAL, 2022-2031 (MILLONES DE USD)
TABLA 325 MERCADO DE CONJUGADOS DE ANTICUERPOS Y FÁRMACOS (ADC) DE LITUANIA, POR CANAL DE DISTRIBUCIÓN, 2022-2031 (MILLONES DE USD)
TABLA 326 VENTAS MINORISTAS EN LITUANIA EN EL MERCADO DE CONJUGADOS DE ANTICUERPOS Y FÁRMACOS (ADC), POR CANAL DE DISTRIBUCIÓN, 2022-2031 (MILLONES DE USD)
TABLA 327 RESTO DE EUROPA MERCADO DE CONJUGADOS ANTICUERPO-FÁRMACO (ADC), POR PRODUCTO, 2022-2031 (MILLONES DE USD)
TABLA 328 RESTO DE EUROPA MERCADO DE CONJUGADOS ANTICUERPO-FÁRMACO (ADC), POR PRODUCTO, 2022-2031 (VOLUMEN EN UNIDADES)
TABLA 329 RESTO DE EUROPA MERCADO DE CONJUGADOS ANTICUERPO-FÁRMACO (ADC), POR PRODUCTO, 2022-2031 (ASP)
TABLA 330 MERCADO DE CONJUGADOS ANTICUERPO-FÁRMACO (ADC) EN EL RESTO DE EUROPA, POR COMPONENTE ANTÍGENO, 2022-2031 (MILLONES DE USD)
TABLA 331 MERCADO DE CONJUGADOS ANTICUERPO-FÁRMACO (ADC) EN EL RESTO DE EUROPA, POR COMPONENTE DE ANTICUERPO, 2022-2031 (MILLONES DE USD)
TABLA 332 RESTO DE EUROPA MERCADO DE CONJUGADOS ANTICUERPO-FÁRMACO (ADC), POR COMPONENTE DE ENLACE, 2022-2031 (MILLONES DE USD)
TABLA 333 RESTO DE EUROPA ENLACES ESCIPTABLES EN EL MERCADO DE CONJUGADOS ANTICUERPO-FÁRMACO (ADC), POR COMPONENTE, 2022-2031 (MILLONES DE USD)
TABLA 334 MERCADO DE CONJUGADOS ANTICUERPO-FÁRMACO (ADC) EN EL RESTO DE EUROPA, POR COMPONENTE DE CARGAS U OJIVAS CITOTÓXICAS, 2022-2031 (MILLONES DE USD)
TABLA 335 RESTO DE EUROPA: AGENTES DAÑINOS DEL ADN EN EL MERCADO DE CONJUGADOS ANTICUERPO-FÁRMACO (ADC), POR COMPONENTE, 2022-2031 (MILLONES DE USD)
TABLA 336 RESTO DE EUROPA MERCADO DE AGENTES DISRUPTOROS DE MICROTÚBULOS EN CONJUGADOS ANTICUERPO-FÁRMACO (ADC), POR COMPONENTE, 2022-2031 (MILLONES DE USD)
TABLA 337 MERCADO DE CONJUGADOS ANTICUERPO-FÁRMACO (ADC) EN EL RESTO DE EUROPA, POR TECNOLOGÍA DE ENLACE, 2022-2031 (MILLONES DE USD)
TABLA 338 MERCADO DE CONJUGADOS ANTICUERPO-FÁRMACO (ADC) EN EL RESTO DE EUROPA, POR TECNOLOGÍA DE CONJUGACIÓN, 2022-2031 (MILLONES DE USD)
TABLA 339 MERCADO DE CONJUGADOS ANTICUERPO-FÁRMACO (ADC) EN EL RESTO DE EUROPA, POR INDICACIÓN, 2022-2031 (MILLONES DE USD)
TABLA 340 MERCADO DE CONJUGADOS ANTICUERPO-FÁRMACO (ADC) EN EL RESTO DE EUROPA, POR USUARIO FINAL, 2022-2031 (MILLONES DE USD)
TABLA 341 RESTO DE EUROPA MERCADO DE CONJUGADOS ANTICUERPO-FÁRMACO (ADC), POR CANAL DE DISTRIBUCIÓN, 2022-2031 (MILLONES DE USD)
TABLA 342 VENTAS MINORISTAS EN EL RESTO DE EUROPA EN EL MERCADO DE CONJUGADOS DE ANTICUERPOS Y FÁRMACOS (ADC), POR CANAL DE DISTRIBUCIÓN, 2022-2031 (MILLONES DE USD)
Lista de figuras
FIGURA 1 MERCADO EUROPEO DE CONJUGADOS ANTICUERPO-FÁRMACO (ADC): SEGMENTACIÓN
FIGURA 2 MERCADO EUROPEO DE CONJUGADOS ANTICUERPO-FÁRMACO (ADC): TRIANGULACIÓN DE DATOS
FIGURA 3 MERCADO EUROPEO DE CONJUGADOS ANTICUERPO-FÁRMACO (ADC): ANÁLISIS DROC
FIGURA 4 MERCADO EUROPEO DE CONJUGADOS ANTICUERPO-FÁRMACO (ADC): ANÁLISIS DEL MERCADO EUROPEO VS. REGIONAL
FIGURA 5 MERCADO EUROPEO DE CONJUGADOS ANTICUERPO-FÁRMACO (ADC): ANÁLISIS DE INVESTIGACIÓN DE EMPRESAS
FIGURA 6 MERCADO EUROPEO DE CONJUGADOS ANTICUERPO-FÁRMACO (ADC): DATOS DEMOGRÁFICOS DE LAS ENTREVISTAS
FIGURA 7 MERCADO EUROPEO DE CONJUGADOS ANTICUERPO-FÁRMACO (ADC): CUADRÍCULA DE COBERTURA DE APLICACIONES DEL MERCADO
FIGURA 8 MERCADO EUROPEO DE CONJUGADOS ANTICUERPO-FÁRMACO (ADC): CUADRÍCULA DE POSICIÓN DE MERCADO DE DBMR
FIGURA 9 MERCADO EUROPEO DE CONJUGADOS DE ANTICUERPOS Y FÁRMACOS (ADC): ANÁLISIS DE LA PARTICIPACIÓN DE LOS PROVEEDORES
FIGURA 10 MERCADO EUROPEO DE CONJUGADOS ANTICUERPO-FÁRMACO (ADC): SEGMENTACIÓN
FIGURA 11 RESUMEN EJECUTIVO
FIGURA 12 DECISIONES ESTRATÉGICAS
FIGURA 13 LA AUMENTO DE LA INCIDENCIA DEL CÁNCER ESTÁ IMPULSANDO EL CRECIMIENTO DEL MERCADO EUROPEO DE CONJUGADOS ANTICUERPO-FÁRMACO (ADC) DE 2024 A 2031
FIGURA 14 SE ESPERA QUE EL SEGMENTO DE PRODUCTOS REPRESENTE LA MAYOR PARTICIPACIÓN DEL MERCADO EUROPEO DE CONJUGADOS DE ANTICUERPOS Y FARMACÉUTICOS (ADC) EN 2024 Y 2031
FIGURA 15 DROC
FIGURA 16 MERCADO EUROPEO DE CONJUGADOS ANTICUERPO-FÁRMACO (ADC): POR PRODUCTO, 2023
FIGURA 17 MERCADO EUROPEO DE CONJUGADOS DE ANTICUERPOS Y FÁRMACOS (ADC): POR PRODUCTO, 2024-2031 (MILLONES DE USD)
FIGURA 18 MERCADO EUROPEO DE CONJUGADOS ANTICUERPO-FÁRMACO (ADC): POR PRODUCTO, CAGR (2024-2031)
FIGURA 19 MERCADO EUROPEO DE CONJUGADOS ANTICUERPO-FÁRMACO (ADC): POR PRODUCTO, CURVA LIFELINE
FIGURA 20 MERCADO EUROPEO DE CONJUGADOS ANTICUERPO-FÁRMACO (ADC): POR COMPONENTE ANTÍGENO, 2023
FIGURA 21 MERCADO EUROPEO DE CONJUGADOS ANTICUERPO-FÁRMACO (ADC): POR COMPONENTE ANTÍGENO, 2024-2031 (MILLONES DE USD)
FIGURA 22 MERCADO EUROPEO DE CONJUGADOS ANTICUERPO-FÁRMACO (ADC): POR COMPONENTE ANTÍGENO, CAGR (2024-2031)
FIGURA 23 MERCADO EUROPEO DE CONJUGADOS ANTICUERPO-FÁRMACO (ADC): POR COMPONENTE ANTÍGENO, CURVA LIFELINE
FIGURA 24 MERCADO EUROPEO DE CONJUGADOS ANTICUERPO-FÁRMACO (ADC): POR COMPONENTE DE ANTICUERPO, 2023
FIGURA 25 MERCADO EUROPEO DE CONJUGADOS DE ANTICUERPOS Y FÁRMACOS (ADC): POR COMPONENTE DE ANTICUERPOS, 2024-2031 (MILLONES DE USD)
FIGURA 26 MERCADO EUROPEO DE CONJUGADOS ANTICUERPO-FÁRMACO (ADC): POR COMPONENTE DE ANTICUERPO, CAGR (2024-2031)
FIGURA 27 MERCADO EUROPEO DE CONJUGADOS ANTICUERPO-FÁRMACO (ADC): POR COMPONENTE DE ANTICUERPO, CURVA LIFELINE
FIGURA 28 MERCADO EUROPEO DE CONJUGADOS ANTICUERPO-FÁRMACO (ADC): POR COMPONENTE DE ENLACE, 2023
FIGURA 29 MERCADO EUROPEO DE CONJUGADOS ANTICUERPO-FÁRMACO (ADC): POR COMPONENTE DE ENLACE, 2024-2031 (MILLONES DE USD)
FIGURA 30 MERCADO EUROPEO DE CONJUGADOS ANTICUERPO-FÁRMACO (ADC): POR COMPONENTE DE ENLACE, CAGR (2024-2031)
FIGURA 31 MERCADO EUROPEO DE CONJUGADOS ANTICUERPO-FÁRMACO (ADC): POR COMPONENTE DE ENLACE, CURVA LIFELINE
FIGURA 32 MERCADO EUROPEO DE CONJUGADOS DE ANTICUERPOS Y FÁRMACOS (ADC): POR COMPONENTE DE CARGAS U OJIVAS CITOTÓXICAS, 2023
FIGURA 33 MERCADO EUROPEO DE CONJUGADOS ANTICUERPO-FÁRMACO (ADC): POR COMPONENTE DE CARGAS U ÓGICAS CITOTÓXICAS, 2024-2031 (MILLONES DE USD)
FIGURA 34 MERCADO EUROPEO DE CONJUGADOS ANTICUERPO-FÁRMACO (ADC): POR COMPONENTE DE CARGA U OJIVA CITOTÓXICA, CAGR (2024-2031)
FIGURA 35 MERCADO EUROPEO DE CONJUGADOS ANTICUERPO-FÁRMACO (ADC): POR COMPONENTE DE CARGAS U OJIVAS CITOTÓXICAS, CURVA DE LÍNEA DE VIDA
FIGURA 36 MERCADO EUROPEO DE CONJUGADOS ANTICUERPO-FÁRMACO (ADC): POR TECNOLOGÍA DE ENLACE, 2023
FIGURA 37 MERCADO EUROPEO DE CONJUGADOS ANTICUERPO-FÁRMACO (ADC): POR TECNOLOGÍA DE ENLACE, 2024-2031 (MILLONES DE USD)
FIGURA 38 MERCADO EUROPEO DE CONJUGADOS ANTICUERPO-FÁRMACO (ADC): POR TECNOLOGÍA DE ENLACE, CAGR (2024-2031)
FIGURA 39 MERCADO EUROPEO DE CONJUGADOS ANTICUERPO-FÁRMACO (ADC): POR TECNOLOGÍA DE ENLACE, CURVA LIFELINE
FIGURA 40 MERCADO EUROPEO DE CONJUGADOS ANTICUERPO-FÁRMACO (ADC): POR TECNOLOGÍA DE CONJUGACIÓN, 2023
FIGURA 41 MERCADO EUROPEO DE CONJUGADOS DE ANTICUERPOS Y FÁRMACOS (ADC): POR TECNOLOGÍA DE CONJUGACIÓN, 2024-2031 (MILLONES DE USD)
FIGURA 42 MERCADO EUROPEO DE CONJUGADOS ANTICUERPO-FÁRMACO (ADC): POR TECNOLOGÍA DE CONJUGACIÓN, CAGR (2024-2031)
FIGURA 43 MERCADO EUROPEO DE CONJUGADOS DE ANTICUERPOS Y FÁRMACOS (ADC): POR TECNOLOGÍA DE CONJUGACIÓN, CURVA LIFELINE
FIGURA 44 MERCADO EUROPEO DE CONJUGADOS DE ANTICUERPOS Y FÁRMACOS (ADC): POR INDICACIÓN, 2023
FIGURA 45 MERCADO EUROPEO DE CONJUGADOS ANTICUERPO-FÁRMACO (ADC): POR INDICACIÓN, 2024-2031 (MILLONES DE USD)
FIGURA 46 MERCADO EUROPEO DE CONJUGADOS ANTICUERPO-FÁRMACO (ADC): POR INDICACIÓN, CAGR (2024-2031)
FIGURA 47 MERCADO EUROPEO DE CONJUGADOS ANTICUERPO-FÁRMACO (ADC): POR INDICACIÓN, CURVA DE LÍNEA DE VIDA
FIGURA 48 MERCADO EUROPEO DE CONJUGADOS ANTICUERPO-FÁRMACO (ADC): POR USUARIO FINAL, 2023
FIGURA 49 MERCADO EUROPEO DE CONJUGADOS ANTICUERPO-FÁRMACO (ADC): POR USUARIO FINAL, 2024-2031 (MILLONES DE USD)
FIGURA 50 MERCADO EUROPEO DE CONJUGADOS ANTICUERPO-FÁRMACO (ADC): POR USUARIO FINAL, CAGR (2024-2031)
FIGURA 51 MERCADO EUROPEO DE CONJUGADOS ANTICUERPO-FÁRMACO (ADC): POR USUARIO FINAL, CURVA LIFELINE
FIGURA 52 MERCADO EUROPEO DE CONJUGADOS ANTICUERPO-FÁRMACO (ADC): POR CANAL DE DISTRIBUCIÓN, 2023
FIGURA 53 MERCADO EUROPEO DE CONJUGADOS ANTICUERPO-FÁRMACO (ADC): POR CANAL DE DISTRIBUCIÓN, 2024-2031 (MILLONES DE USD)
FIGURA 54 MERCADO EUROPEO DE CONJUGADOS ANTICUERPO-FÁRMACO (ADC): POR CANAL DE DISTRIBUCIÓN, TCAC (2024-2031)
FIGURA 55 MERCADO EUROPEO DE CONJUGADOS ANTICUERPO-FÁRMACO (ADC): POR CANAL DE DISTRIBUCIÓN, CURVA LIFELINE
FIGURA 56 MERCADO EUROPEO DE CONJUGADOS ANTICUERPO-FÁRMACO (ADC): INSTANTÁNEA (2023)
FIGURA 57 CONJUGADOS ANTICUERPO-FÁRMACO (ADC) EN EUROPA: PARTICIPACIÓN DE LA EMPRESA EN 2023 (%)
Metodología de investigación
La recopilación de datos y el análisis del año base se realizan utilizando módulos de recopilación de datos con muestras de gran tamaño. La etapa incluye la obtención de información de mercado o datos relacionados a través de varias fuentes y estrategias. Incluye el examen y la planificación de todos los datos adquiridos del pasado con antelación. Asimismo, abarca el examen de las inconsistencias de información observadas en diferentes fuentes de información. Los datos de mercado se analizan y estiman utilizando modelos estadísticos y coherentes de mercado. Además, el análisis de la participación de mercado y el análisis de tendencias clave son los principales factores de éxito en el informe de mercado. Para obtener más información, solicite una llamada de un analista o envíe su consulta.
La metodología de investigación clave utilizada por el equipo de investigación de DBMR es la triangulación de datos, que implica la extracción de datos, el análisis del impacto de las variables de datos en el mercado y la validación primaria (experto en la industria). Los modelos de datos incluyen cuadrícula de posicionamiento de proveedores, análisis de línea de tiempo de mercado, descripción general y guía del mercado, cuadrícula de posicionamiento de la empresa, análisis de patentes, análisis de precios, análisis de participación de mercado de la empresa, estándares de medición, análisis global versus regional y de participación de proveedores. Para obtener más información sobre la metodología de investigación, envíe una consulta para hablar con nuestros expertos de la industria.
Personalización disponible
Data Bridge Market Research es líder en investigación formativa avanzada. Nos enorgullecemos de brindar servicios a nuestros clientes existentes y nuevos con datos y análisis que coinciden y se adaptan a sus objetivos. El informe se puede personalizar para incluir análisis de tendencias de precios de marcas objetivo, comprensión del mercado de países adicionales (solicite la lista de países), datos de resultados de ensayos clínicos, revisión de literatura, análisis de mercado renovado y base de productos. El análisis de mercado de competidores objetivo se puede analizar desde análisis basados en tecnología hasta estrategias de cartera de mercado. Podemos agregar tantos competidores sobre los que necesite datos en el formato y estilo de datos que esté buscando. Nuestro equipo de analistas también puede proporcionarle datos en archivos de Excel sin procesar, tablas dinámicas (libro de datos) o puede ayudarlo a crear presentaciones a partir de los conjuntos de datos disponibles en el informe.

