Europe Compression Therapy Market
Tamaño del mercado en miles de millones de dólares
Tasa de crecimiento anual compuesta (CAGR) :
% 
 USD
1,393.40 Million
USD
2,058.69 Million
2024
2032
USD
1,393.40 Million
USD
2,058.69 Million
2024
2032
| 2025 –2032 | |
| USD 1,393.40 Million | |
| USD 2,058.69 Million | |
| % | |
|
Segmentación del mercado europeo de terapias de compresión por producto (órtesis de compresión, bombas de compresión, prendas de compresión), técnica (terapia de compresión estática, terapia de compresión dinámica), aplicación (tratamiento del linfedema, tratamiento de úlceras en las piernas, tratamiento de varices, tratamiento de trombosis venosa profunda, otros), usuario final (farmacias y comercios, hospitales y clínicas, plataformas de comercio electrónico): tendencias del sector y pronóstico hasta 2032.
Tamaño del mercado de terapia de compresión
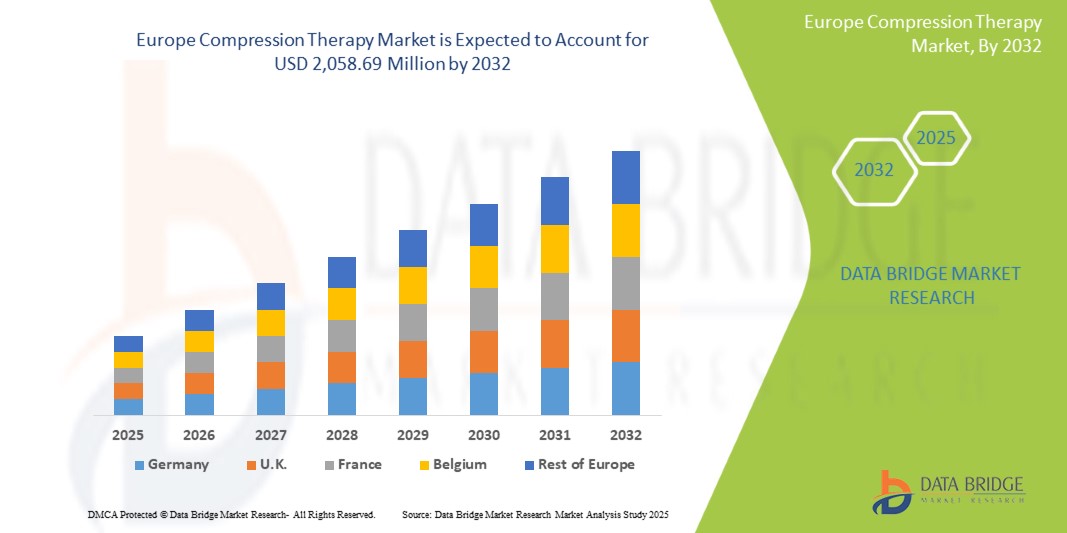
- El mercado europeo de terapia de compresión se valoró en USD 1.393,4 millones en 2024 y se espera que alcance los USD 2.058,69 millones para 2032, con una CAGR del 5,05 % durante el período de pronóstico.
- La creciente prevalencia de trastornos venosos crónicos, como la insuficiencia venosa crónica (IVC), las venas varicosas y la trombosis venosa profunda (TVP), están impulsando la demanda de soluciones de terapia de compresión efectivas.
Análisis del mercado europeo de terapias de compresión
- La terapia de compresión desempeña un papel fundamental en el tratamiento de diversas afecciones venosas y linfáticas, como la insuficiencia venosa crónica (IVC), la trombosis venosa profunda (TVP), el linfedema y las venas varicosas. Los productos de compresión, como vendajes, medias, dispositivos de compresión neumática y vendajes, ayudan a mejorar la circulación sanguínea, reducir la inflamación y prevenir la progresión de los trastornos venosos. Estas soluciones se utilizan ampliamente en hospitales, centros de rehabilitación, centros de atención domiciliaria y clínicas especializadas.
- La demanda de terapia de compresión en Europa se debe principalmente a la creciente incidencia de enfermedades venosas crónicas, al aumento de la población geriátrica, más susceptible a las enfermedades vasculares, y a la creciente concienciación sobre los beneficios de la intervención temprana y el tratamiento no invasivo. Además, la creciente prevalencia de la obesidad y la diabetes —ambos factores de riesgo importantes para las insuficiencias venosas— está impulsando aún más la expansión del mercado.
- Europa es una región líder en el mercado de la terapia de compresión, respaldada por una infraestructura sanitaria consolidada, la adopción temprana de tecnologías médicas avanzadas y políticas de reembolso favorables. Alemania ostenta una cuota dominante, impulsada por una amplia base de pacientes con enfermedades vasculares, el aumento de los procedimientos ambulatorios y una fuerte inversión en atención médica domiciliaria y dispositivos médicos portátiles.
- El mercado alemán de terapias de compresión también está condicionado por las aprobaciones regulatorias, incluyendo las autorizaciones de la FDA para dispositivos de compresión innovadores y fáciles de usar. Además, el aumento del gasto sanitario, la creciente demanda de soluciones de tratamiento móviles y portátiles, y los avances en textiles inteligentes y prendas de compresión basadas en sensores están mejorando el cumplimiento terapéutico del paciente y los resultados terapéuticos. El mercado también está experimentando una mayor adopción de enfoques terapéuticos personalizados y basados en datos, lo que favorece el manejo a largo plazo de las enfermedades y la mejora de la calidad de vida.
Alcance del informe Segmentación del mercado de terapia de compresión
|
Atributos |
Perspectivas clave del mercado de la terapia de compresión |
|
Segmentos cubiertos |
|
|
Países cubiertos |
Europa
|
|
Actores clave del mercado |
|
|
Oportunidades de mercado |
|
|
Conjuntos de información de datos de valor añadido |
Además de los conocimientos sobre escenarios de mercado como valor de mercado, tasa de crecimiento, segmentación, cobertura geográfica y actores principales, los informes de mercado seleccionados por Data Bridge Market Research también incluyen análisis de importación y exportación, descripción general de la capacidad de producción, análisis del consumo de producción, análisis de tendencias de precios, escenario de cambio climático, análisis de la cadena de suministro, análisis de la cadena de valor, descripción general de materias primas/consumibles, criterios de selección de proveedores, análisis PESTLE, análisis de Porter y marco regulatorio. |
Tendencias del mercado de la terapia de compresión
“Integración de tejidos inteligentes y salud digital”
- Los avances en las tecnologías de terapia de compresión, como las prendas de compresión inteligentes, los sensores portátiles y los dispositivos de compresión neumática controlados digitalmente, están transformando la atención al paciente al permitir la monitorización en tiempo real de los niveles de presión, el cumplimiento terapéutico y los resultados del tratamiento. Estas innovaciones son especialmente eficaces en el manejo de afecciones crónicas como el linfedema y las úlceras venosas de las piernas con mayor precisión y comodidad.
- Por ejemplo, en Alemania se ha observado un aumento notable en la adopción de dispositivos de compresión neumática intermitente (CNI) y prendas de compresión gradual, respaldadas por directrices clínicas que recomiendan su uso para la prevención de la TVP tanto en entornos hospitalarios como de atención domiciliaria.
- Las soluciones basadas en IA y las aplicaciones móviles de salud se integran cada vez más con los sistemas de terapia de compresión para personalizar los regímenes de tratamiento, monitorizar la adherencia del paciente y alertar a los médicos sobre los primeros signos de complicaciones. Estas herramientas digitales optimizan la coordinación de la atención, mejoran la participación del paciente y generan mejores resultados a largo plazo en entornos clínicos y de atención domiciliaria.
Dinámica del mercado de la terapia de compresión
Conductor
Aumento de la prevalencia de trastornos venosos y avances tecnológicos en dispositivos de compresión
- El mercado europeo de terapia de compresión está experimentando un crecimiento significativo impulsado por la creciente incidencia de insuficiencia venosa crónica (IVC), venas varicosas, linfedema y trombosis venosa profunda (TVP), particularmente entre las poblaciones envejecidas y diabéticas.
- Las innovaciones tecnológicas, como los dispositivos de compresión neumática intermitente (IPC), las prendas de compresión gradual y los textiles inteligentes con sensores integrados, están mejorando los resultados terapéuticos a través de una mayor comodidad, monitoreo en tiempo real y control de presión personalizado.
- Las iniciativas de salud gubernamentales en Alemania y el Reino Unido que promueven la atención preventiva, el diagnóstico temprano de enfermedades venosas y el tratamiento domiciliario de enfermedades crónicas están impulsando la demanda de productos de terapia de compresión avanzada en los entornos de atención médica.
- La integración de dispositivos de terapia de compresión con plataformas de salud digitales y registros médicos electrónicos (EHR) está mejorando el cumplimiento del tratamiento, el monitoreo remoto y la participación del paciente, acelerando así su adopción.
Por ejemplo,
- Según el American Venous Forum (2024), más del 40% de los adultos en EE. UU. padecen trastornos venosos crónicos, lo que subraya la necesidad crítica de terapias de compresión accesibles y efectivas.
- En marzo de 2024, 3M Health Care lanzó en Europa una venda de compresión de próxima generación con indicadores de tensión ajustables y capas antimicrobianas para mejorar la facilidad de uso y el control de infecciones tanto en entornos clínicos como domésticos.
- El enfoque continuo en opciones de tratamiento no invasivas y rentables y la creciente preferencia por soluciones de salud portátiles están impulsando aún más la adopción de productos de terapia de compresión avanzada en toda Europa.
Oportunidad
Integración de la salud digital y expansión de las terapias de compresión domiciliarias
- El cambio hacia la prestación de atención médica digital y la gestión descentralizada de pacientes está abriendo nuevas oportunidades para la adopción de soluciones de terapia de compresión portátiles y conectadas en Europa.
- Está aumentando la demanda de prendas de compresión inteligentes y bombas de compresión móviles que se puedan usar en entornos de atención domiciliaria, centros de atención a largo plazo y programas de monitoreo remoto, ampliando el acceso a la atención a poblaciones rurales y marginadas.
- El crecimiento de las plataformas de telesalud está impulsando el desarrollo de dispositivos de compresión que se sincronizan con aplicaciones móviles, lo que permite a los médicos monitorear de forma remota la adherencia a la terapia, los niveles de presión y el progreso del tratamiento.
Por ejemplo,
- En febrero de 2024, la Asociación Europea de Linfología informó sobre una creciente adopción de tecnologías de terapia de compresión inteligente en programas comunitarios de manejo del linfedema en países como Alemania, Suecia y los Países Bajos. Estas herramientas mejoran la monitorización del paciente, promueven la adherencia al tratamiento y apoyan modelos de atención descentralizados.
- Empresas como Bio Compression Systems y Tactile Medical han presentado dispositivos de IPC habilitados para aplicaciones diseñados para uso doméstico, que ofrecen funciones de seguimiento remoto y retroalimentación del médico.
- El enfoque de los proveedores de atención médica en reducir las readmisiones hospitalarias y mejorar los resultados de la atención crónica está acelerando la adopción de modelos de terapia domiciliaria.
- Además, la creciente disponibilidad de plataformas basadas en la nube y análisis impulsados por IA está permitiendo una planificación de terapia de compresión más precisa y personalizada en redes de atención médica de múltiples sitios.
Restricción/Desafío
“Altos costos de productos y cobertura de reembolso limitada”
- Un desafío importante en el mercado europeo de terapias de compresión es el alto costo asociado con los productos de compresión premium, en particular los dispositivos de compresión neumática avanzados y los sistemas portátiles inteligentes. Estos requieren una inversión inicial considerable, lo que los hace menos accesibles para pacientes con bajos ingresos y proveedores de atención médica más pequeños.
- Las políticas de reembolso para la terapia de compresión varían significativamente entre los pagadores y las provincias, con una cobertura limitada para ciertos dispositivos, especialmente cuando se utilizan en entornos domésticos, lo que crea disparidades en el acceso y la adopción.
Por ejemplo,
- Según un informe de 2024 de la Sociedad Europea de Flebología, el acceso a prendas de compresión inteligentes y dispositivos de compresión neumática intermitente (CNI) de uso doméstico sigue siendo desigual en toda Europa. En varios países, el reembolso es limitado o condicional, y a menudo requiere autorización previa o evidencia de enfermedad avanzada, lo que puede retrasar la intervención temprana y dificultar la adopción generalizada de terapias de compresión innovadoras.
- En Alemania, la variación provincial en los programas de cobertura del linfedema da como resultado un acceso inconsistente de los pacientes a soluciones de compresión de grado terapéutico.
- El cumplimiento normativo de las normas de seguridad y rendimiento de organismos como la FDA y Health Germany también agrega complejidad y tiempo al ingreso al mercado de nuevos productos.
Alcance del mercado de la terapia de compresión
El mercado está segmentado en cuatro segmentos notables según la técnica, el producto, la aplicación y el usuario final.
|
Segmentación |
Subsegmentación |
|
Por técnica |
|
|
Por producto
|
|
|
Por aplicación
|
|
|
Por el usuario final |
|
En 2025, se proyecta que la terapia de compresión estática domine el mercado con la mayor participación en el segmento técnico.
Se prevé que el segmento de terapia de compresión estática domine el mercado de terapias de compresión, con una cuota de mercado del 37,82 % en 2025, debido a su alta prevalencia y a la exigencia de precisión. Este dominio se debe a la creciente preferencia por soluciones de compresión fáciles de usar, rentables y fiables para el tratamiento de afecciones como varices, linfedema e insuficiencia venosa crónica.
Se espera que el tratamiento de venas varicosas represente la mayor participación durante el período de pronóstico en el mercado de aplicaciones.
En 2025, se prevé que el segmento de tratamiento de varices domine el mercado con la mayor cuota de mercado, un 31,11 %, debido a su alta prevalencia y a la exigencia de precisión. Esto se atribuye a la creciente prevalencia de varices, especialmente entre la población mayor y obesa. La mayor demanda de opciones de tratamiento no invasivas y rentables, como medias y vendajes de compresión, impulsa aún más el crecimiento del segmento.
Análisis regional del mercado de terapia de compresión
Alemania es el país dominante en el mercado de la terapia de compresión
- Alemania domina el mercado europeo de terapia de compresión y representa la mayor participación debido a su infraestructura de atención médica bien establecida, la adopción temprana de tecnologías médicas innovadoras y la fuerte presencia de actores clave del mercado especializados en el cuidado vascular y del linfedema.
- La alta prevalencia de trastornos venosos, como insuficiencia venosa crónica, venas varicosas y linfedema, junto con una creciente población de ancianos y diabéticos, está impulsando una mayor utilización de soluciones de terapia de compresión estática y dinámica en entornos clínicos y de atención domiciliaria.
- • Las principales empresas que operan en Europa, como BSN Medical (Alemania), SIGVARIS Group (Suiza) y Thuasne (Francia), ofrecen una cartera diversa de productos de terapia de compresión tecnológicamente avanzados con marcado CE destinados a mejorar los resultados clínicos y la comodidad del paciente.
- Las iniciativas gubernamentales en los países europeos, especialmente en Alemania, se centran en la atención preventiva, el manejo de las enfermedades venosas crónicas y las soluciones de tratamiento domiciliario. En combinación con marcos de reembolso favorables para prendas y dispositivos de compresión, estos esfuerzos consolidan el liderazgo de Alemania en el mercado europeo de terapias de compresión.
Se proyecta que el Reino Unido registre la tasa de crecimiento más alta
- Se espera que el Reino Unido registre el crecimiento más rápido en el mercado europeo de terapias de compresión. El sistema sanitario público del país, junto con un creciente énfasis en la prevención de enfermedades crónicas y la atención comunitaria, está impulsando la adopción de soluciones de terapia de compresión.
- Las inversiones estratégicas de las autoridades sanitarias provinciales en el manejo de afecciones como el linfedema, las úlceras venosas y la trombosis venosa profunda están acelerando la adopción de terapias de compresión estática y dinámica. La creciente concienciación sobre la intervención temprana y las opciones de tratamiento no invasivo impulsa aún más la demanda.
- La expansión de clínicas multidisciplinarias, centros de rehabilitación y servicios de atención médica domiciliaria en todo el Reino Unido está generando una sólida demanda de productos de compresión fáciles de usar y rentables, adecuados tanto para uso clínico como domiciliario. La colaboración entre ministerios de salud, grupos de apoyo a pacientes e instituciones académicas también está impulsando la investigación y la innovación en tecnologías de terapia de compresión.
Cuota de mercado de la terapia de compresión
El panorama competitivo del mercado ofrece detalles por competidor. Se incluye información general de la empresa, sus estados financieros, ingresos generados, potencial de mercado, inversión en investigación y desarrollo, nuevas iniciativas de mercado, presencia en Europa, plantas de producción, capacidad de producción, fortalezas y debilidades de la empresa, lanzamiento de productos, alcance y variedad de productos, y dominio de las aplicaciones. Los datos anteriores se refieren únicamente al enfoque de mercado de las empresas.
Los principales líderes del mercado que operan en el mercado son:
- 3M Health Care (EE. UU.)
- Tactile Medical (EE. UU.)
- Bio Compression Systems, Inc. (EE. UU.)
- Medi USA (Alemania/EE. UU.)
- Grupo Sigvaris (Suiza/EE. UU.)
- ArjoHuntleigh Inc. (Suecia)
- BSN Médica (Essity) (Alemania)
- JUZO (Julius Zorn Inc.) (Alemania/EE. UU.)
- Paul Hartmann AG (Alemania)
- Grupo Thuasne (Francia)
Últimos avances en el mercado europeo de terapia de compresión
- En octubre de 2023, Medi GmbH & Co. lanzó Medi Rehab, una media de compresión disponible en versiones de muslo y pantorrilla, con puntera abierta o cerrada. Especialmente indicada para el tratamiento conservador o postoperatorio de lesiones de tobillo o roturas del tendón de Aquiles, la media de pantorrilla con puntera abierta facilita y facilita su colocación y extracción.
SKU-
Obtenga acceso en línea al informe sobre la primera nube de inteligencia de mercado del mundo

- Panel de análisis de datos interactivo
- Panel de análisis de empresas para oportunidades con alto potencial de crecimiento
- Acceso de analista de investigación para personalización y consultas
- Análisis de la competencia con panel interactivo
- Últimas noticias, actualizaciones y análisis de tendencias
- Aproveche el poder del análisis de referencia para un seguimiento integral de la competencia
Tabla de contenido
1 INTRODUCCIÓN
1.1 OBJETIVOS DEL ESTUDIO
1.2 DEFINICIÓN DE MERCADO
1.3 DESCRIPCIÓN GENERAL DEL MERCADO EUROPEO DE TERAPIA DE COMPRESIÓN
1.4 LIMITACIONES
1.5 MERCADOS CUBIERTOS
2 SEGMENTACIÓN DEL MERCADO
2.1 MERCADOS CUBIERTOS
2.2 ÁMBITO GEOGRÁFICO
2,3 AÑOS CONSIDERADOS PARA EL ESTUDIO
2.4 MONEDA Y PRECIOS
2.5 MODELO DE VALIDACIÓN DE DATOS TRÍPODE DBMR
2.6 MODELADO MULTIVARIADO
2.7 ENTREVISTAS PRINCIPALES CON LÍDERES DE OPINIÓN CLAVE
2.8 CUADRÍCULA DE POSICIÓN DE MERCADO DBMR
2.9 CUADRÍCULA DE COBERTURA DE APLICACIONES DEL MERCADO
2.1 ANÁLISIS DE LA PARTICIPACIÓN DE LOS PROVEEDORES
2.11 FUENTES SECUNDARIAS
2.12 SUPUESTOS
3 RESUMEN EJECUTIVO
4 INFORMACIÓN PREMIUM
4.1 ANÁLISIS PESTAL
4.2 ANÁLISIS DE LAS CINCO FUERZAS DE PORTERS
4.3 DESGLOSE DEL ANÁLISIS DE COSTOS
4.4 ECONOMÍA DE LA SALUD
4.4.1 GASTO EN SALUD
4.4.2 GASTOS DE CAPITAL
4.4.3 TENDENCIAS DE CAPEX
4.4.4 ASIGNACIÓN DE CAPEX
4.4.5 FUENTES DE FINANCIACIÓN
4.4.6 PUNTOS DE REFERENCIA DE LA INDUSTRIA
4.4.7 RATIO DEL PIB EN EL PIB GENERAL
4.4.8 ESTRUCTURA DEL SISTEMA DE SALUD
4.4.9 POLÍTICAS GUBERNAMENTALES
4.4.10 DESARROLLO ECONÓMICO
4.5 INFORMACIÓN SOBRE LA INDUSTRIA
4.5.1 FACTORES MICRO Y MACROECONÓMICOS
4.5.2 MAPEO DE PERSPECTIVAS DE PENETRACIÓN Y CRECIMIENTO
4.5.3 ESTRATEGIAS CLAVE DE PRECIOS
4.6 SEGUIMIENTO DE INNOVACIÓN Y ANÁLISIS ESTRATÉGICO
4.6.1 ANÁLISIS DE GRANDES ACUERDOS Y ALIANZAS ESTRATÉGICAS
4.6.1.1 EMPRESAS CONJUNTAS
4.6.1.2 FUSIONES Y ADQUISICIONES
4.6.1.3 LICENCIAS Y ASOCIACIONES
4.6.1.4 COLABORACIONES TECNOLÓGICAS
4.6.1.5 DESINVERSIONES ESTRATÉGICAS
4.6.2 NÚMERO DE PRODUCTOS EN DESARROLLO
4.6.3 ETAPA DE DESARROLLO
4.6.4 CRONOGRAMAS E HITOS
4.6.5 ESTRATEGIAS Y METODOLOGÍAS DE INNOVACIÓN
4.6.6 EVALUACIÓN Y MITIGACIÓN DE RIESGOS
4.6.7 PERSPECTIVAS FUTURAS
4.7 ANÁLISIS DEL MAPA DE OPORTUNIDADES
4.8 ANÁLISIS DE PATENTES –
4.8.1 CALIDAD Y RESISTENCIA DE LA PATENTE
4.8.2 FAMILIAS DE PATENTES
4.8.3 LICENCIAS Y COLABORACIONES
4.8.4 PANORAMA COMPETITIVO
4.8.5 ESTRATEGIA Y GESTIÓN DE LA PROPIEDAD INTELECTUAL
4.8.6 OTRAS OBSERVACIONES
4.9 MARCO DE REEMBOLSO
4.1 ECOSISTEMA DE LA CADENA DE SUMINISTRO
4.10.1 EMPRESAS DESTACADAS
4.10.2 PEQUEÑAS Y MEDIANAS EMPRESAS
4.10.3 USUARIOS FINALES
4.11 HOJA DE RUTA TECNOLÓGICA
4.12 ARANCELES E IMPACTO EN EL MERCADO
4.12.1 TASA(S) ARANCELARIA(S) VIGENTES EN LOS MERCADOS DE LOS 5 PAÍSES PRINCIPALES
4.13 PERSPECTIVAS: PRODUCCIÓN LOCAL VS. DEPENDENCIA DE LAS IMPORTACIONES
4.14 DINÁMICA DE LOS CRITERIOS DE SELECCIÓN DE PROVEEDORES
4.15 IMPACTO EN LA CADENA DE SUMINISTRO
4.15.1 ADQUISICIÓN DE MATERIA PRIMA
4.15.2 FABRICACIÓN Y PRODUCCIÓN
4.15.3 LOGÍSTICA Y DISTRIBUCIÓN
4.15.4 PRECIOS DE LANZAMIENTO Y POSICIÓN DEL MERCADO
4.16 PARTICIPANTES DE LA INDUSTRIA: ACCIONES PROACTIVAS
4.16.1 OPTIMIZACIÓN DE LA CADENA DE SUMINISTRO
4.16.2 ESTABLECIMIENTOS DE EMPRESAS CONJUNTAS
4.17 IMPACTO EN LOS PRECIOS
4.18 INCLINACIÓN REGULADORA
4.18.1 SITUACIÓN GEOPOLÍTICA
4.18.2 ASOCIACIONES COMERCIALES ENTRE PAÍSES
4.18.2.1 TRATADOS DE LIBRE COMERCIO:
4.18.2.2 ESTABLECIMIENTOS DE ALIANZAS:
4.18.3 ACREDITACIÓN DE ESTADO (INCLUYENDO MFTN)
4.18.4 CURSO DE CORRECCIÓN DOMÉSTICA
4.18.4.1 ESQUEMAS DE INCENTIVOS PARA IMPULSAR LA PRODUCCIÓN:
4.18.4.2 ESTABLECIMIENTO DE ZONAS ECONÓMICAS ESPECIALES / PARQUES INDUSTRIALES:
4.19 ÍNDICE DE PRECIOS
5 MARCO REGULATORIO
6 PANORAMA GENERAL DEL MERCADO
6.1 CONDUCTORES
6.1.1 AUMENTO DE LA PREVALENCIA DE LOS TRASTORNOS VENOSOS CRÓNICOS A NIVEL MUNDIAL
6.1.2 AVANCES TECNOLÓGICOS E INNOVACIÓN DE PRODUCTOS
6.1.3 AUMENTO DE LESIONES Y ACCIDENTES DEPORTIVOS
6.1.4 AUMENTAR LA CONCIENCIA SOBRE LOS BENEFICIOS DE LA TERAPIA
6.2 RESTRICCIONES
6.2.1 REEMBOLSO LIMITADO Y COBERTURA DE SEGURO
6.2.2 DISPONIBILIDAD DE TRATAMIENTO ALTERNATIVO
6.3 OPORTUNIDADES
6.3.1 CRECIMIENTO DE LA TERAPIA EN EL HOGAR
6.3.2 CUIDADOS POSTOPURÍGICOS Y REHABILITACIÓN
6.3.3 AUMENTO DE LAS ENFERMEDADES RELACIONADAS CON EL ESTILO DE VIDA
6.4 DESAFÍOS
6.4.1 FALTA DE PROTOCOLOS DE TERAPIA ESTANDARIZADOS
6.4.2 GARANTIZAR UN AJUSTE PRECISO DEL PRODUCTO Y UNA APLICACIÓN CORRECTA
7 MERCADO EUROPEO DE TERAPIA DE COMPRESIÓN, POR TÉCNICA DE PRODUCTO
7.1 DESCRIPCIÓN GENERAL
7.2 TERAPIA DE COMPRESIÓN ESTÁTICA
7.2.1 MEDIAS DE COMPRESIÓN
7.2.2 VENDAS DE COMPRESIÓN
7.2.3 MANGUITOS DE COMPRESIÓN
7.2.4 ENVOLTURAS DE COMPRESIÓN
7.2.5 GUANTES/MANGUITOS DE COMPRESIÓN
7.3 TERAPIA DE COMPRESIÓN DINÁMICA
7.3.1 DISPOSITIVOS DE COMPRESIÓN NEUMÁTICA
7.3.2 DISPOSITIVOS DE TERAPIA DE COMPRESIÓN ADAPTATIVA
8 MERCADO EUROPEO DE TERAPIA DE COMPRESIÓN, POR TIPO DE PRODUCTO
8.1 DESCRIPCIÓN GENERAL
8.2 VENDAS DE COMPRESIÓN
8.2.1 VENDAS ELÁSTICAS CORTAS
8.2.2 VENDAS ELÁSTICAS LARGAS
8.2.3 VENDAS DE COMPRESIÓN MULTICAPA
8.3 PRENDAS DE COMPRESIÓN PARA LINFEDEMA
8.3.1 PRENDAS PARA LAS PIERNAS
8.3.2 MANGAS PARA BRAZOS
8.3.3 GUANTES DE MANO
8.3.4 PRENDAS PARA TORSO/TRONCO
8.3.5 PRENDAS PARA LA CARA/CABEZA
8.4 MEDIAS DE COMPRESIÓN PARA ENFERMEDADES VENOSAS
8.4.1 MEDIAS POR DEBAJO DE LA RODILLA
8.4.2 MEDIAS HASTA EL MUSLO
8.4.3 Pantimedias/medias de pierna entera
8.4.4 MEDIAS DE MATERNIDAD
8.5 ENVOLTURAS DE COMPRESIÓN
8.6 DISPOSITIVOS DE COMPRESIÓN NEUMÁTICA
8.7 MEDIAS Y GUANTELES DE COMPRESIÓN
9 MERCADO EUROPEO DE TERAPIA DE COMPRESIÓN, POR APLICACIÓN
9.1 DESCRIPCIÓN GENERAL
9.2 VENAS VARICOSAS
9.3 LINFEDEMA
9.4 INSUFICIENCIA VENOSA CRÓNICA (IVC)
9.5 TROMBOSIS VENOSA PROFUNDA (TVP)
9.6 ÚLCERAS VENOSAS DE LA PIERNA
9.7 CUIDADO DE HERIDAS
9.8 MANEJO DE LESIONES DEPORTIVAS
10 MERCADO EUROPEO DE TERAPIA DE COMPRESIÓN, POR GRUPO DE PACIENTES
10.1 DESCRIPCIÓN GENERAL
10.2 ADULT
10.3 GERIÁTRICO
10.4 PEDIÁTRICO
11 MERCADO EUROPEO DE TERAPIA DE COMPRESIÓN, POR NIVEL DE COMPRESIÓN
11.1 DESCRIPCIÓN GENERAL
11.2 COMPRESIÓN MODERADA
11.3 FUERTE COMPRESIÓN
11.4 COMPRESIÓN LEVE
11.5 COMPRESIÓN MUY FUERTE
12 MERCADO EUROPEO DE TERAPIA DE COMPRESIÓN, POR CANALES DE DISTRIBUCIÓN
12.1 DESCRIPCIÓN GENERAL
12.2 HOSPITALES
12.2.1 VENDAS
12.2.2 MEDIAS DE COMPRESIÓN POSTOPERATORIA
12.2.3 DISPOSITIVOS DE COMPRESIÓN NEUMÁTICA
12.3 FARMACIAS MINORISTAS
12.3.1 MEDIAS DE COMPRESIÓN LEVE A MODERADA
12.3.2 VENDAS DE COMPRESIÓN
12.3.3 MANGAS Y GUANTELETOS
12.4 PLATAFORMAS DE COMERCIO ELECTRÓNICO
12.4.1 MEDIAS Y PRENDAS DE COMPRESIÓN
12.4.2 ENVOLTURAS DE COMPRESIÓN
12.4.3 MANGAS, GUANTES Y CALCETINES
12.4.4 DISPOSITIVOS NEUMÁTICOS PORTÁTILES
12.5 CLÍNICAS ESPECIALIZADAS
12.5.1 PRENDAS DE COMPRESIÓN DE ALTA PRESIÓN
12.5.2 BOMBAS DE COMPRESIÓN NEUMÁTICAS
12.5.3 ENVOLTURAS PERSONALIZADAS
12.6 ALMACENES DE DISPOSITIVOS MÉDICOS
12.6.1 MEDIAS DE COMPRESIÓN
12.6.2 VENDAS DE COMPRESIÓN
12.6.3 ENVOLTURAS DE COMPRESIÓN
12.6.4 DISPOSITIVOS DE COMPRESIÓN NEUMÁTICA
12.6.5 SISTEMAS DE COMPRESIÓN ADAPTATIVA
12.7 PROVEEDORES DE ATENCIÓN MÉDICA A DOMICILIO
12.7.1 ENVOLTURAS DE COMPRESIÓN
12.7.2 MANGAS Y PRENDAS
12.7.3 VENDAS
12.7.4 BOMBAS NEUMÁTICAS (PORTÁTILES)
12.8 RESIDENCIAS DE ANCIANOS/CENTROS DE CUIDADOS A LARGO PLAZO
12.8.1 ENVOLTURAS DE COMPRESIÓN
12.8.2 MANGAS Y GUANTELETOS
12.8.3 PRENDAS ADAPTATIVAS
13 MERCADO EUROPEO DE TERAPIA DE COMPRESIÓN, POR REGIÓN
13.1 EUROPA
13.1.1 ALEMANIA
13.1.2 FRANCIA
13.1.3 Reino Unido
13.1.4 ITALIA
13.1.5 ESPAÑA
13.1.6 SUIZA
13.1.7 RUSIA
13.1.8 BÉLGICA
13.1.9 PAÍSES BAJOS
13.1.10 TURQUÍA
13.1.11 RESTO DE EUROPA
14 MERCADO EUROPEO DE TERAPIA DE COMPRESIÓN: PANORAMA EMPRESARIAL
14.1 ANÁLISIS DE ACCIONES DE EMPRESAS: EUROPA
15 ANÁLISIS FODA
16 PERFILES DE EMPRESAS
16.1 SOLVENTUM
16.1.1 INSTANTÁNEA DE LA EMPRESA
16.1.2 ANÁLISIS DE INGRESOS
16.1.3 ANÁLISIS DE LAS ACCIONES DE LA EMPRESA
16.1.4 PORTAFOLIO DE PRODUCTOS
16.1.5 DESARROLLO RECIENTE
16.2 SALUD CARDENAL
16.2.1 INSTANTÁNEA DE LA EMPRESA
16.2.2 ANÁLISIS DE INGRESOS
16.2.3 ANÁLISIS DE LAS ACCIONES DE LA EMPRESA
16.2.4 PORTAFOLIO DE PRODUCTOS
16.2.5 DESARROLLO RECIENTE
16.3 SMITH+SOBRINO
16.3.1 INSTANTÁNEA DE LA EMPRESA
16.3.2 ANÁLISIS DE INGRESOS
16.3.3 ANÁLISIS DE LAS ACCIONES DE LA EMPRESA
16.3.4 PORTAFOLIO DE PRODUCTOS
16.3.5 DESARROLLO RECIENTE
16.4 ESSITY AKTIEBOLAG (PÚBLICO)
16.4.1 INSTANTÁNEA DE LA EMPRESA
16.4.2 ANÁLISIS DE INGRESOS
16.4.3 ANÁLISIS DE LAS ACCIONES DE LA EMPRESA
16.4.4 PORTAFOLIO DE PRODUCTOS
16.4.5 DESARROLLO RECIENTE
16.5 PAUL HARTMANN AG
16.5.1 INSTANTÁNEA DE LA EMPRESA
16.5.2 ANÁLISIS DE INGRESOS
16.5.3 ANÁLISIS DE LAS ACCIONES DE LA EMPRESA
16.5.4 PORTAFOLIO DE PRODUCTOS
16.5.5 DESARROLLO RECIENTE
16.6 ADIDAS AG
16.6.1 INSTANTÁNEA DE LA EMPRESA
16.6.2 ANÁLISIS DE INGRESOS
16.6.3 PORTAFOLIO DE PRODUCTOS
16.6.4 DESARROLLO RECIENTE
16.7 AIROS MEDICAL, INC.
16.7.1 INSTANTÁNEA DE LA EMPRESA
16.7.2 PORTAFOLIO DE PRODUCTOS
16.7.3 DESARROLLO RECIENTE
16.8 ARJO
16.8.1 INSTANTÁNEA DE LA EMPRESA
16.8.2 ANÁLISIS DE INGRESOS
16.8.3 PORTAFOLIO DE PRODUCTOS
16.8.4 DESARROLLOS RECIENTES
16.9 BAUERFEIND
16.9.1 INSTANTÁNEA DE LA EMPRESA
16.9.2 PORTAFOLIO DE PRODUCTOS
16.9.3 DESARROLLO RECIENTE
16.1 SISTEMAS DE BIOCOMPRESIÓN
16.10.1 INSTANTÁNEA DE LA EMPRESA
16.10.2 PORTAFOLIO DE PRODUCTOS
16.10.3 DESARROLLO RECIENTE
16.11 CALCE GTSRL
16.11.1 INSTANTÁNEA DE LA EMPRESA
16.11.2 PORTAFOLIO DE PRODUCTOS
16.11.3 DESARROLLO RECIENTE
16.12 GRUPO CONVATEC PLC
16.12.1 INSTANTÁNEA DE LA EMPRESA
16.12.2 PORTAFOLIO DE PRODUCTOS
16.12.3 DESARROLLO RECIENTE
16.13 CORPORACIÓN ENOVIS
16.13.1 INSTANTÁNEA DE LA EMPRESA
16.13.2 ANÁLISIS DE INGRESOS
16.13.3 CARTERA DE MARCAS
16.13.4 DESARROLLOS RECIENTES
16.14 GENERACIÓN
16.14.1 INSTANTÁNEA DE LA EMPRESA
16.14.2 ANÁLISIS DE INGRESOS
16.14.3 PORTAFOLIO DE PRODUCTOS
16.14.4 DESARROLLO RECIENTE
16.15 HUNTLEIGH HEALTHCARE LIMITADA
16.15.1 INSTANTÁNEA DE LA EMPRESA
16.15.2 PORTAFOLIO DE PRODUCTOS
16.15.3 DESARROLLO RECIENTE
16.16 JUZO
16.16.1 INSTANTÁNEA DE LA EMPRESA
16.16.2 PORTAFOLIO DE PRODUCTOS
16.16.3 DESARROLLO RECIENTE
16.17 LOHMANN & RAUSCHER GMBH & CO.KG
16.17.1 INSTANTÁNEA DE LA EMPRESA
16.17.2 PORTAFOLIO DE PRODUCTOS
16.17.3 DESARROLLO RECIENTE
16.18 MCKESSON MÉDICO-QUIRÚRGICO INC.
16.18.1 INSTANTÁNEA DE LA EMPRESA
16.18.2 ANÁLISIS DE INGRESOS
16.18.3 PORTAFOLIO DE PRODUCTOS
16.18.4 DESARROLLO RECIENTE
16.19 MEDLINE INDUSTRIES, LP
16.19.1 INSTANTÁNEA DE LA EMPRESA
16.19.2 PORTAFOLIO DE PRODUCTOS
16.19.3 ACONTECIMIENTOS RECIENTES
16.2 MEDI GMBH & CO. KG
16.20.1 INSTANTÁNEA DE LA EMPRESA
16.20.2 PORTAFOLIO DE PRODUCTOS
16.20.3 DESARROLLO RECIENTE
16.21 MEGO AFEK LTD.
16.21.1 INSTANTÁNEA DE LA EMPRESA
16.21.2 PORTAFOLIO DE PRODUCTOS
16.21.3 DESARROLLO RECIENTE
16.22 MÖLNLYCKE AB
16.22.1 INSTANTÁNEA DE LA EMPRESA
16.22.2 PORTAFOLIO DE PRODUCTOS
16.22.3 DESARROLLO RECIENTE
16.23 NIKE, INC.
16.23.1 INSTANTÁNEA DE LA EMPRESA
16.23.2 ANÁLISIS DE INGRESOS
16.23.3 PORTAFOLIO DE PRODUCTOS
16.23.4 DESARROLLO RECIENTE
16.24 OFA BAMBERG GMBH
16.24.1 INSTANTÁNEA DE LA EMPRESA
16.24.2 PORTAFOLIO DE PRODUCTOS
16.24.3 DESARROLLO RECIENTE
16.25 ÖSSUR
16.25.1 INSTANTÁNEA DE LA EMPRESA
16.25.2 INFORMACIÓN FINANCIERA RECIENTE
16.25.3 PORTAFOLIO DE PRODUCTOS
16.25.4 DESARROLLO RECIENTE
16.26 GRUPO SIGVARIS
16.26.1 INSTANTÁNEA DE LA EMPRESA
16.26.2 PORTAFOLIO DE PRODUCTOS
16.26.3 DESARROLLO RECIENTE
16.27 MEDICINA TÁCTIL
16.27.1 INSTANTÁNEA DE LA EMPRESA
16.27.2 ANÁLISIS DE INGRESOS
16.27.3 PORTAFOLIO DE PRODUCTOS
16.27.4 DESARROLLO RECIENTE
16.28 THERMOTEK
16.28.1 INSTANTÁNEA DE LA EMPRESA
16.28.2 PORTAFOLIO DE PRODUCTOS
16.28.3 DESARROLLO RECIENTE
16.29 THUASNE, SAS
16.29.1 INSTANTÁNEA DE LA EMPRESA
16.29.2 PORTAFOLIO DE PRODUCTOS
16.29.3 DESARROLLO RECIENTE
16.3 ZIMMER BIOMET
16.30.1 INSTANTÁNEA DE LA EMPRESA
16.30.2 ANÁLISIS DE INGRESOS
16.30.3 PORTAFOLIO DE PRODUCTOS
16.30.4 ACONTECIMIENTOS RECIENTES
17 CUESTIONARIO
18 INFORMES RELACIONADOS
Lista de Tablas
TABLA 1 MERCADO EUROPEO DE TERAPIA DE COMPRESIÓN, POR TÉCNICA DE PRODUCTO, 2018-2032 (MILES DE USD)
TABLA 2 TERAPIA DE COMPRESIÓN ESTÁTICA EN EL MERCADO DE TERAPIA DE COMPRESIÓN EN EUROPA, POR REGIÓN, 2018-2032 (MILES DE USD)
TABLA 3 TERAPIA DE COMPRESIÓN ESTÁTICA EN EL MERCADO DE TERAPIA DE COMPRESIÓN EN EUROPA, POR TIPO, 2018-2032 (MILES DE USD)
TABLA 4 TERAPIA DE COMPRESIÓN DINÁMICA EN EUROPA EN EL MERCADO DE TERAPIA DE COMPRESIÓN, POR REGIÓN, 2018-2032 (MILES DE USD)
TABLA 5 TERAPIA DE COMPRESIÓN DINÁMICA EN EUROPA EN EL MERCADO DE TERAPIA DE COMPRESIÓN, POR TIPO, 2018-2032 (MILES DE USD)
TABLA 6 MERCADO EUROPEO DE TERAPIA DE COMPRESIÓN, POR TIPO DE PRODUCTO, 2018-2032 (MILES DE USD)
TABLA 7 MERCADO EUROPEO DE VENDAS DE COMPRESIÓN EN TERAPIA DE COMPRESIÓN, POR REGIÓN, 2018-2032 (MILES DE USD)
TABLA 8 VENDAS DE COMPRESIÓN EN EL MERCADO EUROPEO DE TERAPIA DE COMPRESIÓN, POR TIPO, 2018-2032 (MILES DE USD)
TABLA 9 MERCADO EUROPEO DE PRENDAS DE COMPRESIÓN PARA LINFEDEMA EN TERAPIA DE COMPRESIÓN, POR REGIÓN, 2018-2032 (MILES DE USD)
TABLA 10 PRENDAS DE COMPRESIÓN PARA LINFEDEMA EN EL MERCADO EUROPEO DE TERAPIA DE COMPRESIÓN, POR TIPO, 2018-2032 (MILES DE USD)
TABLA 11 MEDIAS DE COMPRESIÓN PARA ENFERMEDADES VENOSAS EN EL MERCADO DE TERAPIA DE COMPRESIÓN EN EUROPA, POR REGIÓN, 2018-2032 (MILES DE USD)
TABLA 12 MEDIAS DE COMPRESIÓN PARA ENFERMEDADES VENOSAS EN EL MERCADO EUROPEO DE TERAPIA DE COMPRESIÓN, POR TIPO, 2018-2032 (MILES DE USD)
TABLA 13 MERCADO EUROPEO DE VENDAS DE COMPRESIÓN EN TERAPIA DE COMPRESIÓN, POR REGIÓN, 2018-2032 (MILES DE USD)
TABLA 14 DISPOSITIVOS DE COMPRESIÓN NEUMÁTICA EN EL MERCADO DE TERAPIA DE COMPRESIÓN EUROPEA, POR REGIÓN, 2018-2032 (MILES DE USD)
TABLA 15 MERCADO EUROPEO DE MEDIAS Y GUANTELES DE COMPRESIÓN EN TERAPIA DE COMPRESIÓN, POR REGIÓN, 2018-2032 (MILES DE USD)
TABLA 16 MERCADO EUROPEO DE TERAPIA DE COMPRESIÓN, POR APLICACIÓN, 2018-2032 (MILES DE USD)
TABLA 17 MERCADO EUROPEO DE VENAS VARICOSAS EN TERAPIA DE COMPRESIÓN, POR REGIÓN, 2018-2032 (MILES DE USD)
TABLA 18 MERCADO EUROPEO DE LINFEDEMA EN TERAPIA DE COMPRESIÓN, POR REGIÓN, 2018-2032 (MILES DE USD)
TABLA 19 MERCADO EUROPEO DE INSUFICIENCIA VENOSA CRÓNICA (IVC) EN TERAPIA DE COMPRESIÓN, POR REGIÓN, 2018-2032 (MILES DE USD)
TABLA 20 MERCADO EUROPEO DE TERAPIA DE COMPRESIÓN PARA LA TROMBOSIS VENOSA PROFUNDA (TVP), POR REGIÓN, 2018-2032 (MILES DE USD)
TABLA 21 ÚLCERAS VENOSAS DE PIERNA EN EL MERCADO EUROPEO DE TERAPIA DE COMPRESIÓN, POR REGIÓN, 2018-2032 (MILES DE USD)
TABLA 22 MERCADO EUROPEO DE CUIDADO DE HERIDAS EN TERAPIA DE COMPRESIÓN, POR REGIÓN, 2018-2032 (MILES DE USD)
TABLA 23 MERCADO EUROPEO DE GESTIÓN DE LESIONES DEPORTIVAS EN TERAPIA DE COMPRESIÓN, POR REGIÓN, 2018-2032 (MILES DE USD)
TABLA 24 MERCADO EUROPEO DE TERAPIA DE COMPRESIÓN, POR GRUPO DE PACIENTES, 2018-2032 (MILES DE USD)
TABLA 25 MERCADO EUROPEO DE ADULTOS EN TERAPIA DE COMPRESIÓN, POR REGIÓN, 2018-2032 (MILES DE USD)
TABLA 26 MERCADO EUROPEO DE TERAPIA DE COMPRESIÓN GERIÁTRICA, POR REGIÓN, 2018-2032 (MILES DE USD)
TABLA 27 MERCADO EUROPEO DE TERAPIA DE COMPRESIÓN PEDIÁTRICA, POR REGIÓN, 2018-2032 (MILES DE USD)
TABLA 28 MERCADO EUROPEO DE TERAPIA DE COMPRESIÓN, POR NIVEL DE COMPRESIÓN, 2018-2032 (MILES DE USD)
TABLA 29 COMPRESIÓN MODERADA EN EL MERCADO DE TERAPIA DE COMPRESIÓN EN EUROPA, POR REGIÓN, 2018-2032 (MILES DE USD)
TABLA 30 FUERTE COMPRESIÓN EN EL MERCADO DE TERAPIA DE COMPRESIÓN EN EUROPA, POR REGIÓN, 2018-2032 (MILES DE USD)
TABLA 31 MERCADO EUROPEO DE TERAPIA DE COMPRESIÓN LIGERA, POR REGIÓN, 2018-2032 (MILES DE USD)
TABLA 32 EUROPA FUERTE COMPRESIÓN EN EL MERCADO DE TERAPIA DE COMPRESIÓN, POR REGIÓN, 2018-2032 (MILES DE USD)
TABLA 33 MERCADO EUROPEO DE TERAPIA DE COMPRESIÓN, POR CANALES DE DISTRIBUCIÓN, 2018-2032 (MILES DE USD)
TABLA 34 HOSPITALES EUROPEOS EN EL MERCADO DE TERAPIA DE COMPRESIÓN, POR REGIÓN, 2018-2032 (MILES DE USD)
TABLA 35 HOSPITALES EUROPEOS EN EL MERCADO DE TERAPIA DE COMPRESIÓN, POR TIPO, 2018-2032 (MILES DE USD)
TABLA 36 FARMACIAS MINORISTAS EN EL MERCADO EUROPEO DE TERAPIA DE COMPRESIÓN, POR REGIÓN, 2018-2032 (MILES DE USD)
TABLA 37 FARMACIAS MINORISTAS EN EUROPA EN EL MERCADO DE TERAPIA DE COMPRESIÓN, POR TIPO, 2018-2032 (MILES DE USD)
TABLA 38 PLATAFORMAS DE COMERCIO ELECTRÓNICO EN EUROPA EN EL MERCADO DE TERAPIA DE COMPRESIÓN, POR REGIÓN, 2018-2032 (MILES DE USD)
TABLA 39 PLATAFORMAS DE COMERCIO ELECTRÓNICO EUROPEAS EN EL MERCADO DE TERAPIA DE COMPRESIÓN, POR TIPO, 2018-2032 (MILES DE USD)
TABLA 40 CLÍNICAS ESPECIALIZADAS EN EL MERCADO DE TERAPIA DE COMPRESIÓN EN EUROPA, POR REGIÓN, 2018-2032 (MILES DE USD)
TABLA 41 CLÍNICAS ESPECIALIZADAS EN EL MERCADO EUROPEO DE TERAPIA DE COMPRESIÓN, POR TIPO, 2018-2032 (MILES DE USD)
TABLA 42 TIENDAS DE DISPOSITIVOS MÉDICOS EN EL MERCADO DE TERAPIA DE COMPRESIÓN DE EUROPA, POR REGIÓN, 2018-2032 (MILES DE USD)
TABLA 43 TIENDAS DE DISPOSITIVOS MÉDICOS EN EL MERCADO EUROPEO DE TERAPIA DE COMPRESIÓN, POR TIPO, 2018-2032 (MILES DE USD)
TABLA 44 PROVEEDORES DE ATENCIÓN MÉDICA DOMICILIARIA EN EUROPA EN EL MERCADO DE TERAPIA DE COMPRESIÓN, POR REGIÓN, 2018-2032 (MILES DE USD)
TABLA 45 PROVEEDORES DE ATENCIÓN MÉDICA DOMICILIARIA EN EUROPA EN EL MERCADO DE TERAPIA DE COMPRESIÓN, POR TIPO, 2018-2032 (MILES DE USD)
TABLA 46 RESIDENCIAS DE ANCIANOS/CENTROS DE CUIDADOS DE LARGA DURACIÓN EN EUROPA EN EL MERCADO DE TERAPIA DE COMPRESIÓN, POR REGIÓN, 2018-2032 (MILES DE USD)
TABLA 47 RESIDENCIAS DE ANCIANOS/CENTROS DE CUIDADOS DE LARGA DURACIÓN EN EUROPA EN EL MERCADO DE TERAPIA DE COMPRESIÓN, POR TIPO, 2018-2032 (MILES DE USD)
TABLA 48 MERCADO EUROPEO DE TERAPIA DE COMPRESIÓN, POR PAÍS, 2018-2032 (MILES DE USD)
TABLA 49 MERCADO EUROPEO DE TERAPIA DE COMPRESIÓN, POR TÉCNICA DE PRODUCTO, 2018-2032 (MILES DE USD)
TABLA 50 TERAPIA DE COMPRESIÓN ESTÁTICA EN EL MERCADO DE TERAPIA DE COMPRESIÓN EN EUROPA, POR TIPO, 2018-2032 (MILES DE USD)
TABLA 51 TERAPIA DE COMPRESIÓN DINÁMICA EN EUROPA, MERCADO DE TERAPIA DE COMPRESIÓN, POR TIPO, 2018-2032 (MILES DE USD)
TABLA 52 MERCADO EUROPEO DE TERAPIA DE COMPRESIÓN, POR TIPO DE PRODUCTO, 2018-2032 (MILES DE USD)
TABLA 53 VENDAS DE COMPRESIÓN EN EL MERCADO EUROPEO DE TERAPIA DE COMPRESIÓN, POR TIPO, 2018-2032 (MILES DE USD)
TABLA 54 PRENDAS DE COMPRESIÓN PARA LINFEDEMA EN EL MERCADO DE TERAPIA DE COMPRESIÓN EUROPEA, POR TIPO, 2018-2032 (MILES DE USD)
TABLA 55 MEDIAS DE COMPRESIÓN PARA ENFERMEDADES VENOSAS EN EL MERCADO EUROPEO DE TERAPIA DE COMPRESIÓN, POR TIPO, 2018-2032 (MILES DE USD)
TABLA 56 MERCADO EUROPEO DE TERAPIA DE COMPRESIÓN, POR APLICACIÓN, 2018-2032 (MILES DE USD)
TABLA 57 MERCADO EUROPEO DE TERAPIA DE COMPRESIÓN, POR GRUPO DE PACIENTES, 2018-2032 (MILES DE USD)
TABLA 58 MERCADO EUROPEO DE TERAPIA DE COMPRESIÓN, POR NIVEL DE COMPRESIÓN, 2018-2032 (MILES DE USD)
TABLA 59 MERCADO EUROPEO DE TERAPIA DE COMPRESIÓN, POR CANALES DE DISTRIBUCIÓN, 2018-2032 (MILES DE USD)
TABLA 60 HOSPITALES EUROPEOS EN EL MERCADO DE TERAPIA DE COMPRESIÓN, POR TIPO, 2018-2032 (MILES DE USD)
TABLA 61 FARMACIAS MINORISTAS EN EUROPA EN EL MERCADO DE TERAPIA DE COMPRESIÓN, POR TIPO, 2018-2032 (MILES DE USD)
TABLA 62 PLATAFORMAS DE COMERCIO ELECTRÓNICO EUROPEAS EN EL MERCADO DE TERAPIA DE COMPRESIÓN, POR TIPO, 2018-2032 (MILES DE USD)
TABLA 63 CLÍNICAS ESPECIALIZADAS EN EL MERCADO EUROPEO DE TERAPIA DE COMPRESIÓN, POR TIPO, 2018-2032 (MILES DE USD)
TABLA 64 TIENDAS DE DISPOSITIVOS MÉDICOS EN EL MERCADO EUROPEO DE TERAPIA DE COMPRESIÓN, POR TIPO, 2018-2032 (MILES DE USD)
TABLA 65 PROVEEDORES DE ATENCIÓN MÉDICA DOMICILIARIA EN EUROPA EN EL MERCADO DE TERAPIA DE COMPRESIÓN, POR TIPO, 2018-2032 (MILES DE USD)
TABLA 66 RESIDENCIAS DE ANCIANOS/CENTROS DE CUIDADOS DE LARGA DURACIÓN EN EUROPA EN EL MERCADO DE TERAPIA DE COMPRESIÓN, POR TIPO, 2018-2032 (MILES DE USD)
TABLA 67 MERCADO DE TERAPIA DE COMPRESIÓN DE ALEMANIA, POR TÉCNICA DE PRODUCTO, 2018-2032 (MILES DE USD)
TABLA 68 TERAPIA DE COMPRESIÓN ESTÁTICA EN EL MERCADO DE TERAPIA DE COMPRESIÓN DE ALEMANIA, POR TIPO, 2018-2032 (MILES DE USD)
TABLA 69 TERAPIA DE COMPRESIÓN DINÁMICA EN ALEMANIA EN EL MERCADO DE TERAPIA DE COMPRESIÓN, POR TIPO, 2018-2032 (MILES DE USD)
TABLA 70 MERCADO DE TERAPIA DE COMPRESIÓN DE ALEMANIA, POR TIPO DE PRODUCTO, 2018-2032 (MILES DE USD)
TABLA 71 VENDAS DE COMPRESIÓN EN EL MERCADO DE TERAPIA DE COMPRESIÓN DE ALEMANIA, POR TIPO, 2018-2032 (MILES DE USD)
TABLA 72 ALEMANIA: PRENDAS DE COMPRESIÓN PARA LINFEDEMA EN EL MERCADO DE TERAPIA DE COMPRESIÓN, POR TIPO, 2018-2032 (MILES DE USD)
TABLA 73 MEDIAS DE COMPRESIÓN PARA ENFERMEDADES VENOSAS EN EL MERCADO DE TERAPIA DE COMPRESIÓN DE ALEMANIA, POR TIPO, 2018-2032 (MILES DE USD)
TABLA 74 MERCADO DE TERAPIA DE COMPRESIÓN DE ALEMANIA, POR APLICACIÓN, 2018-2032 (MILES DE USD)
TABLA 75 MERCADO DE TERAPIA DE COMPRESIÓN DE ALEMANIA, POR GRUPO DE PACIENTES, 2018-2032 (MILES DE USD)
TABLA 76 MERCADO DE TERAPIA DE COMPRESIÓN DE ALEMANIA, POR NIVEL DE COMPRESIÓN, 2018-2032 (MILES DE USD)
TABLA 77 MERCADO DE TERAPIA DE COMPRESIÓN DE ALEMANIA, POR CANALES DE DISTRIBUCIÓN, 2018-2032 (MILES DE USD)
TABLA 78 HOSPITALES DE ALEMANIA EN EL MERCADO DE TERAPIA DE COMPRESIÓN, POR TIPO, 2018-2032 (MILES DE USD)
TABLA 79 FARMACIAS MINORISTAS DE ALEMANIA EN EL MERCADO DE TERAPIA DE COMPRESIÓN, POR TIPO, 2018-2032 (MILES DE USD)
TABLA 80 PLATAFORMAS DE COMERCIO ELECTRÓNICO DE ALEMANIA EN EL MERCADO DE TERAPIA DE COMPRESIÓN, POR TIPO, 2018-2032 (MILES DE USD)
TABLA 81 CLÍNICAS ESPECIALIZADAS EN EL MERCADO DE TERAPIA DE COMPRESIÓN DE ALEMANIA, POR TIPO, 2018-2032 (MILES DE USD)
TABLA 82 TIENDAS DE DISPOSITIVOS MÉDICOS EN EL MERCADO DE TERAPIA DE COMPRESIÓN DE ALEMANIA, POR TIPO, 2018-2032 (MILES DE USD)
TABLA 83 PROVEEDORES DE ATENCIÓN MÉDICA DOMICILIARIA EN ALEMANIA EN EL MERCADO DE TERAPIA DE COMPRESIÓN, POR TIPO, 2018-2032 (MILES DE USD)
TABLA 84 RESIDENCIAS DE ANCIANOS/CENTROS DE CUIDADOS DE LARGA DURACIÓN EN EL MERCADO DE TERAPIA DE COMPRESIÓN DE ALEMANIA, POR TIPO, 2018-2032 (MILES DE USD)
TABLA 85 MERCADO DE TERAPIA DE COMPRESIÓN EN FRANCIA, POR TÉCNICA DE PRODUCTO, 2018-2032 (MILES DE USD)
TABLA 86 FRANCIA TERAPIA DE COMPRESIÓN ESTÁTICA EN EL MERCADO DE TERAPIA DE COMPRESIÓN, POR TIPO, 2018-2032 (MILES DE USD)
TABLA 87 FRANCIA TERAPIA DE COMPRESIÓN DINÁMICA EN EL MERCADO DE TERAPIA DE COMPRESIÓN, POR TIPO, 2018-2032 (MILES DE USD)
TABLA 88 MERCADO DE TERAPIA DE COMPRESIÓN EN FRANCIA, POR TIPO DE PRODUCTO, 2018-2032 (MILES DE USD)
TABLA 89 VENDAS DE COMPRESIÓN EN EL MERCADO DE TERAPIA DE COMPRESIÓN DE FRANCIA, POR TIPO, 2018-2032 (MILES DE USD)
TABLA 90 FRANCIA PRENDAS DE COMPRESIÓN PARA LINFEDEMA EN EL MERCADO DE TERAPIA DE COMPRESIÓN, POR TIPO, 2018-2032 (MILES DE USD)
TABLA 91 MEDIAS DE COMPRESIÓN PARA ENFERMEDADES VENOSAS EN EL MERCADO DE TERAPIA DE COMPRESIÓN DE FRANCIA, POR TIPO, 2018-2032 (MILES DE USD)
TABLA 92 MERCADO DE TERAPIA DE COMPRESIÓN DE FRANCIA, POR APLICACIÓN, 2018-2032 (MILES DE USD)
TABLA 93 MERCADO DE TERAPIA DE COMPRESIÓN EN FRANCIA, POR GRUPO DE PACIENTES, 2018-2032 (MILES DE USD)
TABLA 94 MERCADO DE TERAPIA DE COMPRESIÓN DE FRANCIA, POR NIVEL DE COMPRESIÓN, 2018-2032 (MILES DE USD)
TABLA 95 MERCADO DE TERAPIA DE COMPRESIÓN EN FRANCIA, POR CANALES DE DISTRIBUCIÓN, 2018-2032 (MILES DE USD)
TABLA 96 HOSPITALES DE FRANCIA EN EL MERCADO DE TERAPIA DE COMPRESIÓN, POR TIPO, 2018-2032 (MILES DE USD)
TABLA 97 FARMACIAS MINORISTAS EN FRANCIA EN EL MERCADO DE TERAPIA DE COMPRESIÓN, POR TIPO, 2018-2032 (MILES DE USD)
TABLA 98 PLATAFORMAS DE COMERCIO ELECTRÓNICO DE FRANCIA EN EL MERCADO DE TERAPIA DE COMPRESIÓN, POR TIPO, 2018-2032 (MILES DE USD)
TABLA 99 CLÍNICAS ESPECIALIZADAS EN EL MERCADO DE TERAPIA DE COMPRESIÓN EN FRANCIA, POR TIPO, 2018-2032 (MILES DE USD)
TABLA 100 TIENDAS DE DISPOSITIVOS MÉDICOS EN FRANCIA EN EL MERCADO DE TERAPIA DE COMPRESIÓN, POR TIPO, 2018-2032 (MILES DE USD)
TABLA 101 PROVEEDORES DE ATENCIÓN MÉDICA DOMICILIARIA EN FRANCIA EN EL MERCADO DE TERAPIA DE COMPRESIÓN, POR TIPO, 2018-2032 (MILES DE USD)
TABLA 102 RESIDENCIAS DE ANCIANOS/CENTROS DE CUIDADOS DE LARGA DURACIÓN EN FRANCIA EN EL MERCADO DE TERAPIA DE COMPRESIÓN, POR TIPO, 2018-2032 (MILES DE USD)
TABLA 103 MERCADO DE TERAPIA DE COMPRESIÓN DEL REINO UNIDO, POR TÉCNICA DE PRODUCTO, 2018-2032 (MILES DE USD)
TABLA 104 TERAPIA DE COMPRESIÓN ESTÁTICA EN EL MERCADO DE TERAPIA DE COMPRESIÓN DEL REINO UNIDO, POR TIPO, 2018-2032 (MILES DE USD)
TABLA 105 TERAPIA DE COMPRESIÓN DINÁMICA EN EL MERCADO DE TERAPIA DE COMPRESIÓN DEL REINO UNIDO, POR TIPO, 2018-2032 (MILES DE USD)
TABLA 106 MERCADO DE TERAPIA DE COMPRESIÓN DEL REINO UNIDO, POR TIPO DE PRODUCTO, 2018-2032 (MILES DE USD)
TABLA 107 VENDAS DE COMPRESIÓN EN EL MERCADO DE TERAPIA DE COMPRESIÓN DEL REINO UNIDO, POR TIPO, 2018-2032 (MILES DE USD)
TABLA 108 PRENDAS DE COMPRESIÓN PARA LINFEDEMA EN EL MERCADO DE TERAPIA DE COMPRESIÓN DEL REINO UNIDO, POR TIPO, 2018-2032 (MILES DE USD)
TABLA 109 MEDIAS DE COMPRESIÓN PARA ENFERMEDADES VENOSAS EN EL MERCADO DE TERAPIA DE COMPRESIÓN DEL REINO UNIDO, POR TIPO, 2018-2032 (MILES DE USD)
TABLA 110 MERCADO DE TERAPIA DE COMPRESIÓN DEL REINO UNIDO, POR APLICACIÓN, 2018-2032 (MILES DE USD)
TABLA 111 MERCADO DE TERAPIA DE COMPRESIÓN DEL REINO UNIDO, POR GRUPO DE PACIENTES, 2018-2032 (MILES DE USD)
TABLA 112 MERCADO DE TERAPIA DE COMPRESIÓN DEL REINO UNIDO, POR NIVEL DE COMPRESIÓN, 2018-2032 (MILES DE USD)
TABLA 113 MERCADO DE TERAPIA DE COMPRESIÓN DEL REINO UNIDO, POR CANALES DE DISTRIBUCIÓN, 2018-2032 (MILES DE USD)
TABLA 114 HOSPITALES DEL REINO UNIDO EN EL MERCADO DE TERAPIA DE COMPRESIÓN, POR TIPO, 2018-2032 (MILES DE USD)
TABLA 115 FARMACIAS MINORISTAS DEL REINO UNIDO EN EL MERCADO DE TERAPIA DE COMPRESIÓN, POR TIPO, 2018-2032 (MILES DE USD)
TABLA 116 PLATAFORMAS DE COMERCIO ELECTRÓNICO DEL REINO UNIDO EN EL MERCADO DE TERAPIA DE COMPRESIÓN, POR TIPO, 2018-2032 (MILES DE USD)
TABLA 117 CLÍNICAS ESPECIALIZADAS EN EL MERCADO DE TERAPIA DE COMPRESIÓN DEL REINO UNIDO, POR TIPO, 2018-2032 (MILES DE USD)
TABLA 118 TIENDAS DE DISPOSITIVOS MÉDICOS EN EL MERCADO DE TERAPIA DE COMPRESIÓN DEL REINO UNIDO, POR TIPO, 2018-2032 (MILES DE USD)
TABLA 119 PROVEEDORES DE ATENCIÓN MÉDICA DOMICILIARIA EN EL REINO UNIDO EN EL MERCADO DE TERAPIA DE COMPRESIÓN, POR TIPO, 2018-2032 (MILES DE USD)
TABLA 120 RESIDENCIAS DE ANCIANOS/CENTROS DE CUIDADOS DE LARGA DURACIÓN EN EL MERCADO DE TERAPIA DE COMPRESIÓN DEL REINO UNIDO, POR TIPO, 2018-2032 (MILES DE USD)
TABLA 121 MERCADO DE TERAPIA DE COMPRESIÓN DE ITALIA, POR TÉCNICA DE PRODUCTO, 2018-2032 (MILES DE USD)
TABLA 122 TERAPIA DE COMPRESIÓN ESTÁTICA EN EL MERCADO DE TERAPIA DE COMPRESIÓN DE ITALIA, POR TIPO, 2018-2032 (MILES DE USD)
TABLA 123 TERAPIA DE COMPRESIÓN DINÁMICA EN ITALIA EN EL MERCADO DE TERAPIA DE COMPRESIÓN, POR TIPO, 2018-2032 (MILES DE USD)
TABLA 124 MERCADO DE TERAPIA DE COMPRESIÓN EN ITALIA, POR TIPO DE PRODUCTO, 2018-2032 (MILES DE USD)
TABLA 125 ITALIA VENDAS DE COMPRESIÓN EN EL MERCADO DE TERAPIA DE COMPRESIÓN, POR TIPO, 2018-2032 (MILES DE USD)
TABLA 126 ITALIA PRENDAS DE COMPRESIÓN PARA LINFEDEMA EN EL MERCADO DE TERAPIA DE COMPRESIÓN, POR TIPO, 2018-2032 (MILES DE USD)
TABLA 127 MEDIAS DE COMPRESIÓN PARA ENFERMEDADES VENOSAS EN EL MERCADO DE TERAPIA DE COMPRESIÓN DE ITALIA, POR TIPO, 2018-2032 (MILES DE USD)
TABLA 128 MERCADO DE TERAPIA DE COMPRESIÓN DE ITALIA, POR APLICACIÓN, 2018-2032 (MILES DE USD)
TABLA 129 MERCADO DE TERAPIA DE COMPRESIÓN EN ITALIA, POR GRUPO DE PACIENTES, 2018-2032 (MILES DE USD)
TABLA 130 MERCADO DE TERAPIA DE COMPRESIÓN DE ITALIA, POR NIVEL DE COMPRESIÓN, 2018-2032 (MILES DE USD)
TABLA 131 MERCADO DE TERAPIA DE COMPRESIÓN EN ITALIA, POR CANALES DE DISTRIBUCIÓN, 2018-2032 (MILES DE USD)
TABLA 132 HOSPITALES DE ITALIA EN EL MERCADO DE TERAPIA DE COMPRESIÓN, POR TIPO, 2018-2032 (MILES DE USD)
TABLA 133 FARMACIAS MINORISTAS DE ITALIA EN EL MERCADO DE TERAPIA DE COMPRESIÓN, POR TIPO, 2018-2032 (MILES DE USD)
TABLA 134 PLATAFORMAS DE COMERCIO ELECTRÓNICO DE ITALIA EN EL MERCADO DE TERAPIA DE COMPRESIÓN, POR TIPO, 2018-2032 (MILES DE USD)
TABLA 135 CLÍNICAS ESPECIALIZADAS EN EL MERCADO DE TERAPIA DE COMPRESIÓN DE ITALIA, POR TIPO, 2018-2032 (MILES DE USD)
TABLA 136 TIENDAS DE DISPOSITIVOS MÉDICOS EN EL MERCADO DE TERAPIA DE COMPRESIÓN DE ITALIA, POR TIPO, 2018-2032 (MILES DE USD)
TABLA 137 PROVEEDORES DE ATENCIÓN MÉDICA DOMICILIARIA EN ITALIA EN EL MERCADO DE TERAPIA DE COMPRESIÓN, POR TIPO, 2018-2032 (MILES DE USD)
TABLA 138 RESIDENCIAS DE ANCIANOS/CENTROS DE CUIDADOS DE LARGA DURACIÓN EN ITALIA EN EL MERCADO DE TERAPIA DE COMPRESIÓN, POR TIPO, 2018-2032 (MILES DE USD)
TABLA 139 MERCADO ESPAÑOL DE TERAPIA DE COMPRESIÓN, POR TÉCNICA DE PRODUCTO, 2018-2032 (MILES DE USD)
TABLA 140 TERAPIA DE COMPRESIÓN ESTÁTICA EN ESPAÑA EN EL MERCADO DE TERAPIA DE COMPRESIÓN, POR TIPO, 2018-2032 (MILES DE USD)
TABLA 141 TERAPIA DE COMPRESIÓN DINÁMICA EN ESPAÑA EN EL MERCADO DE TERAPIA DE COMPRESIÓN, POR TIPO, 2018-2032 (MILES DE USD)
TABLA 142 MERCADO ESPAÑOL DE TERAPIA DE COMPRESIÓN, POR TIPO DE PRODUCTO, 2018-2032 (MILES DE USD)
TABLA 143 VENDAS DE COMPRESIÓN EN EL MERCADO DE TERAPIA DE COMPRESIÓN DE ESPAÑA, POR TIPO, 2018-2032 (MILES DE USD)
TABLA 144. MERCADO DE PRENDAS DE COMPRESIÓN PARA LINFEDEMA EN TERAPIA DE COMPRESIÓN, POR TIPO, 2018-2032 (MILES DE USD)
TABLA 145 MEDIAS DE COMPRESIÓN PARA ENFERMEDADES VENOSAS EN EL MERCADO DE TERAPIA DE COMPRESIÓN, POR TIPO, 2018-2032 (MILES DE USD)
TABLA 146 MERCADO ESPAÑOL DE TERAPIA DE COMPRESIÓN, POR APLICACIÓN, 2018-2032 (MILES DE USD)
TABLA 147 MERCADO ESPAÑOL DE TERAPIA DE COMPRESIÓN, POR GRUPO DE PACIENTES, 2018-2032 (MILES DE USD)
TABLA 148 MERCADO ESPAÑOL DE TERAPIA DE COMPRESIÓN, POR NIVEL DE COMPRESIÓN, 2018-2032 (MILES DE USD)
TABLA 149 MERCADO ESPAÑOL DE TERAPIA DE COMPRESIÓN, POR CANALES DE DISTRIBUCIÓN, 2018-2032 (MILES DE USD)
TABLA 150 HOSPITALES DE ESPAÑA EN EL MERCADO DE TERAPIA DE COMPRESIÓN, POR TIPO, 2018-2032 (MILES DE USD)
TABLA 151 FARMACIAS MINORISTAS EN ESPAÑA EN EL MERCADO DE TERAPIA DE COMPRESIÓN, POR TIPO, 2018-2032 (MILES DE USD)
TABLA 152 PLATAFORMAS DE COMERCIO ELECTRÓNICO EN ESPAÑA EN EL MERCADO DE TERAPIA DE COMPRESIÓN, POR TIPO, 2018-2032 (MILES DE USD)
TABLA 153 CLÍNICAS ESPECIALIZADAS EN EL MERCADO DE TERAPIA DE COMPRESIÓN EN ESPAÑA, POR TIPO, 2018-2032 (MILES DE USD)
TABLA 154 TIENDAS DE PRODUCTOS SANITARIOS EN EL MERCADO DE TERAPIA DE COMPRESIÓN EN ESPAÑA, POR TIPO, 2018-2032 (MILES DE USD)
TABLA 155 PROVEEDORES DE ATENCIÓN MÉDICA DOMICILIARIA EN ESPAÑA EN EL MERCADO DE TERAPIA DE COMPRESIÓN, POR TIPO, 2018-2032 (MILES DE USD)
TABLA 156 RESIDENCIAS/CENTROS DE CUIDADOS DE LARGA DURACIÓN EN EL MERCADO DE TERAPIA DE COMPRESIÓN EN ESPAÑA, POR TIPO, 2018-2032 (MILES DE USD)
TABLA 157 MERCADO DE TERAPIA DE COMPRESIÓN DE SUIZA, POR TÉCNICA DE PRODUCTO, 2018-2032 (MILES DE USD)
TABLA 158 TERAPIA DE COMPRESIÓN ESTÁTICA EN SUIZA EN EL MERCADO DE TERAPIA DE COMPRESIÓN, POR TIPO, 2018-2032 (MILES DE USD)
TABLA 159 TERAPIA DE COMPRESIÓN DINÁMICA EN SUIZA EN EL MERCADO DE TERAPIA DE COMPRESIÓN, POR TIPO, 2018-2032 (MILES DE USD)
TABLA 160 MERCADO DE TERAPIA DE COMPRESIÓN DE SUIZA, POR TIPO DE PRODUCTO, 2018-2032 (MILES DE USD)
TABLA 161 SUIZA VENDAS DE COMPRESIÓN EN EL MERCADO DE TERAPIA DE COMPRESIÓN, POR TIPO, 2018-2032 (MILES DE USD)
TABLA 162 SUIZA PRENDAS DE COMPRESIÓN PARA LINFEDEMA EN EL MERCADO DE TERAPIA DE COMPRESIÓN, POR TIPO, 2018-2032 (MILES DE USD)
TABLA 163 MEDIAS DE COMPRESIÓN PARA ENFERMEDADES VENOSAS EN EL MERCADO DE TERAPIA DE COMPRESIÓN DE SUIZA, POR TIPO, 2018-2032 (MILES DE USD)
TABLA 164 MERCADO DE TERAPIA DE COMPRESIÓN DE SUIZA, POR APLICACIÓN, 2018-2032 (MILES DE USD)
TABLA 165 MERCADO DE TERAPIA DE COMPRESIÓN DE SUIZA, POR GRUPO DE PACIENTES, 2018-2032 (MILES DE USD)
TABLA 166 MERCADO DE TERAPIA DE COMPRESIÓN DE SUIZA, POR NIVEL DE COMPRESIÓN, 2018-2032 (MILES DE USD)
TABLA 167 MERCADO DE TERAPIA DE COMPRESIÓN DE SUIZA, POR CANALES DE DISTRIBUCIÓN, 2018-2032 (MILES DE USD)
TABLA 168 HOSPITALES DE SUIZA EN EL MERCADO DE TERAPIA DE COMPRESIÓN, POR TIPO, 2018-2032 (MILES DE USD)
TABLA 169 FARMACIAS MINORISTAS DE SUIZA EN EL MERCADO DE TERAPIA DE COMPRESIÓN, POR TIPO, 2018-2032 (MILES DE USD)
TABLA 170 PLATAFORMAS DE COMERCIO ELECTRÓNICO DE SUIZA EN EL MERCADO DE TERAPIA DE COMPRESIÓN, POR TIPO, 2018-2032 (MILES DE USD)
TABLA 171 CLÍNICAS ESPECIALIZADAS EN EL MERCADO DE TERAPIA DE COMPRESIÓN DE SUIZA, POR TIPO, 2018-2032 (MILES DE USD)
TABLA 172 TIENDAS DE DISPOSITIVOS MÉDICOS EN EL MERCADO DE TERAPIA DE COMPRESIÓN DE SUIZA, POR TIPO, 2018-2032 (MILES DE USD)
TABLA 173 PROVEEDORES DE ATENCIÓN MÉDICA DOMICILIARIA EN SUIZA EN EL MERCADO DE TERAPIA DE COMPRESIÓN, POR TIPO, 2018-2032 (MILES DE USD)
TABLA 174 RESIDENCIAS DE ANCIANOS/CENTROS DE CUIDADOS DE LARGA DURACIÓN EN SUIZA EN EL MERCADO DE TERAPIA DE COMPRESIÓN, POR TIPO, 2018-2032 (MILES DE USD)
TABLA 175 MERCADO DE TERAPIA DE COMPRESIÓN DE RUSIA, POR TÉCNICA DE PRODUCTO, 2018-2032 (MILES DE USD)
TABLA 176 TERAPIA DE COMPRESIÓN ESTÁTICA EN RUSIA EN EL MERCADO DE TERAPIA DE COMPRESIÓN, POR TIPO, 2018-2032 (MILES DE USD)
TABLA 177 TERAPIA DE COMPRESIÓN DINÁMICA EN RUSIA EN EL MERCADO DE TERAPIA DE COMPRESIÓN, POR TIPO, 2018-2032 (MILES DE USD)
TABLA 178 MERCADO DE TERAPIA DE COMPRESIÓN EN RUSIA, POR TIPO DE PRODUCTO, 2018-2032 (MILES DE USD)
TABLA 179 VENDAS DE COMPRESIÓN EN EL MERCADO DE TERAPIA DE COMPRESIÓN DE RUSIA, POR TIPO, 2018-2032 (MILES DE USD)
TABLA 180 PRENDAS DE COMPRESIÓN PARA LINFEDEMA EN EL MERCADO DE TERAPIA DE COMPRESIÓN DE RUSIA, POR TIPO, 2018-2032 (MILES DE USD)
TABLA 181 MEDIAS DE COMPRESIÓN PARA ENFERMEDADES VENOSAS EN EL MERCADO DE TERAPIA DE COMPRESIÓN DE RUSIA, POR TIPO, 2018-2032 (MILES DE USD)
TABLA 182 MERCADO DE TERAPIA DE COMPRESIÓN DE RUSIA, POR APLICACIÓN, 2018-2032 (MILES DE USD)
TABLA 183 MERCADO DE TERAPIA DE COMPRESIÓN EN RUSIA, POR GRUPO DE PACIENTES, 2018-2032 (MILES DE USD)
TABLA 184 MERCADO DE TERAPIA DE COMPRESIÓN DE RUSIA, POR NIVEL DE COMPRESIÓN, 2018-2032 (MILES DE USD)
TABLA 185 MERCADO DE TERAPIA DE COMPRESIÓN EN RUSIA, POR CANALES DE DISTRIBUCIÓN, 2018-2032 (MILES DE USD)
TABLA 186 HOSPITALES DE RUSIA EN EL MERCADO DE TERAPIA DE COMPRESIÓN, POR TIPO, 2018-2032 (MILES DE USD)
TABLA 187 FARMACIAS MINORISTAS DE RUSIA EN EL MERCADO DE TERAPIA DE COMPRESIÓN, POR TIPO, 2018-2032 (MILES DE USD)
TABLA 188 PLATAFORMAS DE COMERCIO ELECTRÓNICO DE RUSIA EN EL MERCADO DE TERAPIA DE COMPRESIÓN, POR TIPO, 2018-2032 (MILES DE USD)
TABLA 189 CLÍNICAS ESPECIALIZADAS EN EL MERCADO DE TERAPIA DE COMPRESIÓN DE RUSIA, POR TIPO, 2018-2032 (MILES DE USD)
TABLA 190 TIENDAS DE DISPOSITIVOS MÉDICOS EN EL MERCADO DE TERAPIA DE COMPRESIÓN DE RUSIA, POR TIPO, 2018-2032 (MILES DE USD)
TABLA 191 PROVEEDORES DE ATENCIÓN MÉDICA DOMICILIARIA EN RUSIA EN EL MERCADO DE TERAPIA DE COMPRESIÓN, POR TIPO, 2018-2032 (MILES DE USD)
TABLA 192 RESIDENCIAS DE ANCIANOS/CENTROS DE CUIDADOS DE LARGA DURACIÓN EN RUSIA EN EL MERCADO DE TERAPIA DE COMPRESIÓN, POR TIPO, 2018-2032 (MILES DE USD)
TABLA 193 MERCADO DE TERAPIA DE COMPRESIÓN DE BÉLGICA, POR TÉCNICA DE PRODUCTO, 2018-2032 (MILES DE USD)
TABLA 194 TERAPIA DE COMPRESIÓN ESTÁTICA EN EL MERCADO DE TERAPIA DE COMPRESIÓN DE BÉLGICA, POR TIPO, 2018-2032 (MILES DE USD)
TABLA 195 TERAPIA DE COMPRESIÓN DINÁMICA EN BÉLGICA EN EL MERCADO DE TERAPIA DE COMPRESIÓN, POR TIPO, 2018-2032 (MILES DE USD)
TABLA 196 MERCADO DE TERAPIA DE COMPRESIÓN DE BÉLGICA, POR TIPO DE PRODUCTO, 2018-2032 (MILES DE USD)
TABLA 197 VENDAS DE COMPRESIÓN EN EL MERCADO DE TERAPIA DE COMPRESIÓN DE BÉLGICA, POR TIPO, 2018-2032 (MILES DE USD)
TABLA 198 PRENDAS DE COMPRESIÓN PARA LINFEDEMA EN EL MERCADO DE TERAPIA DE COMPRESIÓN DE BÉLGICA, POR TIPO, 2018-2032 (MILES DE USD)
TABLA 199 MEDIAS DE COMPRESIÓN PARA ENFERMEDADES VENOSAS EN EL MERCADO DE TERAPIA DE COMPRESIÓN DE BÉLGICA, POR TIPO, 2018-2032 (MILES DE USD)
TABLA 200 MERCADO DE TERAPIA DE COMPRESIÓN DE BÉLGICA, POR APLICACIÓN, 2018-2032 (MILES DE USD)
TABLA 201 MERCADO DE TERAPIA DE COMPRESIÓN DE BÉLGICA, POR GRUPO DE PACIENTES, 2018-2032 (MILES DE USD)
TABLA 202 MERCADO DE TERAPIA DE COMPRESIÓN DE BÉLGICA, POR NIVEL DE COMPRESIÓN, 2018-2032 (MILES DE USD)
TABLA 203 MERCADO DE TERAPIA DE COMPRESIÓN DE BÉLGICA, POR CANALES DE DISTRIBUCIÓN, 2018-2032 (MILES DE USD)
TABLA 204 HOSPITALES BÉLGICA EN EL MERCADO DE TERAPIA DE COMPRESIÓN, POR TIPO, 2018-2032 (MILES DE USD)
TABLA 205 FARMACIAS MINORISTAS DE BÉLGICA EN EL MERCADO DE TERAPIA DE COMPRESIÓN, POR TIPO, 2018-2032 (MILES DE USD)
TABLA 206 PLATAFORMAS DE COMERCIO ELECTRÓNICO DE BÉLGICA EN EL MERCADO DE TERAPIA DE COMPRESIÓN, POR TIPO, 2018-2032 (MILES DE USD)
TABLA 207 CLÍNICAS ESPECIALIZADAS EN EL MERCADO DE TERAPIA DE COMPRESIÓN DE BÉLGICA, POR TIPO, 2018-2032 (MILES DE USD)
TABLA 208 TIENDAS DE DISPOSITIVOS MÉDICOS EN EL MERCADO DE TERAPIA DE COMPRESIÓN DE BÉLGICA, POR TIPO, 2018-2032 (MILES DE USD)
TABLA 209 PROVEEDORES DE ATENCIÓN MÉDICA DOMICILIARIA EN BÉLGICA EN EL MERCADO DE TERAPIA DE COMPRESIÓN, POR TIPO, 2018-2032 (MILES DE USD)
TABLA 210 RESIDENCIAS DE ANCIANOS/CENTROS DE CUIDADOS DE LARGA DURACIÓN EN EL MERCADO DE TERAPIA DE COMPRESIÓN DE BÉLGICA, POR TIPO, 2018-2032 (MILES DE USD)
TABLA 211 MERCADO DE TERAPIA DE COMPRESIÓN DE LOS PAÍSES BAJOS, POR TÉCNICA DE PRODUCTO, 2018-2032 (MILES DE USD)
TABLA 212 TERAPIA DE COMPRESIÓN ESTÁTICA EN EL MERCADO DE TERAPIA DE COMPRESIÓN DE LOS PAÍSES BAJOS, POR TIPO, 2018-2032 (MILES DE USD)
TABLA 213 TERAPIA DE COMPRESIÓN DINÁMICA EN EL MERCADO DE TERAPIA DE COMPRESIÓN DE LOS PAÍSES BAJOS, POR TIPO, 2018-2032 (MILES DE USD)
TABLA 214 MERCADO DE TERAPIA DE COMPRESIÓN DE LOS PAÍSES BAJOS, POR TIPO DE PRODUCTO, 2018-2032 (MILES DE USD)
TABLA 215 VENDAS DE COMPRESIÓN EN EL MERCADO DE TERAPIA DE COMPRESIÓN DE LOS PAÍSES BAJOS, POR TIPO, 2018-2032 (MILES DE USD)
TABLA 216 PRENDAS DE COMPRESIÓN PARA LINFEDEMA EN EL MERCADO DE TERAPIA DE COMPRESIÓN DE LOS PAÍSES BAJOS, POR TIPO, 2018-2032 (MILES DE USD)
TABLA 217 MEDIAS DE COMPRESIÓN PARA ENFERMEDADES VENOSAS EN EL MERCADO DE TERAPIA DE COMPRESIÓN DE LOS PAÍSES BAJOS, POR TIPO, 2018-2032 (MILES DE USD)
TABLA 218 MERCADO DE TERAPIA DE COMPRESIÓN DE LOS PAÍSES BAJOS, POR APLICACIÓN, 2018-2032 (MILES DE USD)
TABLA 219 MERCADO DE TERAPIA DE COMPRESIÓN DE LOS PAÍSES BAJOS, POR GRUPO DE PACIENTES, 2018-2032 (MILES DE USD)
TABLA 220 MERCADO DE TERAPIA DE COMPRESIÓN DE LOS PAÍSES BAJOS, POR NIVEL DE COMPRESIÓN, 2018-2032 (MILES DE USD)
TABLA 221 MERCADO DE TERAPIA DE COMPRESIÓN DE LOS PAÍSES BAJOS, POR CANALES DE DISTRIBUCIÓN, 2018-2032 (MILES DE USD)
TABLA 222 HOSPITALES DE LOS PAÍSES BAJOS EN EL MERCADO DE TERAPIA DE COMPRESIÓN, POR TIPO, 2018-2032 (MILES DE USD)
TABLA 223 FARMACIAS MINORISTAS DE PAÍSES BAJOS EN EL MERCADO DE TERAPIA DE COMPRESIÓN, POR TIPO, 2018-2032 (MILES DE USD)
TABLA 224 PLATAFORMAS DE COMERCIO ELECTRÓNICO DE LOS PAÍSES BAJOS EN EL MERCADO DE TERAPIA DE COMPRESIÓN, POR TIPO, 2018-2032 (MILES DE USD)
TABLA 225 CLÍNICAS ESPECIALIZADAS EN EL MERCADO DE TERAPIA DE COMPRESIÓN DE LOS PAÍSES BAJOS, POR TIPO, 2018-2032 (MILES DE USD)
TABLA 226 TIENDAS DE DISPOSITIVOS MÉDICOS EN EL MERCADO DE TERAPIA DE COMPRESIÓN DE LOS PAÍSES BAJOS, POR TIPO, 2018-2032 (MILES DE USD)
TABLA 227 PROVEEDORES DE ATENCIÓN MÉDICA DOMICILIARIA EN EL MERCADO DE TERAPIA DE COMPRESIÓN DE LOS PAÍSES BAJOS, POR TIPO, 2018-2032 (MILES DE USD)
TABLA 228 RESIDENCIAS DE ANCIANOS/CENTROS DE CUIDADOS DE LARGA DURACIÓN EN EL MERCADO DE TERAPIA DE COMPRESIÓN DE LOS PAÍSES BAJOS, POR TIPO, 2018-2032 (MILES DE USD)
TABLA 229 MERCADO DE TERAPIA DE COMPRESIÓN DE TURQUÍA, POR TÉCNICA DE PRODUCTO, 2018-2032 (MILES DE USD)
TABLA 230 TERAPIA DE COMPRESIÓN ESTÁTICA EN EL MERCADO DE TERAPIA DE COMPRESIÓN DE TURQUÍA, POR TIPO, 2018-2032 (MILES DE USD)
TABLA 231 TERAPIA DE COMPRESIÓN DINÁMICA EN EL MERCADO DE TERAPIA DE COMPRESIÓN DE TURQUÍA, POR TIPO, 2018-2032 (MILES DE USD)
TABLA 232 MERCADO DE TERAPIA DE COMPRESIÓN DE TURQUÍA, POR TIPO DE PRODUCTO, 2018-2032 (MILES DE USD)
TABLA 233 VENDAS DE COMPRESIÓN DE PAVO EN EL MERCADO DE TERAPIA DE COMPRESIÓN, POR TIPO, 2018-2032 (MILES DE USD)
TABLA 234 PRENDAS DE COMPRESIÓN PARA LINFEDEMA EN EL MERCADO DE TERAPIA DE COMPRESIÓN DE TURQUÍA, POR TIPO, 2018-2032 (MILES DE USD)
TABLA 235 MEDIAS DE COMPRESIÓN DE PAVO PARA ENFERMEDADES VENOSAS EN EL MERCADO DE TERAPIA DE COMPRESIÓN, POR TIPO, 2018-2032 (MILES DE USD)
TABLA 236 MERCADO DE TERAPIA DE COMPRESIÓN DE TURQUÍA, POR APLICACIÓN, 2018-2032 (MILES DE USD)
TABLA 237 MERCADO DE TERAPIA DE COMPRESIÓN DE TURQUÍA, POR GRUPO DE PACIENTES, 2018-2032 (MILES DE USD)
TABLA 238 MERCADO DE TERAPIA DE COMPRESIÓN DE TURQUÍA, POR NIVEL DE COMPRESIÓN, 2018-2032 (MILES DE USD)
TABLA 239 MERCADO DE TERAPIA DE COMPRESIÓN DE TURQUÍA, POR CANALES DE DISTRIBUCIÓN, 2018-2032 (MILES DE USD)
TABLA 240 HOSPITALES DE TURQUÍA EN EL MERCADO DE TERAPIA DE COMPRESIÓN, POR TIPO, 2018-2032 (MILES DE USD)
TABLA 241 FARMACIAS MINORISTAS DE TURQUÍA EN EL MERCADO DE TERAPIA DE COMPRESIÓN, POR TIPO, 2018-2032 (MILES DE USD)
TABLA 242 PLATAFORMAS DE COMERCIO ELECTRÓNICO DE TURQUÍA EN EL MERCADO DE TERAPIA DE COMPRESIÓN, POR TIPO, 2018-2032 (MILES DE USD)
TABLA 243 CLÍNICAS ESPECIALIZADAS EN EL MERCADO DE TERAPIA DE COMPRESIÓN DE TURQUÍA, POR TIPO, 2018-2032 (MILES DE USD)
TABLA 244 TIENDAS DE DISPOSITIVOS MÉDICOS EN EL MERCADO DE TERAPIA DE COMPRESIÓN DE TURQUÍA, POR TIPO, 2018-2032 (MILES DE USD)
TABLA 245 PROVEEDORES DE ATENCIÓN MÉDICA DOMICILIARIA EN EL MERCADO DE TERAPIA DE COMPRESIÓN DE TURQUÍA, POR TIPO, 2018-2032 (MILES DE USD)
TABLA 246 RESIDENCIAS DE ANCIANOS/CENTROS DE CUIDADOS DE LARGA DURACIÓN EN EL MERCADO DE TERAPIA DE COMPRESIÓN DE TURQUÍA, POR TIPO, 2018-2032 (MILES DE USD)
TABLA 247 RESTO DE EUROPA MERCADO DE TERAPIA DE COMPRESIÓN, POR TÉCNICA DE PRODUCTO, 2018-2032 (MILES DE USD)
Lista de figuras
FIGURA 1 MERCADO EUROPEO DE TERAPIA DE COMPRESIÓN: SEGMENTACIÓN
FIGURA 2 MERCADO EUROPEO DE TERAPIA DE COMPRESIÓN: TRIANGULACIÓN DE DATOS
FIGURA 3 MERCADO EUROPEO DE TERAPIA DE COMPRESIÓN: ANÁLISIS DROC
FIGURA 4 MERCADO EUROPEO DE TERAPIA DE COMPRESIÓN: ANÁLISIS DEL MERCADO EUROPEO VS. REGIONAL
FIGURA 5 MERCADO EUROPEO DE TERAPIA DE COMPRESIÓN: ANÁLISIS DE INVESTIGACIÓN DE EMPRESAS
FIGURA 6 MERCADO EUROPEO DE TERAPIA DE COMPRESIÓN: MODELADO MULTIVARIABLE
FIGURA 7 MERCADO EUROPEO DE TERAPIA DE COMPRESIÓN: DATOS DEMOGRÁFICOS DE LAS ENTREVISTAS
FIGURA 8 MERCADO EUROPEO DE TERAPIA DE COMPRESIÓN: CUADRÍCULA DE POSICIÓN EN EL MERCADO
FIGURA 9 MERCADO EUROPEO DE TERAPIA DE COMPRESIÓN: CUADRÍCULA DE COBERTURA DE APLICACIONES DEL MERCADO
FIGURA 10 MERCADO EUROPEO DE TERAPIA DE COMPRESIÓN: ANÁLISIS DE LA PARTICIPACIÓN DE LOS PROVEEDORES
FIGURA 11 MERCADO EUROPEO DE TERAPIA DE COMPRESIÓN: SEGMENTACIÓN
FIGURA 12 MERCADO EUROPEO DE TERAPIA DE COMPRESIÓN: RESUMEN EJECUTIVO
FIGURA 13 MERCADO EUROPEO DE TERAPIA DE COMPRESIÓN: DECISIONES ESTRATÉGICAS
FIGURA 14 SE ESPERA QUE LA AUMENTO DE LA PREVALENCIA DE LOS TRASTORNOS VENOSOS CRÓNICOS A NIVEL MUNDIAL IMPULSE EL MERCADO EUROPEO DE TERAPIA DE COMPRESIÓN EN EL PERÍODO PRONOSTICADO DE 2025 A 2032
FIGURA 15 SE ESPERA QUE EL SEGMENTO DE TERAPIA DE COMPRESIÓN ESTÁTICA REPRESENTE LA MAYOR PARTICIPACIÓN DEL MERCADO DE TERAPIA DE COMPRESIÓN EN EUROPA EN EL PERÍODO DE PRONÓSTICO DE 2025 Y 2032
FIGURA 16 DOS SEGMENTOS COMPRENDEN EL MERCADO EUROPEO DE TERAPIA DE COMPRESIÓN, POR TÉCNICA DE PRODUCTO (2024)
FIGURA 17 DISTRIBUCIÓN DE PATENTES POR CÓDIGO IPC
FIGURA 18 DISTRIBUCIÓN DE PATENTES POR REGIÓN
FIGURA 19 NÚMERO DE PATENTES POR SOLICITANTE
FIGURA 20 PUBLICACIONES ANUALES DE PATENTES
FIGURA 21 IMPULSORES, RESTRICCIONES, OPORTUNIDADES Y DESAFÍOS DEL MERCADO EUROPEO DE TERAPIA DE COMPRESIÓN
FIGURA 22 MERCADO EUROPEO DE TERAPIA DE COMPRESIÓN: POR TÉCNICA DE PRODUCTO, 2024
FIGURA 23 MERCADO EUROPEO DE TERAPIA DE COMPRESIÓN: POR TÉCNICA DE PRODUCTO, 2025 A 2032 (MILES DE USD)
FIGURA 24 MERCADO EUROPEO DE TERAPIA DE COMPRESIÓN: POR TÉCNICA DE PRODUCTO, CAGR (2025-2032)
FIGURA 25 MERCADO EUROPEO DE TERAPIA DE COMPRESIÓN: POR TÉCNICA DE PRODUCTO, CURVA LIFELINE
FIGURA 26 MERCADO EUROPEO DE TERAPIA DE COMPRESIÓN: POR TIPO DE PRODUCTO, 2024
FIGURA 27 MERCADO EUROPEO DE TERAPIA DE COMPRESIÓN: POR TIPO DE PRODUCTO, 2025 A 2032 (MILES DE USD)
FIGURA 28 MERCADO EUROPEO DE TERAPIA DE COMPRESIÓN: POR TIPO DE PRODUCTO, CAGR (2025-2032)
FIGURA 29 MERCADO EUROPEO DE TERAPIA DE COMPRESIÓN: POR TIPO DE PRODUCTO, CURVA LIFELINE
FIGURA 30 MERCADO EUROPEO DE TERAPIA DE COMPRESIÓN: POR APLICACIÓN, 2024
FIGURA 31 MERCADO EUROPEO DE TERAPIA DE COMPRESIÓN: POR APLICACIÓN, 2025 A 2032 (MILES DE USD)
FIGURA 32 MERCADO EUROPEO DE TERAPIA DE COMPRESIÓN: POR APLICACIÓN, CAGR (2025-2032)
FIGURA 33 MERCADO EUROPEO DE TERAPIA DE COMPRESIÓN: POR APLICACIÓN, CURVA LIFELINE
FIGURA 34 MERCADO EUROPEO DE TERAPIA DE COMPRESIÓN: POR GRUPO DE PACIENTES, 2024
FIGURA 35 MERCADO EUROPEO DE TERAPIA DE COMPRESIÓN: POR GRUPO DE PACIENTES, 2025 A 2032 (MILES DE USD)
FIGURA 36 MERCADO EUROPEO DE TERAPIA DE COMPRESIÓN: POR GRUPO DE PACIENTES, CAGR (2025-2032)
FIGURA 37 MERCADO EUROPEO DE TERAPIA DE COMPRESIÓN: POR GRUPO DE PACIENTES, CURVA LIFELINE
FIGURA 38 MERCADO EUROPEO DE TERAPIA DE COMPRESIÓN: POR NIVEL DE COMPRESIÓN, 2024
FIGURA 39 MERCADO EUROPEO DE TERAPIA DE COMPRESIÓN: POR NIVEL DE COMPRESIÓN, 2025 A 2032 (MILES DE USD)
FIGURA 40 MERCADO EUROPEO DE TERAPIA DE COMPRESIÓN: POR NIVEL DE COMPRESIÓN, CAGR (2025-2032)
FIGURA 41 MERCADO EUROPEO DE TERAPIA DE COMPRESIÓN: POR NIVEL DE COMPRESIÓN, CURVA LIFELINE
FIGURA 42 MERCADO EUROPEO DE TERAPIA DE COMPRESIÓN: POR CANALES DE DISTRIBUCIÓN, 2024
FIGURA 43 MERCADO EUROPEO DE TERAPIA DE COMPRESIÓN: POR CANALES DE DISTRIBUCIÓN, 2025 A 2032 (MILES DE USD)
FIGURA 44 MERCADO EUROPEO DE TERAPIA DE COMPRESIÓN: POR CANALES DE DISTRIBUCIÓN, CAGR (2025-2032)
FIGURA 45 MERCADO EUROPEO DE TERAPIA DE COMPRESIÓN: POR CANALES DE DISTRIBUCIÓN, CURVA LIFELINE
FIGURA 46 MERCADO EUROPEO DE TERAPIA DE COMPRESIÓN: INSTANTÁNEA (2024)
FIGURA 47 MERCADO EUROPEO DE TERAPIA DE COMPRESIÓN: CUOTA DE LA EMPRESA 2024 (%)
Metodología de investigación
La recopilación de datos y el análisis del año base se realizan utilizando módulos de recopilación de datos con muestras de gran tamaño. La etapa incluye la obtención de información de mercado o datos relacionados a través de varias fuentes y estrategias. Incluye el examen y la planificación de todos los datos adquiridos del pasado con antelación. Asimismo, abarca el examen de las inconsistencias de información observadas en diferentes fuentes de información. Los datos de mercado se analizan y estiman utilizando modelos estadísticos y coherentes de mercado. Además, el análisis de la participación de mercado y el análisis de tendencias clave son los principales factores de éxito en el informe de mercado. Para obtener más información, solicite una llamada de un analista o envíe su consulta.
La metodología de investigación clave utilizada por el equipo de investigación de DBMR es la triangulación de datos, que implica la extracción de datos, el análisis del impacto de las variables de datos en el mercado y la validación primaria (experto en la industria). Los modelos de datos incluyen cuadrícula de posicionamiento de proveedores, análisis de línea de tiempo de mercado, descripción general y guía del mercado, cuadrícula de posicionamiento de la empresa, análisis de patentes, análisis de precios, análisis de participación de mercado de la empresa, estándares de medición, análisis global versus regional y de participación de proveedores. Para obtener más información sobre la metodología de investigación, envíe una consulta para hablar con nuestros expertos de la industria.
Personalización disponible
Data Bridge Market Research es líder en investigación formativa avanzada. Nos enorgullecemos de brindar servicios a nuestros clientes existentes y nuevos con datos y análisis que coinciden y se adaptan a sus objetivos. El informe se puede personalizar para incluir análisis de tendencias de precios de marcas objetivo, comprensión del mercado de países adicionales (solicite la lista de países), datos de resultados de ensayos clínicos, revisión de literatura, análisis de mercado renovado y base de productos. El análisis de mercado de competidores objetivo se puede analizar desde análisis basados en tecnología hasta estrategias de cartera de mercado. Podemos agregar tantos competidores sobre los que necesite datos en el formato y estilo de datos que esté buscando. Nuestro equipo de analistas también puede proporcionarle datos en archivos de Excel sin procesar, tablas dinámicas (libro de datos) o puede ayudarlo a crear presentaciones a partir de los conjuntos de datos disponibles en el informe.

