Europe Diet And Nutrition Apps Market
Tamaño del mercado en miles de millones de dólares
Tasa de crecimiento anual compuesta (CAGR) :
% 
 USD
2.07 Billion
USD
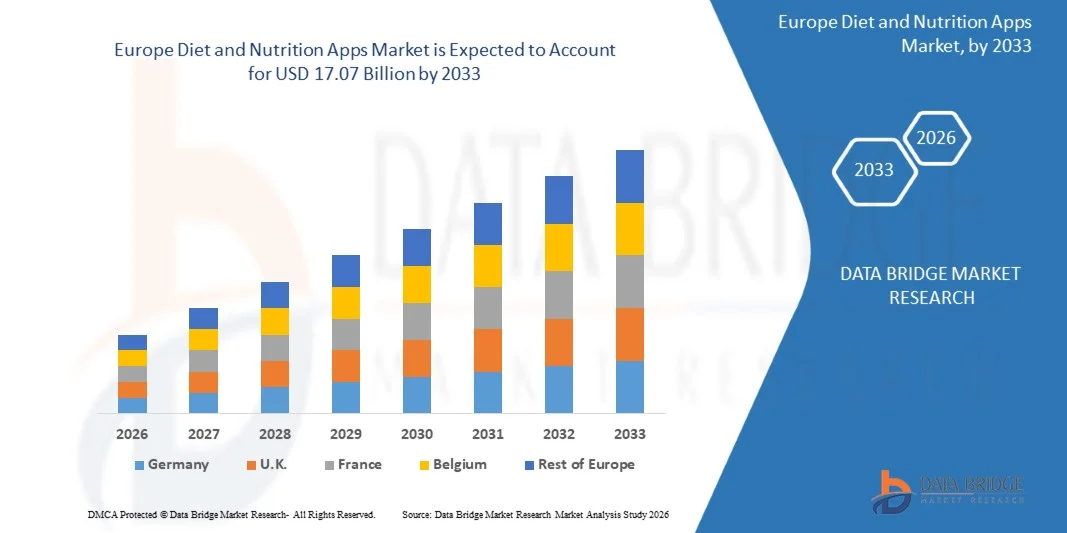
17.07 Billion
2025
2033
USD
2.07 Billion
USD
17.07 Billion
2025
2033
| 2026 –2033 | |
| USD 2.07 Billion | |
| USD 17.07 Billion | |
| % | |
|
Segmentación del mercado europeo de aplicaciones de dieta y nutrición por tipo (aplicaciones de seguimiento nutricional, de seguimiento de actividad, de redes sociales, de apuestas y otras), productos (teléfonos inteligentes, dispositivos portátiles y tabletas), género (mujeres y hombres), edad (adultos, adolescentes y personas mayores), plataforma (Android, iOS, Windows y otras) y usuario final (centros de fitness, sector sanitario, atención domiciliaria y otros): tendencias y previsiones del sector hasta 2033.
¿Cuál es el tamaño y la tasa de crecimiento del mercado europeo de aplicaciones sobre dieta y nutrición ?
- El mercado europeo de aplicaciones de dieta y nutrición alcanzó un valor de 2.070 millones de dólares en 2025 y se prevé que alcance los 17.070 millones de dólares en 2033 , con una tasa de crecimiento anual compuesta (CAGR) del 30,10% durante el período de pronóstico.
- Este crecimiento está impulsado por factores como la creciente prevalencia de enfermedades relacionadas con el estilo de vida, la creciente penetración de los teléfonos inteligentes y la mayor adopción de plataformas de salud digital.
¿Cuáles son las principales conclusiones del mercado de aplicaciones de dieta y nutrición?
- El mercado de aplicaciones de dieta y nutrición está experimentando un fuerte crecimiento, con aplicaciones como MyFitnessPal que superaron los 200 millones de usuarios a nivel mundial en 2024, ofreciendo funciones como escaneo de códigos de barras, seguimiento de calorías y objetivos nutricionales personalizados.
- Plataformas como Noom, que registró más de 45 millones de descargas, están siendo ampliamente adoptadas por su enfoque psicológico para la pérdida de peso y la planificación estructurada de comidas, lo que las hace populares entre las personas que buscan cambios de salud sostenibles.
- La sincronización en tiempo real con dispositivos portátiles como Fitbit, Garmin y Apple Watch se está convirtiendo en una función estándar, lo que permite a los usuarios realizar un seguimiento de la ingesta de alimentos, la actividad física, la frecuencia cardíaca y los patrones de sueño, todo en un mismo ecosistema, mejorando la utilidad de la aplicación y la retención de usuarios.
- Alemania dominó el mercado europeo de aplicaciones de dieta y nutrición con la mayor cuota de ingresos, un 43,7 % en 2025, gracias a la creciente concienciación sobre los estilos de vida saludables, la mayor adopción de aplicaciones de salud móvil y el creciente interés de los consumidores por la atención médica preventiva y la gestión del estado físico.
- El Reino Unido está experimentando la tasa de crecimiento más rápida de la región europea, un 10,92%, impulsada por una mayor concienciación sobre la salud, el aumento del uso de teléfonos inteligentes y la creciente popularidad de las plataformas de bienestar digital.
- El segmento de aplicaciones de seguimiento nutricional dominó el mercado de aplicaciones de dieta y nutrición con la mayor cuota de mercado de ingresos, un 36,8 % en 2024, impulsado por la creciente concienciación sobre los estilos de vida saludables y el creciente interés de los consumidores en el control de calorías, la planificación de dietas y la gestión nutricional personalizada.
Alcance del informe y segmentación del mercado de aplicaciones de dieta y nutrición
|
Atributos |
Aplicaciones de dieta y nutrición: información clave del mercado |
|
Segmentos cubiertos |
|
|
Países incluidos |
Europa
|
|
Principales actores del mercado |
|
|
Oportunidades de mercado |
|
|
Conjuntos de información de datos de valor añadido |
Además de ofrecer información sobre escenarios de mercado como el valor de mercado, la tasa de crecimiento, la segmentación, la cobertura geográfica y los principales actores, los informes de mercado elaborados por Data Bridge Market Research también incluyen análisis de expertos en profundidad, análisis de precios, análisis de cuota de marca, encuestas a consumidores, análisis demográfico, análisis de la cadena de suministro, análisis de la cadena de valor, descripción general de materias primas/consumibles, criterios de selección de proveedores, análisis PESTLE, análisis de Porter y marco regulatorio. |
¿Cuál es la principal tendencia en el mercado de aplicaciones de dieta y nutrición?
“ Integración de funciones inteligentes ”
- La integración de funciones inteligentes en las aplicaciones de dieta y nutrición está mejorando la experiencia del usuario al permitir el seguimiento en tiempo real de las calorías, los macronutrientes y la hidratación.
- Por ejemplo, MyFitnessPal permite a los usuarios registrar sus comidas mediante escáneres de códigos de barras y reconocimiento de alimentos basado en fotografías.
- El registro de datos mediante comandos de voz y las notificaciones inteligentes son cada vez más populares, ya que ayudan a los usuarios a mantener la constancia en sus rutinas de salud.
- Por ejemplo, Lifesum ofrece recordatorios para la ingesta de agua y el seguimiento de las comidas, adaptados al comportamiento del usuario.
- La personalización es fundamental en esta tendencia, y muchas aplicaciones utilizan análisis de datos y aprendizaje automático para recomendar planes de alimentación basados en preferencias dietéticas, niveles de actividad y objetivos de fitness.
- Por ejemplo, Yazio crea sugerencias de comidas adaptativas basadas en el progreso del usuario.
- La integración con dispositivos portátiles como Apple Watch, Fitbit y Garmin permite a los usuarios sincronizar sus datos nutricionales con la actividad física, el sueño y la frecuencia cardíaca, creando una visión holística del bienestar en una sola aplicación.
- Se están adoptando la gamificación y las interfaces fáciles de usar para hacer que las funciones inteligentes sean más atractivas; por ejemplo, HealthifyMe incluye desafíos diarios y rachas de progreso que motivan a los usuarios al tiempo que proporciona información impulsada por IA a través de su asistente virtual Ria.
¿Cuáles son los principales factores que impulsan el mercado de aplicaciones de dieta y nutrición?
- La creciente demanda de aplicaciones de dieta y nutrición se debe en gran medida a la mayor concienciación sobre la atención médica preventiva y el mantenimiento de un estilo de vida equilibrado, especialmente entre los millennials y la Generación Z, que prefieren las soluciones digitales para la gestión de la salud.
- El aumento global de enfermedades relacionadas con el estilo de vida, como la obesidad, la diabetes y las enfermedades cardiovasculares, ha llevado a los consumidores a ser más conscientes de sus hábitos alimenticios y a buscar herramientas para controlar y gestionar su nutrición.
- Por ejemplo, MyFitnessPal y Noom han experimentado un crecimiento constante en descargas y usuarios activos, gracias a funciones como el seguimiento de calorías en tiempo real, la planificación de comidas y la integración con dispositivos portátiles.
- La influencia de los influencers de salud en las redes sociales y los retos de fitness en línea está animando a más personas a adoptar aplicaciones de dieta.
- Por ejemplo, plataformas como Instagram y TikTok están llenas de creadores de contenido que demuestran cómo utilizan las aplicaciones para alcanzar sus objetivos de fitness.
- Las campañas de salud pública que promueven la alimentación saludable y la accesibilidad de la tecnología móvil han facilitado que los usuarios realicen un seguimiento de su progreso, se mantengan responsables y tomen el control de su salud sin depender exclusivamente de clínicas o profesionales.
¿Qué factor está frenando el crecimiento del mercado de aplicaciones de dieta y nutrición?
- Uno de los mayores desafíos en el mercado de aplicaciones de dieta y nutrición es la creciente preocupación por la privacidad de los datos, ya que estas plataformas recopilan información personal altamente sensible, incluidos hábitos alimenticios, rutinas de ejercicio y, en algunos casos, detalles médicos y biométricos.
- Si no se protegen adecuadamente, estos datos son vulnerables a las brechas de seguridad cibernética y al acceso no autorizado, lo que podría tener graves consecuencias para los usuarios y erosionar la confianza en las soluciones de salud digital.
- Por ejemplo, la aplicación de seguimiento de la salud Strava se enfrentó a críticas en el pasado cuando su mapa de calor global reveló la ubicación de bases militares sensibles, lo que puso de manifiesto cómo los datos de ubicación y actividad pueden ser mal utilizados si no se protegen adecuadamente.
- No todas las aplicaciones mantienen políticas de privacidad claras ni mecanismos de consentimiento del usuario, y se ha informado que algunas venden datos anonimizados a anunciantes o aseguradoras sin revelar completamente la información.
- Por ejemplo, un informe del Consejo Noruego del Consumidor reveló que varias aplicaciones de salud compartían datos de los usuarios con terceros sin el consentimiento adecuado.
- Estas preocupaciones, sumadas a la aplicación inconsistente a nivel mundial de las normativas de protección de datos, como el Reglamento General de Protección de Datos (RGPD), generan dudas entre los nuevos usuarios y amenazan la retención, lo que hace crucial que los desarrolladores garanticen una sólida gobernanza de datos y transparencia para el usuario con el fin de sostener el crecimiento a largo plazo.
¿Cómo se segmenta el mercado de aplicaciones de dieta y nutrición?
El mercado se segmenta en función del tipo, los productos, el género, la edad, la plataforma y el usuario final .
• Por tipo
Según el tipo, el mercado de aplicaciones de dieta y nutrición se segmenta en aplicaciones de seguimiento nutricional, aplicaciones de seguimiento de actividad, aplicaciones de plataformas sociales, aplicaciones de apuestas y otras. El segmento de aplicaciones de seguimiento nutricional dominó el mercado con la mayor cuota de mercado, un 36,8 % en 2024, impulsado por la creciente concienciación sobre los estilos de vida saludables y el mayor interés de los consumidores en el control de calorías, la planificación de dietas y la gestión nutricional personalizada. Estas aplicaciones permiten a los usuarios registrar la ingesta diaria de alimentos, controlar los macronutrientes y recibir recomendaciones dietéticas personalizadas según sus objetivos de salud, como la pérdida de peso o el aumento de masa muscular. La creciente integración de recomendaciones basadas en IA, el escaneo de códigos de barras para el registro de alimentos y los planes de dieta personalizados impulsan aún más la adopción de aplicaciones de seguimiento nutricional entre los usuarios preocupados por su salud.
Se prevé que el segmento de aplicaciones de seguimiento de actividad experimente el mayor crecimiento anual compuesto (CAGR) del 19,6 % entre 2025 y 2032, impulsado por la creciente popularidad del seguimiento de la actividad física y la creciente demanda de plataformas integradas de monitorización de la salud. Estas aplicaciones permiten a los usuarios monitorizar actividades físicas como caminar, correr, montar en bicicleta y rutinas de entrenamiento, sincronizándose con dispositivos portátiles. La creciente adopción de dispositivos portátiles inteligentes y ecosistemas móviles centrados en el fitness está impulsando significativamente el crecimiento de este segmento.
• Subproductos
En función de los productos, el mercado de aplicaciones de dieta y nutrición se segmenta en teléfonos inteligentes, dispositivos portátiles y tabletas. El segmento de teléfonos inteligentes dominó el mercado con la mayor cuota de ingresos, un 58,7 % en 2024, debido principalmente a la amplia adopción global de estos dispositivos y la comodidad que ofrecen para acceder a aplicaciones de salud y bienestar en cualquier momento y lugar. Los teléfonos inteligentes son la plataforma principal para descargar y usar estas aplicaciones, ofreciendo funciones como el registro de comidas, el seguimiento de calorías, la monitorización del progreso y la integración con sistemas de datos de salud. La disponibilidad de conectividad a internet de alta velocidad y los ecosistemas avanzados de aplicaciones móviles refuerzan aún más el dominio de este segmento.
Se prevé que el segmento de dispositivos portátiles experimente el mayor crecimiento anual compuesto (CAGR) del 21,2 % entre 2025 y 2032, impulsado por la creciente adopción de relojes inteligentes y pulseras de actividad que monitorizan continuamente parámetros de salud como la actividad física, la frecuencia cardíaca y el gasto calórico. La integración entre los dispositivos portátiles y las aplicaciones móviles de nutrición permite el seguimiento de la salud en tiempo real y ofrece información nutricional personalizada, lo que acelera el crecimiento del segmento.
• Por género
En función del género, el mercado de aplicaciones de dieta y nutrición se segmenta en mujeres y hombres. El segmento femenino representó la mayor cuota de mercado, con un 54,1 % en 2024, debido a la creciente concienciación sobre la salud entre las mujeres y al mayor interés por el control del peso, la nutrición equilibrada y los programas de bienestar. Muchas aplicaciones de dieta y nutrición están diseñadas con funciones específicas para mujeres, como el control de calorías, la orientación nutricional durante el embarazo y la planificación de dietas basadas en el estilo de vida. Además, las mujeres son más propensas a adoptar herramientas de salud digital que apoyen sus objetivos de bienestar a largo plazo y las prácticas de atención médica preventiva.
Se prevé que el segmento masculino experimente el mayor crecimiento anual compuesto (CAGR) del 18,3 % entre 2025 y 2032, lo que refleja el creciente interés de los hombres por el entrenamiento físico, el desarrollo muscular y la nutrición orientada al rendimiento. La creciente popularidad de las membresías de gimnasio, las tendencias del culturismo y los estilos de vida centrados en el fitness están impulsando a los hombres a adoptar aplicaciones de dieta y nutrición para controlar los macronutrientes y optimizar la ingesta alimentaria para alcanzar sus objetivos de fitness.
• Por edad
Según la edad, el mercado de aplicaciones de dieta y nutrición se segmenta en adultos, adolescentes y personas mayores. El segmento de adultos dominó el mercado con la mayor cuota de ingresos, un 49,6 % en 2024, ya que representan el grupo más numeroso que gestiona activamente su salud, rutinas de ejercicio y hábitos alimenticios a través de plataformas digitales. El ritmo de vida ajetreado y la creciente preocupación por la obesidad, la diabetes y las enfermedades cardiovasculares están impulsando a los adultos a adoptar aplicaciones de dieta y nutrición que ofrecen herramientas prácticas para planificar comidas, controlar las calorías y monitorizar la salud.
Se prevé que el segmento de adolescentes experimente el mayor crecimiento anual compuesto (CAGR) del 20,1 % entre 2025 y 2032, impulsado por la creciente concienciación sobre el ejercicio físico y los hábitos alimenticios saludables entre los jóvenes. La influencia de las tendencias de fitness en redes sociales, las actividades deportivas y las comunidades digitales de bienestar anima a los adolescentes a utilizar aplicaciones móviles de nutrición para controlar sus hábitos alimenticios y mejorar su salud en general.
• Por plataforma
En función de la plataforma, el mercado de aplicaciones de dieta y nutrición se segmenta en Android, iOS, Windows y otras. El segmento de Android dominó el mercado con la mayor cuota de ingresos, un 63,4 % en 2024, gracias a la amplia disponibilidad global de smartphones Android y al extenso ecosistema de aplicaciones de salud móvil disponibles en las tiendas de aplicaciones. Las plataformas basadas en Android ofrecen flexibilidad a los desarrolladores y accesibilidad a usuarios de diversos niveles socioeconómicos, lo que amplía significativamente el alcance de las aplicaciones de dieta y nutrición.
Se prevé que el segmento iOS experimente el crecimiento anual compuesto más rápido, del 19,4%, entre 2025 y 2032, impulsado por la creciente adopción de aplicaciones de salud premium entre los usuarios de iPhone y una mayor integración con sistemas de seguimiento de la salud como Apple Health y dispositivos portátiles. Las plataformas iOS también ofrecen funciones de seguridad avanzadas y una experiencia de usuario fluida, lo que favorece el crecimiento del segmento.
• Por el usuario final
Según el usuario final, el mercado de aplicaciones de dieta y nutrición se segmenta en gimnasios, sector sanitario, atención domiciliaria y otros. El segmento de atención domiciliaria dominó el mercado con la mayor cuota de ingresos, un 45,8 % en 2024, impulsado por la creciente tendencia del autocontrol de la salud y la gestión personalizada del bienestar. Los consumidores prefieren cada vez más usar aplicaciones móviles en casa para llevar un registro de su dieta diaria, controlar su progreso físico y recibir orientación nutricional personalizada sin necesidad de supervisión profesional.
Se prevé que el sector de la salud experimente el mayor crecimiento anual compuesto (CAGR) del 20,7 % entre 2025 y 2032, impulsado por la creciente integración de las tecnologías de salud digital en la atención clínica y los programas de atención médica preventiva. Los proveedores de atención médica están adoptando aplicaciones de dieta y nutrición para facilitar el seguimiento de los pacientes, gestionar enfermedades crónicas y ofrecer recomendaciones dietéticas personalizadas, lo que acelera el crecimiento de este sector.
¿Qué región concentra la mayor parte del mercado de aplicaciones de dieta y nutrición?
- Alemania dominó el mercado europeo de aplicaciones de dieta y nutrición con la mayor cuota de ingresos, un 43,7 % en 2025, gracias a la creciente concienciación sobre los estilos de vida saludables, la mayor adopción de aplicaciones de salud móvil y el creciente interés de los consumidores por la atención médica preventiva y la gestión del estado físico. El país cuenta con un ecosistema de salud digital consolidado, con una amplia penetración de teléfonos inteligentes, comunidades de fitness en expansión y una fuerte adopción de dispositivos portátiles de salud. Los consumidores de todo el país utilizan cada vez más aplicaciones de dieta y nutrición para controlar la ingesta de calorías, gestionar el peso y mantener planes nutricionales equilibrados en los principales centros urbanos como Berlín, Fráncfort y Múnich.
- En el país, la creciente adopción de plataformas de seguimiento de dietas basadas en IA, herramientas de planificación nutricional personalizadas y aplicaciones móviles de bienestar está acelerando significativamente el uso de aplicaciones de dieta y nutrición. La integración de dispositivos portátiles de fitness y tecnologías de monitorización de la salud en tiempo real está animando a las personas a realizar un seguimiento más eficaz de su actividad física y sus hábitos alimenticios.
- En Alemania, la creciente preocupación de la población por la salud, el aumento de las inscripciones a gimnasios y la expansión de las iniciativas de salud digital refuerzan aún más la posición de liderazgo del país en el mercado europeo de aplicaciones de dieta y nutrición.
Análisis del mercado de aplicaciones de dieta y nutrición en el Reino Unido
El Reino Unido está experimentando el mayor crecimiento de Europa, con un 10,92 %, impulsado por una mayor concienciación sobre la salud, el creciente uso de teléfonos inteligentes y la popularidad cada vez mayor de las plataformas digitales de bienestar. Los consumidores utilizan cada vez más aplicaciones móviles de dieta y ejercicio para controlar la ingesta calórica, mantener una alimentación equilibrada y alcanzar objetivos de salud personalizados. Además, la expansión de los programas de fitness en línea, los servicios de asesoramiento digital en salud y la adopción de dispositivos portátiles están acelerando aún más la demanda de aplicaciones de dieta y nutrición en todo el país.
Análisis del mercado de aplicaciones de dieta y nutrición en Francia
En Francia, el mercado de aplicaciones de dieta y nutrición se expande de forma constante, impulsado por una mayor concienciación pública sobre los hábitos alimenticios saludables y las prácticas de salud preventiva. La creciente adopción de aplicaciones de salud móvil, la expansión de las comunidades de bienestar digital y el creciente interés por el ejercicio físico y la gestión del estilo de vida impulsan el crecimiento del mercado. Además, la presencia de varias startups de salud digital y la creciente interacción de los consumidores con las tecnologías de bienestar móvil posicionan a Francia como un importante contribuyente al crecimiento del mercado regional de aplicaciones de dieta y nutrición.
¿Cuáles son las principales empresas en el mercado de aplicaciones de dieta y nutrición?
La industria de las aplicaciones de dieta y nutrición está liderada principalmente por empresas bien establecidas, entre las que se incluyen:
- Lumen Technologies (EE. UU.),
- Grupo Zayo (EE. UU.)
- Verizon Communications (EE. UU.)
- AT&T Inc. (EE. UU.)
- NTT Communications (Japón)
- Ciena Corporation (EE. UU.)
- Servicios Tecnológicos Colt (Reino Unido)
- Cox Communications (EE. UU.)
- Castillo de la Corona (EE. UU.)
- Orange SA (Francia)
- Tata Communications (India)
¿Cuáles son las últimas novedades en el mercado de aplicaciones de dieta y nutrición?
- En octubre de 2023, MyFitnessPal, Inc. lanzó la aplicación para Wear OS. Esta aplicación permite una integración perfecta con los dispositivos Wear OS, lo que permite a los usuarios registrar su actividad física y nutrición directamente desde sus relojes inteligentes. Proporciona un seguimiento en tiempo real de las calorías quemadas, los pasos dados y los entrenamientos completados, así como un fácil acceso a los datos nutricionales. La ventaja es que mejora la comodidad del usuario, permitiéndole gestionar sus datos de salud sobre la marcha sin necesidad de acceder a su teléfono. Este desarrollo impacta en el mercado al satisfacer la creciente demanda de soluciones de fitness portátiles más integradas y es probable que atraiga a un público más amplio, especialmente a aquellos que prefieren utilizar la tecnología portátil para la gestión de su salud.
- En marzo de 2023, Zoe obtuvo 2,5 millones de dólares de Flight Fund. Este desarrollo se centra en el avance de su plataforma personalizada de nutrición y salud, que utiliza el análisis del microbioma para brindar a los usuarios asesoramiento dietético personalizado. La inversión busca potenciar el enfoque de Zoe basado en datos para la nutrición, mejorando la precisión y la personalización para cada usuario. El beneficio radica en que permite a Zoe ofrecer información más personalizada y con respaldo científico sobre dieta y salud, empoderando a los usuarios para tomar mejores decisiones basadas en su biología única. Esta iniciativa impacta el mercado al ampliar los límites de la nutrición personalizada, creando una ventaja competitiva más sólida en el sector de la tecnología de la salud, que está en rápido crecimiento.
SKU-
Obtenga acceso en línea al informe sobre la primera nube de inteligencia de mercado del mundo

- Panel de análisis de datos interactivo
- Panel de análisis de empresas para oportunidades con alto potencial de crecimiento
- Acceso de analista de investigación para personalización y consultas
- Análisis de la competencia con panel interactivo
- Últimas noticias, actualizaciones y análisis de tendencias
- Aproveche el poder del análisis de referencia para un seguimiento integral de la competencia
Metodología de investigación
La recopilación de datos y el análisis del año base se realizan utilizando módulos de recopilación de datos con muestras de gran tamaño. La etapa incluye la obtención de información de mercado o datos relacionados a través de varias fuentes y estrategias. Incluye el examen y la planificación de todos los datos adquiridos del pasado con antelación. Asimismo, abarca el examen de las inconsistencias de información observadas en diferentes fuentes de información. Los datos de mercado se analizan y estiman utilizando modelos estadísticos y coherentes de mercado. Además, el análisis de la participación de mercado y el análisis de tendencias clave son los principales factores de éxito en el informe de mercado. Para obtener más información, solicite una llamada de un analista o envíe su consulta.
La metodología de investigación clave utilizada por el equipo de investigación de DBMR es la triangulación de datos, que implica la extracción de datos, el análisis del impacto de las variables de datos en el mercado y la validación primaria (experto en la industria). Los modelos de datos incluyen cuadrícula de posicionamiento de proveedores, análisis de línea de tiempo de mercado, descripción general y guía del mercado, cuadrícula de posicionamiento de la empresa, análisis de patentes, análisis de precios, análisis de participación de mercado de la empresa, estándares de medición, análisis global versus regional y de participación de proveedores. Para obtener más información sobre la metodología de investigación, envíe una consulta para hablar con nuestros expertos de la industria.
Personalización disponible
Data Bridge Market Research es líder en investigación formativa avanzada. Nos enorgullecemos de brindar servicios a nuestros clientes existentes y nuevos con datos y análisis que coinciden y se adaptan a sus objetivos. El informe se puede personalizar para incluir análisis de tendencias de precios de marcas objetivo, comprensión del mercado de países adicionales (solicite la lista de países), datos de resultados de ensayos clínicos, revisión de literatura, análisis de mercado renovado y base de productos. El análisis de mercado de competidores objetivo se puede analizar desde análisis basados en tecnología hasta estrategias de cartera de mercado. Podemos agregar tantos competidores sobre los que necesite datos en el formato y estilo de datos que esté buscando. Nuestro equipo de analistas también puede proporcionarle datos en archivos de Excel sin procesar, tablas dinámicas (libro de datos) o puede ayudarlo a crear presentaciones a partir de los conjuntos de datos disponibles en el informe.

