
Europe Diet And Nutrition Apps Market
Market Size in USD Billion
 USD
2.07 Billion
USD
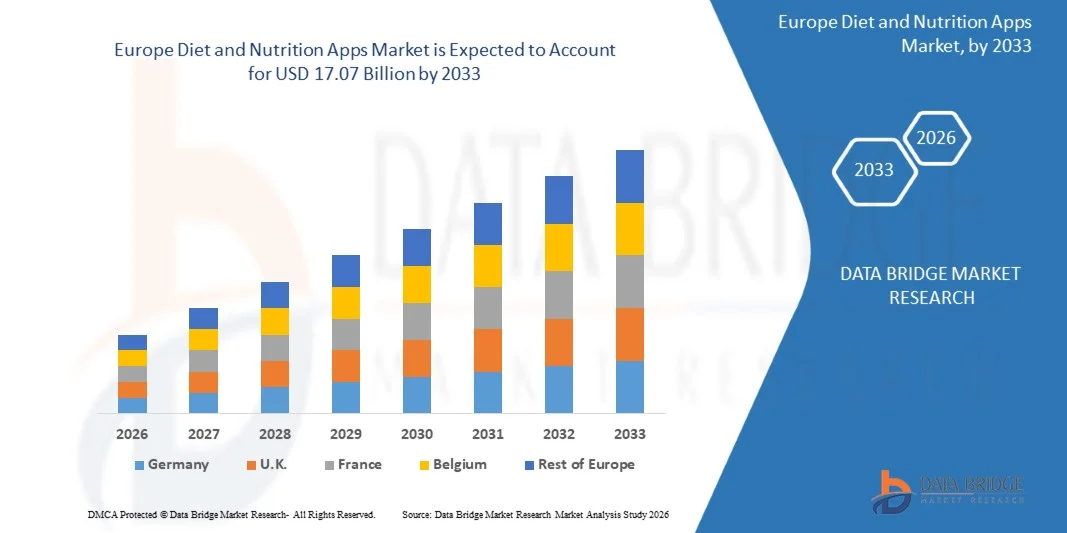
17.07 Billion
2025
2033
USD
2.07 Billion
USD
17.07 Billion
2025
2033
| 2026 - 2033 | |
| USD 2.07 Billion | |
| USD 17.07 Billion | |
| % | |
|
What is the Europe Diet and Nutrition Apps Market Size and Growth Rate?
- The Europe diet and nutrition apps market size was valued at USD 2.07 billion in 2025 and is expected to reach USD 17.07 billion by 2033, at a CAGR of 30.10% during the forecast period
- This growth is driven by factors such as the rising prevalence of lifestyle-related diseases, growing smartphone penetration, and increased adoption of digital health platforms
What are the Major Takeaways of Diet and Nutrition Apps Market?
- The diet and nutrition apps market are currently witnessing strong growth, with apps such as MyFitnessPal surpassing 200 million users globally as of 2024, offering features such as barcode scanning, calorie tracking, and personalized nutrition goals
- Platforms such as Noom, which reported over 45 million downloads, are being widely adopted for their psychology-based approach to weight loss and structured meal planning, making them popular among individuals seeking sustainable health changes
- Real-time syncing with wearable devices such as Fitbit, Garmin, and Apple Watch is becoming a standard feature, allowing users to track food intake, physical activity, heart rate, and sleep patterns all in one ecosystem, enhancing the app's utility and user retention
- Germany dominated the Europe diet and nutrition apps market with the largest revenue share of 43.7% in 2025, supported by the growing awareness of healthy lifestyles, increasing adoption of mobile health applications, and rising consumer focus on preventive healthcare and fitness management
- U.K. is witnessing the fastest growth rate of 10.92% in the Europe region, driven by increasing health awareness, rising smartphone usage, and the growing popularity of digital wellness platforms
- The Nutrition Tracking Apps segment dominated the Diet and Nutrition Apps market with the largest market revenue share of 36.8% in 2024, driven by the growing awareness of healthy lifestyles and increasing consumer focus on calorie monitoring, diet planning, and personalized nutrition management
Report Scope and Diet and Nutrition Apps Market Segmentation
|
Attributes |
Diet and Nutrition Apps Key Market Insights |
|
Segments Covered |
|
|
Countries Covered |
Europe
|
|
Key Market Players |
|
|
Market Opportunities |
|
|
Value Added Data Infosets |
In addition to the insights on market scenarios such as market value, growth rate, segmentation, geographical coverage, and major players, the market reports curated by the Data Bridge Market Research also include in-depth expert analysis, pricing analysis, brand share analysis, consumer survey, demography analysis, supply chain analysis, value chain analysis, raw material/consumables overview, vendor selection criteria, PESTLE Analysis, Porter Analysis, and regulatory framework. |
What is the Key Trend in the Diet and Nutrition Apps Market?
“Integration of Smart Features”
- The integration of smart features in diet and nutrition apps is enhancing user experience by enabling real-time tracking of calories, macronutrients, and hydration
- For instance, MyFitnessPal allows users to log meals using barcode scanners and photo-based food recognition
- Voice-enabled logging and smart notifications are becoming increasingly popular, helping users maintain consistency in their health routines
- For instance, Lifesum offers reminders for water intake and meal tracking, tailored to user behavior
- Personalization is at the core of this trend, with many apps using data analytics and machine learning to recommend meal plans based on dietary preferences, activity levels, and fitness goals
- For instance, Yazio creates adaptive meal suggestions based on a user's progress
- Integration with wearable devices such as Apple Watch, Fitbit, and Garmin allows users to sync their nutrition data with physical activity, sleep, and heart rate, creating a holistic view of wellness in one app
- Gamification and user-friendly interfaces are being adopted to make smart features more engaging; for instance, HealthifyMe includes daily challenges and progress streaks that motivate users while providing AI-powered insights through its virtual assistant Ria
What are the Key Drivers of Diet and Nutrition Apps Market?
- The rising demand for diet and nutrition apps is largely driven by growing awareness around preventive healthcare and maintaining a balanced lifestyle, especially among millennials and Gen Z who prefer digital solutions for health management
- The global surge in lifestyle-related diseases such as obesity, diabetes, and cardiovascular conditions has pushed consumers to become more conscious of their eating habits and seek tools to monitor and manage their nutrition
- For instance, MyFitnessPal and Noom have seen consistent growth in downloads and active users, thanks to features such as real-time calorie tracking, meal planning, and integration with wearable devices
- The influence of social media health influencers and online fitness challenges is encouraging more people to adopt diet apps
- For instance, platforms such as Instagram and TikTok are filled with content creators demonstrating how they use apps to achieve fitness goals
- Public health campaigns promoting healthy eating and the accessibility of mobile technology have made it easier for users to track their progress, stay accountable, and take control of their health without relying solely on clinics or professionals
Which Factor is Challenging the Growth of the Diet and Nutrition Apps Market?
- One of the biggest challenges in the diet and nutrition apps market is the rising concern around data privacy, as these platforms collect highly sensitive personal information including food habits, fitness routines, and in some cases, medical and biometric details
- If not properly secured, this data is vulnerable to cyber breaches and unauthorized access, which could result in serious consequences for users and erode trust in digital health solutions
- For instance, the health tracking app Strava faced backlash in the past when its global heat map revealed sensitive military base locations, highlighting how location and activity data can be misused if not protected properly
- Not all apps maintain clear privacy policies or user consent mechanisms, and some have been reported to sell anonymized data to advertisers or insurers without full disclosure
- For instance, a report by the Norwegian Consumer Council found that several health apps shared user data with third parties without proper consent
- These concerns, coupled with inconsistent global enforcement of data protection regulations such as the General Data Protection Regulation, create hesitation among new users and threaten retention, making it crucial for developers to ensure strong data governance and user transparency to sustain long-term growth
How is the Diet and Nutrition Apps Market Segmented?
The market is segmented on the basis of type, products, gender, age, platform, and end user.
• By Type
On the basis of type, the Diet and Nutrition Apps market is segmented into Nutrition Tracking Apps, Activity Tracking Apps, Social Platform Apps, Wager Apps, and Others. The Nutrition Tracking Apps segment dominated the Diet and Nutrition Apps market with the largest market revenue share of 36.8% in 2024, driven by the growing awareness of healthy lifestyles and increasing consumer focus on calorie monitoring, diet planning, and personalized nutrition management. These applications allow users to track daily food intake, monitor macronutrients, and receive customized diet recommendations based on health goals such as weight loss or muscle gain. The increasing integration of AI-based recommendations, barcode scanning for food logging, and personalized diet plans further enhances the adoption of nutrition tracking apps among health-conscious users.
The Activity Tracking Apps segment is anticipated to witness the fastest CAGR of 19.6% from 2025 to 2032, fueled by the rising popularity of fitness tracking and increasing demand for integrated health monitoring platforms. These apps enable users to monitor physical activities such as walking, running, cycling, and workout routines while synchronizing with wearable devices. The growing adoption of smart wearables and fitness-focused mobile ecosystems is significantly driving growth in this segment.
• By Products
On the basis of products, the Diet and Nutrition Apps market is segmented into Smartphones, Wearable Devices, and Tablets. The Smartphones segment dominated the market with the largest revenue share of 58.7% in 2024, primarily due to the widespread global adoption of smartphones and the convenience they provide for accessing health and wellness applications anytime and anywhere. Smartphones serve as the primary platform for downloading and using diet and nutrition applications, offering features such as meal logging, calorie tracking, progress monitoring, and integration with health data systems. The availability of high-speed internet connectivity and advanced mobile app ecosystems further strengthens the dominance of this segment.
The Wearable Devices segment is expected to witness the fastest CAGR of 21.2% from 2025 to 2032, driven by increasing adoption of smartwatches and fitness bands that continuously monitor health parameters such as physical activity, heart rate, and calorie expenditure. Integration between wearables and mobile diet apps enables real-time health tracking and personalized nutrition insights, accelerating segment growth.
• By Gender
On the basis of gender, the Diet and Nutrition Apps market is segmented into Women and Men. The Women segment held the largest market revenue share of 54.1% in 2024, attributed to increasing health awareness among women and growing interest in weight management, balanced nutrition, and wellness programs. Many diet and nutrition applications are designed with features specifically tailored for women, including calorie management, pregnancy nutrition guidance, and lifestyle-based diet planning. In addition, women are more likely to adopt digital health tools that support long-term wellness goals and preventive healthcare practices.
The Men segment is projected to witness the fastest CAGR of 18.3% from 2025 to 2032, reflecting rising interest among men in fitness training, muscle building, and performance-oriented nutrition. The growing popularity of gym memberships, bodybuilding trends, and fitness-focused lifestyle choices is encouraging men to adopt diet and nutrition apps to track macronutrients and optimize dietary intake for fitness goals.
• By Age
On the basis of age, the Diet and Nutrition Apps market is segmented into Adults, Teenagers, and Aged. The Adults segment dominated the market with the largest revenue share of 49.6% in 2024, as adults represent the largest group actively managing their health, fitness routines, and dietary habits through digital platforms. Busy lifestyles and increasing concerns regarding obesity, diabetes, and cardiovascular diseases are encouraging adults to adopt diet and nutrition apps that provide convenient tools for meal planning, calorie tracking, and health monitoring.
The Teenagers segment is expected to witness the fastest CAGR of 20.1% from 2025 to 2032, driven by growing awareness about fitness and healthy eating habits among younger populations. The influence of social media fitness trends, sports activities, and digital wellness communities is encouraging teenagers to engage with mobile nutrition applications to track diet habits and improve overall health outcomes.
• By Platform
On the basis of platform, the Diet and Nutrition Apps market is segmented into Android, iOS, Windows, and Others. The Android segment dominated the Diet and Nutrition Apps market with the largest revenue share of 63.4% in 2024, supported by the widespread global availability of Android smartphones and the extensive ecosystem of mobile health applications available through app marketplaces. Android-based platforms offer flexibility for developers and accessibility for users across diverse income groups, significantly expanding the reach of diet and nutrition applications.
The iOS segment is anticipated to witness the fastest CAGR of 19.4% from 2025 to 2032, driven by increasing adoption of premium health applications among iPhone users and stronger integration with health tracking systems such as Apple Health and wearable devices. iOS platforms also offer advanced security features and seamless user experiences, supporting growth in the segment.
• By End User
On the basis of end user, the Diet and Nutrition Apps market is segmented into Fitness Centers, Healthcare Industries, Homecare Settings, and Others. The Homecare Settings segment dominated the market with the largest revenue share of 45.8% in 2024, driven by the growing trend of self-managed health monitoring and personalized wellness management. Consumers increasingly prefer using mobile applications at home to track daily diet, monitor fitness progress, and receive personalized nutrition guidance without requiring professional supervision.
The Healthcare Industries segment is expected to witness the fastest CAGR of 20.7% from 2025 to 2032, supported by the increasing integration of digital health technologies within clinical care and preventive healthcare programs. Healthcare providers are adopting diet and nutrition applications to support patient monitoring, manage chronic conditions, and provide personalized dietary recommendations, which is accelerating growth in this segment.
Which Region Holds the Largest Share of the Diet and Nutrition Apps Market?
- Germany dominated the Europe diet and nutrition apps market with the largest revenue share of 43.7% in 2025, supported by the growing awareness of healthy lifestyles, increasing adoption of mobile health applications, and rising consumer focus on preventive healthcare and fitness management. The country has a well-established digital health ecosystem with widespread smartphone penetration, expanding fitness communities, and strong adoption of wearable health devices. Consumers across the country are increasingly using diet and nutrition apps to monitor calorie intake, manage weight, and maintain balanced nutrition plans across major urban centers such as Berlin, Frankfurt, and Munich
- In the country, rising adoption of AI-powered diet tracking platforms, personalized nutrition planning tools, and mobile wellness applications is significantly accelerating the use of diet and nutrition apps. Integration of wearable fitness devices and real-time health monitoring technologies is encouraging individuals to track physical activity and dietary habits more effectively
- In Germany, the growing health-conscious population, increasing fitness club memberships, and expanding digital healthcare initiatives further strengthen the country’s leadership position within the Europe Diet and Nutrition Apps market
U.K. Diet and Nutrition Apps Market Insight
U.K. is witnessing the fastest growth rate of 10.92% in the Europe region, driven by increasing health awareness, rising smartphone usage, and the growing popularity of digital wellness platforms. Consumers are increasingly adopting mobile diet and fitness applications to monitor calorie intake, maintain balanced diets, and achieve personalized health goals. In addition, the expansion of online fitness programs, digital health coaching services, and wearable device adoption is further accelerating the demand for diet and nutrition apps across the country.
France Diet and Nutrition Apps Market Insight
In France, the Diet and Nutrition Apps market is expanding steadily, supported by growing public awareness regarding healthy eating habits and preventive healthcare practices. Increasing adoption of mobile health applications, expanding digital wellness communities, and rising interest in fitness and lifestyle management are driving market growth. Moreover, the presence of several digital health startups and increasing consumer engagement with mobile wellness technologies position France as an important contributor to the regional Diet and Nutrition Apps market growth.
Which are the Top Companies in Diet and Nutrition Apps Market?
The Diet and Nutrition Apps industry is primarily led by well-established companies, including:
- Lumen Technologies (U.S.),
- Zayo Group (U.S.)
- Verizon Communications (U.S.)
- AT&T Inc. (U.S.)
- NTT Communications (Japan)
- Ciena Corporation (U.S.)
- Colt Technology Services (U.K.)
- Cox Communications (U.S.)
- Crown Castle (U.S.)
- Orange S.A. (France)
- Tata Communications (India)
What are the Recent Developments in Diet and Nutrition Apps Market?
- In October 2023, MyFitnessPal, Inc. released the Wear OS app. This app development enables seamless integration with Wear OS devices, allowing users to track their physical activities and nutrition directly from their smartwatches. It provides real-time tracking of calories burned, steps taken, and workouts completed, as well as easy access to nutrition data. The benefit is that it enhances user convenience, allowing them to manage their health data on-the-go without needing to access their phone. This development impacts the market by catering to the growing demand for more integrated, wearable fitness solutions and is likely to attract a broader audience, especially those who prefer using wearable technology for health management
- In March 2023, Zoe raised USD 2.5 million from Flight Fund. This development focuses on advancing its personalized nutrition and health platform, which uses microbiome analysis to provide users with tailored dietary advice. The investment aims to enhance Zoe's data-driven approach to nutrition, improving accuracy and customization for individual users. The benefit is that it allows Zoe to offer more personalized and scientifically-backed insights into diet and health, empowering users to make better decisions based on their unique biology. This move impacts the market by pushing the boundaries of personalized nutrition, creating a stronger competitive edge in the rapidly growing health tech space
SKU-

- Interactive Data Analysis Dashboard
- Company Analysis Dashboard for high growth potential opportunities
- Research Analyst Access for customization & queries
- Competitor Analysis with Interactive dashboard
- Latest News, Updates & Trend analysis
- Harness the Power of Benchmark Analysis for Comprehensive Competitor Tracking
Data collection and base year analysis are done using data collection modules with large sample sizes. The stage includes obtaining market information or related data through various sources and strategies. It includes examining and planning all the data acquired from the past in advance. It likewise envelops the examination of information inconsistencies seen across different information sources. The market data is analysed and estimated using market statistical and coherent models. Also, market share analysis and key trend analysis are the major success factors in the market report. To know more, please request an analyst call or drop down your inquiry.
The key research methodology used by DBMR research team is data triangulation which involves data mining, analysis of the impact of data variables on the market and primary (industry expert) validation. Data models include Vendor Positioning Grid, Market Time Line Analysis, Market Overview and Guide, Company Positioning Grid, Patent Analysis, Pricing Analysis, Company Market Share Analysis, Standards of Measurement, Global versus Regional and Vendor Share Analysis. To know more about the research methodology, drop in an inquiry to speak to our industry experts.
Data Bridge Market Research is a leader in advanced formative research. We take pride in servicing our existing and new customers with data and analysis that match and suits their goal. The report can be customized to include price trend analysis of target brands understanding the market for additional countries (ask for the list of countries), clinical trial results data, literature review, refurbished market and product base analysis. Market analysis of target competitors can be analyzed from technology-based analysis to market portfolio strategies. We can add as many competitors that you require data about in the format and data style you are looking for. Our team of analysts can also provide you data in crude raw excel files pivot tables (Fact book) or can assist you in creating presentations from the data sets available in the report.


