Europe Yogurt Market
Tamaño del mercado en miles de millones de dólares
Tasa de crecimiento anual compuesta (CAGR) :
% 
 USD
28.78 Billion
USD
43.35 Billion
2024
2032
USD
28.78 Billion
USD
43.35 Billion
2024
2032
| 2025 –2032 | |
| USD 28.78 Billion | |
| USD 43.35 Billion | |
| % | |
|
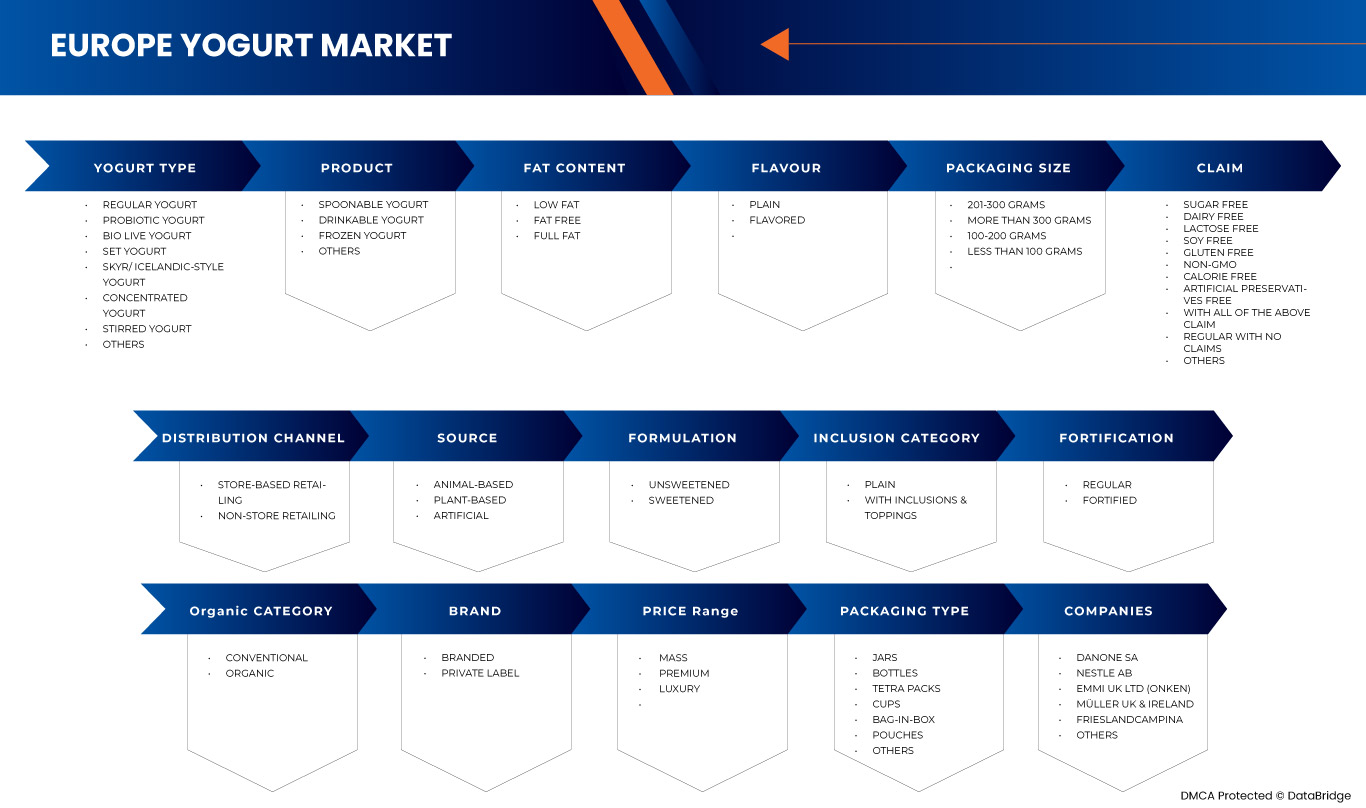
Mercado europeo de yogur, tipo de yogur (yogur, yogur skyr/yogur islandés, yogur concentrado, yogur probiótico, yogur cuajado, yogur bio vivo, yogur batido y otros), tipo de producto (yogur bebible, yogur para servir con cuchara, yogur helado y otros), contenido de grasa (entero, bajo en grasa y sin grasa), sabor (natural y con sabor), tipo de origen (de origen animal, vegetal y artificial), formulación (endulzado y sin azúcar), marca (Yoplait, Chobani, Stonyfield Greek, Corner, Activia, Yeo, Oikos, Arla Skyr, Icelandic Provisions Skyr, Isey Skyr y otras), categoría de inclusión (natural y con inclusiones y aderezos), fortificación (regular y fortificado), declaración (sin gluten, sin lactosa, sin conservantes artificiales, sin lácteos, sin soja, sin OMG, azúcar) Libre, sin calorías, con todas las afirmaciones anteriores, regular sin afirmaciones y otros), categoría orgánica (convencional y orgánica), marca (de marca y privada), empaque (bolsa en caja, bolsas, frascos, vasos, botellas, paquetes de tetrabrik y otros), tamaño del empaque (menos de 100 gramos, 100-200 gramos, 201-300 gramos y más de 300 gramos) y canal de distribución (venta minorista en tiendas y venta minorista fuera de tiendas): tendencias de la industria y pronóstico hasta 2032.
Análisis del mercado europeo del yogur
El yogur es un alimento ancestral, utilizado por pueblos de Asia, Europa y Oriente Medio a lo largo de milenios. Surgió por primera vez durante el Neolítico, hace entre 5.000 y 10.000 años, probablemente como resultado de la acidificación natural de la leche con temperaturas cálidas. La evidencia de la cerámica antigua muestra que los pueblos neolíticos utilizaban estas vasijas para almacenar leche. Como alimento fermentado, el yogur era una excelente manera de conservar la leche, ya que su acidez ralentizaba el crecimiento de bacterias dañinas. El yogur era un alimento muy conocido en el Imperio griego y romano y ha desempeñado un papel fundamental en la cocina mediterránea desde el año 800 a. C.
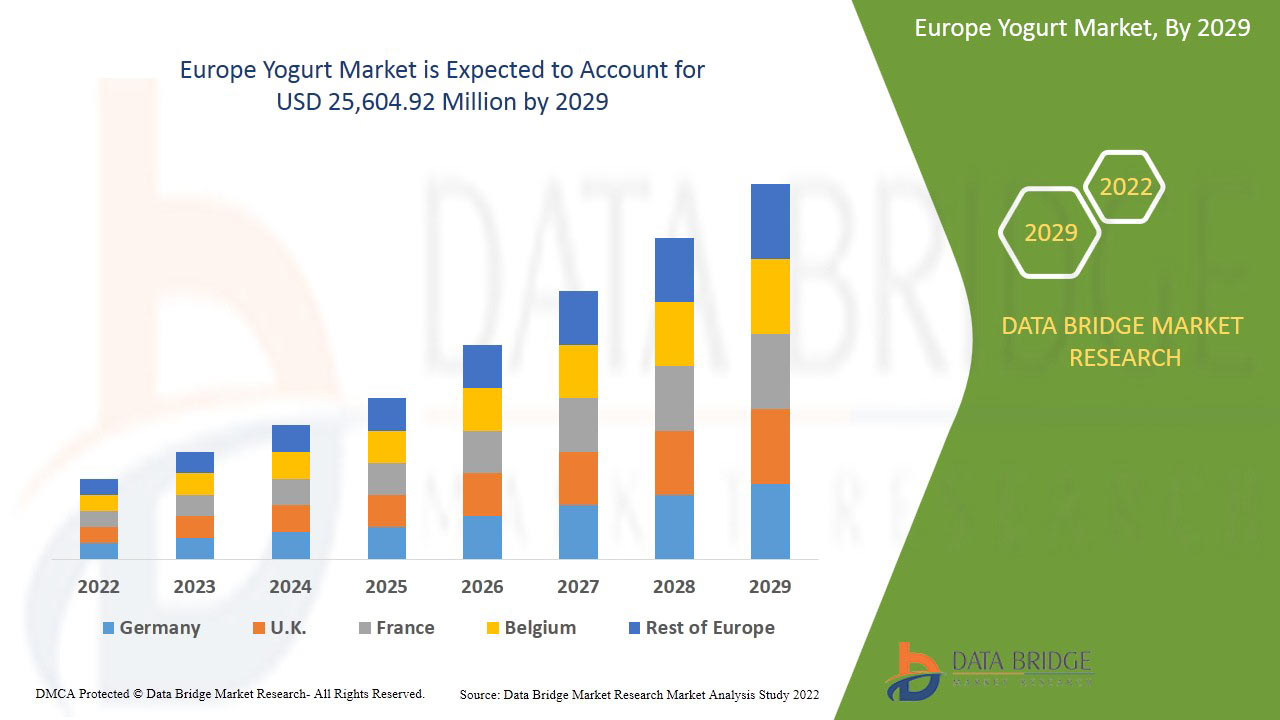
Tamaño del mercado del yogur en Europa
El tamaño del mercado de yogur en Europa se valoró en USD 28,78 mil millones en 2024 y se proyecta que alcance los USD 43,35 mil millones para 2032, con una CAGR del 5,4% durante el período de pronóstico de 2025 a 2032. Además de la información sobre escenarios de mercado como el valor de mercado, la tasa de crecimiento, la segmentación, la cobertura geográfica y los principales actores, los informes de mercado seleccionados por Data Bridge Market Research también incluyen análisis de importación y exportación, descripción general de la capacidad de producción, análisis del consumo de producción, análisis de tendencias de precios, escenario de cambio climático, análisis de la cadena de suministro, análisis de la cadena de valor, descripción general de materias primas/consumibles, criterios de selección de proveedores, análisis PESTLE, análisis de Porter y marco regulatorio.
Tendencias del mercado del yogur en Europa
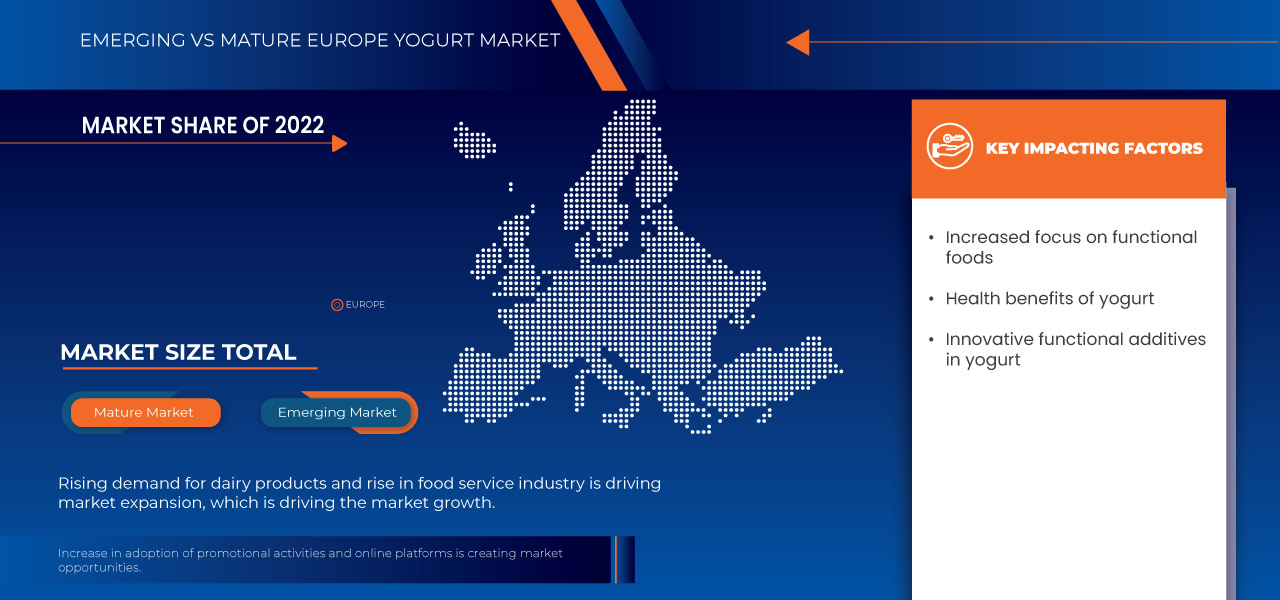
Creciente interés en los alimentos funcionales
El creciente interés en los alimentos funcionales está transformando rápidamente el mercado europeo del yogur, ya que los consumidores buscan cada vez más productos que ofrezcan más que una simple nutrición básica. El yogur enriquecido con vitaminas, minerales y probióticos está ganando terreno a medida que las personas buscan opciones de alimentos que aporten beneficios específicos para la salud, como una mejor salud intestinal, un mayor sistema inmunitario y una mejor función digestiva. Esta transición hacia los alimentos funcionales refleja una tendencia más amplia de los consumidores a priorizar alimentos con una doble función: saciar el hambre y, al mismo tiempo, ofrecer beneficios mensurables para la salud. Como resultado, los fabricantes de yogur enriquecen cada vez más sus productos con ingredientes beneficiosos como la vitamina D, el calcio y los cultivos vivos, aprovechando la creciente demanda de alimentos orientados al bienestar. La creciente variedad de yogures funcionales, incluyendo aquellos diseñados para necesidades específicas de salud como la salud ósea o el refuerzo inmunitario, está impulsando el crecimiento del mercado. Este auge del interés de los consumidores por los alimentos funcionales posiciona al yogur como un actor clave en el creciente sector de los alimentos para el bienestar, acelerando aún más su expansión en el mercado europeo.
Alcance del informe y segmentación del mercado del yogur en Europa
|
Atributos |
Perspectivas del mercado de pruebas de diagnóstico en Alemania, Suiza y Austria |
|
Segmentos cubiertos |
Tipo de yogur (yogur, yogur Skyr/yogur estilo islandés, yogur concentrado, yogur probiótico, yogur cuajado, yogur vivo biológico, yogur batido y otros), tipo de producto (yogur bebible, yogur para servir con cuchara, yogur helado y otros), contenido de grasa (entero, bajo en grasa y sin grasa), sabor (natural y con sabor), tipo de origen (de origen animal, vegetal y artificial), formulación (endulzado y sin azúcar), marca (Yoplait, Chobani, Stonyfield Greek, Corner, Activia, Yeo, Oikos, Arla Skyr, Icelandic Provisions Skyr, Isey Skyr y otros), categoría de inclusión (natural y con inclusiones y aderezos), fortificación (regular y fortificado), declaración (sin gluten, sin lactosa, sin conservantes artificiales, sin lácteos, sin soja, sin OMG, sin azúcar, calorías Gratis, con todas las afirmaciones anteriores, regular sin afirmaciones y otros), categoría orgánica (convencional y orgánica), marca (de marca y privada), empaque (bolsa en caja, bolsas, frascos, vasos, botellas, tetrabriks y otros), tamaño del empaque (menos de 100 gramos, 100-200 gramos, 201-300 gramos y más de 300 gramos) y canal de distribución (venta minorista en tiendas físicas y venta minorista sin tiendas físicas). |
|
Países cubiertos |
Alemania, Francia, Reino Unido, Italia, España, Rusia, Países Bajos, Bélgica, Suiza, Turquía y resto de Europa |
|
Actores clave del mercado |
Danone (Francia), Nestlé (Suiza), EMMY UK LTD (Londres), Müller UK & Ireland (Inglaterra), FrieslandCampina (Países Bajos), THE CAMPBELL'S COMPANY (EE. UU.), Arla Foods Amba (Dinamarca), SCHREIBER FOOD INC (EE. UU.), Sodiaal (Francia), CREMO SA (Suiza), Fen Farm Dairy (Reino Unido), LACTEAS FLOR DE BURGOS SL (España), LATTE MAREMMA (Italia), Newlat Food SpA (Italia), The Hain Celestial Group, Inc. (Nueva York) y Yeo Valley Organic Limited (Reino Unido). |
|
Oportunidades de mercado |
|
|
Conjuntos de información de datos de valor añadido |
Además de los conocimientos sobre escenarios de mercado como valor de mercado, tasa de crecimiento, segmentación, cobertura geográfica y actores principales, los informes de mercado seleccionados por Data Bridge Market Research también incluyen análisis de importación y exportación, descripción general de la capacidad de producción, análisis del consumo de producción, análisis de tendencias de precios, escenario de cambio climático, análisis de la cadena de suministro, análisis de la cadena de valor, descripción general de materias primas/consumibles, criterios de selección de proveedores, análisis PESTLE, análisis de Porter y marco regulatorio. |
Definición del mercado europeo del yogur
El yogur es un producto lácteo rico en grasa, que suele contener entre un 30 % y un 40 % de grasa láctea, especialmente diseñado para batirlo hasta obtener una textura ligera y esponjosa. Puede elaborarse con leche de vaca o de otros animales lecheros y se caracteriza por su consistencia rica y cremosa, lo que lo hace ideal para aplicaciones culinarias como aderezo de postres, rellenos y salsas. Su alto contenido en grasa le permite incorporar aire al batirse, lo que da como resultado una espuma estable que mantiene su forma, convirtiéndolo en un ingrediente popular tanto en cocinas domésticas como profesionales para crear una variedad de platos deliciosos y visualmente atractivos.
Dinámica del mercado del yogur en Europa
Conductores
- Beneficios del yogur para la salud
Los beneficios del yogur para la salud son un factor clave para el mercado europeo, ya que cada vez más consumidores reconocen sus efectos positivos en el bienestar general. El yogur es ampliamente conocido por su rico contenido en probióticos, que favorecen la salud digestiva y equilibran la microbiota intestinal. La inclusión de nutrientes esenciales como calcio, proteínas y vitamina D aumenta aún más su atractivo, especialmente entre las personas preocupadas por su salud. Además de promover la salud intestinal, el yogur se relaciona con la mejora del sistema inmunitario, la fortaleza ósea e incluso la salud mental gracias a su alto valor nutricional. A medida que aumenta la demanda de alimentos funcionales, su papel como opción versátil y rica en nutrientes lo posiciona a la vanguardia de las dietas saludables. Esta creciente concienciación sobre los beneficios del yogur para la salud ha impulsado las preferencias de los consumidores hacia productos que ofrecen más que solo sabor, impulsando un aumento de su consumo en toda Europa. El creciente énfasis en la salud y el bienestar continúa impulsando el crecimiento del mercado, ya que cada vez más personas incorporan el yogur a su rutina diaria por sus numerosos beneficios para la salud.
Por ejemplo.
- En abril de 2022, según un artículo publicado por Healthline, el yogur aporta casi todos los nutrientes esenciales que el cuerpo necesita, incluyendo altos niveles de calcio, vitaminas del complejo B y oligoelementos. Estos nutrientes favorecen la salud ósea, el metabolismo energético y el bienestar general. A medida que los consumidores priorizan cada vez más las opciones saludables, el completo perfil nutricional del yogur impulsa su popularidad. Este enfoque en los beneficios del yogur para la salud impulsa el crecimiento y la demanda en el mercado europeo del yogur.
- En diciembre de 2024, según un artículo publicado por el NCBI, el consumo de yogur se relacionó con un menor riesgo de envejecimiento prematuro y también podría ayudar a disminuir la probabilidad de sobrepeso. Estos posibles beneficios para la salud hacen del yogur una opción atractiva para los consumidores interesados en la longevidad y el control de peso. A medida que los hábitos alimenticios saludables siguen en aumento, el papel del yogur en el fomento de un estilo de vida saludable impulsa su creciente demanda en el mercado europeo.
Los beneficios del yogur para la salud son un factor clave de su creciente popularidad en Europa, ya que cada vez más consumidores reconocen su impacto positivo en el bienestar general. Rico en probióticos, calcio, proteínas y vitamina D, el yogur favorece la salud digestiva, el sistema inmunitario, la fortaleza ósea y la salud mental. Ante la creciente demanda de alimentos funcionales, su valor nutricional lo convierte en una opción predilecta para las personas preocupadas por su salud, lo que ha impulsado un aumento de su consumo en toda Europa.
- Aditivos funcionales innovadores en el yogur
Los aditivos funcionales innovadores desempeñan un papel fundamental en el crecimiento del mercado europeo del yogur. A medida que las preferencias de los consumidores se orientan hacia productos saludables, se incorporan cada vez más ingredientes funcionales como probióticos, prebióticos, vitaminas, minerales e incluso superalimentos como las semillas de chía y la cúrcuma. Estos aditivos no solo mejoran el valor nutricional del yogur, sino que también aportan beneficios específicos para la salud, como una mejor digestión, un mayor sistema inmunitario y un mayor nivel de energía. Ante la creciente demanda de productos que aporten más que una nutrición básica, los fabricantes de yogur innovan continuamente para introducir nuevos sabores e ingredientes beneficiosos para la salud. Esta tendencia hacia los yogures fortificados y funcionales satisface una amplia gama de necesidades dietéticas y objetivos de salud, atrayendo a consumidores preocupados por su salud en toda Europa. El enfoque en la innovación y la incorporación de aditivos funcionales ha generado una ventaja competitiva para las marcas, impulsando aún más la expansión del mercado del yogur.
Por ejemplo,
- En octubre de 2023, según un artículo publicado por el NCBI, los yogures formulados con aditivos naturales y modificados ofrecen diversos beneficios nutracéuticos, como compuestos bioactivos mejorados, propiedades antioxidantes y efectos antihiperglucémicos y antihipertensivos. Estos beneficios adicionales para la salud se alinean con la creciente demanda de alimentos funcionales por parte de los consumidores. La incorporación de estos aditivos innovadores está impulsando la expansión del mercado europeo del yogur, ya que los consumidores buscan cada vez más productos que favorezcan su salud y bienestar general.
- En julio de 2024, según un artículo publicado por MDPI, la incorporación de ingredientes prebióticos y probióticos al yogur mejora tanto la calidad del producto como la salud del consumidor. Los probióticos, como las bacterias lácticas, favorecen la salud intestinal y la función del sistema inmunitario, mientras que los prebióticos nutren las bacterias intestinales beneficiosas. Esta sinergia crea un yogur con propiedades funcionales superiores, lo que aumenta su atractivo. A medida que aumenta la demanda de alimentos saludables, esta innovación impulsa el crecimiento del mercado europeo del yogur.
Los aditivos funcionales impulsan el crecimiento del mercado europeo del yogur, a medida que aumenta la demanda de productos saludables. La incorporación de ingredientes como probióticos, prebióticos, vitaminas, minerales y superalimentos como las semillas de chía y la cúrcuma potencia el valor nutricional y busca beneficios específicos para la salud, como la digestión y el sistema inmunitario. Esta tendencia de fortificar yogures con ingredientes funcionales atrae a los consumidores preocupados por su salud, impulsando la innovación y la competencia en el mercado.
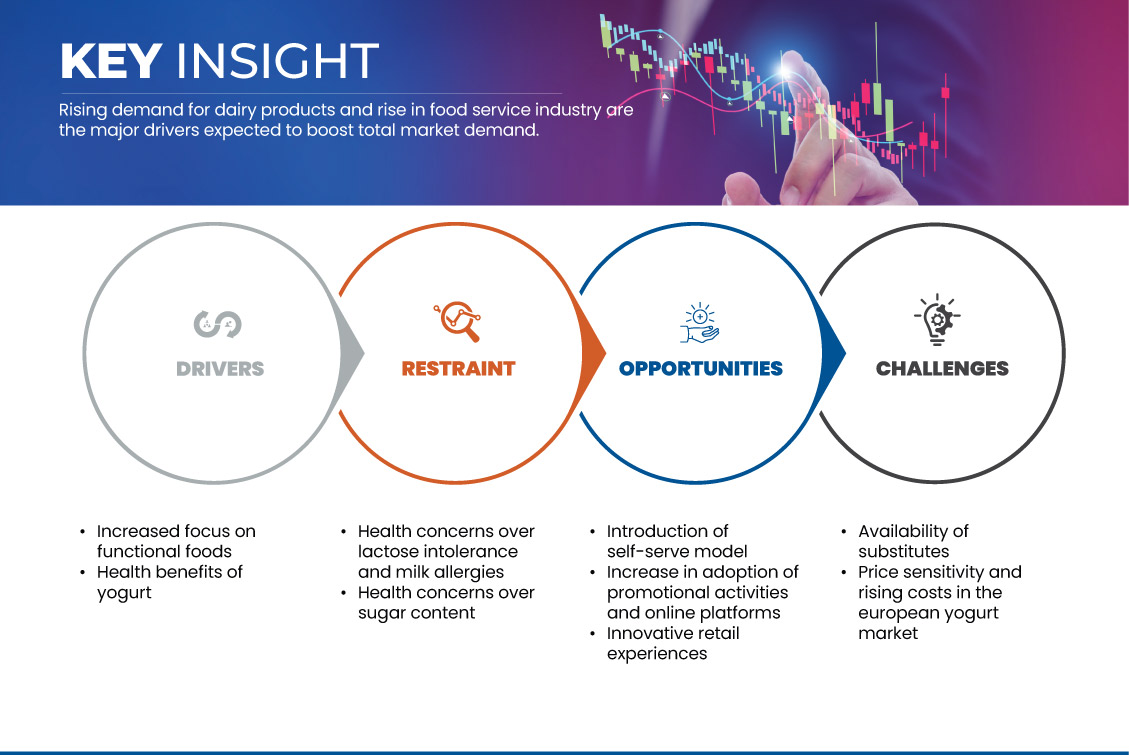
Oportunidades
- Introducción del modelo de autoservicio
El yogur tiene una gran demanda en Europa debido a sus beneficios para la salud, en comparación con otros postres como helados, natillas y otros. Algunas tiendas de yogur están operando para satisfacer la alta demanda de los consumidores. Estas tiendas ofrecen modelos de autoservicio que están ganando popularidad entre los consumidores.
Los modelos de autoservicio ofrecen a los consumidores total autonomía sobre los sabores, los ingredientes y la cantidad de yogures helados, permitiéndoles elegir y controlar su consumo según sus necesidades dietéticas. Las tiendas de yogur helado de autoservicio ofrecen una gran variedad de ingredientes, además de una alternativa más saludable al helado. El número de tiendas de autoservicio ha aumentado drásticamente en comparación con las tiendas de servicio completo.
Por ejemplo,
Yogurtini Frozen Yogurt ofrece entre 10 y 16 sabores de yogur helado y más de 65 ingredientes. Recopilan las opiniones y sugerencias de los clientes y personalizan su menú.
Una tienda de yogur helado de autoservicio en el Reino Unido que ofrece yogures con múltiples sabores y coberturas para que los clientes creen su postre perfecto. El éxito de FroYo se debe a la creciente demanda de postres más saludables y personalizables.
Así, el modelo de autoservicio en el mercado de yogur helado es una de las grandes oportunidades para que los fabricantes atiendan a sus consumidores según su demanda.
- Aumento en la adopción de actividades promocionales y plataformas en línea
La demanda de yogur está aumentando rápidamente debido a diversos factores, como sus beneficios para la salud, nuevos sabores atractivos y otros. Diversas empresas del sector están implementando nuevas actividades promocionales para promocionar sus productos en el mercado, lo que genera nuevas oportunidades para los fabricantes de yogur.
Las empresas ofrecen emocionantes recompensas a los consumidores para atraer nuevos clientes. Por ejemplo, Yogurtland lanzó Recompensas Reales, basadas en el lema "Cuanto más disfrutes, más puntos ganarás", es decir, 2 puntos por cada dólar gastado. Con cada compra, el consumidor gana puntos y, por cada 100 puntos, recibe automáticamente una recompensa de 5 USD. Así es como las empresas buscan atraer nuevos clientes mediante actividades promocionales.
Aparte de esto, las empresas están introduciendo sus aplicaciones de pedidos en línea para llegar a una amplia gama de clientes.
Por ejemplo,
- En septiembre de 2019, Yogurtland se asoció con DoorDash para entregar yogur helado, helado y bebidas Drinkable Creations personalizables a domicilio u oficina. Esta colaboración permite a los amantes del yogur helado disfrutar de sus sabores y coberturas favoritos, incluyendo opciones dulces, frutales o gomitas, en los establecimientos participantes sin salir de casa. Por lo tanto, las nuevas actividades promocionales y la transformación digital en el mercado del yogur están creando nuevas oportunidades.
- En 2024, Menchie's se asoció con DoorDash para entregar yogur helado, ingredientes y otros artículos del menú a clientes en múltiples sucursales. Este servicio permite a los fanáticos disfrutar de sus creaciones favoritas de yogur helado sin salir de casa, lo que respalda el enfoque de Menchie's en la comodidad y la personalización.
Restricciones/Desafíos
- Disponibilidad de sustitutos
Existen alternativas al yogur, como helados, helados de frutas, sorbetes, helados sin lácteos, batidos, licuados y otros postres. La demanda de yogur está aumentando debido al cambio en el estilo de vida de las personas que optan por productos alimenticios más saludables. Sin embargo, el aumento de precio del yogur ha impulsado a los consumidores a optar por helados, batidos y otras opciones de postre más económicas, lo que ha dificultado su venta. Además, el yogur alternativo se considera la mayor amenaza para el mercado, ya que aún lo consumen principalmente personas con alergias a la leche, intolerancia a la lactosa y veganos.
Además, otras opciones de postres como chocolaterías y tiendas de dulces, lugares de reunión locales como cafeterías e incluso cadenas de jugos y batidos disponibles están planteando un gran desafío para los productos de yogur.
El 1 de diciembre de 2024, Ben & Jerry's presentó su nueva y emocionante variedad de helados sin lácteos. Estos sabores, como "Caramel Almond Brittle" y "Peanut Butter Cup", satisfacen la creciente demanda de postres vegetales y sin lácteos. A medida que más consumidores buscan alternativas veganas y sin lactosa, estas innovadoras opciones de helado compiten directamente con los yogures tradicionales en el mercado de postres.
El 18 de enero de 2024, The New York Times Wirecutter destacó la creciente demanda de helados veganos. Estas alternativas vegetales, elaboradas con ingredientes como leche de almendras, leche de coco y leche de avena, se están popularizando entre los consumidores intolerantes a la lactosa y veganos. Como resultado, compiten directamente con los yogures tradicionales en el mercado de postres.
En conclusión, la disponibilidad de una alternativa al yogur puede representar un desafío importante para el crecimiento del mercado durante el período de pronóstico.
- Sensibilidad a los precios y aumento de los costes en el mercado europeo del yogur
A medida que aumenta la demanda de yogures premium y especializados, el precio de estos productos también ha aumentado, haciéndolos menos accesibles para algunos consumidores. El mayor costo del yogur, especialmente de las variedades orgánicas, probióticas o sin lácteos, ha llevado a muchos consumidores a optar por alternativas más asequibles como helados, batidos, smoothies y otras opciones de postres. Este cambio se ve amplificado por las presiones inflacionarias y otros factores económicos, que están haciendo que los consumidores sean más conscientes de sus gastos.
Las marcas de yogur se enfrentan al reto de equilibrar la calidad del producto con la rentabilidad, buscando precios competitivos y satisfaciendo la demanda de opciones de yogur saludables, de alta calidad y funcionales. Ante la sensibilidad al precio, muchos productores de yogur están explorando métodos de fabricación rentables, introduciendo variantes más económicas u ofreciendo porciones más pequeñas para que sus productos sean más asequibles para un público más amplio.
Además, el auge de las marcas blancas de yogur, que suelen ofrecer precios más bajos en comparación con las marcas reconocidas, aumenta la competencia. Estas opciones de marca blanca suelen ofrecer menos características premium, pero atraen a consumidores preocupados por el precio que buscan alternativas asequibles. Como resultado, las marcas de yogur consolidadas se ven obligadas a buscar maneras de innovar sin alejar a los compradores con presupuesto ajustado, incluyendo la oferta de paquetes con descuento o promociones para fidelizar a los clientes.
Por ejemplo,
- En agosto de 2024, según un artículo publicado por Dairy Foods, el Estado de la Industria Láctea 2024 destaca los importantes desafíos que enfrentan los productores de yogur en Europa debido al aumento de los costos, la inflación y las interrupciones en la cadena de suministro. Al igual que los desafíos en el mercado de servicios estéticos del Sudeste Asiático (según lo informado por AIA Malasia), la industria del yogur enfrenta barreras financieras que podrían limitar su crecimiento. El aumento de los costos de producción está provocando un aumento de precios en los yogures premium, lo que podría limitar su accesibilidad para un público más amplio. Este desafío financiero podría disuadir a algunos consumidores de comprar yogures de mayor precio, lo que dificultaría la expansión del mercado en la región.
- En agosto de 2024, según un artículo publicado por Kerry Group titulado "Tendencias de Crecimiento de las Marcas Blancas", la creciente popularidad de los productos de marca blanca presenta importantes desafíos para los fabricantes de yogur de marca en Europa, especialmente en un mercado con mayor competencia y sensibilidad al precio. Al igual que los desafíos en el mercado de servicios estéticos del Sudeste Asiático (según AIA Malasia), las marcas de yogur se enfrentan a barreras financieras, ya que el aumento del coste de producción y los productos premium empuja a los consumidores hacia opciones de marca blanca más asequibles. Este cambio puede limitar la accesibilidad y la asequibilidad de los yogures de marca, lo que en última instancia restringe el crecimiento del mercado y dificulta que las empresas de marca atraigan a consumidores sensibles al precio.
El desafío de la sensibilidad al precio y el aumento de los costos exige a los productores de yogur innovar manteniendo la asequibilidad. Para mantenerse competitivas, las marcas deben encontrar maneras de equilibrar la oferta de productos premium con estrategias rentables, explorando alternativas como envases más pequeños, promociones y el desarrollo de productos con valor añadido que satisfagan las necesidades de los consumidores preocupados por su salud y su presupuesto.
Panorama del mercado europeo del yogur
El mercado europeo del yogur se segmenta en quince segmentos importantes, según el tipo de yogur, el tipo de producto, el contenido de grasa, el sabor, el tipo de fuente, la formulación, la categoría de inclusión, la fortificación, la declaración de propiedades, el rango de precios, la categoría orgánica, la marca, el envase, el tamaño del envase y el canal de distribución. El crecimiento de estos segmentos le ayudará a analizar los segmentos de menor crecimiento en las industrias y proporcionará a los usuarios una valiosa visión general del mercado y perspectivas que les ayudarán a tomar decisiones estratégicas para identificar las principales aplicaciones del mercado.
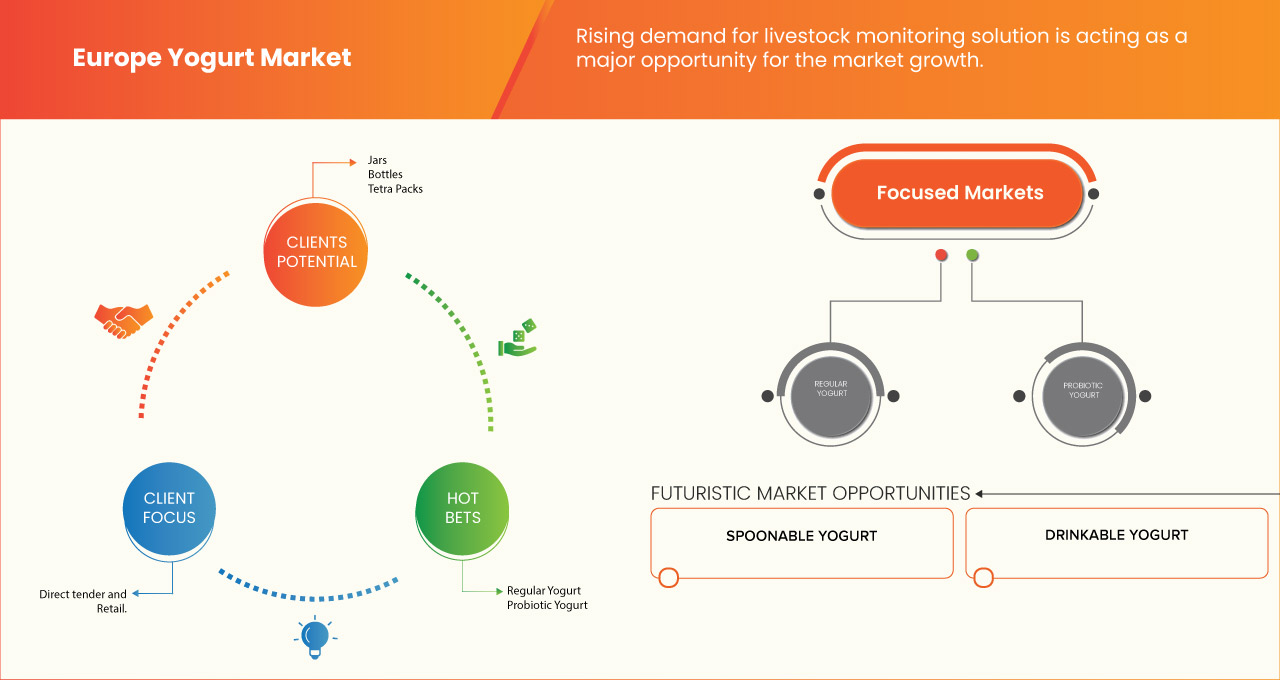
Tipo de yogur
- Yogur regular
- Yogur probiótico
- Yogur Bio Vivo
- Yogur en cuajada
- Yogur estilo islandés/skyr
- Yogur concentrado
- Yogur batido
- Otros
Tipo de producto
- Yogur para preparar con cuchara
- Yogur bebible
- Yogur helado
- Otros
Contenido de grasa
- Bajo en grasa
- Sin grasa
- Grasa completa
Sabor
- Plano
- Sazonado
- Fresa
- Vainilla
- Arándano
- Banana
- Durazno
- Arándano
- Zarzamora
- Frutas y nueces
- Cal
- Coco
- Cojones
- Cereza
- Cereza de huerto
- Miel
- Calabaza
- Chocolates
- Caramelo de azúcar con mantequilla
- Caramelo
- Moca/Café
- Pomogranett
- Menta
- Amaretto
- Otros
Fuente
- De origen animal
- De origen animal, por tipo
- Leche de vaca
- Leche de búfalo
- Leche de cabra
- Otros
- A base de plantas
- De origen vegetal, por tipo
- Leche de almendras
- leche de soja
- Leche de avena
- Leche de coco
- Leche de anacardo
- Otros
Formulación
- Endulzado
- Sin azúcar
Gama de precios
- Masa
- De primera calidad
- Lujo
Categoría de inclusión
- Plano
- Con inclusiones y aderezos
- Chispas
- Chocolates
- Trozos
- Copos
- Jarabe
- Otros
- Sin igual
- Confeti
- Piezas horneadas
- Perlas
- Grageas
- Bombones de nuez pecana
- Crujientes de caramelo
- Cojones
- Almendras
- Anacardos
- Pistacho
- avellanas
- Pasas
- Nueces de Madamia
- castañas
- Otros
Fortificación
- Regular
- Fortificado
Afirmar
- Regular
- Sin gluten
- Sin lactosa
- Sin conservantes artificiales
- Sin lácteos
- Sin soja
- Sin OGM
- Sin azúcar
- Sin calorías
- Con todo lo anterior
- Regular sin reclamaciones
- Otros
Categoría orgánica
- Convencional
- Orgánico
Marca
- De marca
- Marca privada
Embalaje
- Bolsa en caja
- Bolsas
- Paso
- Vaso
- Plástico
- Tazas
- Botellas
- Vaso
- Plástico
- Tetra Packs
- Otros
Tamaño del embalaje
- Menos de 100 gramos
- 100-200 gramos
- 201-300 gramos
- Más de 300 gramos
Canal de distribución
- Venta minorista en tiendas
- Tiendas de conveniencia
- Yogurterías/Salones
- Supermercados/Hipermercados
- Tiendas especializadas
- tiendas de comestibles
- Mayoristas
- Otros
- Venta minorista sin tiendas físicas
- Venta
- En línea
Análisis regional del mercado europeo del yogur
Se analiza el mercado y se proporcionan información sobre el tamaño del mercado y las tendencias por país, tipo de yogur, tipo de producto, contenido de grasa, sabor, tipo de fuente, formulación, categoría de inclusión, fortificación, reclamo, rango de precio, categoría orgánica, marca, empaque, tamaño del empaque y canal de distribución como se mencionó anteriormente.
Los países cubiertos en el mercado son Alemania, Francia, Reino Unido, Italia, España, Rusia, Países Bajos, Bélgica, Suiza, Turquía y el resto de Europa.
Se espera que Alemania domine el mercado debido a su fuerte industria láctea, la alta demanda de productos cremosos tanto tradicionales como de origen vegetal y un sólido sector de procesamiento de alimentos.
Se espera que Alemania sea el país de más rápido crecimiento debido a su fuerte industria láctea, la alta demanda de productos cremosos tanto tradicionales como de origen vegetal, el sólido sector de procesamiento de alimentos y la preferencia de los consumidores por ingredientes lácteos de alta calidad, junto con su papel central en los mercados minoristas y de servicios de alimentos europeos.
La sección de países del informe también presenta los factores que impactan en cada mercado y los cambios en la regulación nacional que impactan las tendencias actuales y futuras del mercado. Datos como el análisis de la cadena de valor aguas abajo y aguas arriba, las tendencias técnicas, el análisis de las cinco fuerzas de Porter y los estudios de caso son algunos de los indicadores utilizados para pronosticar el escenario del mercado en cada país. Asimismo, se consideran la presencia y disponibilidad de marcas globales y los desafíos que enfrentan debido a la alta o escasa competencia de marcas locales y nacionales, el impacto de los aranceles nacionales y las rutas comerciales, al proporcionar un análisis de pronóstico de los datos nacionales.
Cuota de mercado del yogur en Europa
El panorama competitivo del mercado ofrece detalles por competidor. Se incluye información general de la empresa, sus estados financieros, ingresos generados, potencial de mercado, inversión en investigación y desarrollo, nuevas iniciativas de mercado, presencia global, plantas de producción, capacidad de producción, fortalezas y debilidades de la empresa, lanzamiento de productos, alcance y variedad de productos, y dominio de las aplicaciones. Los datos anteriores se refieren únicamente al enfoque de mercado de las empresas.
Los líderes del mercado europeo de yogur que operan en el mercado son:
- Danone (Francia)
- Nestlé (Suiza)
- EMMY UK LTD (Londres)
- Müller Reino Unido e Irlanda (Inglaterra)
- Frisia Campina (Países Bajos)
- THE CAMPBELL'S COMPANY (EE. UU.)
- Arla Foods Amba (Dinamarca)
- SCHREIBER FOOD INC (EE. UU.)
- Sodiaal (Francia)
- CREMO SA (Suiza)
- Fen Farm Dairy (Reino Unido)
- LÁCTEAS FLOR DE BURGOS SL (España)
- LATTE MAREMMA (Italia)
- Newlat Food SpA (Italia)
- The Hain Celestial Group, Inc. (Nueva York)
- Yeo Valley Organic Limited (Reino Unido)
Últimos avances en el mercado europeo del yogur
- En mayo de 2021, Onken, en colaboración con Marvin Humes, lanzó la campaña "Recetas Familiares Legen-Dairy". Esta emocionante iniciativa busca descubrir las recetas familiares más legendarias del Reino Unido invitando a la gente a compartir sus tesoros culinarios o a crear otros nuevos. El célebre presentador de televisión y radio Marvin Humes lidera esta campaña para promover el Día de la Receta Familiar.
- En noviembre de 2024, Arla Foods Ingredients recibió la aprobación de la Autoridad de Competencia y Mercados del Reino Unido para la adquisición del negocio de nutrición de suero de leche de Volac. El acuerdo incluye una planta de procesamiento en Felinfach, Gales, y fortalecerá la posición de Arla en el creciente mercado de la proteína de suero.
- En septiembre de 2023, Nestlé llegó a un acuerdo con Advent International para adquirir una participación mayoritaria en Grupo CRM, una empresa brasileña de chocolate premium. El acuerdo, que se prevé cerrar en 2024, refuerza la presencia de Nestlé en el mercado brasileño de confitería de alta gama.
- En noviembre de 2022, Nestlé y L Catterton anunciaron una alianza para fusionar Freshly y Kettle Cuisine, un fabricante líder de alimentos frescos artesanales. La nueva empresa ofrecerá una amplia gama de productos frescos en diversos canales y regiones geográficas, con L Catterton como accionista mayoritario.
SKU-
Obtenga acceso en línea al informe sobre la primera nube de inteligencia de mercado del mundo

- Panel de análisis de datos interactivo
- Panel de análisis de empresas para oportunidades con alto potencial de crecimiento
- Acceso de analista de investigación para personalización y consultas
- Análisis de la competencia con panel interactivo
- Últimas noticias, actualizaciones y análisis de tendencias
- Aproveche el poder del análisis de referencia para un seguimiento integral de la competencia
Tabla de contenido
1 INTRODUCCIÓN
1.1 OBJETIVOS DEL ESTUDIO
1.2 DEFINICIÓN DE MERCADO
1.3 PANORAMA GENERAL DEL MERCADO EUROPEO DEL YOGUR
1.4 LIMITACIONES
1.5 MERCADOS CUBIERTOS
2 SEGMENTACIÓN DEL MERCADO
2.1 ÁMBITO GEOGRÁFICO
2,2 AÑOS CONSIDERADOS PARA EL ESTUDIO
2.3 MONEDA Y PRECIOS
2.4 MODELO DE VALIDACIÓN DE DATOS TRIPOD DBMR
2.5 MODELADO MULTIVARIADO
2.6 CURVA DE LÍNEA DE VIDA DEL TRATAMIENTO
2.7 ENTREVISTAS PRINCIPALES CON LÍDERES DE OPINIÓN CLAVE
2.8 CUADRÍCULA DE POSICIÓN DE MERCADO DBMR
2.9 CUADRÍCULA DE COBERTURA DE APLICACIONES DEL MERCADO
2.1 ANÁLISIS DE LA PARTICIPACIÓN DE LOS PROVEEDORES
2.11 FUENTES SECUNDARIAS
2.12 SUPUESTOS
3 RESUMEN EJECUTIVO
4 INFORMACIÓN PREMIUM
4.1 PERSPECTIVA DE LA MARCA
4.2 PREOCUPACIONES AMBIENTALES
4.2.1 RESPUESTA DE LA INDUSTRIA AL CAMBIO CLIMÁTICO
4.2.2 EL PAPEL DEL GOBIERNO AL AFRONTAR EL CAMBIO CLIMÁTICO
4.2.3 RECOMENDACIONES DE LOS ANALISTAS
4.3 ESTRATEGIAS DE MARKETING ADOPTADAS POR LOS ACTORES CLAVE DEL MERCADO DEL YOGUR EN EUROPA
4.3.1 GRANJA LECHERA FEN
4.3.2 LATTE MAREMMA
4.3.3 NESTLÉ SA
4.3.4 ALIMENTOS ARLA AMBA
4.3.5 COMPAÑÍA DE SOPAS CAMPBELL
4.3.6 GRUPO CELESTIAL HAIN
4.3.7 PREFERENCIAS Y RESTRICCIONES DIETÉTICAS
4.3.8 MARKETING Y PUBLICIDAD
4.3.9 CONCLUSIÓN
4.4 ESTRATEGIAS DE MARKETING ADOPTADAS POR LOS MERCADOS CLAVE EN EUROPA MERCADO DE YOGUR
4.4.1 IMPACTO EN EL PRECIO
4.4.2 IMPACTO EN LA CADENA DE SUMINISTRO
4.4.3 IMPACTO EN EL ENVÍO
4.4.4 IMPACTO EN LAS DECISIONES ESTRATÉGICAS DE LA EMPRESA
4.4.5 CONCLUSIÓN
4.5 ESCENARIO DE IMPORTACIÓN Y EXPORTACIÓN
4.6 ESTRATEGIAS DE MARKETING ADOPTADAS POR LOS ACTORES CLAVE DEL MERCADO DEL YOGUR EN EUROPA
4.6.1 GRANJA LECHERA FEN
4.6.2 LATTE MAREMMA
4.6.3 NESTLÉ SA
4.6.4 ALIMENTOS ARLA AMBA
4.6.5 COMPAÑÍA DE SOPAS CAMPBELL
4.6.6 GRUPO CELESTIAL HAIN
4.6.7 EMMI UK LTD (ONKEN)
4.6.8 ALIMENTOS SCHREIBER
4.6.9 ALIMENTOS SCHREIBER
4.6.10 FLOR DE BURGOS
4.6.11 NEWLAT FOOD SPA
4.6.12 CONCLUSIÓN
4.7 ESTRATEGIA DE LANZAMIENTO DE NUEVOS PRODUCTOS PARA EL MERCADO EUROPEO DEL YOGUR
4.7.1 NÚMERO DE LANZAMIENTO DE NUEVOS PRODUCTOS
4.7.2 OFERTA DE PRODUCTOS DIFERENCIALES
4.7.3 CUMPLIMIENTO DE LOS REQUISITOS DEL CONSUMIDOR
4.7.4 DISEÑO DE PAQUETES
4.7.5 ANÁLISIS DE PRECIOS
4.7.6 POSICIONAMIENTO DEL PRODUCTO
4.7.7 CONCLUSIÓN
4.8 ANÁLISIS DE PRECIOS
4.9 ANÁLISIS DE MARCA PRIVADA VS. MARCA DE PROPIEDAD
4.1 CAPACIDAD DE PRODUCCIÓN DE LOS FABRICANTES CLAVE
4.11 ACTIVIDADES DE PROMOCIÓN EN EL MERCADO EUROPEO DEL YOGUR
4.11.1 CAMPAÑAS DE MARKETING DIGITAL Y REDES SOCIALES
4.11.2 MARKETING DE CONTENIDOS E INICIATIVAS EDUCATIVAS
4.11.3 MUESTRAS DE PRODUCTOS Y PRUEBAS GRATUITAS
4.11.4 DESCUENTOS, PROMOCIONES Y PROGRAMAS DE FIDELIZACIÓN
4.11.5 ASOCIACIONES ESTRATÉGICAS Y PATROCINIOS
4.11.6 APOYO DE CELEBRIDADES Y EXPOSICIÓN EN LOS MEDIOS
4.11.7 PROMOCIONES MINORISTAS Y EN TIENDA
4.11.8 CONCLUSIÓN
4.12 COBERTURA DE LA REGULACIÓN
4.13 COMPORTAMIENTO Y DINÁMICA DE COMPRA
4.13.1 RECOMENDACIÓN DE FAMILIARES Y AMIGOS
4.13.2 INVESTIGACIÓN
4.13.3 IMPULSIVO
4.13.4 PUBLICIDAD
4.13.4.1 PUBLICIDAD TELEVISIVA
4.13.4.2 PUBLICIDAD EN LÍNEA
4.13.4.3 PUBLICIDAD EN TIENDA
4.13.4.4 PUBLICIDAD EXTERIOR
4.14 ANÁLISIS DE LA CADENA DE SUMINISTRO
4.14.1 DESCRIPCIÓN GENERAL
4.14.2 ESCENARIO DE COSTOS LOGÍSTICOS
4.14.3 IMPORTANCIA DE LOS PROVEEDORES DE SERVICIOS LOGÍSTICOS
5 MERCADO EUROPEO DEL YOGUR: REGULACIONES
5.1 ORGANISMOS REGULADORES
5.2 REGLAMENTO
5.3 CONCLUSIÓN
6 PANORAMA GENERAL DEL MERCADO
6.1 CONDUCTORES
6.1.1 MAYOR ENFOQUE EN LOS ALIMENTOS FUNCIONALES
6.1.2 BENEFICIOS DEL YOGUR PARA LA SALUD
6.1.3 ADITIVOS FUNCIONALES INNOVADORES EN EL YOGUR
6.1.4 AVANCES TÉCNICOS EN EL PROCESAMIENTO DEL YOGUR
6.2 RESTRICCIONES
6.2.1 PREOCUPACIONES DE SALUD POR LA INTOLERANCIA A LA LACTOSA Y LAS ALERGIAS A LA LECHE
6.2.2 PREOCUPACIONES DE SALUD SOBRE EL CONTENIDO DE AZÚCAR
6.3 OPORTUNIDADES
6.3.1 INTRODUCCIÓN DEL MODELO DE AUTOSERVICIO
6.3.2 AUMENTO EN LA ADOPCIÓN DE ACTIVIDADES PROMOCIONALES Y PLATAFORMAS EN LÍNEA
6.3.3 EXPERIENCIAS INNOVADORAS EN EL RETAIL
6.4 DESAFÍOS
6.4.1 DISPONIBILIDAD DE SUSTITUTOS
6.4.2 SENSIBILIDAD A LOS PRECIOS Y AUMENTO DE LOS COSTES EN EL MERCADO EUROPEO DEL YOGUR
7 MERCADO EUROPEO DEL YOGUR, POR TIPO DE PRODUCTO
7.1 INFORMACIÓN GENERAL
7.2 YOGUR PARA CONSUMIR CON CUCHARA
7.3 YOGUR BEBIBLE
7.4 YOGUR HELADO
7.5 OTROS
8 MERCADO EUROPEO DEL YOGUR, POR FORMULACIÓN
8.1 DESCRIPCIÓN GENERAL
8.2 SIN AZÚCAR
8.3 ENDULZADO
9 MERCADO EUROPEO DEL YOGUR, POR CATEGORÍA DE INCLUSIÓN
9.1 INFORMACIÓN GENERAL
9.2 LLANO
9.3 CON INCLUSIONES Y COBERTURAS
9.3.1 TUERCAS
9.3.1.1 ALMENDRAS
9.3.1.2 ANACARDOS
9.3.1.3 PISTACHO
9.3.1.4 AVELLANAS
9.3.1.5 PASAS
9.3.1.6 NUECES DE MADAMIA
9.3.1.7 CASTAÑAS
9.3.1.8 OTROS
9.3.2 ESPRUGADORES
9.3.3 CHOCOLATES
9.3.3.1 TROZOS
9.3.3.2 JARABE
9.3.3.3 COPOS
9.3.3.4 OTROS
9.3.4 CONFETI
9.3.5 NO PAREILS
9.3.6 PIEZAS HORNEADAS
9.3.7 PERLAS
9.3.8 GRAGEAS
9.3.9 PRALINES DE NUEZ PECAN
9.3.10 CRUJIENTES DE CARAMELO
9.3.11 OTROS
10 MERCADO EUROPEO DEL YOGUR, POR ORIGEN
10.1 INFORMACIÓN GENERAL
10.2 DE BASE ANIMAL
10.2.1 LECHE DE VACA
10.2.2 LECHE DE BÚFALA
10.2.3 LECHE DE CABRA
10.2.4 OTROS
10.3 A BASE DE PLANTAS
10.3.1 LECHE DE ALMENDRAS
10.3.2 LECHE DE SOJA
10.3.3 LECHE DE AVENA
10.3.4 LECHE DE COCO
10.3.5 LECHE DE ANACARDO
10.3.6 OTROS
10.4 ARTIFICIALES
11 MERCADO EUROPEO DEL YOGUR, POR SABOR
11.1 INFORMACIÓN GENERAL
11.2 LLANO
11.3 SABORIZADO
11.3.1 FRESA
11.3.2 VAINILLA
11.3.3 ARÁNDANOS
11.3.4 PLÁTANO
11.3.5 MELOCOTÓN
11.3.6 ARÁNDANO
11.3.7 BLACKBERRY
11.3.8 FRUTAS Y NUECES
11.3.9 LIMÓN
11.3.10 COCO
11.3.11 TUERCAS
11.3.12 CEREZA
11.3.13 CEREZA DE HUERTO
11.3.14 MIEL
11.3.15 CALABAZA
11.3.16 CHOCOLATES
11.3.17 CARAMELO
11.3.18 CARAMELO
11.3.19 MOCHA/CAFÉ
11.3.20 POMOGRANETT
11.3.21 MENTA
11.3.22 AMARETTO
11.3.23 OTROS
12 MERCADO EUROPEO DEL YOGUR, POR CONTENIDO DE GRASA
12.1 DESCRIPCIÓN GENERAL
12.2 BAJO EN GRASA
12.3 SIN GRASA
12.4 GRASA ENTERA
13 MERCADO EUROPEO DEL YOGUR, POR FORTIFICACIÓN
13.1 INFORMACIÓN GENERAL
13.2 REGULAR
13.3 FORTIFICADO
14 MERCADO EUROPEO DEL YOGUR, POR CATEGORÍA ORGÁNICA
14.1 DESCRIPCIÓN GENERAL
14.2 CONVENCIONAL
14.3 ORGÁNICO
15 MERCADO EUROPEO DEL YOGUR, POR CANAL DE DISTRIBUCIÓN
15.1 INFORMACIÓN GENERAL
15.2 VENTA AL POR MENOR EN TIENDAS
15.2.1 SUPERMERCADOS/HIPERMERCADOS
15.2.2 YOGURERÍAS/ESTANCIAS
15.2.3 TIENDAS DE CONVENIENCIA
15.2.4 TIENDAS DE COMESTIBLES
15.2.5 TIENDAS ESPECIALIZADAS
15.2.6 MAYORISTAS
15.2.7 OTROS
15.3 VENTA AL POR MENOR SIN TIENDA
15.3.1 EN LÍNEA
15.3.2 VENTA
16 MERCADO EUROPEO DEL YOGUR, POR TAMAÑO DEL ENVASE
16.1 DESCRIPCIÓN GENERAL
16.2 201-300 GRAMOS
16.3 MÁS DE 300 GRAMOS
16.4 100-200 GRAMOS
16.5 MENOS DE 100 GRAMOS
17 MERCADO EUROPEO DEL YOGUR, POR RECLAMACIÓN
17.1 INFORMACIÓN GENERAL
17.2 SIN AZÚCAR
17.3 SIN LÁCTEOS
17.4 SIN LACTOSA
17.5 SIN SOJA
17.6 SIN GLUTEN
17.7 SIN OMG
17.8 LIBRE DE CALORÍAS
17.9 SIN CONSERVANTES ARTIFICIALES
17.1 CON TODO LO ANTERIOR RECLAMADO
17.11 REGULAR SIN RECLAMACIONES
17.12 OTROS
18 MERCADO EUROPEO DEL YOGUR, POR MARCA
18.1 DESCRIPCIÓN GENERAL
18.2 DE MARCA
18.3 MARCA PRIVADA
19 MERCADO EUROPEO DEL YOGUR, POR RANGO DE PRECIOS
19.1 DESCRIPCIÓN GENERAL
19.2 MASA
19.3 PREMIUM
19.4 LUJO
20 MERCADO EUROPEO DEL YOGUR, POR TIPO DE ENVASE
20.1 INFORMACIÓN GENERAL
20.2 FRASCOS
20.2.1 PLÁSTICO
20.2.2 VIDRIO
20.3 BOTELLAS
20.3.1 PLÁSTICO
20.3.2 VIDRIO
20.4 TETRA PACK
20.5 TAZAS
20.6 BOLSA EN CAJA
20.7 BOLSAS
20.8 OTROS
21 MERCADO EUROPEO DEL YOGUR, POR PAÍS
21.1 EUROPA
21.1.1 ALEMANIA
21.1.2 FRANCIA
21.1.3 ESPAÑA
21.1.4 POLONIA
21.1.5 BÉLGICA
21.1.6 PAÍSES BAJOS
21.1.7 ITALIA
21.1.8 AUSTRIA
21.1.9 SUECIA
21.1.10 DINAMARCA
21.1.11 REINO UNIDO
21.1.12 PORTUGAL
21.1.13 SUIZA
21.1.14 IRLANDA
21.1.15 FINLAND
21.1.16 LUXEMBURGO
21.1.17 RESTO DE EUROPA
22 MERCADO EUROPEO DEL YOGUR, PANORAMA EMPRESARIAL
22.1 ANÁLISIS DE ACCIONES DE EMPRESAS: EUROPA
23 ANÁLISIS FODA
24 PERFILES DE EMPRESAS
24.1 DANONE
24.1.1 INSTANTÁNEA DE LA EMPRESA
24.1.2 ANÁLISIS DE INGRESOS:
24.1.3 PORTAFOLIO DE PRODUCTOS
24.1.4 DESARROLLO RECIENTE
24.2 NESTLÉ
24.2.1 INSTANTÁNEA DE LA EMPRESA
24.2.2 ANÁLISIS DE INGRESOS
24.2.3 PORTAFOLIO DE PRODUCTOS
24.2.4 DESARROLLO RECIENTE
24.3 EMMY UK LTD
24.3.1 INSTANTÁNEA DE LA EMPRESA
24.3.2 PORTAFOLIO DE PRODUCTOS
24.3.3 DESARROLLO RECIENTE
24.4 MÜLLER REINO UNIDO E IRLANDA (FILIAL DEL UNTERNEHMENSGRUPPE THEO MÜLLER)
24.4.1 INSTANTÁNEA DE LA EMPRESA
24.4.2 PORTAFOLIO DE PRODUCTOS
24.4.3 DESARROLLO RECIENTE
24.5 CAMPINA DE FRISIA
24.5.1 INSTANTÁNEA DE LA EMPRESA
24.5.2 PORTAFOLIO DE PRODUCTOS
24.5.3 DESARROLLO RECIENTE
24.6 LA COMPAÑÍA CAMPBELL
24.6.1 INSTANTÁNEA DE LA EMPRESA
24.6.2 PORTAFOLIO DE PRODUCTOS
24.6.3 DESARROLLO RECIENTE
24.7 ALIMENTOS ARLA AMBA
24.7.1 INSTANTÁNEA DE LA EMPRESA
24.7.2 ANÁLISIS DE INGRESOS
24.7.3 PORTAFOLIO DE PRODUCTOS
24.7.4 DESARROLLO RECIENTE
24.8 SCHREIBER FOOD INC
24.8.1 INSTANTÁNEA DE LA EMPRESA
24.8.2 PORTAFOLIO DE PRODUCTOS
24.8.3 DESARROLLO RECIENTE
24.9 SODIAAL
24.9.1 INSTANTÁNEA DE LA EMPRESA
24.9.2 PORTAFOLIO DE PRODUCTOS
24.9.3 DESARROLLO RECIENTE
24.1 CREMO SA
24.10.1 INSTANTÁNEA DE LA EMPRESA
24.10.2 PORTAFOLIO DE PRODUCTOS
24.11 LECHERÍA FEN FARM
24.11.1 INSTANTÁNEA DE LA EMPRESA
24.11.2 PORTAFOLIO DE PRODUCTOS
24.11.3 DESARROLLO RECIENTE
24.12 LÁCTEOS FLOR DE BURGOS
24.12.1 INSTANTÁNEA DE LA EMPRESA
24.12.2 PORTAFOLIO DE PRODUCTOS
24.12.3 DESARROLLO RECIENTE
24.13 LATTE MAREMMA
24.13.1 INSTANTÁNEA DE LA EMPRESA
24.13.2 PORTAFOLIO DE PRODUCTOS
24.13.3 DESARROLLO RECIENTE
24.14 NEWLAT FOOD SPA
24.14.1 INSTANTÁNEA DE LA EMPRESA
24.14.2 ANÁLISIS DE INGRESOS
24.14.3 ANÁLISIS DE INGRESOS SEGMENTADOS
24.14.4 PORTAFOLIO DE PRODUCTOS
24.15 EL GRUPO CELESTIAL HAIN, INC.
24.15.1 INSTANTÁNEA DE LA EMPRESA
24.15.2 ANÁLISIS DE INGRESOS
24.15.3 SEGMENTED REVENUE ANALYSIS
24.15.4 PRODUCT PORTFOLIO
24.15.5 RECENT DEVELOPMENT
24.16 YEO VALLEY ORGANIC LIMITED
24.16.1 COMPANY SNAPSHOT
24.16.2 PRODUCT PORTFOLIO
24.16.3 RECENT DEVELOPMENT
25 QUESTIONNAIRE
26 RELATED REPORTS
Lista de Tablas
TABLA 1 CAPACIDAD DE PRODUCCIÓN DE LOS FABRICANTES CLAVE
CUADRO 2 REGULACIONES EN VARIAS REGIONES Y PAÍSES
TABLA 3 MERCADO EUROPEO DEL YOGUR, POR TIPO DE PRODUCTO, 2018-2032 (MILLONES DE USD)
TABLA 4 MERCADO EUROPEO DEL YOGUR, POR FORMULACIÓN, 2018-2032 (MILLONES DE USD)
TABLA 5 MERCADO EUROPEO DE YOGUR, POR CATEGORÍA DE INCLUSIÓN, 2018-2032 (MILLONES DE USD)
TABLA 6 EUROPA CON INCLUSIONES Y COBERTURAS EN EL MERCADO DE YOGUR, POR CATEGORÍA DE INCLUSIÓN, 2018-2032 (MILLONES DE USD)
TABLA 7 MERCADO EUROPEO DE FRUTOS SECOS EN YOGUR, POR CATEGORÍA DE INCLUSIÓN, 2018-2032 (MILLONES DE USD)
TABLA 8 MERCADO EUROPEO DE CHOCOLATES EN YOGUR, POR CATEGORÍA DE INCLUSIÓN, 2018-2032 (MILLONES DE USD)
TABLA 9 MERCADO EUROPEO DE YOGUR, POR FUENTE, 2018-2032 (MILLONES DE USD)
TABLA 10 MERCADO EUROPEO DE YOGUR DE ORIGEN ANIMAL, POR FUENTE, 2018-2032 (MILLONES DE USD)
TABLA 11 MERCADO EUROPEO DE YOGUR DE ORIGEN VEGETAL, POR FUENTE, 2018-2032 (MILLONES DE USD)
TABLA 12 MERCADO EUROPEO DE YOGUR, POR SABOR, 2018-2032 (MILLONES DE USD)
TABLA 13 MERCADO EUROPEO DE YOGUR CON SABOR, POR SABOR, 2018-2032 (MILLONES DE USD)
TABLA 14 MERCADO EUROPEO DE YOGUR, POR CONTENIDO DE GRASA, 2018-2032 (MILLONES DE USD)
TABLA 15 MERCADO EUROPEO DE YOGUR, POR FORTIFICACIÓN, 2018-2032 (MILLONES DE USD)
TABLA 16 MERCADO EUROPEO DE YOGUR, POR CATEGORÍA ORGÁNICA, 2018-2032 (MILLONES DE USD)
TABLA 17 MERCADO EUROPEO DEL YOGUR, POR CANAL DE DISTRIBUCIÓN, 2018-2032 (MILLONES DE USD)
TABLA 18 VENTA MINORISTA DE YOGUR EN TIENDAS EUROPEAS, POR CANAL DE DISTRIBUCIÓN, 2018-2032 (MILLONES DE USD)
TABLA 19 VENTA MINORISTA DE YOGUR SIN TIENDAS EN EUROPA, POR CANAL DE DISTRIBUCIÓN, 2018-2032 (MILLONES DE USD)
TABLA 20 MERCADO EUROPEO DE YOGUR, POR TAMAÑO DE ENVASE, 2018-2032 (MILLONES DE USD)
TABLA 21 MERCADO EUROPEO DE YOGUR, POR RECLAMACIÓN, 2018-2032 (MILLONES DE USD)
TABLA 22 MERCADO EUROPEO DEL YOGUR, POR MARCA, 2018-2032 (MILLONES DE USD)
TABLA 23 MERCADO EUROPEO DEL YOGUR, POR RANGO DE PRECIOS, 2018-2032 (MILLONES DE USD)
TABLA 24 MERCADO EUROPEO DE YOGUR, POR TIPO DE ENVASE, 2018-2032 (MILLONES DE USD)
TABLA 25. FRASCO DE YOGUR EN EL MERCADO EUROPEO, POR TIPO DE ENVASE, 2018-2032 (MILLONES DE USD)
TABLA 26 BOTELLAS EN EL MERCADO EUROPEO DE YOGUR, POR TIPO DE ENVASE, 2018-2032 (MILLONES DE USD)
TABLA 27 MERCADO EUROPEO DEL YOGUR, POR PAÍS, 2018-2032 (MILLONES DE USD)
TABLA 28 MERCADO EUROPEO DEL YOGUR, POR PAÍS, 2018-2032 (KILOTONELADAS)
TABLA 29 MERCADO DE YOGUR EN ALEMANIA, POR TIPO DE YOGUR, 2018-2032 (MILLONES DE USD)
TABLA 30 MERCADO DE YOGUR EN ALEMANIA, POR TIPO DE YOGUR, 2018-2032 (KILOTONELADAS)
TABLA 31 MERCADO DE YOGUR EN ALEMANIA, POR TIPO DE PRODUCTO, 2018-2032 (MILLONES DE USD)
TABLA 32 MERCADO DE YOGUR EN ALEMANIA, POR CONTENIDO DE GRASA, 2018-2032 (MILLONES DE USD)
TABLA 33 MERCADO DE YOGUR EN ALEMANIA, POR SABOR, 2018-2032 (MILLONES DE USD)
TABLA 34 MERCADO DE YOGUR SABORIZADO EN ALEMANIA, POR SABOR, 2018-2032 (MILLONES DE USD)
TABLA 35 MERCADO DE YOGUR EN ALEMANIA, POR FUENTE, 2018-2032 (MILLONES DE USD)
TABLA 36 MERCADO DE YOGUR DE ORIGEN ANIMAL EN ALEMANIA, POR FUENTE, 2018-2032 (MILLONES DE USD)
TABLA 37 MERCADO DE YOGUR DE ORIGEN VEGETAL EN ALEMANIA, POR FUENTE, 2018-2032 (MILLONES DE USD)
TABLA 38 MERCADO DE YOGUR EN ALEMANIA, POR FORMULACIÓN, 2018-2032 (MILLONES DE USD)
TABLA 39 MERCADO DE YOGUR EN ALEMANIA, POR CATEGORÍA DE INCLUSIÓN, 2018-2032 (MILLONES DE USD)
TABLA 40 ALEMANIA CON INCLUSIONES Y COBERTURAS EN EL MERCADO DE YOGUR, POR CATEGORÍA DE INCLUSIÓN, 2018-2032 (MILLONES DE USD)
TABLA 41 MERCADO DE FRUTOS SECOS EN YOGUR EN ALEMANIA, POR CATEGORÍA DE INCLUSIÓN, 2018-2032 (MILLONES DE USD)
TABLA 42 CHOCOLATES EN EL MERCADO DE YOGUR DE ALEMANIA, POR CATEGORÍA DE INCLUSIÓN, 2018-2032 (MILLONES DE USD)
TABLA 43 MERCADO DE YOGUR EN ALEMANIA, POR FORTIFICACIÓN, 2018-2032 (MILLONES DE USD)
TABLA 44 MERCADO DE YOGUR EN ALEMANIA, POR CATEGORÍA ORGÁNICA, 2018-2032 (MILLONES DE USD)
TABLA 45 MERCADO DE YOGUR EN ALEMANIA, POR MARCA, 2018-2032 (MILLONES DE USD)
TABLA 46 MERCADO DE YOGUR EN ALEMANIA, POR RANGO DE PRECIOS, 2018-2032 (MILLONES DE USD)
TABLA 47 MERCADO DE YOGUR EN ALEMANIA, POR TIPO DE ENVASE, 2018-2032 (MILLONES DE USD)
TABLA 48 FRASCO DE YOGUR EN EL MERCADO DE ALEMANIA, POR TIPO DE ENVASE, 2018-2032 (MILLONES DE USD)
TABLA 49 BOTELLAS DE YOGUR EN ALEMANIA, POR TIPO DE ENVASE, 2018-2032 (MILLONES DE USD)
TABLA 50 MERCADO DE YOGUR EN ALEMANIA, POR TAMAÑO DE ENVASE, 2018-2032 (MILLONES DE USD)
TABLA 51 MERCADO DE YOGUR EN ALEMANIA, POR RECLAMACIÓN, 2018-2032 (MILLONES DE USD)
TABLA 52 MERCADO DE YOGUR EN ALEMANIA, POR CANAL DE DISTRIBUCIÓN, 2018-2032 (MILLONES DE USD)
TABLA 53 VENTA MINORISTA DE YOGUR EN TIENDAS ALEMANAS, POR CANAL DE DISTRIBUCIÓN, 2018-2032 (MILLONES DE USD)
TABLA 54 ALEMANIA VENTA MINORISTA SIN TIENDAS EN EL MERCADO DE YOGUR, POR CANAL DE DISTRIBUCIÓN, 2018-2032 (MILLONES DE USD)
TABLA 55 MERCADO DE YOGUR EN FRANCIA, POR TIPO DE YOGUR, 2018-2032 (MILLONES DE USD)
TABLA 56 MERCADO DE YOGUR EN FRANCIA, POR TIPO DE YOGUR, 2018-2032 (KILOTONELADAS)
TABLA 57 MERCADO DE YOGUR EN FRANCIA, POR TIPO DE PRODUCTO, 2018-2032 (MILLONES DE USD)
TABLA 58 MERCADO DE YOGUR EN FRANCIA, POR CONTENIDO DE GRASA, 2018-2032 (MILLONES DE USD)
TABLA 59 MERCADO DE YOGUR EN FRANCIA, POR SABOR, 2018-2032 (MILLONES DE USD)
TABLA 60. MERCADO DE YOGUR CON SABOR FRANCESO, POR SABOR, 2018-2032 (MILLONES DE USD)
TABLA 61 MERCADO DE YOGUR EN FRANCIA, POR FUENTE, 2018-2032 (MILLONES DE USD)
CUADRO 62 MERCADO DE YOGUR DE ORIGEN ANIMAL EN FRANCIA, POR FUENTE, 2018-2032 (MILLONES DE USD)
TABLA 63 MERCADO DE YOGUR DE ORIGEN VEGETAL EN FRANCIA, POR FUENTE, 2018-2032 (MILLONES DE USD)
TABLA 64 MERCADO DE YOGUR EN FRANCIA, POR FORMULACIÓN, 2018-2032 (MILLONES DE USD)
TABLA 65 MERCADO DE YOGUR EN FRANCIA, POR CATEGORÍA DE INCLUSIÓN, 2018-2032 (MILLONES DE USD)
TABLA 66 FRANCIA CON INCLUSIONES Y COBERTURAS EN EL MERCADO DE YOGUR, POR CATEGORÍA DE INCLUSIÓN, 2018-2032 (MILLONES DE USD)
TABLA 67 MERCADO DE FRUTOS SECOS EN YOGUR, POR CATEGORÍA DE INCLUSIÓN, 2018-2032 (MILLONES DE USD)
TABLA 68 CHOCOLATES FRANCESES EN EL MERCADO DE YOGUR, POR CATEGORÍA DE INCLUSIÓN, 2018-2032 (MILLONES DE USD)
TABLA 69 MERCADO DE YOGUR EN FRANCIA, POR FORTIFICACIÓN, 2018-2032 (MILLONES DE USD)
TABLA 70 MERCADO DE YOGUR EN FRANCIA, POR CATEGORÍA ORGÁNICA, 2018-2032 (MILLONES DE USD)
TABLA 71 MERCADO DE YOGUR EN FRANCIA, POR MARCA, 2018-2032 (MILLONES DE USD)
TABLA 72 MERCADO DE YOGUR EN FRANCIA, POR RANGO DE PRECIOS, 2018-2032 (MILLONES DE USD)
TABLA 73 MERCADO DE YOGUR EN FRANCIA, POR TIPO DE ENVASE, 2018-2032 (MILLONES DE USD)
TABLA 74 FRANCIA FRASCO DE YOGUR EN EL MERCADO, POR TIPO DE ENVASE, 2018-2032 (MILLONES DE USD)
TABLA 75 BOTELLAS DE YOGUR EN FRANCIA, POR TIPO DE ENVASE, 2018-2032 (MILLONES DE USD)
TABLA 76 MERCADO DE YOGUR EN FRANCIA, POR TAMAÑO DE ENVASE, 2018-2032 (MILLONES DE USD)
TABLA 77 MERCADO DE YOGUR EN FRANCIA, POR RECLAMACIÓN, 2018-2032 (MILLONES DE USD)
TABLA 78 MERCADO DE YOGUR EN FRANCIA, POR CANAL DE DISTRIBUCIÓN, 2018-2032 (MILLONES DE USD)
TABLA 79 FRANCIA VENTA MINORISTA EN TIENDAS DEL MERCADO DE YOGUR, POR CANAL DE DISTRIBUCIÓN, 2018-2032 (MILLONES DE USD)
TABLA 80 FRANCIA VENTA AL POR MENOR DE YOGUR SIN TIENDAS, POR CANAL DE DISTRIBUCIÓN, 2018-2032 (MILLONES DE USD)
TABLA 81 MERCADO DE YOGUR EN ESPAÑA, POR TIPO DE YOGUR, 2018-2032 (MILLONES DE USD)
TABLA 82 MERCADO DE YOGUR EN ESPAÑA, POR TIPO DE YOGUR, 2018-2032 (KILOTONELADAS)
TABLA 83 MERCADO DE YOGUR EN ESPAÑA, POR TIPO DE PRODUCTO, 2018-2032 (MILLONES DE USD)
TABLA 84 MERCADO ESPAÑOL DE YOGUR, POR CONTENIDO DE GRASA, 2018-2032 (MILLONES DE USD)
TABLA 85 MERCADO ESPAÑOL DEL YOGUR, POR SABOR, 2018-2032 (MILLONES DE USD)
TABLA 86 MERCADO DE YOGUR CON SABOR EN ESPAÑA, POR SABOR, 2018-2032 (MILLONES DE USD)
TABLA 87 MERCADO DE YOGUR EN ESPAÑA, POR ORIGEN, 2018-2032 (MILLONES DE USD)
TABLA 88 MERCADO ESPAÑOL DE YOGUR DE ORIGEN ANIMAL, POR ORIGEN, 2018-2032 (MILLONES DE USD)
TABLA 89 MERCADO ESPAÑOL DE YOGUR DE ORIGEN VEGETAL, POR ORIGEN, 2018-2032 (MILLONES DE USD)
TABLA 90 MERCADO ESPAÑOL DEL YOGUR, POR FORMULACIÓN, 2018-2032 (MILLONES DE USD)
TABLA 91 MERCADO DE YOGUR EN ESPAÑA, POR CATEGORÍA DE INCLUSIÓN, 2018-2032 (MILLONES DE USD)
TABLA 92 ESPAÑA CON INCLUSIONES Y COBERTURAS EN EL MERCADO DE YOGUR, POR CATEGORÍA DE INCLUSIÓN, 2018-2032 (MILLONES DE USD)
TABLA 93 NUECES DE ESPAÑA EN EL MERCADO DEL YOGUR, POR CATEGORÍA DE INCLUSIÓN, 2018-2032 (MILLONES DE USD)
TABLA 94 MERCADO DE CHOCOLATES EN YOGUR EN ESPAÑA, POR CATEGORÍA DE INCLUSIÓN, 2018-2032 (MILLONES DE USD)
TABLA 95 MERCADO DE YOGUR EN ESPAÑA, POR FORTIFICACIÓN, 2018-2032 (MILLONES DE USD)
TABLA 96 MERCADO DE YOGUR EN ESPAÑA, POR CATEGORÍA ORGÁNICA, 2018-2032 (MILLONES DE USD)
TABLA 97 MERCADO DE YOGUR EN ESPAÑA, POR MARCA, 2018-2032 (MILLONES DE USD)
TABLA 98 MERCADO DE YOGUR EN ESPAÑA, POR TIPO DE ENVASE, 2018-2032 (MILLONES DE USD)
TABLA 99. TARROS DE YOGUR EN ESPAÑA, POR TIPO DE ENVASE, 2018-2032 (MILLONES DE USD)
TABLA 100 ENVASES DE YOGUR EN ESPAÑA, POR TIPO DE ENVASE, 2018-2032 (MILLONES DE USD)
TABLA 101 MERCADO DE YOGUR EN ESPAÑA, POR TAMAÑO DE ENVASE, 2018-2032 (MILLONES DE USD)
TABLA 102 MERCADO DE YOGUR EN ESPAÑA, POR RECLAMACIÓN, 2018-2032 (MILLONES DE USD)
TABLA 103 MERCADO ESPAÑOL DEL YOGUR, POR CANAL DE DISTRIBUCIÓN, 2018-2032 (MILLONES DE USD)
TABLA 104 VENTA MINORISTA DE YOGUR EN TIENDAS FÍSICAS EN ESPAÑA, POR CANAL DE DISTRIBUCIÓN, 2018-2032 (MILLONES DE USD)
TABLA 105 VENTA AL POR MENOR DE YOGUR SIN TIENDAS EN ESPAÑA, POR CANAL DE DISTRIBUCIÓN, 2018-2032 (MILLONES DE USD)
TABLA 106 MERCADO DE YOGUR EN POLONIA, POR TIPO DE YOGUR, 2018-2032 (MILLONES DE USD)
TABLA 107 MERCADO DE YOGUR EN POLONIA, POR TIPO DE YOGUR, 2018-2032 (KILOTONELADAS)
TABLA 108 MERCADO DE YOGUR EN POLONIA, POR TIPO DE PRODUCTO, 2018-2032 (MILLONES DE USD)
TABLA 109 MERCADO DE YOGUR EN POLONIA, POR CONTENIDO DE GRASA, 2018-2032 (MILLONES DE USD)
TABLA 110 MERCADO DE YOGUR EN POLONIA, POR SABOR, 2018-2032 (MILLONES DE USD)
TABLA 111 POLONIA SABORIZADA EN EL MERCADO DE YOGUR, POR SABOR, 2018-2032 (MILLONES DE USD)
TABLA 112 MERCADO DE YOGUR EN POLONIA, POR FUENTE, 2018-2032 (MILLONES DE USD)
TABLA 113 MERCADO DE YOGUR DE ORIGEN ANIMAL EN POLONIA, POR FUENTE, 2018-2032 (MILLONES DE USD)
TABLA 114 MERCADO DE YOGUR DE ORIGEN VEGETAL EN POLONIA, POR FUENTE, 2018-2032 (MILLONES DE USD)
TABLA 115 MERCADO DE YOGUR EN POLONIA, POR FORMULACIÓN, 2018-2032 (MILLONES DE USD)
TABLA 116 MERCADO DE YOGUR DE POLONIA, POR CATEGORÍA DE INCLUSIÓN, 2018-2032 (MILLONES DE USD)
TABLA 117 POLONIA CON INCLUSIONES Y COBERTURAS EN EL MERCADO DE YOGUR, POR CATEGORÍA DE INCLUSIÓN, 2018-2032 (MILLONES DE USD)
TABLA 118 NUECES DE POLONIA EN EL MERCADO DE YOGUR, POR CATEGORÍA DE INCLUSIÓN, 2018-2032 (MILLONES DE USD)
TABLA 119 CHOCOLATES DE POLONIA EN EL MERCADO DE YOGUR, POR CATEGORÍA DE INCLUSIÓN, 2018-2032 (MILLONES DE USD)
TABLA 120 MERCADO DE YOGUR EN POLONIA, POR FORTIFICACIÓN, 2018-2032 (MILLONES DE USD)
TABLA 121 MERCADO DE YOGUR EN POLONIA, POR CATEGORÍA ORGÁNICA, 2018-2032 (MILLONES DE USD)
TABLA 122 MERCADO DE YOGUR EN POLONIA, POR MARCA, 2018-2032 (MILLONES DE USD)
TABLA 123 MERCADO DE YOGUR EN POLONIA, POR RANGO DE PRECIOS, 2018-2032 (MILLONES DE USD)
TABLA 124 MERCADO DE YOGUR EN POLONIA, POR TIPO DE ENVASE, 2018-2032 (MILLONES DE USD)
TABLA 125. FRASCO DE YOGUR EN EL MERCADO DE POLONIA, POR TIPO DE ENVASE, 2018-2032 (MILLONES DE USD)
TABLA 126 BOTELLAS DE YOGUR EN POLONIA, POR TIPO DE ENVASE, 2018-2032 (MILLONES DE USD)
TABLA 127 MERCADO DE YOGUR EN POLONIA, POR TAMAÑO DE ENVASE, 2018-2032 (MILLONES DE USD)
TABLA 128 MERCADO DE YOGUR EN POLONIA, POR RECLAMACIÓN, 2018-2032 (MILLONES DE USD)
TABLA 129 MERCADO DE YOGUR EN POLONIA, POR CANAL DE DISTRIBUCIÓN, 2018-2032 (MILLONES DE USD)
TABLA 130 POLONIA: VENTA MINORISTA DE YOGUR EN TIENDAS, POR CANAL DE DISTRIBUCIÓN, 2018-2032 (MILLONES DE USD)
TABLA 131 POLONIA VENTA MINORISTA SIN TIENDAS EN EL MERCADO DE YOGUR, POR CANAL DE DISTRIBUCIÓN, 2018-2032 (MILLONES DE USD)
TABLA 132 MERCADO DE YOGUR EN BÉLGICA, POR TIPO DE YOGUR, 2018-2032 (MILLONES DE USD)
TABLA 133 MERCADO DE YOGUR EN BÉLGICA, POR TIPO DE YOGUR, 2018-2032 (KILOTONELADAS)
TABLA 134 MERCADO DE YOGUR EN BÉLGICA, POR TIPO DE PRODUCTO, 2018-2032 (MILLONES DE USD)
TABLA 135 MERCADO DE YOGUR EN BÉLGICA, POR CONTENIDO DE GRASA, 2018-2032 (MILLONES DE USD)
TABLA 136 MERCADO DE YOGUR EN BÉLGICA, POR SABOR, 2018-2032 (MILLONES DE USD)
TABLA 137 MERCADO DE YOGUR CON SABOR BÉLGICO, POR SABOR, 2018-2032 (MILLONES DE USD)
TABLA 138 MERCADO DE YOGUR EN BÉLGICA, POR FUENTE, 2018-2032 (MILLONES DE USD)
TABLA 139 MERCADO BÉLGICO DE YOGUR DE ORIGEN ANIMAL, POR FUENTE, 2018-2032 (MILLONES DE USD)
TABLA 140 MERCADO BÉLGICO DE YOGUR DE ORIGEN VEGETAL, POR FUENTE, 2018-2032 (MILLONES DE USD)
TABLA 141 MERCADO DE YOGUR EN BÉLGICA, POR FORMULACIÓN, 2018-2032 (MILLONES DE USD)
TABLA 142 MERCADO DE YOGUR DE BÉLGICA, POR CATEGORÍA DE INCLUSIÓN, 2018-2032 (MILLONES DE USD)
TABLA 143 BÉLGICA CON INCLUSIONES Y COBERTURAS EN EL MERCADO DE YOGUR, POR CATEGORÍA DE INCLUSIÓN, 2018-2032 (MILLONES DE USD)
TABLA 144 NUECES BÉLGICA EN EL MERCADO DE YOGUR, POR CATEGORÍA DE INCLUSIÓN, 2018-2032 (MILLONES DE USD)
TABLA 145 CHOCOLATES BÉLGICO EN EL MERCADO DE YOGUR, POR CATEGORÍA DE INCLUSIÓN, 2018-2032 (MILLONES DE USD)
TABLA 146 MERCADO DE YOGUR EN BÉLGICA, POR FORTIFICACIÓN, 2018-2032 (MILLONES DE USD)
TABLA 147 MERCADO DE YOGUR EN BÉLGICA, POR CATEGORÍA ORGÁNICA, 2018-2032 (MILLONES DE USD)
TABLA 148 MERCADO DE YOGUR EN BÉLGICA, POR MARCA, 2018-2032 (MILLONES DE USD)
TABLA 149 MERCADO DE YOGUR EN BÉLGICA, POR RANGO DE PRECIOS, 2018-2032 (MILLONES DE USD)
TABLA 150 MERCADO DE YOGUR EN BÉLGICA, POR TIPO DE ENVASE, 2018-2032 (MILLONES DE USD)
TABLA 151 FRASCO DE YOGUR EN BÉLGICA, POR TIPO DE ENVASE, 2018-2032 (MILLONES DE USD)
TABLA 152 BOTELLAS DE YOGUR EN BÉLGICA, POR TIPO DE ENVASE, 2018-2032 (MILLONES DE USD)
TABLA 153 MERCADO DE YOGUR EN BÉLGICA, POR TAMAÑO DE ENVASE, 2018-2032 (MILLONES DE USD)
TABLA 154 MERCADO DE YOGUR EN BÉLGICA, POR RECLAMACIÓN, 2018-2032 (MILLONES DE USD)
TABLA 155 MERCADO DE YOGUR EN BÉLGICA, POR CANAL DE DISTRIBUCIÓN, 2018-2032 (MILLONES DE USD)
TABLA 156 VENTA MINORISTA DE YOGUR EN TIENDAS BÉLGICA, POR CANAL DE DISTRIBUCIÓN, 2018-2032 (MILLONES DE USD)
TABLA 157 BÉLGICA VENTA MINORISTA SIN TIENDAS EN EL MERCADO DE YOGUR, POR CANAL DE DISTRIBUCIÓN, 2018-2032 (MILLONES DE USD)
TABLA 158 MERCADO DE YOGUR EN LOS PAÍSES BAJOS, POR TIPO DE YOGUR, 2018-2032 (MILLONES DE USD)
TABLA 159 MERCADO DE YOGUR EN LOS PAÍSES BAJOS, POR TIPO DE YOGUR, 2018-2032 (KILOTONELADAS)
TABLA 160 MERCADO DE YOGUR EN LOS PAÍSES BAJOS, POR TIPO DE PRODUCTO, 2018-2032 (MILLONES DE USD)
TABLA 161 MERCADO DE YOGUR DE LOS PAÍSES BAJOS, POR CONTENIDO DE GRASA, 2018-2032 (MILLONES DE USD)
TABLA 162 MERCADO DE YOGUR EN LOS PAÍSES BAJOS, POR SABOR, 2018-2032 (MILLONES DE USD)
TABLA 163 MERCADO DE YOGUR CON SABOR A HOLANDÉS, POR SABOR, 2018-2032 (MILLONES DE USD)
TABLA 164 MERCADO DE YOGUR EN LOS PAÍSES BAJOS, POR FUENTE, 2018-2032 (MILLONES DE USD)
TABLA 165 MERCADO DE YOGUR DE ORIGEN ANIMAL EN LOS PAÍSES BAJOS, POR FUENTE, 2018-2032 (MILLONES DE USD)
TABLA 166 MERCADO DE YOGUR DE ORIGEN VEGETAL EN LOS PAÍSES BAJOS, POR FUENTE, 2018-2032 (MILLONES DE USD)
TABLA 167 MERCADO DE YOGUR DE LOS PAÍSES BAJOS, POR FORMULACIÓN, 2018-2032 (MILLONES DE USD)
TABLA 168 MERCADO DE YOGUR DE LOS PAÍSES BAJOS, POR CATEGORÍA DE INCLUSIÓN, 2018-2032 (MILLONES DE USD)
TABLA 169 PAÍSES BAJOS CON INCLUSIONES Y COBERTURAS EN EL MERCADO DE YOGUR, POR CATEGORÍA DE INCLUSIÓN, 2018-2032 (MILLONES DE USD)
TABLA 170 MERCADO DE FRUTOS SECOS EN YOGUR DE LOS PAÍSES BAJOS, POR CATEGORÍA DE INCLUSIÓN, 2018-2032 (MILLONES DE USD)
TABLA 171 MERCADO DE CHOCOLATES EN YOGUR DE LOS PAÍSES BAJOS, POR CATEGORÍA DE INCLUSIÓN, 2018-2032 (MILLONES DE USD)
TABLA 172 MERCADO DE YOGUR DE LOS PAÍSES BAJOS, POR FORTIFICACIÓN, 2018-2032 (MILLONES DE USD)
TABLA 173 MERCADO DE YOGUR EN LOS PAÍSES BAJOS, POR CATEGORÍA ORGÁNICA, 2018-2032 (MILLONES DE USD)
TABLA 174 MERCADO DE YOGUR EN LOS PAÍSES BAJOS, POR MARCA, 2018-2032 (MILLONES DE USD)
TABLA 175 MERCADO DE YOGUR EN LOS PAÍSES BAJOS, POR RANGO DE PRECIOS, 2018-2032 (MILLONES DE USD)
TABLA 176 MERCADO DE YOGUR EN LOS PAÍSES BAJOS, POR TIPO DE ENVASE, 2018-2032 (MILLONES DE USD)
TABLA 177 FRASCO DE YOGUR EN EL MERCADO DE LOS PAÍSES BAJOS, POR TIPO DE ENVASE, 2018-2032 (MILLONES DE USD)
TABLA 178 BOTELLAS DE YOGUR EN EL MERCADO DE LOS PAÍSES BAJOS, POR TIPO DE ENVASE, 2018-2032 (MILLONES DE USD)
TABLA 179 MERCADO DE YOGUR EN LOS PAÍSES BAJOS, POR TAMAÑO DE ENVASE, 2018-2032 (MILLONES DE USD)
TABLA 180 MERCADO DE YOGUR DE LOS PAÍSES BAJOS, POR RECLAMACIÓN, 2018-2032 (MILLONES DE USD)
TABLA 181 MERCADO DE YOGUR EN LOS PAÍSES BAJOS, POR CANAL DE DISTRIBUCIÓN, 2018-2032 (MILLONES DE USD)
TABLA 182 VENTA MINORISTA DE YOGUR EN TIENDAS DE LOS PAÍSES BAJOS, POR CANAL DE DISTRIBUCIÓN, 2018-2032 (MILLONES DE USD)
TABLA 183 PAÍSES BAJOS: VENTA MINORISTA SIN TIENDAS EN EL MERCADO DE YOGUR, POR CANAL DE DISTRIBUCIÓN, 2018-2032 (MILLONES DE USD)
TABLA 184 MERCADO DE YOGUR EN ITALIA, POR TIPO DE YOGUR, 2018-2032 (MILLONES DE USD)
TABLA 185 MERCADO DE YOGUR EN ITALIA, POR TIPO DE YOGUR, 2018-2032 (KILOTONELADAS)
TABLA 186 MERCADO DE YOGUR EN ITALIA, POR TIPO DE PRODUCTO, 2018-2032 (MILLONES DE USD)
TABLA 187 MERCADO DE YOGUR EN ITALIA, POR CONTENIDO DE GRASA, 2018-2032 (MILLONES DE USD)
TABLA 188 MERCADO DE YOGUR EN ITALIA, POR SABOR, 2018-2032 (MILLONES DE USD)
TABLA 189 MERCADO DE YOGUR CON SABOR A ITALIA, POR SABOR, 2018-2032 (MILLONES DE USD)
TABLA 190 MERCADO DE YOGUR EN ITALIA, POR FUENTE, 2018-2032 (MILLONES DE USD)
TABLA 191 MERCADO DE YOGUR DE ORIGEN ANIMAL EN ITALIA, POR FUENTE, 2018-2032 (MILLONES DE USD)
TABLA 192 MERCADO DE YOGUR DE ORIGEN VEGETAL EN ITALIA, POR FUENTE, 2018-2032 (MILLONES DE USD)
TABLA 193 MERCADO DE YOGUR EN ITALIA, POR FORMULACIÓN, 2018-2032 (MILLONES DE USD)
TABLA 194 MERCADO DE YOGUR EN ITALIA, POR CATEGORÍA DE INCLUSIÓN, 2018-2032 (MILLONES DE USD)
TABLA 195 ITALIA CON INCLUSIONES Y COBERTURAS EN EL MERCADO DE YOGUR, POR CATEGORÍA DE INCLUSIÓN, 2018-2032 (MILLONES DE USD)
TABLA 196 ITALIA MERCADO DE FRUTOS SECOS EN YOGUR, POR CATEGORÍA DE INCLUSIÓN, 2018-2032 (MILLONES DE USD)
TABLA 197 CHOCOLATES DE ITALIA EN EL MERCADO DE YOGUR, POR CATEGORÍA DE INCLUSIÓN, 2018-2032 (MILLONES DE USD)
TABLA 198 MERCADO DE YOGUR EN ITALIA, POR FORTIFICACIÓN, 2018-2032 (MILLONES DE USD)
TABLA 199 MERCADO DE YOGUR EN ITALIA, POR CATEGORÍA ORGÁNICA, 2018-2032 (MILLONES DE USD)
TABLA 200 MERCADO DE YOGUR EN ITALIA, POR MARCA, 2018-2032 (MILLONES DE USD)
TABLA 201 MERCADO DE YOGUR EN ITALIA, POR RANGO DE PRECIOS, 2018-2032 (MILLONES DE USD)
TABLA 202 MERCADO DE YOGUR EN ITALIA, POR TIPO DE ENVASE, 2018-2032 (MILLONES DE USD)
TABLA 203 FRASCO DE YOGUR EN ITALIA, POR TIPO DE ENVASE, 2018-2032 (MILLONES DE USD)
TABLA 204 BOTELLAS DE YOGUR EN ITALIA, POR TIPO DE ENVASE, 2018-2032 (MILLONES DE USD)
TABLA 205 MERCADO DE YOGUR EN ITALIA, POR TAMAÑO DE ENVASE, 2018-2032 (MILLONES DE USD)
TABLA 206 MERCADO DE YOGUR EN ITALIA, POR RECLAMACIÓN, 2018-2032 (MILLONES DE USD)
TABLA 207 MERCADO DE YOGUR EN ITALIA, POR CANAL DE DISTRIBUCIÓN, 2018-2032 (MILLONES DE USD)
TABLA 208 ITALIA VENTA MINORISTA DE YOGUR EN TIENDAS, POR CANAL DE DISTRIBUCIÓN, 2018-2032 (MILLONES DE USD)
TABLA 209 ITALIA VENTA MINORISTA SIN TIENDAS EN EL MERCADO DE YOGUR, POR CANAL DE DISTRIBUCIÓN, 2018-2032 (MILLONES DE USD)
TABLA 210 MERCADO DE YOGUR EN AUSTRIA, POR TIPO DE YOGUR, 2018-2032 (MILLONES DE USD)
TABLA 211 MERCADO DE YOGUR EN AUSTRIA, POR TIPO DE YOGUR, 2018-2032 (KILOTONELADAS)
TABLA 212 MERCADO DE YOGUR EN AUSTRIA, POR TIPO DE PRODUCTO, 2018-2032 (MILLONES DE USD)
TABLA 213 MERCADO DE YOGUR DE AUSTRIA, POR CONTENIDO DE GRASA, 2018-2032 (MILLONES DE USD)
TABLA 214 MERCADO DE YOGUR DE AUSTRIA, POR SABOR, 2018-2032 (MILLONES DE USD)
TABLA 215 YOGUR CON SABOR A AUSTRIA EN EL MERCADO, POR SABOR, 2018-2032 (MILLONES DE USD)
TABLA 216 MERCADO DE YOGUR DE AUSTRIA, POR FUENTE, 2018-2032 (MILLONES DE USD)
TABLA 217 MERCADO DE YOGUR DE ORIGEN ANIMAL EN AUSTRIA, POR FUENTE, 2018-2032 (MILLONES DE USD)
TABLA 218 MERCADO DE YOGUR DE ORIGEN VEGETAL EN AUSTRIA, POR FUENTE, 2018-2032 (MILLONES DE USD)
TABLA 219 MERCADO DE YOGUR DE AUSTRIA, POR FORMULACIÓN, 2018-2032 (MILLONES DE USD)
TABLA 220 MERCADO DE YOGUR DE AUSTRIA, POR CATEGORÍA DE INCLUSIÓN, 2018-2032 (MILLONES DE USD)
TABLA 221 AUSTRIA CON INCLUSIONES Y COBERTURAS EN EL MERCADO DE YOGUR, POR CATEGORÍA DE INCLUSIÓN, 2018-2032 (MILLONES DE USD)
TABLA 222 NUECES AUSTRIACAS EN EL MERCADO DE YOGUR, POR CATEGORÍA DE INCLUSIÓN, 2018-2032 (MILLONES DE USD)
TABLA 223 CHOCOLATES AUSTRIACOS EN EL MERCADO DE YOGUR, POR CATEGORÍA DE INCLUSIÓN, 2018-2032 (MILLONES DE USD)
TABLA 224 MERCADO DE YOGUR EN AUSTRIA, POR FORTIFICACIÓN, 2018-2032 (MILLONES DE USD)
TABLA 225 MERCADO DE YOGUR EN AUSTRIA, POR CATEGORÍA ORGÁNICA, 2018-2032 (MILLONES DE USD)
TABLA 226 MERCADO DE YOGUR EN AUSTRIA, POR MARCA, 2018-2032 (MILLONES DE USD)
TABLA 227 MERCADO DE YOGUR EN AUSTRIA, POR RANGO DE PRECIOS, 2018-2032 (MILLONES DE USD)
TABLA 228 MERCADO DE YOGUR EN AUSTRIA, POR TIPO DE ENVASE, 2018-2032 (MILLONES DE USD)
TABLA 229 FRASCO DE YOGUR EN AUSTRIA, POR TIPO DE ENVASE, 2018-2032 (MILLONES DE USD)
TABLA 230 BOTELLAS DE YOGUR EN AUSTRIA, POR TIPO DE ENVASE, 2018-2032 (MILLONES DE USD)
TABLA 231 MERCADO DE YOGUR EN AUSTRIA, POR TAMAÑO DE ENVASE, 2018-2032 (MILLONES DE USD)
TABLA 232 MERCADO DE YOGUR DE AUSTRIA, POR RECLAMACIÓN, 2018-2032 (MILLONES DE USD)
TABLA 233 MERCADO DE YOGUR DE AUSTRIA, POR CANAL DE DISTRIBUCIÓN, 2018-2032 (MILLONES DE USD)
TABLA 234 AUSTRIA VENTA MINORISTA EN TIENDAS DEL MERCADO DE YOGUR, POR CANAL DE DISTRIBUCIÓN, 2018-2032 (MILLONES DE USD)
TABLA 235 AUSTRIA VENTA MINORISTA SIN TIENDAS EN EL MERCADO DE YOGUR, POR CANAL DE DISTRIBUCIÓN, 2018-2032 (MILLONES DE USD)
TABLA 236 MERCADO DE YOGUR EN SUECIA, POR TIPO DE YOGUR, 2018-2032 (MILLONES DE USD)
TABLA 237 MERCADO DE YOGUR EN SUECIA, POR TIPO DE YOGUR, 2018-2032 (KILOTONELADAS)
TABLA 238 MERCADO DE YOGUR EN SUECIA, POR TIPO DE PRODUCTO, 2018-2032 (MILLONES DE USD)
TABLA 239 MERCADO DE YOGUR EN SUECIA, POR CONTENIDO DE GRASA, 2018-2032 (MILLONES DE USD)
TABLA 240 MERCADO DE YOGUR EN SUECIA, POR SABOR, 2018-2032 (MILLONES DE USD)
TABLA 241 SUECIA SABORIZADA EN EL MERCADO DE YOGUR, POR SABOR, 2018-2032 (MILLONES DE USD)
TABLA 242 MERCADO DE YOGUR EN SUECIA, POR FUENTE, 2018-2032 (MILLONES DE USD)
TABLA 243 MERCADO SUECIO DE YOGUR DE ORIGEN ANIMAL, POR FUENTE, 2018-2032 (MILLONES DE USD)
TABLA 244 MERCADO SUECIO DE YOGUR DE ORIGEN VEGETAL, POR FUENTE, 2018-2032 (MILLONES DE USD)
TABLA 245 MERCADO DE YOGUR EN SUECIA, POR FORMULACIÓN, 2018-2032 (MILLONES DE USD)
TABLA 246 MERCADO DE YOGUR DE SUECIA, POR CATEGORÍA DE INCLUSIÓN, 2018-2032 (MILLONES DE USD)
TABLA 247 SUECIA CON INCLUSIONES Y COBERTURAS EN EL MERCADO DE YOGUR, POR CATEGORÍA DE INCLUSIÓN, 2018-2032 (MILLONES DE USD)
TABLA 248 MERCADO DE FRUTOS SECOS EN YOGUR DE SUECIA, POR CATEGORÍA DE INCLUSIÓN, 2018-2032 (MILLONES DE USD)
TABLA 249 CHOCOLATES SUECOS EN EL MERCADO DE YOGUR, POR CATEGORÍA DE INCLUSIÓN, 2018-2032 (MILLONES DE USD)
TABLA 250 MERCADO DE YOGUR EN SUECIA, POR FORTIFICACIÓN, 2018-2032 (MILLONES DE USD)
TABLA 251 MERCADO DE YOGUR EN SUECIA, POR CATEGORÍA ORGÁNICA, 2018-2032 (MILLONES DE USD)
TABLA 252 MERCADO DE YOGUR EN SUECIA, POR MARCA, 2018-2032 (MILLONES DE USD)
TABLA 253 MERCADO DE YOGUR EN SUECIA, POR RANGO DE PRECIOS, 2018-2032 (MILLONES DE USD)
TABLA 254 MERCADO DE YOGUR EN SUECIA, POR TIPO DE ENVASE, 2018-2032 (MILLONES DE USD)
TABLA 255. FRASCO DE YOGUR EN EL MERCADO SUECIO, POR TIPO DE ENVASE, 2018-2032 (MILLONES DE USD)
TABLA 256 BOTELLAS DE YOGUR EN SUECIA, POR TIPO DE ENVASE, 2018-2032 (MILLONES DE USD)
TABLA 257 MERCADO DE YOGUR EN SUECIA, POR TAMAÑO DE ENVASE, 2018-2032 (MILLONES DE USD)
TABLA 258 MERCADO DE YOGUR EN SUECIA, POR RECLAMACIÓN, 2018-2032 (MILLONES DE USD)
TABLA 259 MERCADO DE YOGUR EN SUECIA, POR CANAL DE DISTRIBUCIÓN, 2018-2032 (MILLONES DE USD)
TABLA 260 VENTA MINORISTA DE YOGUR EN TIENDAS SUECIA, POR CANAL DE DISTRIBUCIÓN, 2018-2032 (MILLONES DE USD)
TABLA 261 SUECIA VENTA MINORISTA SIN TIENDAS EN EL MERCADO DE YOGUR, POR CANAL DE DISTRIBUCIÓN, 2018-2032 (MILLONES DE USD)
TABLA 262 MERCADO DE YOGUR DE DINAMARCA, POR TIPO DE YOGUR, 2018-2032 (MILLONES DE USD)
TABLA 263 MERCADO DE YOGUR EN DINAMARCA, POR TIPO DE YOGUR, 2018-2032 (KILOTONELADAS)
TABLA 264 MERCADO DE YOGUR DE DINAMARCA, POR TIPO DE PRODUCTO, 2018-2032 (MILLONES DE USD)
TABLA 265 MERCADO DE YOGUR DE DINAMARCA, POR CONTENIDO DE GRASA, 2018-2032 (MILLONES DE USD)
TABLA 266 MERCADO DE YOGUR DE DINAMARCA, POR SABOR, 2018-2032 (MILLONES DE USD)
TABLA 267 MERCADO DE YOGUR CON SABOR A DINAMARCA, POR SABOR, 2018-2032 (MILLONES DE USD)
TABLA 268 MERCADO DE YOGUR DE DINAMARCA, POR FUENTE, 2018-2032 (MILLONES DE USD)
TABLA 269 MERCADO DE YOGUR DE ORIGEN ANIMAL EN DINAMARCA, POR FUENTE, 2018-2032 (MILLONES DE USD)
TABLA 270 MERCADO DE YOGUR DE ORIGEN VEGETAL EN DINAMARCA, POR FUENTE, 2018-2032 (MILLONES DE USD)
TABLA 271 MERCADO DE YOGUR DE DINAMARCA, POR FORMULACIÓN, 2018-2032 (MILLONES DE USD)
TABLA 272 MERCADO DE YOGUR DE DINAMARCA, POR CATEGORÍA DE INCLUSIÓN, 2018-2032 (MILLONES DE USD)
TABLA 273 DINAMARCA CON INCLUSIONES Y COBERTURAS EN EL MERCADO DE YOGUR, POR CATEGORÍA DE INCLUSIÓN, 2018-2032 (MILLONES DE USD)
TABLA 274 MERCADO DE FRUTOS SECOS EN YOGUR DE DINAMARCA, POR CATEGORÍA DE INCLUSIÓN, 2018-2032 (MILLONES DE USD)
TABLA 275 MERCADO DE CHOCOLATES EN YOGUR DE DINAMARCA, POR CATEGORÍA DE INCLUSIÓN, 2018-2032 (MILLONES DE USD)
TABLA 276 MERCADO DE YOGUR DE DINAMARCA, POR FORTIFICACIÓN, 2018-2032 (MILLONES DE USD)
TABLA 277 MERCADO DE YOGUR DE DINAMARCA, POR CATEGORÍA ORGÁNICA, 2018-2032 (MILLONES DE USD)
TABLA 278 MERCADO DE YOGUR DE DINAMARCA, POR MARCA, 2018-2032 (MILLONES DE USD)
TABLA 279 MERCADO DE YOGUR DE DINAMARCA, POR RANGO DE PRECIOS, 2018-2032 (MILLONES DE USD)
TABLA 280 MERCADO DE YOGUR EN DINAMARCA, POR TIPO DE ENVASE, 2018-2032 (MILLONES DE USD)
TABLA 281 DINAMARCA FRASCO DE YOGUR EN EL MERCADO, POR TIPO DE ENVASE, 2018-2032 (MILLONES DE USD)
TABLA 282 BOTELLAS DE YOGUR EN DINAMARCA, POR TIPO DE ENVASE, 2018-2032 (MILLONES DE USD)
TABLA 283 MERCADO DE YOGUR DE DINAMARCA, POR TAMAÑO DE ENVASE, 2018-2032 (MILLONES DE USD)
TABLA 284 MERCADO DE YOGUR DE DINAMARCA, POR RECLAMACIÓN, 2018-2032 (MILLONES DE USD)
TABLA 285 MERCADO DE YOGUR DE DINAMARCA, POR CANAL DE DISTRIBUCIÓN, 2018-2032 (MILLONES DE USD)
TABLA 286 DINAMARCA VENTA MINORISTA EN TIENDAS DEL MERCADO DE YOGUR, POR CANAL DE DISTRIBUCIÓN, 2018-2032 (MILLONES DE USD)
TABLA 287 DINAMARCA VENTA MINORISTA SIN TIENDAS EN EL MERCADO DE YOGUR, POR CANAL DE DISTRIBUCIÓN, 2018-2032 (MILLONES DE USD)
TABLA 288 MERCADO DE YOGUR DEL REINO UNIDO, POR TIPO DE YOGUR, 2018-2032 (MILLONES DE USD)
TABLA 289 MERCADO DE YOGUR EN EL REINO UNIDO, POR TIPO DE YOGUR, 2018-2032 (KILOTONELADAS)
TABLA 290 MERCADO DE YOGUR DEL REINO UNIDO, POR TIPO DE PRODUCTO, 2018-2032 (MILLONES DE USD)
TABLA 291 MERCADO DE YOGUR DEL REINO UNIDO, POR CONTENIDO DE GRASA, 2018-2032 (MILLONES DE USD)
TABLA 292 MERCADO DE YOGUR DEL REINO UNIDO, POR SABOR, 2018-2032 (MILLONES DE USD)
TABLA 293 MERCADO DE YOGUR SABORIZADO EN EL REINO UNIDO, POR SABOR, 2018-2032 (MILLONES DE USD)
TABLA 294 MERCADO DE YOGUR DEL REINO UNIDO, POR FUENTE, 2018-2032 (MILLONES DE USD)
TABLA 295 MERCADO DE YOGUR DE ORIGEN ANIMAL EN EL REINO UNIDO, POR FUENTE, 2018-2032 (MILLONES DE USD)
TABLA 296 MERCADO DE YOGUR DE ORIGEN VEGETAL EN EL REINO UNIDO, POR FUENTE, 2018-2032 (MILLONES DE USD)
TABLA 297 MERCADO DE YOGUR DEL REINO UNIDO, POR FORMULACIÓN, 2018-2032 (MILLONES DE USD)
TABLA 298 MERCADO DE YOGUR DEL REINO UNIDO, POR CATEGORÍA DE INCLUSIÓN, 2018-2032 (MILLONES DE USD)
TABLA 299 REINO UNIDO CON INCLUSIONES Y COBERTURAS EN EL MERCADO DE YOGUR, POR CATEGORÍA DE INCLUSIÓN, 2018-2032 (MILLONES DE USD)
TABLA 300 MERCADO DE FRUTOS SECOS EN YOGUR DEL REINO UNIDO, POR CATEGORÍA DE INCLUSIÓN, 2018-2032 (MILLONES DE USD)
TABLA 301 CHOCOLATES DEL REINO UNIDO EN EL MERCADO DE YOGUR, POR CATEGORÍA DE INCLUSIÓN, 2018-2032 (MILLONES DE USD)
TABLA 302 MERCADO DE YOGUR DEL REINO UNIDO, POR FORTIFICACIÓN, 2018-2032 (MILLONES DE USD)
TABLA 303 MERCADO DE YOGUR DEL REINO UNIDO, POR CATEGORÍA ORGÁNICA, 2018-2032 (MILLONES DE USD)
TABLA 304 MERCADO DE YOGUR EN EL REINO UNIDO, POR MARCA, 2018-2032 (MILLONES DE USD)
TABLA 305 MERCADO DE YOGUR DEL REINO UNIDO, POR RANGO DE PRECIOS, 2018-2032 (MILLONES DE USD)
TABLA 306 MERCADO DE YOGUR DEL REINO UNIDO, POR TIPO DE ENVASE, 2018-2032 (MILLONES DE USD)
TABLA 307 FRASCO DE YOGUR EN EL MERCADO DEL REINO UNIDO, POR TIPO DE ENVASE, 2018-2032 (MILLONES DE USD)
TABLA 308 BOTELLAS DE YOGUR EN EL MERCADO DEL REINO UNIDO, POR TIPO DE ENVASE, 2018-2032 (MILLONES DE USD)
TABLA 309 MERCADO DE YOGUR DEL REINO UNIDO, POR TAMAÑO DE ENVASE, 2018-2032 (MILLONES DE USD)
TABLA 310 MERCADO DE YOGUR DEL REINO UNIDO, POR RECLAMACIÓN, 2018-2032 (MILLONES DE USD)
TABLA 311 MERCADO DE YOGUR DEL REINO UNIDO, POR CANAL DE DISTRIBUCIÓN, 2018-2032 (MILLONES DE USD)
TABLA 312 VENTA MINORISTA DE YOGUR EN TIENDAS DEL REINO UNIDO, POR CANAL DE DISTRIBUCIÓN, 2018-2032 (MILLONES DE USD)
TABLA 313 REINO UNIDO: VENTA MINORISTA SIN TIENDAS EN EL MERCADO DE YOGUR, POR CANAL DE DISTRIBUCIÓN, 2018-2032 (MILLONES DE USD)
TABLA 314 MERCADO DE YOGUR EN PORTUGAL, POR TIPO DE YOGUR, 2018-2032 (MILLONES DE USD)
TABLA 315 MERCADO DE YOGUR EN PORTUGAL, POR TIPO DE YOGUR, 2018-2032 (KILOTONELADAS)
TABLA 316 MERCADO DE YOGUR EN PORTUGAL, POR TIPO DE PRODUCTO, 2018-2032 (MILLONES DE USD)
TABLA 317 MERCADO DE YOGUR DE PORTUGAL, POR CONTENIDO DE GRASA, 2018-2032 (MILLONES DE USD)
TABLA 318 MERCADO DE YOGUR EN PORTUGAL, POR SABOR, 2018-2032 (MILLONES DE USD)
TABLA 319 MERCADO DE YOGUR SABORIZADO EN PORTUGAL, POR SABOR, 2018-2032 (MILLONES DE USD)
TABLA 320 MERCADO DE YOGUR DE PORTUGAL, POR ORIGEN, 2018-2032 (MILLONES DE USD)
TABLA 321 MERCADO DE YOGUR DE ORIGEN ANIMAL EN PORTUGAL, POR FUENTE, 2018-2032 (MILLONES DE USD)
TABLA 322 MERCADO DE YOGUR DE ORIGEN VEGETAL EN PORTUGAL, POR FUENTE, 2018-2032 (MILLONES DE USD)
TABLA 323 MERCADO DE YOGUR DE PORTUGAL, POR FORMULACIÓN, 2018-2032 (MILLONES DE USD)
TABLA 324 MERCADO DE YOGUR DE PORTUGAL, POR CATEGORÍA DE INCLUSIÓN, 2018-2032 (MILLONES DE USD)
TABLA 325 PORTUGAL CON INCLUSIONES Y COBERTURAS EN EL MERCADO DE YOGUR, POR CATEGORÍA DE INCLUSIÓN, 2018-2032 (MILLONES DE USD)
TABLA 326 MERCADO DE FRUTOS SECOS EN YOGUR DE PORTUGAL, POR CATEGORÍA DE INCLUSIÓN, 2018-2032 (MILLONES DE USD)
TABLA 327 CHOCOLATES DE PORTUGAL EN EL MERCADO DE YOGUR, POR CATEGORÍA DE INCLUSIÓN, 2018-2032 (MILLONES DE USD)
TABLA 328 MERCADO DE YOGUR DE PORTUGAL, POR FORTIFICACIÓN, 2018-2032 (MILLONES DE USD)
TABLA 329 MERCADO DE YOGUR DE PORTUGAL, POR CATEGORÍA ORGÁNICA, 2018-2032 (MILLONES DE USD)
TABLA 330 MERCADO DE YOGUR EN PORTUGAL, POR MARCA, 2018-2032 (MILLONES DE USD)
TABLA 331 MERCADO DE YOGUR EN PORTUGAL, POR RANGO DE PRECIOS, 2018-2032 (MILLONES DE USD)
TABLA 332 MERCADO DE YOGUR EN PORTUGAL, POR TIPO DE ENVASE, 2018-2032 (MILLONES DE USD)
TABLA 333 FRASCO DE YOGUR EN EL MERCADO DE PORTUGAL, POR TIPO DE ENVASE, 2018-2032 (MILLONES DE USD)
TABLA 334 BOTELLAS DE YOGUR EN PORTUGAL, POR TIPO DE ENVASE, 2018-2032 (MILLONES DE USD)
TABLA 335 MERCADO DE YOGUR EN PORTUGAL, POR TAMAÑO DE ENVASE, 2018-2032 (MILLONES DE USD)
TABLA 336 MERCADO DE YOGUR DE PORTUGAL, POR RECLAMACIÓN, 2018-2032 (MILLONES DE USD)
TABLA 337 MERCADO DE YOGUR EN PORTUGAL, POR CANAL DE DISTRIBUCIÓN, 2018-2032 (MILLONES DE USD)
TABLA 338 PORTUGAL VENTA MINORISTA DE YOGUR EN TIENDAS, POR CANAL DE DISTRIBUCIÓN, 2018-2032 (MILLONES DE USD)
TABLA 339 PORTUGAL VENTA AL POR MENOR SIN TIENDAS EN EL MERCADO DE YOGUR, POR CANAL DE DISTRIBUCIÓN, 2018-2032 (MILLONES DE USD)
TABLA 340 MERCADO DE YOGUR EN SUIZA, POR TIPO DE YOGUR, 2018-2032 (MILLONES DE USD)
TABLA 341 MERCADO DE YOGUR EN SUIZA, POR TIPO DE YOGUR, 2018-2032 (KILOTONELADAS)
TABLA 342 MERCADO DE YOGUR EN SUIZA, POR TIPO DE PRODUCTO, 2018-2032 (MILLONES DE USD)
TABLA 343 MERCADO DE YOGUR EN SUIZA, POR CONTENIDO DE GRASA, 2018-2032 (MILLONES DE USD)
TABLA 344 MERCADO DE YOGUR EN SUIZA, POR SABOR, 2018-2032 (MILLONES DE USD)
TABLA 345 SUIZA SABORIZADA EN EL MERCADO DE YOGUR, POR SABOR, 2018-2032 (MILLONES DE USD)
TABLA 346 MERCADO DE YOGUR EN SUIZA, POR FUENTE, 2018-2032 (MILLONES DE USD)
TABLA 347 MERCADO DE YOGUR DE ORIGEN ANIMAL EN SUIZA, POR FUENTE, 2018-2032 (MILLONES DE USD)
TABLA 348 MERCADO DE YOGUR DE ORIGEN VEGETAL EN SUIZA, POR FUENTE, 2018-2032 (MILLONES DE USD)
TABLA 349 MERCADO DE YOGUR EN SUIZA, POR FORMULACIÓN, 2018-2032 (MILLONES DE USD)
TABLA 350 MERCADO DE YOGUR EN SUIZA, POR CATEGORÍA DE INCLUSIÓN, 2018-2032 (MILLONES DE USD)
TABLA 351 SUIZA CON INCLUSIONES Y COBERTURAS EN EL MERCADO DE YOGUR, POR CATEGORÍA DE INCLUSIÓN, 2018-2032 (MILLONES DE USD)
TABLA 352 SUIZA MERCADO DE FRUTOS SECOS EN YOGUR, POR CATEGORÍA DE INCLUSIÓN, 2018-2032 (MILLONES DE USD)
TABLA 353 CHOCOLATES SUIZOS EN EL MERCADO DE YOGUR, POR CATEGORÍA DE INCLUSIÓN, 2018-2032 (MILLONES DE USD)
TABLA 354 MERCADO DE YOGUR EN SUIZA, POR FORTIFICACIÓN, 2018-2032 (MILLONES DE USD)
TABLA 355 MERCADO DE YOGUR EN SUIZA, POR CATEGORÍA ORGÁNICA, 2018-2032 (MILLONES DE USD)
TABLA 356 MERCADO DE YOGUR EN SUIZA, POR MARCA, 2018-2032 (MILLONES DE USD)
TABLA 357 MERCADO DE YOGUR EN SUIZA, POR RANGO DE PRECIOS, 2018-2032 (MILLONES DE USD)
TABLA 358 MERCADO DE YOGUR EN SUIZA, POR TIPO DE ENVASE, 2018-2032 (MILLONES DE USD)
TABLA 359 SUIZA FRASCO DE YOGUR EN EL MERCADO, POR TIPO DE ENVASE, 2018-2032 (MILLONES DE USD)
TABLA 360 BOTELLAS DE YOGUR EN SUIZA, POR TIPO DE ENVASE, 2018-2032 (MILLONES DE USD)
TABLA 361 MERCADO DE YOGUR EN SUIZA, POR TAMAÑO DE ENVASE, 2018-2032 (MILLONES DE USD)
TABLA 362 MERCADO DE YOGUR EN SUIZA, POR RECLAMACIÓN, 2018-2032 (MILLONES DE USD)
TABLA 363 MERCADO DE YOGUR EN SUIZA, POR CANAL DE DISTRIBUCIÓN, 2018-2032 (MILLONES DE USD)
TABLA 364 SUIZA VENTA MINORISTA DE YOGUR EN TIENDAS, POR CANAL DE DISTRIBUCIÓN, 2018-2032 (MILLONES DE USD)
TABLA 365 SUIZA VENTA MINORISTA SIN TIENDAS EN EL MERCADO DE YOGUR, POR CANAL DE DISTRIBUCIÓN, 2018-2032 (MILLONES DE USD)
TABLA 366 MERCADO DE YOGUR EN IRLANDA, POR TIPO DE YOGUR, 2018-2032 (MILLONES DE USD)
TABLA 367 MERCADO DE YOGUR EN IRLANDA, POR TIPO DE YOGUR, 2018-2032 (KILOTONELADAS)
TABLA 368 MERCADO DE YOGUR EN IRLANDA, POR TIPO DE PRODUCTO, 2018-2032 (MILLONES DE USD)
TABLA 369 MERCADO DE YOGUR EN IRLANDA, POR CONTENIDO DE GRASA, 2018-2032 (MILLONES DE USD)
TABLA 370 MERCADO DE YOGUR EN IRLANDA, POR SABOR, 2018-2032 (MILLONES DE USD)
TABLA 371 MERCADO DE YOGUR CON SABOR A IRLANDA, POR SABOR, 2018-2032 (MILLONES DE USD)
TABLA 372 MERCADO DE YOGUR EN IRLANDA, POR FUENTE, 2018-2032 (MILLONES DE USD)
TABLA 373 MERCADO DE YOGUR DE ORIGEN ANIMAL EN IRLANDA, POR FUENTE, 2018-2032 (MILLONES DE USD)
TABLA 374 MERCADO DE YOGUR DE ORIGEN VEGETAL EN IRLANDA, POR FUENTE, 2018-2032 (MILLONES DE USD)
TABLA 375 MERCADO DE YOGUR EN IRLANDA, POR FORMULACIÓN, 2018-2032 (MILLONES DE USD)
TABLA 376 MERCADO DE YOGUR DE IRLANDA, POR CATEGORÍA DE INCLUSIÓN, 2018-2032 (MILLONES DE USD)
TABLA 377 IRLANDA CON INCLUSIONES Y COBERTURAS EN EL MERCADO DE YOGUR, POR CATEGORÍA DE INCLUSIÓN, 2018-2032 (MILLONES DE USD)
TABLA 378 MERCADO DE FRUTOS SECOS EN YOGUR DE IRLANDA, POR CATEGORÍA DE INCLUSIÓN, 2018-2032 (MILLONES DE USD)
TABLA 379 CHOCOLATES IRLANDESES EN EL MERCADO DE YOGUR, POR CATEGORÍA DE INCLUSIÓN, 2018-2032 (MILLONES DE USD)
TABLA 380 MERCADO DE YOGUR EN IRLANDA, POR FORTIFICACIÓN, 2018-2032 (MILLONES DE USD)
TABLA 381 MERCADO DE YOGUR EN IRLANDA, POR CATEGORÍA ORGÁNICA, 2018-2032 (MILLONES DE USD)
TABLA 382 MERCADO DE YOGUR EN IRLANDA, POR MARCA, 2018-2032 (MILLONES DE USD)
TABLA 383 MERCADO DE YOGUR EN IRLANDA, POR RANGO DE PRECIOS, 2018-2032 (MILLONES DE USD)
TABLA 384 MERCADO DE YOGUR EN IRLANDA, POR TIPO DE ENVASE, 2018-2032 (MILLONES DE USD)
TABLA 385 FRASCO DE YOGUR EN EL MERCADO DE IRLANDA, POR TIPO DE ENVASE, 2018-2032 (MILLONES DE USD)
TABLA 386 BOTELLAS DE YOGUR EN IRLANDA, POR TIPO DE ENVASE, 2018-2032 (MILLONES DE USD)
TABLA 387 MERCADO DE YOGUR EN IRLANDA, POR TAMAÑO DE ENVASE, 2018-2032 (MILLONES DE USD)
TABLA 388 MERCADO DE YOGUR EN IRLANDA, POR RECLAMACIÓN, 2018-2032 (MILLONES DE USD)
TABLA 389 MERCADO DE YOGUR EN IRLANDA, POR CANAL DE DISTRIBUCIÓN, 2018-2032 (MILLONES DE USD)
TABLA 390 VENTA MINORISTA DE YOGUR EN TIENDAS DE IRLANDA, POR CANAL DE DISTRIBUCIÓN, 2018-2032 (MILLONES DE USD)
TABLA 391 IRLANDA VENTA AL POR MENOR DE YOGUR SIN TIENDAS, POR CANAL DE DISTRIBUCIÓN, 2018-2032 (MILLONES DE USD)
TABLA 392 MERCADO DE YOGUR DE FINLANDIA, POR TIPO DE YOGUR, 2018-2032 (MILLONES DE USD)
TABLA 393 MERCADO DE YOGUR DE FINLANDIA, POR TIPO DE YOGUR, 2018-2032 (KILOTONELADAS)
TABLA 394 MERCADO DE YOGUR DE FINLANDIA, POR TIPO DE PRODUCTO, 2018-2032 (MILLONES DE USD)
TABLA 395 MERCADO DE YOGUR DE FINLANDIA, POR CONTENIDO DE GRASA, 2018-2032 (MILLONES DE USD)
TABLA 396 MERCADO DE YOGUR DE FINLANDIA, POR SABOR, 2018-2032 (MILLONES DE USD)
TABLA 397 MERCADO DE YOGUR CON SABOR A FINLANDIA, POR SABOR, 2018-2032 (MILLONES DE USD)
TABLA 398 MERCADO DE YOGUR DE FINLANDIA, POR FUENTE, 2018-2032 (MILLONES DE USD)
TABLA 399 MERCADO DE YOGUR DE ORIGEN ANIMAL EN FINLANDIA, POR FUENTE, 2018-2032 (MILLONES DE USD)
TABLA 400 MERCADO DE YOGUR DE ORIGEN VEGETAL EN FINLANDIA, POR FUENTE, 2018-2032 (MILLONES DE USD)
TABLA 401 MERCADO DE YOGUR DE FINLANDIA, POR FORMULACIÓN, 2018-2032 (MILLONES DE USD)
TABLA 402 MERCADO DE YOGUR DE FINLANDIA, POR CATEGORÍA DE INCLUSIÓN, 2018-2032 (MILLONES DE USD)
TABLA 403 FINLANDIA CON INCLUSIONES Y COBERTURAS EN EL MERCADO DE YOGUR, POR CATEGORÍA DE INCLUSIÓN, 2018-2032 (MILLONES DE USD)
TABLA 404 MERCADO DE FRUTOS SECOS EN YOGUR DE FINLANDIA, POR CATEGORÍA DE INCLUSIÓN, 2018-2032 (MILLONES DE USD)
TABLA 405 CHOCOLATES DE FINLANDIA EN EL MERCADO DE YOGUR, POR CATEGORÍA DE INCLUSIÓN, 2018-2032 (MILLONES DE USD)
TABLA 406 MERCADO DE YOGUR DE FINLANDIA, POR FORTIFICACIÓN, 2018-2032 (MILLONES DE USD)
TABLA 407 MERCADO DE YOGUR DE FINLANDIA, POR CATEGORÍA ORGÁNICA, 2018-2032 (MILLONES DE USD)
TABLA 408 MERCADO DE YOGUR DE FINLANDIA, POR MARCA, 2018-2032 (MILLONES DE USD)
TABLA 409 MERCADO DE YOGUR DE FINLANDIA, POR RANGO DE PRECIOS, 2018-2032 (MILLONES DE USD)
TABLA 410 MERCADO DE YOGUR DE FINLANDIA, POR TIPO DE ENVASE, 2018-2032 (MILLONES DE USD)
TABLA 411 FRASCO DE YOGUR EN FINLANDIA, POR TIPO DE ENVASE, 2018-2032 (MILLONES DE USD)
TABLA 412 BOTELLAS DE YOGUR EN FINLANDIA, POR TIPO DE ENVASE, 2018-2032 (MILLONES DE USD)
TABLA 413 MERCADO DE YOGUR DE FINLANDIA, POR TAMAÑO DE ENVASE, 2018-2032 (MILLONES DE USD)
TABLA 414 MERCADO DE YOGUR DE FINLANDIA, POR RECLAMACIÓN, 2018-2032 (MILLONES DE USD)
TABLA 415 MERCADO DE YOGUR DE FINLANDIA, POR CANAL DE DISTRIBUCIÓN, 2018-2032 (MILLONES DE USD)
TABLA 416 VENTA MINORISTA DE YOGUR EN TIENDAS DE FINLANDIA, POR CANAL DE DISTRIBUCIÓN, 2018-2032 (MILLONES DE USD)
TABLA 417 FINLANDIA VENTA MINORISTA SIN TIENDAS EN EL MERCADO DE YOGUR, POR CANAL DE DISTRIBUCIÓN, 2018-2032 (MILLONES DE USD)
TABLA 418 MERCADO DE YOGUR DE LUXEMBURGO, POR TIPO DE YOGUR, 2018-2032 (MILLONES DE USD)
TABLA 419 MERCADO DE YOGUR DE LUXEMBURGO, POR TIPO DE YOGUR, 2018-2032 (KILOTONELADAS)
TABLA 420 MERCADO DE YOGUR DE LUXEMBURGO, POR TIPO DE PRODUCTO, 2018-2032 (MILLONES DE USD)
TABLA 421 MERCADO DE YOGUR DE LUXEMBURGO, POR CONTENIDO DE GRASA, 2018-2032 (MILLONES DE USD)
TABLA 422 MERCADO DE YOGUR DE LUXEMBURGO, POR SABOR, 2018-2032 (MILLONES DE USD)
TABLA 423 YOGUR CON SABOR A LUXEMBURGO EN EL MERCADO, POR SABOR, 2018-2032 (MILLONES DE USD)
TABLA 424 MERCADO DE YOGUR DE LUXEMBURGO, POR FUENTE, 2018-2032 (MILLONES DE USD)
TABLA 425 MERCADO DE YOGUR DE ORIGEN ANIMAL EN LUXEMBURGO, POR FUENTE, 2018-2032 (MILLONES DE USD)
TABLA 426 MERCADO DE YOGUR DE ORIGEN VEGETAL EN LUXEMBURGO, POR FUENTE, 2018-2032 (MILLONES DE USD)
TABLA 427 MERCADO DE YOGUR DE LUXEMBURGO, POR FORMULACIÓN, 2018-2032 (MILLONES DE USD)
TABLA 428 MERCADO DE YOGUR DE LUXEMBURGO, POR CATEGORÍA DE INCLUSIÓN, 2018-2032 (MILLONES DE USD)
TABLA 429 LUXEMBURGO CON INCLUSIONES Y COBERTURAS EN EL MERCADO DE YOGUR, POR CATEGORÍA DE INCLUSIÓN, 2018-2032 (MILLONES DE USD)
TABLA 430 NUECES DE LUXEMBURGO EN EL MERCADO DE YOGUR, POR CATEGORÍA DE INCLUSIÓN, 2018-2032 (MILLONES DE USD)
TABLA 431 CHOCOLATES DE LUXEMBURGO EN EL MERCADO DE YOGUR, POR CATEGORÍA DE INCLUSIÓN, 2018-2032 (MILLONES DE USD)
TABLA 432 MERCADO DE YOGUR DE LUXEMBURGO, POR FORTIFICACIÓN, 2018-2032 (MILLONES DE USD)
TABLA 433 MERCADO DE YOGUR DE LUXEMBURGO, POR CATEGORÍA ORGÁNICA, 2018-2032 (MILLONES DE USD)
TABLA 434 MERCADO DE YOGUR DE LUXEMBURGO, POR MARCA, 2018-2032 (MILLONES DE USD)
TABLA 435 MERCADO DE YOGUR DE LUXEMBURGO, POR RANGO DE PRECIOS, 2018-2032 (MILLONES DE USD)
TABLA 436 MERCADO DE YOGUR DE LUXEMBURGO, POR TIPO DE ENVASE, 2018-2032 (MILLONES DE USD)
TABLA 437 FRASCO DE YOGUR EN LUXEMBURGO, POR TIPO DE ENVASE, 2018-2032 (MILLONES DE USD)
TABLA 438 BOTELLAS DE YOGUR EN LUXEMBURGO, POR TIPO DE ENVASE, 2018-2032 (MILLONES DE USD)
TABLA 439 MERCADO DE YOGUR DE LUXEMBURGO, POR TAMAÑO DE ENVASE, 2018-2032 (MILLONES DE USD)
TABLA 440 MERCADO DE YOGUR DE LUXEMBURGO, POR RECLAMACIÓN, 2018-2032 (MILLONES DE USD)
TABLA 441 MERCADO DE YOGUR DE LUXEMBURGO, POR CANAL DE DISTRIBUCIÓN, 2018-2032 (MILLONES DE USD)
TABLA 442 VENTA MINORISTA DE YOGUR EN TIENDAS DE LUXEMBURGO, POR CANAL DE DISTRIBUCIÓN, 2018-2032 (MILLONES DE USD)
TABLA 443 VENTA MINORISTA DE YOGUR SIN TIENDAS EN LUXEMBURGO, POR CANAL DE DISTRIBUCIÓN, 2018-2032 (MILLONES DE USD)
TABLA 444 RESTO DE EUROPA MERCADO DE YOGUR, POR TIPO DE YOGUR, 2018-2032 (MILLONES DE USD)
TABLA 445 RESTO DE EUROPA MERCADO DE YOGUR, POR TIPO DE YOGUR, 2018-2032 (KILOTONELADAS)
Lista de figuras
FIGURA 1 MERCADO EUROPEO DEL YOGUR: SEGMENTACIÓN
FIGURA 2 MERCADO EUROPEO DEL YOGUR: TRIANGULACIÓN DE DATOS
FIGURA 3 MERCADO EUROPEO DEL YOGUR: ANÁLISIS DROC
FIGURA 4 MERCADO EUROPEO DEL YOGUR: ANÁLISIS DEL MERCADO EUROPEO VS. REGIONAL
FIGURA 5 MERCADO EUROPEO DEL YOGUR: ANÁLISIS DE INVESTIGACIÓN DE EMPRESAS
FIGURA 6 MERCADO EUROPEO DEL YOGUR: DATOS DEMOGRÁFICOS DE LAS ENTREVISTAS
FIGURA 7 MERCADO EUROPEO DE YOGUR: CUADRÍCULA DE POSICIÓN DE MERCADO DBMR
FIGURA 8 MERCADO EUROPEO DEL YOGUR: CUADRÍCULA DE COBERTURA DE APLICACIONES DEL MERCADO
FIGURA 9 MERCADO EUROPEO DEL YOGUR: ANÁLISIS DE LA CUOTA DE PROVEEDORES
FIGURA 10 MERCADO EUROPEO DEL YOGUR: SEGMENTACIÓN
FIGURA 11 OCHO SEGMENTOS COMPONEN EL MERCADO EUROPEO DEL YOGUR, POR TIPO DE YOGUR
FIGURA 12 SE ESPERA QUE EL CAMBIO EN LOS ESTILOS DE VIDA DE LAS PERSONAS PARA OPTAR POR PRODUCTOS MÁS SALUDABLES IMPULSARA EL MERCADO EUROPEO DEL YOGUR EN EL PERÍODO DE PRONÓSTICO DE 2025 A 2032
FIGURA 13 SE ESPERA QUE EL SEGMENTO DE YOGUR NORMAL REPRESENTE LA MAYOR PARTICIPACIÓN DEL MERCADO DE YOGUR EN EUROPA EN 2025 Y 2032
FIGURA 14 ESCENARIO DE IMPORTACIÓN Y EXPORTACIÓN (MILES DE USD)
FIGURA 15 ANÁLISIS DE PRECIOS
FIGURA 16 ANÁLISIS DROC
FIGURA 17 MERCADO EUROPEO DEL YOGUR: POR TIPO DE PRODUCTO, 2024
FIGURA 18 MERCADO EUROPEO DEL YOGUR: POR TIPO DE PRODUCTO, 2025-2032 (MILLONES DE USD)
FIGURA 19 MERCADO EUROPEO DEL YOGUR: POR TIPO DE PRODUCTO, CAGR (2025-2032)
FIGURA 20 MERCADO EUROPEO DEL YOGUR: POR TIPO DE PRODUCTO, CURVA LIFELINE
FIGURA 21 MERCADO EUROPEO DEL YOGUR: POR FORMULACIÓN, 2024
FIGURA 22 MERCADO EUROPEO DEL YOGUR: POR FORMULACIÓN, 2025-2032 (MILLONES DE USD)
FIGURA 23 MERCADO EUROPEO DEL YOGUR: POR FORMULACIÓN, CAGR (2025-2032)
FIGURA 24 MERCADO EUROPEO DEL YOGUR: POR FORMULACIÓN, CURVA DE LÍNEA DE VIDA
FIGURA 25 MERCADO EUROPEO DE YOGUR: POR CATEGORÍA DE INCLUSIÓN, 2024
FIGURA 26 MERCADO EUROPEO DE YOGUR: POR CATEGORÍA DE INCLUSIÓN, 2025-2032 (MILLONES DE USD)
FIGURA 27 MERCADO EUROPEO DE YOGUR: POR CATEGORÍA DE INCLUSIÓN, CAGR (2025-2032)
FIGURA 28 MERCADO EUROPEO DE YOGUR: POR CATEGORÍA DE INCLUSIÓN, CURVA LIFELINE
FIGURA 29 MERCADO EUROPEO DEL YOGUR: POR FUENTE, 2024
FIGURA 30 MERCADO EUROPEO DEL YOGUR: POR FUENTE, 2025-2032 (MILLONES DE USD)
FIGURA 31 MERCADO EUROPEO DEL YOGUR: POR FUENTE, CAGR (2025-2032)
FIGURA 32 MERCADO EUROPEO DEL YOGUR: POR ORIGEN, CURVA LIFELINE
FIGURA 33 MERCADO EUROPEO DEL YOGUR: POR SABOR, 2024
FIGURA 34 MERCADO EUROPEO DE YOGUR: POR SABOR, 2025-2032 (MILLONES DE USD)
FIGURA 35 MERCADO EUROPEO DEL YOGUR: POR SABOR, CAGR (2025-2032)
FIGURA 36 MERCADO EUROPEO DEL YOGUR: POR SABOR, CURVA LIFELINE
FIGURA 37 MERCADO EUROPEO DEL YOGUR: POR CONTENIDO DE GRASA, 2024
FIGURA 38 MERCADO EUROPEO DE YOGUR: POR CONTENIDO DE GRASA, 2025-2032 (MILLONES DE USD)
FIGURA 39 MERCADO EUROPEO DE YOGUR: POR CONTENIDO DE GRASA, CAGR (2025-2032)
FIGURA 40 MERCADO EUROPEO DEL YOGUR: POR CONTENIDO DE GRASA, CURVA LIFELINE
FIGURA 41 MERCADO EUROPEO DEL YOGUR: POR FORTIFICACIÓN, 2024
FIGURA 42 MERCADO EUROPEO DEL YOGUR: POR FORTIFICACIÓN, 2025-2032 (MILLONES DE USD)
FIGURA 43 MERCADO EUROPEO DEL YOGUR: POR ENRIQUECIMIENTO, CAGR (2025-2032)
FIGURA 44 MERCADO EUROPEO DEL YOGUR: POR ENRIQUECIMIENTO, CURVA DE VIDA
FIGURA 45 MERCADO EUROPEO DE YOGUR: POR CATEGORÍA ORGÁNICA, 2024
FIGURA 46 MERCADO EUROPEO DE YOGUR: POR CATEGORÍA ORGÁNICA, 2025-2032 (MILLONES DE USD)
FIGURA 47 MERCADO EUROPEO DE YOGUR: POR CATEGORÍA ORGÁNICA, CAGR (2025-2032)
FIGURA 48 MERCADO EUROPEO DE YOGUR: POR CATEGORÍA ORGÁNICA, CURVA LIFELINE
FIGURA 49 MERCADO EUROPEO DEL YOGUR: POR CANAL DE DISTRIBUCIÓN, 2024
FIGURA 50 MERCADO EUROPEO DEL YOGUR: POR CANAL DE DISTRIBUCIÓN, 2025-2032 (MILLONES DE USD)
FIGURA 51 MERCADO EUROPEO DEL YOGUR: POR CANAL DE DISTRIBUCIÓN, CAGR (2025-2032)
FIGURA 52 MERCADO EUROPEO DEL YOGUR: POR CANAL DE DISTRIBUCIÓN, CURVA LIFELINE
FIGURA 53 MERCADO EUROPEO DE YOGUR: POR TAMAÑO DE ENVASE, 2024
FIGURA 54 MERCADO EUROPEO DE YOGUR: POR TAMAÑO DE ENVASE, 2025-2032 (MILLONES DE USD)
FIGURA 55 MERCADO EUROPEO DE YOGUR: POR TAMAÑO DE ENVASE, CAGR (2025-2032)
FIGURA 56 MERCADO EUROPEO DE YOGUR: POR TAMAÑO DE ENVASE, CURVA DE LÍNEA DE VIDA
FIGURA 57 MERCADO EUROPEO DEL YOGUR: POR RECLAMACIÓN, 2024
FIGURA 58 MERCADO EUROPEO DE YOGUR: POR RECLAMACIÓN, 2025-2032 (MILLONES DE USD)
FIGURA 59 MERCADO EUROPEO DE YOGUR: POR RECLAMACIÓN, CAGR (2025-2032)
FIGURA 60 MERCADO EUROPEO DEL YOGUR: POR RECLAMACIÓN, CURVA DE VIDA
FIGURA 61 MERCADO EUROPEO DEL YOGUR: POR MARCA, 2024
FIGURA 62 MERCADO EUROPEO DE YOGUR: POR MARCA, 2025-2032 (MILLONES DE USD)
FIGURA 63 MERCADO EUROPEO DE YOGUR: POR MARCA, CAGR (2025-2032)
FIGURA 64 MERCADO EUROPEO DEL YOGUR: POR MARCA, CURVA LIFELINE
FIGURA 65 MERCADO EUROPEO DEL YOGUR: POR RANGO DE PRECIOS, 2024
FIGURA 66 MERCADO EUROPEO DEL YOGUR: POR RANGO DE PRECIOS, 2025-2032 (MILLONES DE USD)
FIGURA 67 MERCADO EUROPEO DEL YOGUR: POR RANGO DE PRECIOS, CAGR (2025-2032)
FIGURA 68 MERCADO EUROPEO DEL YOGUR: POR RANGO DE PRECIOS, CURVA LIFELINE
FIGURA 69 MERCADO EUROPEO DEL YOGUR: POR TIPO DE ENVASE, 2024
FIGURA 70 MERCADO EUROPEO DE YOGUR: POR TIPO DE ENVASE, 2025-2032 (MILLONES DE USD)
FIGURA 71 MERCADO EUROPEO DE YOGUR: POR TIPO DE ENVASE, CAGR (2025-2032)
FIGURA 72 MERCADO EUROPEO DEL YOGUR: POR TIPO DE ENVASE, CURVA DE LÍNEA DE VIDA
FIGURA 73 MERCADO EUROPEO DEL YOGUR: INSTANTÁNEA (2024)
FIGURA 74 MERCADO EUROPEO DEL YOGUR: CUOTA DE LA EMPRESA 2024 (%)
Metodología de investigación
La recopilación de datos y el análisis del año base se realizan utilizando módulos de recopilación de datos con muestras de gran tamaño. La etapa incluye la obtención de información de mercado o datos relacionados a través de varias fuentes y estrategias. Incluye el examen y la planificación de todos los datos adquiridos del pasado con antelación. Asimismo, abarca el examen de las inconsistencias de información observadas en diferentes fuentes de información. Los datos de mercado se analizan y estiman utilizando modelos estadísticos y coherentes de mercado. Además, el análisis de la participación de mercado y el análisis de tendencias clave son los principales factores de éxito en el informe de mercado. Para obtener más información, solicite una llamada de un analista o envíe su consulta.
La metodología de investigación clave utilizada por el equipo de investigación de DBMR es la triangulación de datos, que implica la extracción de datos, el análisis del impacto de las variables de datos en el mercado y la validación primaria (experto en la industria). Los modelos de datos incluyen cuadrícula de posicionamiento de proveedores, análisis de línea de tiempo de mercado, descripción general y guía del mercado, cuadrícula de posicionamiento de la empresa, análisis de patentes, análisis de precios, análisis de participación de mercado de la empresa, estándares de medición, análisis global versus regional y de participación de proveedores. Para obtener más información sobre la metodología de investigación, envíe una consulta para hablar con nuestros expertos de la industria.
Personalización disponible
Data Bridge Market Research es líder en investigación formativa avanzada. Nos enorgullecemos de brindar servicios a nuestros clientes existentes y nuevos con datos y análisis que coinciden y se adaptan a sus objetivos. El informe se puede personalizar para incluir análisis de tendencias de precios de marcas objetivo, comprensión del mercado de países adicionales (solicite la lista de países), datos de resultados de ensayos clínicos, revisión de literatura, análisis de mercado renovado y base de productos. El análisis de mercado de competidores objetivo se puede analizar desde análisis basados en tecnología hasta estrategias de cartera de mercado. Podemos agregar tantos competidores sobre los que necesite datos en el formato y estilo de datos que esté buscando. Nuestro equipo de analistas también puede proporcionarle datos en archivos de Excel sin procesar, tablas dinámicas (libro de datos) o puede ayudarlo a crear presentaciones a partir de los conjuntos de datos disponibles en el informe.

