
Europe Yogurt Market
Market Size in USD Billion
 USD
28.78 Billion
USD
43.35 Billion
2024
2032
USD
28.78 Billion
USD
43.35 Billion
2024
2032
| 2025 - 2032 | |
| USD 28.78 Billion | |
| USD 43.35 Billion | |
| % | |
|
Europe Yogurt Market Analysis
Yogurt is an ancient food, used by peoples in Asia, Europe, and the Middle East across the millennia. Yogurt first appeared during the Neolithic period, around 5,000–10,000 years ago, probably as a result of milk naturally souring in warm temperatures. Evidence from ancient pottery shows that Neolithic people were using the pots to store milk. As a fermented food, yogurt was a great way to preserve milk, since the acidity slows the growth of harmful bacteria. Yogurt was a well-known food in the Greek and Roman Empire and has played a major role in Mediterranean cuisine since 800 BCE
Europe Yogurt Market Size
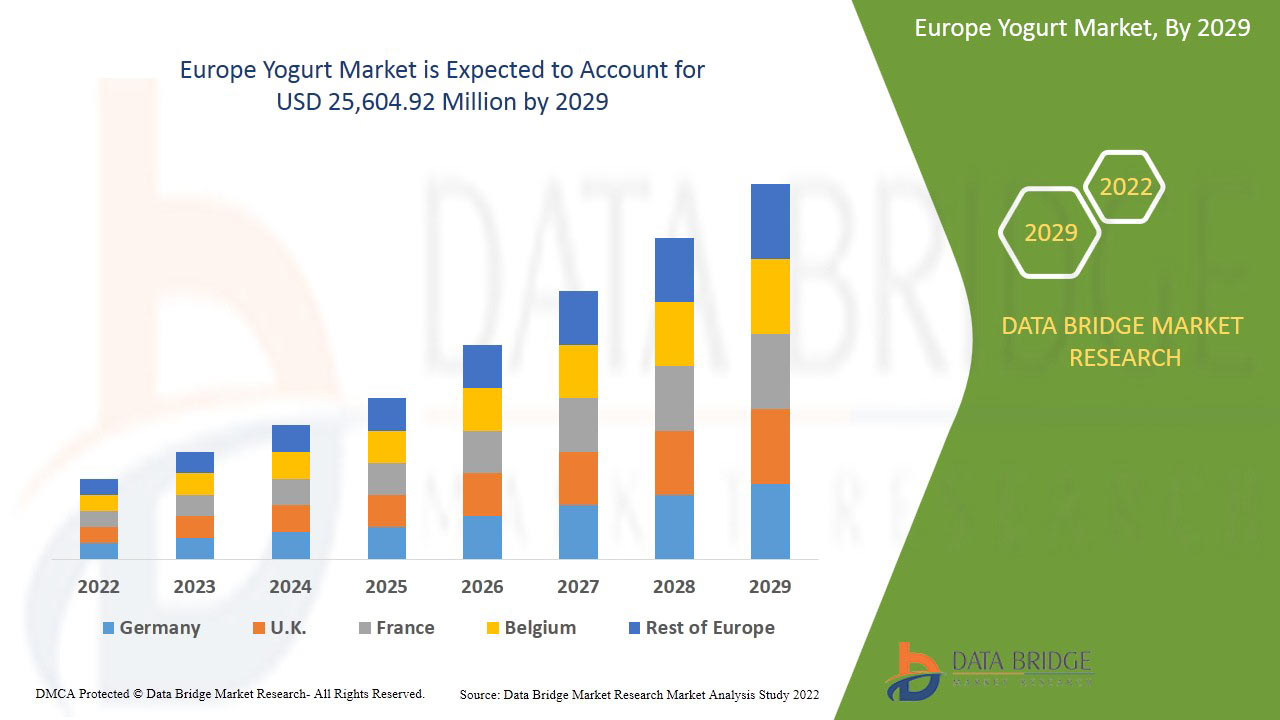
Europe Yogurt Market size was valued at USD 28.78 billion in 2024 and is projected to reach USD 43.35 billion by 2032, with a CAGR of 5.4% during the forecast period of 2025 to 2032. In addition to the insights on market scenarios such as market value, growth rate, segmentation, geographical coverage, and major players, the market reports curated by the Data Bridge Market Research also include import export analysis, production capacity overview, production consumption analysis, price trend analysis, climate change scenario, supply chain analysis, value chain analysis, raw material/consumables overview, vendor selection criteria, PESTLE Analysis, Porter Analysis, and regulatory framework.
Europe Yogurt Market Trends
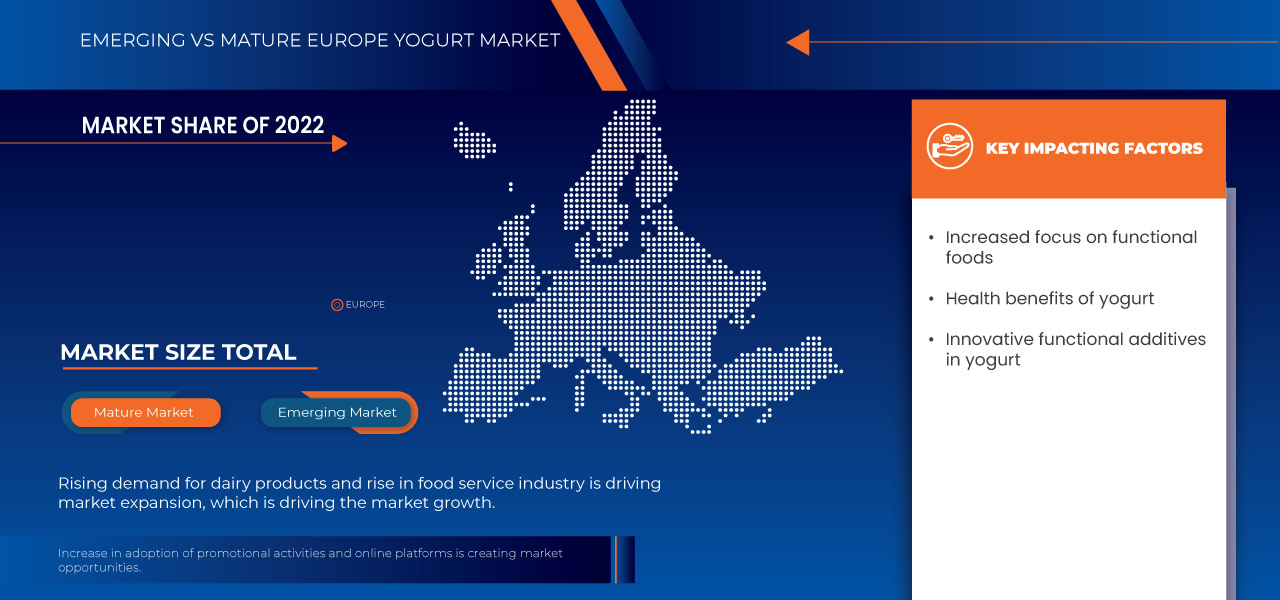
“Growing Interest in Functional Foods”
The growing interest in functional foods is rapidly transforming the European yogurt market, with consumers increasingly seeking products that offer more than just basic nutrition. Yogurt enriched with added vitamins, minerals, and probiotics is gaining traction as people look for food options that contribute to specific health benefits, such as improved gut health, enhanced immunity, and better digestive function. This shift towards functional foods reflects a broader consumer trend of prioritizing foods that serve a dual purpose—satisfying hunger while also delivering measurable health advantages. As a result, yogurt manufacturers are increasingly fortifying their products with beneficial ingredients such as vitamin D, calcium, and live cultures, tapping into the rising demand for wellness-focused foods. The expanding variety of functional yogurt products, including those tailored for specific health needs such as bone health or immune support, is driving market growth. This surge in consumer interest in functional foods positions yogurt as a key player in the expanding wellness food sector, further accelerating its market expansion across Europe.
Report Scope and Europe Yogurt Market Segmentation
|
Attributes |
Germany, Switzerland and Austria Diagnostic Testing Market Insights |
|
Segments Covered |
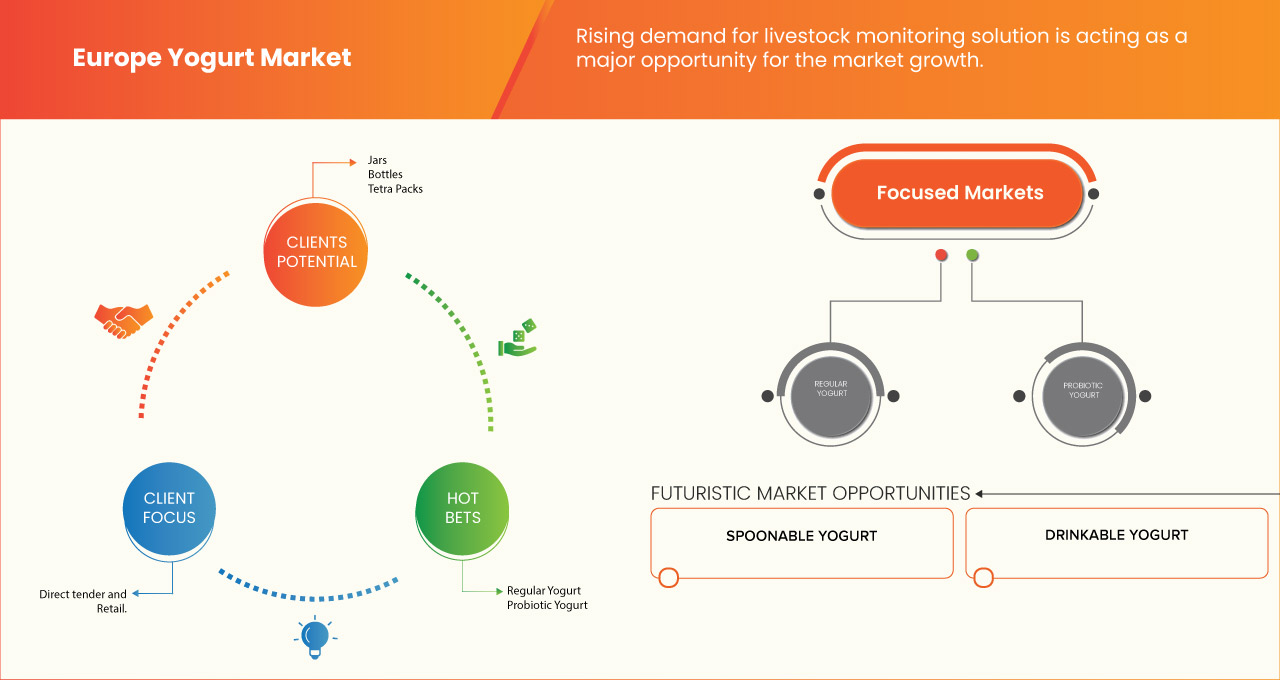
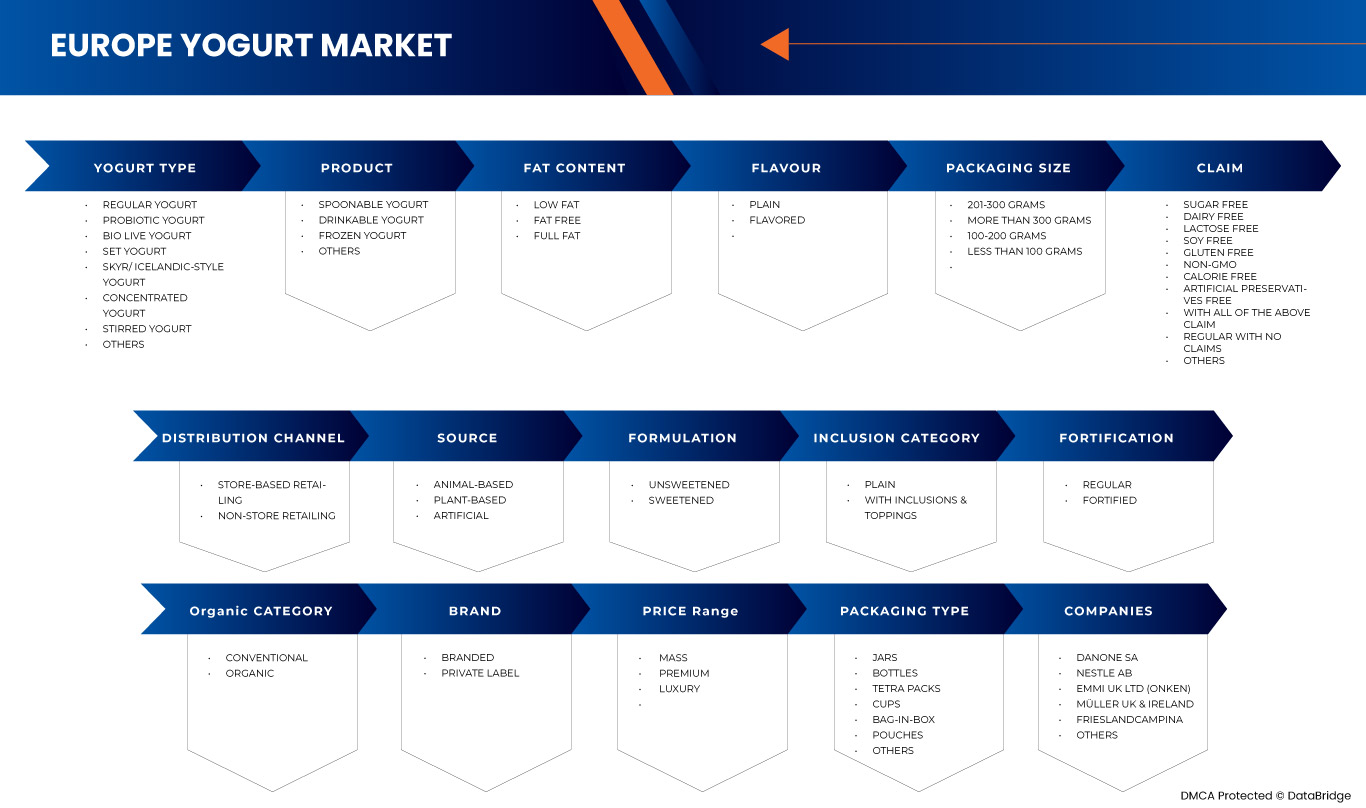
Yogurt Type (Yogurt, Skyr/ Icelandic-Style Yogurt, Concentrated Yogurt, Probiotic Yogurt, Set Yogurt, Bio Live Yogurt, Stirred Yogurt, and Others), Product Type (Drinkable Yogurt, Spoonable Yogurt, Frozen Yogurt, and Others), Fat Content (Full Fat, Low Fat, and Fat Free), Flavor (Plain and Flavored), Source Type (Animal-Based, Plant-Based, and Artificial), Formulation (Sweetened and Unsweetened), Brand (Yoplait, Chobani, Stonyfield Greek, Corner, Activia, Yeo, Oikos, Arla Skyr, Icelandic Provisions Skyr, Isey Skyr, and Others), Inclusion Category (Plain and With Inclusions, and Toppings), Fortification (Regular and Fortified), Claim (Gluten Free, Lactose Free, Artificial Preservatives Free, Dairy Free, Soy Free, Non-Gmo, Sugar Free, Calorie Free, With All Of The Above Claim, Regular With No Claims, and Others), Organic Category (Conventional and Organic), Brand (Branded and Private Label), Packaging (Bag-In-Box, Pouches, Jars, Cups, Bottles, Tetra Packs, and Others), Packaging Size (Less Than 100 Grams, 100-200 Grams, 201-300 Grams, and More Than 300 Grams), and Distribution Channel (Store-Based Retailing and Non-Store Retailing) |
|
Countries Covered |
Germany, France, U.K., Italy, Spain, Russia, Netherlands, Belgium, Switzerland, Turkey, and Rest of Europe |
|
Key Market Players |
Danone (France), Nestlé (Switzerland), EMMY UK LTD (London), Müller UK & Ireland (England), FrieslandCampina (Netherlands), THE CAMPBELL’S COMPANY (U.S.), Arla Foods Amba (Denmark), SCHREIBER FOOD INC (U.S.), Sodiaal (France), CREMO SA (Switzerland), Fen Farm Dairy (U.K.), LACTEAS FLOR DE BURGOS S.L. (Spain), LATTE MAREMMA (Italy), Newlat Food S.p.A (Italy), The Hain Celestial Group, Inc. (New York), and Yeo Valley Organic Limited (U.K.) |
|
Market Opportunities |
|
|
Value Added Data Infosets |
In addition to the insights on market scenarios such as market value, growth rate, segmentation, geographical coverage, and major players, the market reports curated by the Data Bridge Market Research also include import export analysis, production capacity overview, production consumption analysis, price trend analysis, climate change scenario, supply chain analysis, value chain analysis, raw material/consumables overview, vendor selection criteria, PESTLE Analysis, Porter Analysis, and regulatory framework. |
Europe Yogurt Market Definition
Yogurt is a high-fat dairy product, typically containing between 30% to 40% milk fat, that is specifically designed for whipping into a light, airy texture. It can be made from the milk of cows or other dairy animals and is characterized by its rich and creamy consistency, making it ideal for culinary applications such as topping desserts, creating fillings, and enriching sauces. The high-fat content allows it to incorporate air when whipped, resulting in a stable foam that holds its shape, making it a popular ingredient in both home and professional kitchens for creating a variety of delicious and visually appealing dishes.
Europe Yogurt Market Dynamics
Drivers
- Health Benefits of Yogurt
The health benefits of yogurt are a major driver for the European yogurt market, as more consumers recognize its positive effects on overall well-being. Yogurt is widely known for its rich content of probiotics, which support digestive health and balance gut microbiota. The inclusion of essential nutrients such as calcium, protein, and vitamin D further enhances its appeal, particularly among health-conscious individuals. In addition to promoting gut health, yogurt is linked to improving immunity, bone strength, and even mental health due to its high nutritional value. As the demand for functional foods rises, yogurt's role as a versatile, nutrient-dense option positions it at the forefront of health-focused diets. This growing awareness of yogurt’s health benefits has shifted consumer preferences toward products that offer more than just taste, driving a surge in consumption across Europe. The increasing emphasis on health and wellness continues to fuel market growth, as more people incorporate yogurt into their daily routines for its many health advantages.
For instance.
- In April 2022, according to the article published by Healthline, Yogurt provides nearly every essential nutrient the body requires, including high levels of calcium, B vitamins, and trace minerals. These nutrients support bone health, energy metabolism, and overall well-being. As consumers increasingly prioritize health-conscious choices, yogurt's comprehensive nutritional profile drives its popularity. This focus on yogurt’s health benefits is fueling growth and demand in the European yogurt market
- In December 2024, according to the article published by NCBI, Yogurt consumption has been linked to a reduced risk of accelerated aging and may also help lower the such aslihood of overweight status. These potential health benefits make yogurt an attractive choice for consumers focused on longevity and weight management. As health-conscious eating habits continue to rise, yogurt's role in supporting a healthy lifestyle drives its growing demand in the European market
Yogurt's health benefits are a key driver of its growing popularity in Europe, as more consumers recognize its positive impact on overall well-being. Rich in probiotics, calcium, protein, and vitamin D, yogurt supports digestive health, immunity, bone strength, and mental health. With rising demand for functional foods, yogurt’s nutritional value makes it a top choice for health-conscious individuals, fueling a surge in consumption across Europe.
- Innovative Functional Additives in yogurt
Innovative functional additives are playing a significant role in driving the growth of the European yogurt market. As consumer preferences shift towards health-focused products, increasingly incorporating functional ingredients such as probiotics, prebiotics, vitamins, minerals, and even superfoods such as chia seeds and turmeric. These additives not only enhance the nutritional value of yogurt but also target specific health benefits, including improved digestion, enhanced immunity, and increased energy. In response to the rising demand for products that provide more than just basic nourishment, yogurt manufacturers are continuously innovating to introduce new flavors and health-boosting ingredients. This trend towards fortified and functional yogurts caters to a wide range of dietary needs and health goals, attracting health-conscious consumers across Europe. The focus on innovation and adding functional additives has created a competitive edge for brands, further driving the expansion of the yogurt market.
For instance,
- In October 2023, according to the article published by NCBI, Yogurts formulated with natural and modified additives offer several nutraceutical benefits, including enhanced bioactive compounds, antioxidant properties, and antihyperglycemic and antihypertensive effects. These added health benefits align with the growing consumer demand for functional foods. The incorporation of such innovative additives is driving the expansion of the European yogurt market, as consumers increasingly seek products that support their overall health and well-being
- In July 2024, according to the article published by MDPI, the incorporation of prebiotic and probiotic ingredients in yogurt enhances both product quality and consumer health. Probiotics, such as lactic acid bacteria, support gut health and immune system function, while prebiotics nourish beneficial gut bacteria. This synergy creates yogurt with superior functional properties, driving its appeal. As demand for health-boosting foods increases, this innovation is propelling growth in the European yogurt market
Functional additives are driving growth in the European yogurt market as consumer demand for health-oriented products rises. Incorporating ingredients such as probiotics, prebiotics, vitamins, minerals, and superfoods such as chia seeds and turmeric to boost nutritional value and target specific health benefits, such as digestion and immunity. This trend of fortifying yogurts with functional ingredients attracts health-conscious consumers, fostering innovation and competition in the market.
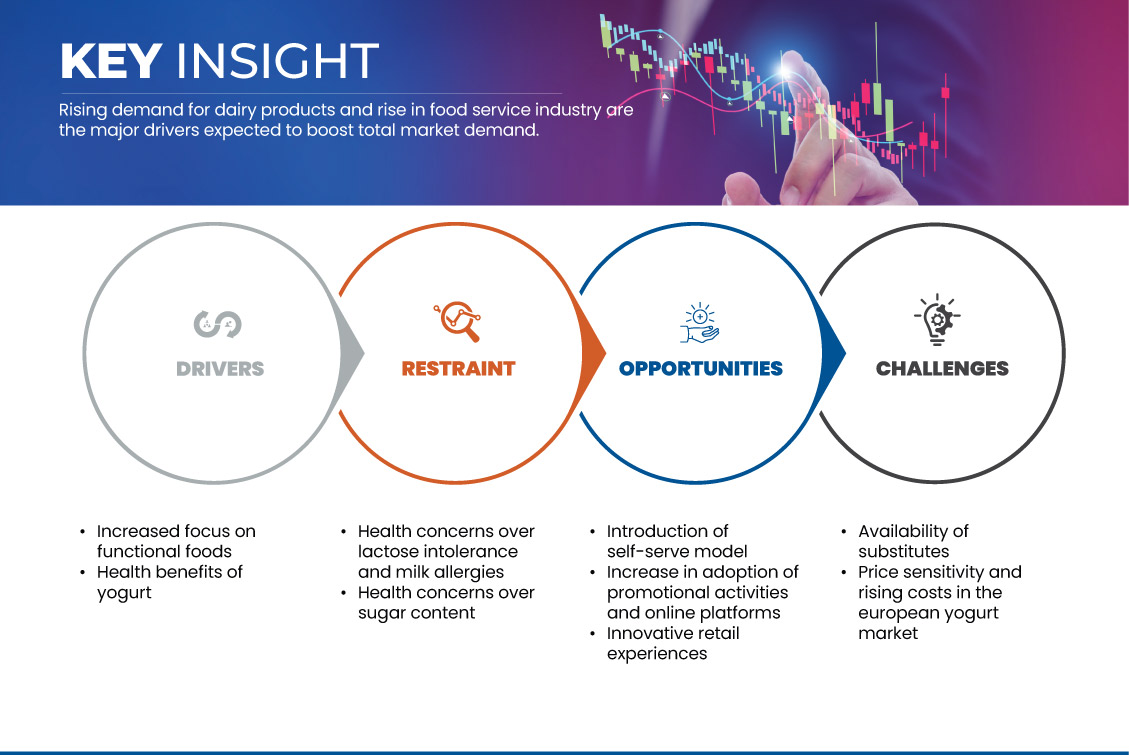
Opportunities
- Introduction of Self-serve Model
The yogurt has high demand in the Europe region because of its health benefits over other desserts such as ice creams, custards, and others. Some yogurt shops are operating to meet the high demand of consumers. These yogurt shops are offering self-serve models which are gaining the attraction of consumers in the market.
Self-serve models give consumers complete autonomy over the flavours, toppings, and quantity of frozen yogurts thereby allowing consumers to choose and control their intake based on their dietary requirements. With self-serve frozen yogurt shops offering a plethora of toppings along with the healthier alternative to ice cream. The number of self-serve stores has increased drastically as compared to the full-service stores.
For instance,
Yogurtini Frozen Yogurt provides 10-16 featured frozen yogurt flavors and more than 65 toppings. They take reviews and suggestions from the customers and add more customization to their menu
A self-serve frozen yogurt shop in the UK, offering multiple yogurt flavors and toppings for customers to create their perfect dessert. FroYo's success is driven by the increasing demand for healthier, customizable dessert options
Thus, the self-serve model in the frozen yogurt market is one of the great opportunities for manufacturers to serve their consumers as per their demand.
- Increase in Adoption of Promotional activities and Online Platforms
The demand for yogurt is increasing very rapidly due to various factors such as the health benefits of yogurts, new exciting flavours, and others. Various companies are operating in the yogurts. These companies are adopting new promotional activities to promote their products in the market which is creating new opportunities for the yogurt manufacturers.
Companies are offering exciting rewards to the consumers which are attracting new customers towards them. For instance, Yogurtland has launched Real Rewards based on “The more treats you enjoy, the more points you earn” i.e. 2 points on every dollar spent. On every purchase, the consumer earns points and after every 100 points, the consumer receives a USD 5 reward automatically. This is how companies are trying to attract new customers through promotional activities.
Apart from this, companies are introducing their online ordering applications to reach a wide range of customers.
For instance,
- In September 2019, Yogurtland partnered with DoorDash to deliver customizable frozen yogurt, ice cream, and Drinkable Creation treats to customers' homes or offices. This collaboration allows froyo enthusiasts to enjoy their favourite flavors and toppings, including sweet, fruity, or gummy options, from participating locations without leaving their location. Thus, the new promotional activities and the digital transformation in the yogurt market is creating new opportunity in the market
- In 2024, Menchie's launched a new partnership with DoorDash in 2024 to deliver frozen yogurt, toppings, and other menu items to customers across multiple locations. The service allows fans to enjoy their favorite frozen yogurt creations without leaving home, supporting Menchie's focus on convenience and customization.
Restraints/Challenges
- Availability of substitutes
Alternative substitutes to yogurts such as Ice creams, yogurts, gelatos, sherbets, non-dairy ice-creams, smoothies, shakes, and others desserts are available in the market. The demand for yogurt is increasing owing to changing lifestyle of people opting for healthier food products. But the higher price of the yogurt has surged customers to move back to the lower cost ice-creams, shakes and other dessert options surging to the sale of the yogurt is being hampered. Furthermore, the yogurt alternative is considered the biggest threat to the yogurt market as it is being still largely consumed by consumers who have milk allergies and lactose intolerance, and vegan consumers.
Additionally, other dessert options such as chocolatiers and candy outlets, local gathering spots such as coffee shops, and even juicing or smoothie chains available are posing a major challenge to the yogurt products.
In December 1, 2024, Ben & Jerry's introduced its variety of exciting new non-dairy ice cream options. These flavors, such as "Caramel Almond Brittle" and "Peanut Butter Cup," cater to the increasing demand for plant-based, dairy-free desserts. As more consumers seek vegan and lactose-free alternatives, these innovative ice cream options directly compete with traditional yogurt products in the dessert market
In January 18, 2024, The New York Times Wirecutter highlighted the growing demand for vegan ice creams. These plant-based alternatives, made from ingredients such as almond milk, coconut milk, and oat milk, are becoming popular among lactose-intolerant and vegan consumers. As a result, they are directly competing with traditional yogurt products in the dessert market
Thus on concluding, the availability of an alternative to the yogurt may pose a major challenge to the growth of the market during the forecast period.
- Price Sensitivity and Rising Costs in the European Yogurt Market
As the demand for premium and specialized yogurts increases, the price of these products has also risen, making them less accessible for some consumers. The higher cost of yogurt, particularly for organic, probiotic, or dairy-free varieties, has caused many consumers to shift towards more affordable alternatives such as ice creams, shakes, smoothies, and other dessert options. This shift is amplified by inflationary pressures and broader economic factors, which are making consumers more conscious of their spending.
Yogurt brands face the challenge of balancing product quality with cost efficiency, striving to keep prices competitive while meeting consumer demand for healthy, high-quality, and functional yogurt options. In response to price sensitivity, many yogurt producers are exploring cost-effective manufacturing methods, introducing lower-cost variants, or offering smaller portions to make their products more affordable for a wider audience.
Additionally, the rise of private-label yogurt brands, which often offer lower prices compared to well-known brands, poses further competition. These private-label options often come with fewer premium features but appeal to cost-conscious consumers who are looking for affordable alternatives. As a result, established yogurt brands are compelled to find ways to innovate without alienating budget-conscious buyers, including offering discounted packs or promotions to maintain customer loyalty.
For instance,
- In August 2024, according to an article published by Dairy Foods, the 2024 State of the Dairy Industry highlights the significant challenges faced by yogurt producers in Europe due to rising costs, inflation, and supply chain disruptions. Similar to the challenges in the Southeast Asia aesthetic services market (as reported by AIA Malaysia), the yogurt industry is experiencing financial barriers that could restrict its growth. The increased production costs are causing price hikes in premium yogurt products, potentially limiting accessibility for a broader consumer base. This financial challenge could deter some consumers from purchasing higher-priced yogurt products, hindering market expansion in the region
- In August 2024, according to an article published by Kerry Group titled "Private Label Growth Trends", the growing popularity of private-label products presents significant challenges for branded yogurt manufacturers in Europe, particularly in a market facing increased competition and price sensitivity. Similar to the challenges in the Southeast Asia aesthetic services market (reported by AIA Malaysia), yogurt brands are facing financial barriers where the rising cost of production and premium products is pushing consumers toward more affordable private-label options. This shift may limit the accessibility and affordability of branded yogurt products, ultimately restricting market growth and making it harder for branded companies to attract price-sensitive consumers
The challenge of price sensitivity and rising costs requires yogurt producers to innovate while maintaining affordability. To stay competitive, brands must find ways to balance premium product offerings with cost-effective strategies, exploring alternatives such as smaller packaging, promotions, and developing value-driven products that meet the needs of both health-conscious and budget-conscious consumers.
Europe Yogurt Market Scope
The market is segmented on the basis of Europe yogurt market is categorized into fifteen notable segments which are based on the yogurt type, product type, fat content, flavor, source type, formulation, inclusion category, fortification, claim, price range, organic category, brand, packaging, packaging size, and distribution channel. The growth amongst these segments will help you analyze meagre growth segments in the industries and provide the users with a valuable market overview and market insights to help them make strategic decisions for identifying core market applications.
Yogurt Type
- Regular Yogurt
- Probiotic Yogurt
- Bio Live Yogurt
- Set Yogurt
- Skyr/ Icelandic-Style Yogurt
- Concentrated Yogurt
- Stirred Yogurt
- Others
Product Type
- Spoonable Yogurt
- Drinkable Yogurt
- Frozen Yogurt
- Others
Fat Content
- Low Fat
- Fat Free
- Full Fat
Flavor
- Plain
- Flavored
- Strawberry
- Vanilla
- Bluberry
- Banana
- Peach
- Bilberry
- Blackberry
- Fruit & Nut
- Lime
- Coconut
- Nuts
- Cherry
- Orchard Cherry
- Honey
- Pumpkin
- Chocolates
- Butterscotch
- Caramel
- Mocha/Coffee
- Pomogranett
- Peppermint
- Amaretto
- Others
Source
- Animal-Based
- Animal-Based, By Type
- Cow Milk
- Buffalo Milk
- Goat Milk
- Others
- Plant-Based
- Plant-Based, By Type
- Almond Milk
- Soy Milk
- Oat Milk
- Coconut Milk
- Cashew Milk
- Others
Formulation
- Sweetened
- Unsweetened
Price Range
- Mass
- Premium
- Luxury
Inclusion Category
- Plain
- With Inclusions & Toppings
- Sprinkles
- Chocolates
- Chunks
- Flakes
- Syrup
- Others
- Nonpareils
- Confetti
- Baked Pieces
- Pearls
- Dragees
- Pecan Pralines
- Caramel Crunchies
- Nuts
- Almonds
- Cashews
- Pistachio
- Hazelnuts
- Raisins
- Madamia Nuts
- Chestnuts
- Others
Fortification
- Regular
- Fortified
Claim
- Regular
- Gluten Free
- Lactose Free
- Artificial Preservatives Free
- Dairy Free
- Soy Free
- Non-Gmo
- Sugar Free
- Calorie Free
- With All Of The Above Claim
- Regular With No Claims
- Others
Organic Category
- Conventional
- Organic
Brand
- Branded
- Private Label
Packaging
- Bag-In-Box
- Pouches
- Jars
- Glass
- Plastic
- Cups
- Bottles
- Glass
- Plastic
- Tetra Packs
- Others
Packaging Size
- Less Than 100 Grams
- 100-200 Grams
- 201-300 Grams
- More Than 300 Grams
Distribution Channel
- Store-Based Retailing
- Convenience Stores
- Yogurt Shops/Parlors
- Supermarkets/Hypermarkets
- Specialty Stores
- Grocery Stores
- Wholesalers
- Others
- Non-Store Retailing
- Vending
- Online
Europe Yogurt Market Regional Analysis
The market is analyzed and market size insights and trends are provided by country, yogurt type, product type, fat content, flavor, source type, formulation, inclusion category, fortification, claim, price range, organic category, brand, packaging, packaging size, and distribution channel as referenced above.
The countries covered in the market are Germany, France, U.K., Italy, Spain, Russia, Netherlands, Belgium, Switzerland, Turkey, and rest of Europe.
Germany is expected to dominate the market due to its strong dairy industry, high demand for both traditional and plant-based cream products, robust food processing sector.
Germany is expected to be the fastest growing due to its strong dairy industry, high demand for both traditional and plant-based cream products, robust food processing sector, and consumer preference for high-quality dairy ingredients, along with its central role in the European foodservice and retail markets.
The country section of the report also provides individual market impacting factors and changes in regulation in the market domestically that impacts the current and future trends of the market. Data points such as down-stream and upstream value chain analysis, technical trends and porter's five forces analysis, case studies are some of the pointers used to forecast the market scenario for individual countries. Also, the presence and availability of global brands and their challenges faced due to large or scarce competition from local and domestic brands, impact of domestic tariffs and trade routes are considered while providing forecast analysis of the country data.
Europe Yogurt Market Share
The market competitive landscape provides details by competitor. Details included are company overview, company financials, revenue generated, market potential, investment in research and development, new market initiatives, global presence, production sites and facilities, production capacities, company strengths and weaknesses, product launch, product width and breadth, application dominance. The above data points provided are only related to the companies' focus related to market.
Europe Yogurt Market Leaders Operating in the Market Are:
- Danone (France)
- Nestlé (Switzerland)
- EMMY UK LTD (London)
- Müller UK & Ireland (England)
- FrieslandCampina (Netherlands)
- THE CAMPBELL’S COMPANY (U.S.)
- Arla Foods Amba (Denmark)
- SCHREIBER FOOD INC (U.S.)
- Sodiaal (France)
- CREMO SA (Switzerland)
- Fen Farm Dairy (U.K.)
- LACTEAS FLOR DE BURGOS S.L. (Spain)
- LATTE MAREMMA (Italy)
- Newlat Food S.p.A (Italy)
- The Hain Celestial Group, Inc. (New York)
- Yeo Valley Organic Limited (U.K.)
Latest Developments in Europe Yogurt Market
- In May 2021, Onken, in collaboration with Marvin Humes, launched the "Legen-Dairy Family Recipes" campaign. This exciting initiative seeks to uncover the UK's most legendary family recipes by inviting people to share their culinary treasures or create new ones. Celebrated TV presenter and radio host Marvin Humes is spearheading this campaign to promote Family Recipe Day
- In November 2024, Arla Foods Ingredients has received approval from the UK’s Competition and Markets Authority for its acquisition of Volac’s Whey Nutrition business. The deal includes a processing facility in Felinfach, Wales, and will strengthen Arla’s position in the growing whey protein market
- In September 2023, Nestlé has reached an agreement with Advent International to acquire a majority stake in Grupo CRM, a premium Brazilian chocolate company. The deal, expected to close in 2024, strengthens Nestlé’s presence in Brazil’s high-end confectionery market
- In November 2022, Nestlé and L Catterton have announced a partnership to combine Freshly and Kettle Cuisine, a leading fresh artisanal food manufacturer. The new company will offer a diverse range of fresh food products across various channels and geographies, with L Catterton as the majority owner
SKU-

- Interactive Data Analysis Dashboard
- Company Analysis Dashboard for high growth potential opportunities
- Research Analyst Access for customization & queries
- Competitor Analysis with Interactive dashboard
- Latest News, Updates & Trend analysis
- Harness the Power of Benchmark Analysis for Comprehensive Competitor Tracking
Table of Content
1 INTRODUCTION
1.1 OBJECTIVES OF THE STUDY
1.2 MARKET DEFINITION
1.3 OVERVIEW OF THE EUROPE YOGURT MARKET
1.4 LIMITATIONS
1.5 MARKETS COVERED
2 MARKET SEGMENTATION
2.1 GEOGRAPHICAL SCOPE
2.2 YEARS CONSIDERED FOR THE STUDY
2.3 CURRENCY AND PRICING
2.4 DBMR TRIPOD DATA VALIDATION MODEL
2.5 MULTIVARIATE MODELLING
2.6 TREATMENT LIFELINE CURVE
2.7 PRIMARY INTERVIEWS WITH KEY OPINION LEADERS
2.8 DBMR MARKET POSITION GRID
2.9 MARKET APPLICATION COVERAGE GRID
2.1 VENDOR SHARE ANALYSIS
2.11 SECONDARY SOURCES
2.12 ASSUMPTIONS
3 EXECUTIVE SUMMARY
4 PREMIUM INSIGHTS
4.1 BRAND OUTLOOK
4.2 ENVIRONMENTAL CONCERNS
4.2.1 INDUSTRY RESPONSE TO CLIMATE CHANGE
4.2.2 GOVERNMENT’S ROLE IN ADDRESSING CLIMATE CHANGE
4.2.3 ANALYST RECOMMENDATIONS
4.3 MARKETING STRATEGIES ADOPTED BY KEY MARKET PLAYER IN EUROPE YOGURT MARKET
4.3.1 FEN FARM DAIRY
4.3.2 LATTE MAREMMA
4.3.3 NESTLÉ SA
4.3.4 ARLA FOODS AMBA
4.3.5 CAMPBELL SOUP COMPANY
4.3.6 HAIN CELESTIAL GROUP
4.3.7 DIETARY PREFERENCES AND RESTRICTIONS
4.3.8 MARKETING AND ADVERTISING
4.3.9 CONCLUSION
4.4 MARKETING STRATEGIES ADOPTED BY KEY MARKET IN EUROPE YOGURT MARKET
4.4.1 IMPACT ON PRICE
4.4.2 IMPACT ON SUPPLY CHAIN
4.4.3 IMPACT ON SHIPMENT
4.4.4 IMPACT ON COMPANY’S STRATEGIC DECISIONS
4.4.5 CONCLUSION
4.5 IMPORT EXPORT SCENARIO
4.6 MARKETING STRATEGIES ADOPTED BY KEY MARKET PLAYER IN EUROPE YOGURT MARKET
4.6.1 FEN FARM DAIRY
4.6.2 LATTE MAREMMA
4.6.3 NESTLÉ SA
4.6.4 ARLA FOODS AMBA
4.6.5 CAMPBELL SOUP COMPANY
4.6.6 HAIN CELESTIAL GROUP
4.6.7 EMMI UK LTD (ONKEN)
4.6.8 SCHREIBER FOODS
4.6.9 SCHREIBER FOODS
4.6.10 FLOR DE BURGOS
4.6.11 NEWLAT FOOD S.P.A
4.6.12 CONCLUSION
4.7 NEW PRODUCT LAUNCH STRATEGY FOR THE EUROPE YOGURT MARKET
4.7.1 NUMBER OF NEW PRODUCT LAUNCH
4.7.2 DIFFERENTIAL PRODUCT OFFERING
4.7.3 MEETING CONSUMER REQUIREMENTS
4.7.4 PACKAGE DESIGNING
4.7.5 PRICING ANALYSIS
4.7.6 PRODUCT POSITIONING
4.7.7 CONCLUSION
4.8 PRICING ANALYSIS
4.9 PRIVATE LABEL VS BRAND ANAYSIS
4.1 PRODUCTION CAPACITY OF KEY MANUFACTURERS
4.11 PROMOTIONAL ACTIVITIES IN THE EUROPEAN YOGURT MARKET
4.11.1 DIGITAL MARKETING AND SOCIAL MEDIA CAMPAIGNS
4.11.2 CONTENT MARKETING AND EDUCATIONAL INITIATIVES
4.11.3 PRODUCT SAMPLING AND FREE TRIALS
4.11.4 DISCOUNTS, PROMOTIONS, AND LOYALTY PROGRAMS
4.11.5 STRATEGIC PARTNERSHIPS AND SPONSORSHIPS
4.11.6 CELEBRITY ENDORSEMENTS AND MEDIA EXPOSURE
4.11.7 RETAIL AND IN-STORE PROMOTIONS
4.11.8 CONCLUSION
4.12 REGULATION COVERAGE
4.13 SHOPPING BEHAVIOUR AND DYNAMICS
4.13.1 RECOMMENDATION FROM FAMILY & FRIENDS
4.13.2 RESEARCH
4.13.3 IMPULSIVE
4.13.4 ADVERTISEMENT
4.13.4.1 TELEVISION ADVERTISEMENT
4.13.4.2 ONLINE ADVERTISEMENT
4.13.4.3 IN-STORE ADVERTISEMENT
4.13.4.4 OUTDOOR ADVERTISEMENT
4.14 SUPPLY CHAIN ANALYSIS
4.14.1 OVERVIEW
4.14.2 LOGISTIC COST SCENARIO
4.14.3 IMPORTANCE OF LOGISTICS SERVICE PROVIDERS
5 EUROPE YOGURT MARKET: REGULATIONS
5.1 REGULATORY BODIES
5.2 REGULATIONS
5.3 CONCLUSION
6 MARKET OVERVIEW
6.1 DRIVERS
6.1.1 INCREASED FOCUS ON FUNCTIONAL FOODS
6.1.2 HEALTH BENEFITS OF YOGURT
6.1.3 INNOVATIVE FUNCTIONAL ADDITIVES IN YOGURT
6.1.4 TECHNICAL ADVANCEMENT IN PROCESSING OF YOGURT
6.2 RESTRAINTS
6.2.1 HEALTH CONCERNS OVER LACTOSE INTOLERANCE AND MILK ALLERGIES
6.2.2 HEALTH CONCERNS OVER SUGAR CONTENT
6.3 OPPORTUNITIES
6.3.1 INTRODUCTION OF SELF-SERVE MODEL
6.3.2 INCREASE IN ADOPTION OF PROMOTIONAL ACTIVITIES AND ONLINE PLATFORMS
6.3.3 INNOVATIVE RETAIL EXPERIENCES
6.4 CHALLENGES
6.4.1 AVAILABILITY OF SUBSTITUTES
6.4.2 PRICE SENSITIVITY AND RISING COSTS IN THE EUROPEAN YOGURT MARKET
7 EUROPE YOGURT MARKET, BY PRODUCT TYPE
7.1 OVERVIEW
7.2 SPOONABLE YOGURT
7.3 DRINKABLE YOGURT
7.4 FROZEN YOGURT
7.5 OTHERS
8 EUROPE YOGURT MARKET, BY FORMULATION
8.1 OVERVIEW
8.2 UNSWEETENED
8.3 SWEETENED
9 EUROPE YOGURT MARKET, BY INCLUSION CATEGORY
9.1 OVERVIEW
9.2 PLAIN
9.3 WITH INCLUSIONS & TOPPINGS
9.3.1 NUTS
9.3.1.1 ALMONDS
9.3.1.2 CASHEWS
9.3.1.3 PISTACHIO
9.3.1.4 HAZELNUTS
9.3.1.5 RAISINS
9.3.1.6 MADAMIA NUTS
9.3.1.7 CHESTNUTS
9.3.1.8 OTHERS
9.3.2 SPRINKLES
9.3.3 CHOCOLATES
9.3.3.1 CHUNKS
9.3.3.2 SYRUP
9.3.3.3 FLAKES
9.3.3.4 OTHERS
9.3.4 CONFETTI
9.3.5 NONPAREILS
9.3.6 BAKED PIECES
9.3.7 PEARLS
9.3.8 DRAGEES
9.3.9 PECAN PRALINES
9.3.10 CARAMEL CRUNCHIES
9.3.11 OTHERS
10 EUROPE YOGURT MARKET, BY SOURCE
10.1 OVERVIEW
10.2 ANIMAL-BASED
10.2.1 COW MILK
10.2.2 BUFFALO MILK
10.2.3 GOAT MILK
10.2.4 OTHERS
10.3 PLANT-BASED
10.3.1 ALMOND MILK
10.3.2 SOY MILK
10.3.3 OAT MILK
10.3.4 COCONUT MILK
10.3.5 CASHEW MILK
10.3.6 OTHERS
10.4 ARTIFICIAL
11 EUROPE YOGURT MARKET, BY FLAVOR
11.1 OVERVIEW
11.2 PLAIN
11.3 FLAVORED
11.3.1 STRAWBERRY
11.3.2 VANILLA
11.3.3 BLUBERRY
11.3.4 BANANA
11.3.5 PEACH
11.3.6 BILBERRY
11.3.7 BLACKBERRY
11.3.8 FRUIT & NUT
11.3.9 LIME
11.3.10 COCONUT
11.3.11 NUTS
11.3.12 CHERRY
11.3.13 ORCHARD CHERRY
11.3.14 HONEY
11.3.15 PUMPKIN
11.3.16 CHOCOLATES
11.3.17 BUTTERSCOTCH
11.3.18 CARAMEL
11.3.19 MOCHA/COFFEE
11.3.20 POMOGRANETT
11.3.21 PEPPERMINT
11.3.22 AMARETTO
11.3.23 OTHERS
12 EUROPE YOGURT MARKET, BY FAT CONTENT
12.1 OVERVIEW
12.2 LOW FAT
12.3 FAT FREE
12.4 FULL FAT
13 EUROPE YOGURT MARKET, BY FORTIFICATION
13.1 OVERVIEW
13.2 REGULAR
13.3 FORTIFIED
14 EUROPE YOGURT MARKET, BY ORGANIC CATEGORY
14.1 OVERVIEW
14.2 CONVENTIONAL
14.3 ORGANIC
15 EUROPE YOGURT MARKET, BY DISTRIBUTION CHANNEL
15.1 OVERVIEW
15.2 STORE-BASED RETAILING
15.2.1 SUPERMARKETS/HYPERMARKETS
15.2.2 YOGURT SHOPS/PARLORS
15.2.3 CONVENIENCE STORES
15.2.4 GROCERY STORES
15.2.5 SPECIALTY STORES
15.2.6 WHOLESALERS
15.2.7 OTHERS
15.3 NON-STORE RETAILING
15.3.1 ONLINE
15.3.2 VENDING
16 EUROPE YOGURT MARKET, BY PACKAGING SIZE
16.1 OVERVIEW
16.2 201-300 GRAMS
16.3 MORE THAN 300 GRAMS
16.4 100-200 GRAMS
16.5 LESS THAN 100 GRAMS
17 EUROPE YOGURT MARKET, BY CLAIM
17.1 OVERVIEW
17.2 SUGAR FREE
17.3 DAIRY FREE
17.4 LACTOSE FREE
17.5 SOY FREE
17.6 GLUTEN FREE
17.7 NON GMO
17.8 CALORIE FREE
17.9 ARTIFICIAL PRESERVATIVES FREE
17.1 WITH ALL OF THE ABOVE CLAIM
17.11 REGULAR WITH NO CLAIMS
17.12 OTHERS
18 EUROPE YOGURT MARKET, BY BRAND
18.1 OVERVIEW
18.2 BRANDED
18.3 PRIVATE LABEL
19 EUROPE YOGURT MARKET, BY PRICE RANGE
19.1 OVERVIEW
19.2 MASS
19.3 PREMIUM
19.4 LUXURY
20 EUROPE YOGURT MARKET, BY PACKAGING TYPE
20.1 OVERVIEW
20.2 JARS
20.2.1 PLASTIC
20.2.2 GLASS
20.3 BOTTLES
20.3.1 PLASTIC
20.3.2 GLASS
20.4 TETRA PACK
20.5 CUPS
20.6 BAG-IN-BOX
20.7 POUCHES
20.8 OTHERS
21 EUROPE YOGURT MARKET, BY COUNTRY
21.1 EUROPE
21.1.1 GERMANY
21.1.2 FRANCE
21.1.3 SPAIN
21.1.4 POLAND
21.1.5 BELGIUM
21.1.6 NETHERLANDS
21.1.7 ITALY
21.1.8 AUSTRIA
21.1.9 SWEDEN
21.1.10 DENMARK
21.1.11 UNITED KINGDOM
21.1.12 PORTUGAL
21.1.13 SWITZERLAND
21.1.14 IRELAND
21.1.15 FINLAND
21.1.16 LUXEMBOURG
21.1.17 REST OF EUROPE
22 EUROPE YOGURT MARKET, COMPANY LANDSCAPE
22.1 COMPANY SHARE ANALYSIS: EUROPE
23 SWOT ANALYSIS
24 COMPANY PROFILES
24.1 DANONE
24.1.1 COMPANY SNAPSHOT
24.1.2 REVENUE ANALYSIS:
24.1.3 PRODUCT PORTFOLIO
24.1.4 RECENT DEVELOPMENT
24.2 NESTLÉ
24.2.1 COMPANY SNAPSHOT
24.2.2 REVENUE ANALYSIS
24.2.3 PRODUCT PORTFOLIO
24.2.4 RECENT DEVELOPMENT
24.3 EMMY UK LTD
24.3.1 COMPANY SNAPSHOT
24.3.2 PRODUCT PORTFOLIO
24.3.3 RECENT DEVELOPMENT
24.4 MÜLLER UK & IRELAND (SUBSIDIARY OF UNTERNEHMENSGRUPPE THEO MÜLLER)
24.4.1 COMPANY SNAPSHOT
24.4.2 PRODUCT PORTFOLIO
24.4.3 RECENT DEVELOPMENT
24.5 FRIESLAND CAMPINA
24.5.1 COMPANY SNAPSHOT
24.5.2 PRODUCT PORTFOLIO
24.5.3 RECENT DEVELOPMENT
24.6 THE CAMPBELL’S COMPANY
24.6.1 COMPANY SNAPSHOT
24.6.2 PRODUCT PORTFOLIO
24.6.3 RECENT DEVELOPMENT
24.7 ARLA FOODS AMBA
24.7.1 COMPANY SNAPSHOT
24.7.2 REVENUE ANALYSIS
24.7.3 PRODUCT PORTFOLIO
24.7.4 RECENT DEVELOPMENT
24.8 SCHREIBER FOOD INC
24.8.1 COMPANY SNAPSHOT
24.8.2 PRODUCT PORTFOLIO
24.8.3 RECENT DEVELOPMENT
24.9 SODIAAL
24.9.1 COMPANY SNAPSHOT
24.9.2 PRODUCT PORTFOLIO
24.9.3 RECENT DEVELOPMENT
24.1 CREMO SA
24.10.1 COMPANY SNAPSHOT
24.10.2 PRODUCT PORTFOLIO
24.11 FEN FARM DAIRY
24.11.1 COMPANY SNAPSHOT
24.11.2 PRODUCT PORTFOLIO
24.11.3 RECENT DEVELOPMENT
24.12 LACTEAS FLOR DE BURGOS
24.12.1 COMPANY SNAPSHOT
24.12.2 PRODUCT PORTFOLIO
24.12.3 RECENT DEVELOPMENT
24.13 LATTE MAREMMA
24.13.1 COMPANY SNAPSHOT
24.13.2 PRODUCT PORTFOLIO
24.13.3 RECENT DEVELOPMENT
24.14 NEWLAT FOOD S.P.A
24.14.1 COMPANY SNAPSHOT
24.14.2 REVENUE ANALYSIS
24.14.3 SEGMENTED REVENUE ANALYSIS
24.14.4 PRODUCT PORTFOLIO
24.15 THE HAIN CELESTIAL GROUP, INC.
24.15.1 COMPANY SNAPSHOT
24.15.2 REVENUE ANALYSIS
24.15.3 SEGMENTED REVENUE ANALYSIS
24.15.4 PRODUCT PORTFOLIO
24.15.5 RECENT DEVELOPMENT
24.16 YEO VALLEY ORGANIC LIMITED
24.16.1 COMPANY SNAPSHOT
24.16.2 PRODUCT PORTFOLIO
24.16.3 RECENT DEVELOPMENT
25 QUESTIONNAIRE
26 RELATED REPORTS
List of Table
TABLE 1 PRODUCTION CAPACITY OF KEY MANUFACTURERS
TABLE 2 REGULATIONS ACROSS VARIOUS REGIONS AND COUNTRIES
TABLE 3 EUROPE YOGURT MARKET, BY PRODUCT TYPE, 2018-2032 (USD MILLION)
TABLE 4 EUROPE YOGURT MARKET, BY FORMULATION, 2018-2032 (USD MILLION)
TABLE 5 EUROPE YOGURT MARKET, BY INCLUSION CATEGORY, 2018-2032 (USD MILLION)
TABLE 6 EUROPE WITH INCLUSIONS & TOPPINGS IN YOGURT MARKET, BY INCLUSION CATEGORY, 2018-2032 (USD MILLION)
TABLE 7 EUROPE NUTS IN YOGURT MARKET, BY INCLUSION CATEGORY, 2018-2032 (USD MILLION)
TABLE 8 EUROPE CHOCOLATES IN YOGURT MARKET, BY INCLUSION CATEGORY, 2018-2032 (USD MILLION)
TABLE 9 EUROPE YOGURT MARKET, BY SOURCE, 2018-2032 (USD MILLION)
TABLE 10 EUROPE ANIMAL-BASED IN YOGURT MARKET, BY SOURCE, 2018-2032 (USD MILLION)
TABLE 11 EUROPE PLANT-BASED IN YOGURT MARKET, BY SOURCE, 2018-2032 (USD MILLION)
TABLE 12 EUROPE YOGURT MARKET, BY FLAVOR, 2018-2032 (USD MILLION)
TABLE 13 EUROPE FLAVORED IN YOGURT MARKET, BY FLAVOR, 2018-2032 (USD MILLION)
TABLE 14 EUROPE YOGURT MARKET, BY FAT CONTENT, 2018-2032 (USD MILLION)
TABLE 15 EUROPE YOGURT MARKET, BY FORTIFICATION, 2018-2032 (USD MILLION)
TABLE 16 EUROPE YOGURT MARKET, BY ORGANIC CATEGORY, 2018-2032 (USD MILLION)
TABLE 17 EUROPE YOGURT MARKET, BY DISTRIBUTION CHANNEL, 2018-2032 (USD MILLION)
TABLE 18 EUROPE STORE-BASED RETAILING IN YOGURT MARKET, BY DISTRIBUTION CHANNEL, 2018-2032 (USD MILLION)
TABLE 19 EUROPE NON-STORE RETAILING IN YOGURT MARKET, BY DISTRIBUTION CHANNEL, 2018-2032 (USD MILLION)
TABLE 20 EUROPE YOGURT MARKET, BY PACKAGING SIZE, 2018-2032 (USD MILLION)
TABLE 21 EUROPE YOGURT MARKET, BY CLAIM, 2018-2032 (USD MILLION)
TABLE 22 EUROPE YOGURT MARKET, BY BRAND, 2018-2032 (USD MILLION)
TABLE 23 EUROPE YOGURT MARKET, BY PRICE RANGE, 2018-2032 (USD MILLION)
TABLE 24 EUROPE YOGURT MARKET, BY PACKAGING TYPE, 2018-2032 (USD MILLION)
TABLE 25 EUROPE JARS IN YOGURT MARKET, BY PACKAGING TYPE, 2018-2032 (USD MILLION)
TABLE 26 EUROPE BOTTLES IN YOGURT MARKET, BY PACKAGING TYPE, 2018-2032 (USD MILLION)
TABLE 27 EUROPE YOGURT MARKET, BY COUNTRY, 2018-2032 (USD MILLION)
TABLE 28 EUROPE YOGURT MARKET, BY COUNTRY, 2018-2032 (KILO TONS)
TABLE 29 GERMANY YOGURT MARKET, BY YOGURT TYPE, 2018-2032 (USD MILLION)
TABLE 30 GERMANY YOGURT MARKET, BY YOGURT TYPE, 2018-2032 (KILO TONS)
TABLE 31 GERMANY YOGURT MARKET, BY PRODUCT TYPE, 2018-2032 (USD MILLION)
TABLE 32 GERMANY YOGURT MARKET, BY FAT CONTENT, 2018-2032 (USD MILLION)
TABLE 33 GERMANY YOGURT MARKET, BY FLAVOR, 2018-2032 (USD MILLION)
TABLE 34 GERMANY FLAVORED IN YOGURT MARKET, BY FLAVOR, 2018-2032 (USD MILLION)
TABLE 35 GERMANY YOGURT MARKET, BY SOURCE, 2018-2032 (USD MILLION)
TABLE 36 GERMANY ANIMAL-BASED IN YOGURT MARKET, BY SOURCE, 2018-2032 (USD MILLION)
TABLE 37 GERMANY PLANT-BASED IN YOGURT MARKET, BY SOURCE, 2018-2032 (USD MILLION)
TABLE 38 GERMANY YOGURT MARKET, BY FORMULATION, 2018-2032 (USD MILLION)
TABLE 39 GERMANY YOGURT MARKET, BY INCLUSION CATEGORY, 2018-2032 (USD MILLION)
TABLE 40 GERMANY WITH INCLUSIONS & TOPPINGS IN YOGURT MARKET, BY INCLUSION CATEGORY, 2018-2032 (USD MILLION)
TABLE 41 GERMANY NUTS IN YOGURT MARKET, BY INCLUSION CATEGORY, 2018-2032 (USD MILLION)
TABLE 42 GERMANY CHOCOLATES IN YOGURT MARKET, BY INCLUSION CATEGORY, 2018-2032 (USD MILLION)
TABLE 43 GERMANY YOGURT MARKET, BY FORTIFICATION, 2018-2032 (USD MILLION)
TABLE 44 GERMANY YOGURT MARKET, BY ORGANIC CATEGORY, 2018-2032 (USD MILLION)
TABLE 45 GERMANY YOGURT MARKET, BY BRAND, 2018-2032 (USD MILLION)
TABLE 46 GERMANY YOGURT MARKET, BY PRICE RANGE, 2018-2032 (USD MILLION)
TABLE 47 GERMANY YOGURT MARKET, BY PACKAGING TYPE, 2018-2032 (USD MILLION)
TABLE 48 GERMANY JARS IN YOGURT MARKET, BY PACKAGING TYPE, 2018-2032 (USD MILLION)
TABLE 49 GERMANY BOTTLES IN YOGURT MARKET, BY PACKAGING TYPE, 2018-2032 (USD MILLION)
TABLE 50 GERMANY YOGURT MARKET, BY PACKAGING SIZE, 2018-2032 (USD MILLION)
TABLE 51 GERMANY YOGURT MARKET, BY CLAIM, 2018-2032 (USD MILLION)
TABLE 52 GERMANY YOGURT MARKET, BY DISTRIBUTION CHANNEL, 2018-2032 (USD MILLION)
TABLE 53 GERMANY STORE-BASED RETAILING IN YOGURT MARKET, BY DISTRIBUTION CHANNEL, 2018-2032 (USD MILLION)
TABLE 54 GERMANY NON-STORE RETAILING IN YOGURT MARKET, BY DISTRIBUTION CHANNEL,2018-2032 (USD MILLION)
TABLE 55 FRANCE YOGURT MARKET, BY YOGURT TYPE, 2018-2032 (USD MILLION)
TABLE 56 FRANCE YOGURT MARKET, BY YOGURT TYPE, 2018-2032 (KILO TONS)
TABLE 57 FRANCE YOGURT MARKET, BY PRODUCT TYPE, 2018-2032 (USD MILLION)
TABLE 58 FRANCE YOGURT MARKET, BY FAT CONTENT, 2018-2032 (USD MILLION)
TABLE 59 FRANCE YOGURT MARKET, BY FLAVOR, 2018-2032 (USD MILLION)
TABLE 60 FRANCE FLAVORED IN YOGURT MARKET, BY FLAVOR, 2018-2032 (USD MILLION)
TABLE 61 FRANCE YOGURT MARKET, BY SOURCE, 2018-2032 (USD MILLION)
TABLE 62 FRANCE ANIMAL-BASED IN YOGURT MARKET, BY SOURCE, 2018-2032 (USD MILLION)
TABLE 63 FRANCE PLANT-BASED IN YOGURT MARKET, BY SOURCE, 2018-2032 (USD MILLION)
TABLE 64 FRANCE YOGURT MARKET, BY FORMULATION, 2018-2032 (USD MILLION)
TABLE 65 FRANCE YOGURT MARKET, BY INCLUSION CATEGORY, 2018-2032 (USD MILLION)
TABLE 66 FRANCE WITH INCLUSIONS & TOPPINGS IN YOGURT MARKET, BY INCLUSION CATEGORY, 2018-2032 (USD MILLION)
TABLE 67 FRANCE NUTS IN YOGURT MARKET, BY INCLUSION CATEGORY, 2018-2032 (USD MILLION)
TABLE 68 FRANCE CHOCOLATES IN YOGURT MARKET, BY INCLUSION CATEGORY, 2018-2032 (USD MILLION)
TABLE 69 FRANCE YOGURT MARKET, BY FORTIFICATION, 2018-2032 (USD MILLION)
TABLE 70 FRANCE YOGURT MARKET, BY ORGANIC CATEGORY, 2018-2032 (USD MILLION)
TABLE 71 FRANCE YOGURT MARKET, BY BRAND, 2018-2032 (USD MILLION)
TABLE 72 FRANCE YOGURT MARKET, BY PRICE RANGE, 2018-2032 (USD MILLION)
TABLE 73 FRANCE YOGURT MARKET, BY PACKAGING TYPE, 2018-2032 (USD MILLION)
TABLE 74 FRANCE JARS IN YOGURT MARKET, BY PACKAGING TYPE, 2018-2032 (USD MILLION)
TABLE 75 FRANCE BOTTLES IN YOGURT MARKET, BY PACKAGING TYPE, 2018-2032 (USD MILLION)
TABLE 76 FRANCE YOGURT MARKET, BY PACKAGING SIZE, 2018-2032 (USD MILLION)
TABLE 77 FRANCE YOGURT MARKET, BY CLAIM, 2018-2032 (USD MILLION)
TABLE 78 FRANCE YOGURT MARKET, BY DISTRIBUTION CHANNEL, 2018-2032 (USD MILLION)
TABLE 79 FRANCE STORE-BASED RETAILING IN YOGURT MARKET, BY DISTRIBUTION CHANNEL, 2018-2032 (USD MILLION)
TABLE 80 FRANCE NON-STORE RETAILING IN YOGURT MARKET, BY DISTRIBUTION CHANNEL,2018-2032 (USD MILLION)
TABLE 81 SPAIN YOGURT MARKET, BY YOGURT TYPE, 2018-2032 (USD MILLION)
TABLE 82 SPAIN YOGURT MARKET, BY YOGURT TYPE, 2018-2032 (KILO TONS)
TABLE 83 SPAIN YOGURT MARKET, BY PRODUCT TYPE, 2018-2032 (USD MILLION)
TABLE 84 SPAIN YOGURT MARKET, BY FAT CONTENT, 2018-2032 (USD MILLION)
TABLE 85 SPAIN YOGURT MARKET, BY FLAVOR, 2018-2032 (USD MILLION)
TABLE 86 SPAIN FLAVORED IN YOGURT MARKET, BY FLAVOR, 2018-2032 (USD MILLION)
TABLE 87 SPAIN YOGURT MARKET, BY SOURCE, 2018-2032 (USD MILLION)
TABLE 88 SPAIN ANIMAL-BASED IN YOGURT MARKET, BY SOURCE, 2018-2032 (USD MILLION)
TABLE 89 SPAIN PLANT-BASED IN YOGURT MARKET, BY SOURCE, 2018-2032 (USD MILLION)
TABLE 90 SPAIN YOGURT MARKET, BY FORMULATION, 2018-2032 (USD MILLION)
TABLE 91 SPAIN YOGURT MARKET, BY INCLUSION CATEGORY, 2018-2032 (USD MILLION)
TABLE 92 SPAIN WITH INCLUSIONS & TOPPINGS IN YOGURT MARKET, BY INCLUSION CATEGORY, 2018-2032 (USD MILLION)
TABLE 93 SPAIN NUTS IN YOGURT MARKET, BY INCLUSION CATEGORY, 2018-2032 (USD MILLION)
TABLE 94 SPAIN CHOCOLATES IN YOGURT MARKET, BY INCLUSION CATEGORY, 2018-2032 (USD MILLION)
TABLE 95 SPAIN YOGURT MARKET, BY FORTIFICATION, 2018-2032 (USD MILLION)
TABLE 96 SPAIN YOGURT MARKET, BY ORGANIC CATEGORY, 2018-2032 (USD MILLION)
TABLE 97 SPAIN YOGURT MARKET, BY BRAND, 2018-2032 (USD MILLION)
TABLE 98 SPAIN YOGURT MARKET, BY PACKAGING TYPE, 2018-2032 (USD MILLION)
TABLE 99 SPAIN JARS IN YOGURT MARKET, BY PACKAGING TYPE, 2018-2032 (USD MILLION)
TABLE 100 SPAIN BOTTLES IN YOGURT MARKET, BY PACKAGING TYPE, 2018-2032 (USD MILLION)
TABLE 101 SPAIN YOGURT MARKET, BY PACKAGING SIZE, 2018-2032 (USD MILLION)
TABLE 102 SPAIN YOGURT MARKET, BY CLAIM, 2018-2032 (USD MILLION)
TABLE 103 SPAIN YOGURT MARKET, BY DISTRIBUTION CHANNEL, 2018-2032 (USD MILLION)
TABLE 104 SPAIN STORE-BASED RETAILING IN YOGURT MARKET, BY DISTRIBUTION CHANNEL, 2018-2032 (USD MILLION)
TABLE 105 SPAIN NON-STORE RETAILING IN YOGURT MARKET, BY DISTRIBUTION CHANNEL,2018-2032 (USD MILLION)
TABLE 106 POLAND YOGURT MARKET, BY YOGURT TYPE, 2018-2032 (USD MILLION)
TABLE 107 POLAND YOGURT MARKET, BY YOGURT TYPE, 2018-2032 (KILO TONS)
TABLE 108 POLAND YOGURT MARKET, BY PRODUCT TYPE, 2018-2032 (USD MILLION)
TABLE 109 POLAND YOGURT MARKET, BY FAT CONTENT, 2018-2032 (USD MILLION)
TABLE 110 POLAND YOGURT MARKET, BY FLAVOR, 2018-2032 (USD MILLION)
TABLE 111 POLAND FLAVORED IN YOGURT MARKET, BY FLAVOR, 2018-2032 (USD MILLION)
TABLE 112 POLAND YOGURT MARKET, BY SOURCE, 2018-2032 (USD MILLION)
TABLE 113 POLAND ANIMAL-BASED IN YOGURT MARKET, BY SOURCE, 2018-2032 (USD MILLION)
TABLE 114 POLAND PLANT-BASED IN YOGURT MARKET, BY SOURCE, 2018-2032 (USD MILLION)
TABLE 115 POLAND YOGURT MARKET, BY FORMULATION, 2018-2032 (USD MILLION)
TABLE 116 POLAND YOGURT MARKET, BY INCLUSION CATEGORY, 2018-2032 (USD MILLION)
TABLE 117 POLAND WITH INCLUSIONS & TOPPINGS IN YOGURT MARKET, BY INCLUSION CATEGORY, 2018-2032 (USD MILLION)
TABLE 118 POLAND NUTS IN YOGURT MARKET, BY INCLUSION CATEGORY, 2018-2032 (USD MILLION)
TABLE 119 POLAND CHOCOLATES IN YOGURT MARKET, BY INCLUSION CATEGORY, 2018-2032 (USD MILLION)
TABLE 120 POLAND YOGURT MARKET, BY FORTIFICATION, 2018-2032 (USD MILLION)
TABLE 121 POLAND YOGURT MARKET, BY ORGANIC CATEGORY, 2018-2032 (USD MILLION)
TABLE 122 POLAND YOGURT MARKET, BY BRAND, 2018-2032 (USD MILLION)
TABLE 123 POLAND YOGURT MARKET, BY PRICE RANGE, 2018-2032 (USD MILLION)
TABLE 124 POLAND YOGURT MARKET, BY PACKAGING TYPE, 2018-2032 (USD MILLION)
TABLE 125 POLAND JARS IN YOGURT MARKET, BY PACKAGING TYPE, 2018-2032 (USD MILLION)
TABLE 126 POLAND BOTTLES IN YOGURT MARKET, BY PACKAGING TYPE, 2018-2032 (USD MILLION)
TABLE 127 POLAND YOGURT MARKET, BY PACKAGING SIZE, 2018-2032 (USD MILLION)
TABLE 128 POLAND YOGURT MARKET, BY CLAIM, 2018-2032 (USD MILLION)
TABLE 129 POLAND YOGURT MARKET, BY DISTRIBUTION CHANNEL, 2018-2032 (USD MILLION)
TABLE 130 POLAND STORE-BASED RETAILING IN YOGURT MARKET, BY DISTRIBUTION CHANNEL, 2018-2032 (USD MILLION)
TABLE 131 POLAND NON-STORE RETAILING IN YOGURT MARKET, BY DISTRIBUTION CHANNEL,2018-2032 (USD MILLION)
TABLE 132 BELGIUM YOGURT MARKET, BY YOGURT TYPE, 2018-2032 (USD MILLION)
TABLE 133 BELGIUM YOGURT MARKET, BY YOGURT TYPE, 2018-2032 (KILO TONS)
TABLE 134 BELGIUM YOGURT MARKET, BY PRODUCT TYPE, 2018-2032 (USD MILLION)
TABLE 135 BELGIUM YOGURT MARKET, BY FAT CONTENT, 2018-2032 (USD MILLION)
TABLE 136 BELGIUM YOGURT MARKET, BY FLAVOR, 2018-2032 (USD MILLION)
TABLE 137 BELGIUM FLAVORED IN YOGURT MARKET, BY FLAVOR, 2018-2032 (USD MILLION)
TABLE 138 BELGIUM YOGURT MARKET, BY SOURCE, 2018-2032 (USD MILLION)
TABLE 139 BELGIUM ANIMAL-BASED IN YOGURT MARKET, BY SOURCE, 2018-2032 (USD MILLION)
TABLE 140 BELGIUM PLANT-BASED IN YOGURT MARKET, BY SOURCE, 2018-2032 (USD MILLION)
TABLE 141 BELGIUM YOGURT MARKET, BY FORMULATION, 2018-2032 (USD MILLION)
TABLE 142 BELGIUM YOGURT MARKET, BY INCLUSION CATEGORY, 2018-2032 (USD MILLION)
TABLE 143 BELGIUM WITH INCLUSIONS & TOPPINGS IN YOGURT MARKET, BY INCLUSION CATEGORY, 2018-2032 (USD MILLION)
TABLE 144 BELGIUM NUTS IN YOGURT MARKET, BY INCLUSION CATEGORY, 2018-2032 (USD MILLION)
TABLE 145 BELGIUM CHOCOLATES IN YOGURT MARKET, BY INCLUSION CATEGORY, 2018-2032 (USD MILLION)
TABLE 146 BELGIUM YOGURT MARKET, BY FORTIFICATION, 2018-2032 (USD MILLION)
TABLE 147 BELGIUM YOGURT MARKET, BY ORGANIC CATEGORY, 2018-2032 (USD MILLION)
TABLE 148 BELGIUM YOGURT MARKET, BY BRAND, 2018-2032 (USD MILLION)
TABLE 149 BELGIUM YOGURT MARKET, BY PRICE RANGE, 2018-2032 (USD MILLION)
TABLE 150 BELGIUM YOGURT MARKET, BY PACKAGING TYPE, 2018-2032 (USD MILLION)
TABLE 151 BELGIUM JARS IN YOGURT MARKET, BY PACKAGING TYPE, 2018-2032 (USD MILLION)
TABLE 152 BELGIUM BOTTLES IN YOGURT MARKET, BY PACKAGING TYPE, 2018-2032 (USD MILLION)
TABLE 153 BELGIUM YOGURT MARKET, BY PACKAGING SIZE, 2018-2032 (USD MILLION)
TABLE 154 BELGIUM YOGURT MARKET, BY CLAIM, 2018-2032 (USD MILLION)
TABLE 155 BELGIUM YOGURT MARKET, BY DISTRIBUTION CHANNEL, 2018-2032 (USD MILLION)
TABLE 156 BELGIUM STORE-BASED RETAILING IN YOGURT MARKET, BY DISTRIBUTION CHANNEL, 2018-2032 (USD MILLION)
TABLE 157 BELGIUM NON-STORE RETAILING IN YOGURT MARKET, BY DISTRIBUTION CHANNEL,2018-2032 (USD MILLION)
TABLE 158 NETHERLANDS YOGURT MARKET, BY YOGURT TYPE, 2018-2032 (USD MILLION)
TABLE 159 NETHERLANDS YOGURT MARKET, BY YOGURT TYPE, 2018-2032 (KILO TONS)
TABLE 160 NETHERLANDS YOGURT MARKET, BY PRODUCT TYPE, 2018-2032 (USD MILLION)
TABLE 161 NETHERLANDS YOGURT MARKET, BY FAT CONTENT, 2018-2032 (USD MILLION)
TABLE 162 NETHERLANDS YOGURT MARKET, BY FLAVOR, 2018-2032 (USD MILLION)
TABLE 163 NETHERLANDS FLAVORED IN YOGURT MARKET, BY FLAVOR, 2018-2032 (USD MILLION)
TABLE 164 NETHERLANDS YOGURT MARKET, BY SOURCE, 2018-2032 (USD MILLION)
TABLE 165 NETHERLANDS ANIMAL-BASED IN YOGURT MARKET, BY SOURCE, 2018-2032 (USD MILLION)
TABLE 166 NETHERLANDS PLANT-BASED IN YOGURT MARKET, BY SOURCE, 2018-2032 (USD MILLION)
TABLE 167 NETHERLANDS YOGURT MARKET, BY FORMULATION, 2018-2032 (USD MILLION)
TABLE 168 NETHERLANDS YOGURT MARKET, BY INCLUSION CATEGORY, 2018-2032 (USD MILLION)
TABLE 169 NETHERLANDS WITH INCLUSIONS & TOPPINGS IN YOGURT MARKET, BY INCLUSION CATEGORY, 2018-2032 (USD MILLION)
TABLE 170 NETHERLANDS NUTS IN YOGURT MARKET, BY INCLUSION CATEGORY, 2018-2032 (USD MILLION)
TABLE 171 NETHERLANDS CHOCOLATES IN YOGURT MARKET, BY INCLUSION CATEGORY, 2018-2032 (USD MILLION)
TABLE 172 NETHERLANDS YOGURT MARKET, BY FORTIFICATION, 2018-2032 (USD MILLION)
TABLE 173 NETHERLANDS YOGURT MARKET, BY ORGANIC CATEGORY, 2018-2032 (USD MILLION)
TABLE 174 NETHERLANDS YOGURT MARKET, BY BRAND, 2018-2032 (USD MILLION)
TABLE 175 NETHERLANDS YOGURT MARKET, BY PRICE RANGE, 2018-2032 (USD MILLION)
TABLE 176 NETHERLANDS YOGURT MARKET, BY PACKAGING TYPE, 2018-2032 (USD MILLION)
TABLE 177 NETHERLANDS JARS IN YOGURT MARKET, BY PACKAGING TYPE, 2018-2032 (USD MILLION)
TABLE 178 NETHERLANDS BOTTLES IN YOGURT MARKET, BY PACKAGING TYPE, 2018-2032 (USD MILLION)
TABLE 179 NETHERLANDS YOGURT MARKET, BY PACKAGING SIZE, 2018-2032 (USD MILLION)
TABLE 180 NETHERLANDS YOGURT MARKET, BY CLAIM, 2018-2032 (USD MILLION)
TABLE 181 NETHERLANDS YOGURT MARKET, BY DISTRIBUTION CHANNEL, 2018-2032 (USD MILLION)
TABLE 182 NETHERLANDS STORE-BASED RETAILING IN YOGURT MARKET, BY DISTRIBUTION CHANNEL, 2018-2032 (USD MILLION)
TABLE 183 NETHERLANDS NON-STORE RETAILING IN YOGURT MARKET, BY DISTRIBUTION CHANNEL,2018-2032 (USD MILLION)
TABLE 184 ITALY YOGURT MARKET, BY YOGURT TYPE, 2018-2032 (USD MILLION)
TABLE 185 ITALY YOGURT MARKET, BY YOGURT TYPE, 2018-2032 (KILO TONS)
TABLE 186 ITALY YOGURT MARKET, BY PRODUCT TYPE, 2018-2032 (USD MILLION)
TABLE 187 ITALY YOGURT MARKET, BY FAT CONTENT, 2018-2032 (USD MILLION)
TABLE 188 ITALY YOGURT MARKET, BY FLAVOR, 2018-2032 (USD MILLION)
TABLE 189 ITALY FLAVORED IN YOGURT MARKET, BY FLAVOR, 2018-2032 (USD MILLION)
TABLE 190 ITALY YOGURT MARKET, BY SOURCE, 2018-2032 (USD MILLION)
TABLE 191 ITALY ANIMAL-BASED IN YOGURT MARKET, BY SOURCE, 2018-2032 (USD MILLION)
TABLE 192 ITALY PLANT-BASED IN YOGURT MARKET, BY SOURCE, 2018-2032 (USD MILLION)
TABLE 193 ITALY YOGURT MARKET, BY FORMULATION, 2018-2032 (USD MILLION)
TABLE 194 ITALY YOGURT MARKET, BY INCLUSION CATEGORY, 2018-2032 (USD MILLION)
TABLE 195 ITALY WITH INCLUSIONS & TOPPINGS IN YOGURT MARKET, BY INCLUSION CATEGORY, 2018-2032 (USD MILLION)
TABLE 196 ITALY NUTS IN YOGURT MARKET, BY INCLUSION CATEGORY, 2018-2032 (USD MILLION)
TABLE 197 ITALY CHOCOLATES IN YOGURT MARKET, BY INCLUSION CATEGORY, 2018-2032 (USD MILLION)
TABLE 198 ITALY YOGURT MARKET, BY FORTIFICATION, 2018-2032 (USD MILLION)
TABLE 199 ITALY YOGURT MARKET, BY ORGANIC CATEGORY, 2018-2032 (USD MILLION)
TABLE 200 ITALY YOGURT MARKET, BY BRAND, 2018-2032 (USD MILLION)
TABLE 201 ITALY YOGURT MARKET, BY PRICE RANGE, 2018-2032 (USD MILLION)
TABLE 202 ITALY YOGURT MARKET, BY PACKAGING TYPE, 2018-2032 (USD MILLION)
TABLE 203 ITALY JARS IN YOGURT MARKET, BY PACKAGING TYPE, 2018-2032 (USD MILLION)
TABLE 204 ITALY BOTTLES IN YOGURT MARKET, BY PACKAGING TYPE, 2018-2032 (USD MILLION)
TABLE 205 ITALY YOGURT MARKET, BY PACKAGING SIZE, 2018-2032 (USD MILLION)
TABLE 206 ITALY YOGURT MARKET, BY CLAIM, 2018-2032 (USD MILLION)
TABLE 207 ITALY YOGURT MARKET, BY DISTRIBUTION CHANNEL, 2018-2032 (USD MILLION)
TABLE 208 ITALY STORE-BASED RETAILING IN YOGURT MARKET, BY DISTRIBUTION CHANNEL, 2018-2032 (USD MILLION)
TABLE 209 ITALY NON-STORE RETAILING IN YOGURT MARKET, BY DISTRIBUTION CHANNEL,2018-2032 (USD MILLION)
TABLE 210 AUSTRIA YOGURT MARKET, BY YOGURT TYPE, 2018-2032 (USD MILLION)
TABLE 211 AUSTRIA YOGURT MARKET, BY YOGURT TYPE, 2018-2032 (KILO TONS)
TABLE 212 AUSTRIA YOGURT MARKET, BY PRODUCT TYPE, 2018-2032 (USD MILLION)
TABLE 213 AUSTRIA YOGURT MARKET, BY FAT CONTENT, 2018-2032 (USD MILLION)
TABLE 214 AUSTRIA YOGURT MARKET, BY FLAVOR, 2018-2032 (USD MILLION)
TABLE 215 AUSTRIA FLAVORED IN YOGURT MARKET, BY FLAVOR, 2018-2032 (USD MILLION)
TABLE 216 AUSTRIA YOGURT MARKET, BY SOURCE, 2018-2032 (USD MILLION)
TABLE 217 AUSTRIA ANIMAL-BASED IN YOGURT MARKET, BY SOURCE, 2018-2032 (USD MILLION)
TABLE 218 AUSTRIA PLANT-BASED IN YOGURT MARKET, BY SOURCE, 2018-2032 (USD MILLION)
TABLE 219 AUSTRIA YOGURT MARKET, BY FORMULATION, 2018-2032 (USD MILLION)
TABLE 220 AUSTRIA YOGURT MARKET, BY INCLUSION CATEGORY, 2018-2032 (USD MILLION)
TABLE 221 AUSTRIA WITH INCLUSIONS & TOPPINGS IN YOGURT MARKET, BY INCLUSION CATEGORY, 2018-2032 (USD MILLION)
TABLE 222 AUSTRIA NUTS IN YOGURT MARKET, BY INCLUSION CATEGORY, 2018-2032 (USD MILLION)
TABLE 223 AUSTRIA CHOCOLATES IN YOGURT MARKET, BY INCLUSION CATEGORY, 2018-2032 (USD MILLION)
TABLE 224 AUSTRIA YOGURT MARKET, BY FORTIFICATION, 2018-2032 (USD MILLION)
TABLE 225 AUSTRIA YOGURT MARKET, BY ORGANIC CATEGORY, 2018-2032 (USD MILLION)
TABLE 226 AUSTRIA YOGURT MARKET, BY BRAND, 2018-2032 (USD MILLION)
TABLE 227 AUSTRIA YOGURT MARKET, BY PRICE RANGE, 2018-2032 (USD MILLION)
TABLE 228 AUSTRIA YOGURT MARKET, BY PACKAGING TYPE, 2018-2032 (USD MILLION)
TABLE 229 AUSTRIA JARS IN YOGURT MARKET, BY PACKAGING TYPE, 2018-2032 (USD MILLION)
TABLE 230 AUSTRIA BOTTLES IN YOGURT MARKET, BY PACKAGING TYPE, 2018-2032 (USD MILLION)
TABLE 231 AUSTRIA YOGURT MARKET, BY PACKAGING SIZE, 2018-2032 (USD MILLION)
TABLE 232 AUSTRIA YOGURT MARKET, BY CLAIM, 2018-2032 (USD MILLION)
TABLE 233 AUSTRIA YOGURT MARKET, BY DISTRIBUTION CHANNEL, 2018-2032 (USD MILLION)
TABLE 234 AUSTRIA STORE-BASED RETAILING IN YOGURT MARKET, BY DISTRIBUTION CHANNEL, 2018-2032 (USD MILLION)
TABLE 235 AUSTRIA NON-STORE RETAILING IN YOGURT MARKET, BY DISTRIBUTION CHANNEL,2018-2032 (USD MILLION)
TABLE 236 SWEDEN YOGURT MARKET, BY YOGURT TYPE, 2018-2032 (USD MILLION)
TABLE 237 SWEDEN YOGURT MARKET, BY YOGURT TYPE, 2018-2032 (KILO TONS)
TABLE 238 SWEDEN YOGURT MARKET, BY PRODUCT TYPE, 2018-2032 (USD MILLION)
TABLE 239 SWEDEN YOGURT MARKET, BY FAT CONTENT, 2018-2032 (USD MILLION)
TABLE 240 SWEDEN YOGURT MARKET, BY FLAVOR, 2018-2032 (USD MILLION)
TABLE 241 SWEDEN FLAVORED IN YOGURT MARKET, BY FLAVOR, 2018-2032 (USD MILLION)
TABLE 242 SWEDEN YOGURT MARKET, BY SOURCE, 2018-2032 (USD MILLION)
TABLE 243 SWEDEN ANIMAL-BASED IN YOGURT MARKET, BY SOURCE, 2018-2032 (USD MILLION)
TABLE 244 SWEDEN PLANT-BASED IN YOGURT MARKET, BY SOURCE, 2018-2032 (USD MILLION)
TABLE 245 SWEDEN YOGURT MARKET, BY FORMULATION, 2018-2032 (USD MILLION)
TABLE 246 SWEDEN YOGURT MARKET, BY INCLUSION CATEGORY, 2018-2032 (USD MILLION)
TABLE 247 SWEDEN WITH INCLUSIONS & TOPPINGS IN YOGURT MARKET, BY INCLUSION CATEGORY, 2018-2032 (USD MILLION)
TABLE 248 SWEDEN NUTS IN YOGURT MARKET, BY INCLUSION CATEGORY, 2018-2032 (USD MILLION)
TABLE 249 SWEDEN CHOCOLATES IN YOGURT MARKET, BY INCLUSION CATEGORY, 2018-2032 (USD MILLION)
TABLE 250 SWEDEN YOGURT MARKET, BY FORTIFICATION, 2018-2032 (USD MILLION)
TABLE 251 SWEDEN YOGURT MARKET, BY ORGANIC CATEGORY, 2018-2032 (USD MILLION)
TABLE 252 SWEDEN YOGURT MARKET, BY BRAND, 2018-2032 (USD MILLION)
TABLE 253 SWEDEN YOGURT MARKET, BY PRICE RANGE, 2018-2032 (USD MILLION)
TABLE 254 SWEDEN YOGURT MARKET, BY PACKAGING TYPE, 2018-2032 (USD MILLION)
TABLE 255 SWEDEN JARS IN YOGURT MARKET, BY PACKAGING TYPE, 2018-2032 (USD MILLION)
TABLE 256 SWEDEN BOTTLES IN YOGURT MARKET, BY PACKAGING TYPE, 2018-2032 (USD MILLION)
TABLE 257 SWEDEN YOGURT MARKET, BY PACKAGING SIZE, 2018-2032 (USD MILLION)
TABLE 258 SWEDEN YOGURT MARKET, BY CLAIM, 2018-2032 (USD MILLION)
TABLE 259 SWEDEN YOGURT MARKET, BY DISTRIBUTION CHANNEL, 2018-2032 (USD MILLION)
TABLE 260 SWEDEN STORE-BASED RETAILING IN YOGURT MARKET, BY DISTRIBUTION CHANNEL, 2018-2032 (USD MILLION)
TABLE 261 SWEDEN NON-STORE RETAILING IN YOGURT MARKET, BY DISTRIBUTION CHANNEL,2018-2032 (USD MILLION)
TABLE 262 DENMARK YOGURT MARKET, BY YOGURT TYPE, 2018-2032 (USD MILLION)
TABLE 263 DENMARK YOGURT MARKET, BY YOGURT TYPE, 2018-2032 (KILO TONS)
TABLE 264 DENMARK YOGURT MARKET, BY PRODUCT TYPE, 2018-2032 (USD MILLION)
TABLE 265 DENMARK YOGURT MARKET, BY FAT CONTENT, 2018-2032 (USD MILLION)
TABLE 266 DENMARK YOGURT MARKET, BY FLAVOR, 2018-2032 (USD MILLION)
TABLE 267 DENMARK FLAVORED IN YOGURT MARKET, BY FLAVOR, 2018-2032 (USD MILLION)
TABLE 268 DENMARK YOGURT MARKET, BY SOURCE, 2018-2032 (USD MILLION)
TABLE 269 DENMARK ANIMAL-BASED IN YOGURT MARKET, BY SOURCE, 2018-2032 (USD MILLION)
TABLE 270 DENMARK PLANT-BASED IN YOGURT MARKET, BY SOURCE, 2018-2032 (USD MILLION)
TABLE 271 DENMARK YOGURT MARKET, BY FORMULATION, 2018-2032 (USD MILLION)
TABLE 272 DENMARK YOGURT MARKET, BY INCLUSION CATEGORY, 2018-2032 (USD MILLION)
TABLE 273 DENMARK WITH INCLUSIONS & TOPPINGS IN YOGURT MARKET, BY INCLUSION CATEGORY, 2018-2032 (USD MILLION)
TABLE 274 DENMARK NUTS IN YOGURT MARKET, BY INCLUSION CATEGORY, 2018-2032 (USD MILLION)
TABLE 275 DENMARK CHOCOLATES IN YOGURT MARKET, BY INCLUSION CATEGORY, 2018-2032 (USD MILLION)
TABLE 276 DENMARK YOGURT MARKET, BY FORTIFICATION, 2018-2032 (USD MILLION)
TABLE 277 DENMARK YOGURT MARKET, BY ORGANIC CATEGORY, 2018-2032 (USD MILLION)
TABLE 278 DENMARK YOGURT MARKET, BY BRAND, 2018-2032 (USD MILLION)
TABLE 279 DENMARK YOGURT MARKET, BY PRICE RANGE, 2018-2032 (USD MILLION)
TABLE 280 DENMARK YOGURT MARKET, BY PACKAGING TYPE, 2018-2032 (USD MILLION)
TABLE 281 DENMARK JARS IN YOGURT MARKET, BY PACKAGING TYPE, 2018-2032 (USD MILLION)
TABLE 282 DENMARK BOTTLES IN YOGURT MARKET, BY PACKAGING TYPE, 2018-2032 (USD MILLION)
TABLE 283 DENMARK YOGURT MARKET, BY PACKAGING SIZE, 2018-2032 (USD MILLION)
TABLE 284 DENMARK YOGURT MARKET, BY CLAIM, 2018-2032 (USD MILLION)
TABLE 285 DENMARK YOGURT MARKET, BY DISTRIBUTION CHANNEL, 2018-2032 (USD MILLION)
TABLE 286 DENMARK STORE-BASED RETAILING IN YOGURT MARKET, BY DISTRIBUTION CHANNEL, 2018-2032 (USD MILLION)
TABLE 287 DENMARK NON-STORE RETAILING IN YOGURT MARKET, BY DISTRIBUTION CHANNEL,2018-2032 (USD MILLION)
TABLE 288 UNITED KINGDOM YOGURT MARKET, BY YOGURT TYPE, 2018-2032 (USD MILLION)
TABLE 289 UNITED KINGDOM YOGURT MARKET, BY YOGURT TYPE, 2018-2032 (KILO TONS)
TABLE 290 UNITED KINGDOM YOGURT MARKET, BY PRODUCT TYPE, 2018-2032 (USD MILLION)
TABLE 291 UNITED KINGDOM YOGURT MARKET, BY FAT CONTENT, 2018-2032 (USD MILLION)
TABLE 292 UNITED KINGDOM YOGURT MARKET, BY FLAVOR, 2018-2032 (USD MILLION)
TABLE 293 UNITED KINGDOM FLAVORED IN YOGURT MARKET, BY FLAVOR, 2018-2032 (USD MILLION)
TABLE 294 UNITED KINGDOM YOGURT MARKET, BY SOURCE, 2018-2032 (USD MILLION)
TABLE 295 UNITED KINGDOM ANIMAL-BASED IN YOGURT MARKET, BY SOURCE, 2018-2032 (USD MILLION)
TABLE 296 UNITED KINGDOM PLANT-BASED IN YOGURT MARKET, BY SOURCE, 2018-2032 (USD MILLION)
TABLE 297 UNITED KINGDOM YOGURT MARKET, BY FORMULATION, 2018-2032 (USD MILLION)
TABLE 298 UNITED KINGDOM YOGURT MARKET, BY INCLUSION CATEGORY, 2018-2032 (USD MILLION)
TABLE 299 UNITED KINGDOM WITH INCLUSIONS & TOPPINGS IN YOGURT MARKET, BY INCLUSION CATEGORY, 2018-2032 (USD MILLION)
TABLE 300 UNITED KINGDOM NUTS IN YOGURT MARKET, BY INCLUSION CATEGORY, 2018-2032 (USD MILLION)
TABLE 301 UNITED KINGDOM CHOCOLATES IN YOGURT MARKET, BY INCLUSION CATEGORY, 2018-2032 (USD MILLION)
TABLE 302 UNITED KINGDOM YOGURT MARKET, BY FORTIFICATION, 2018-2032 (USD MILLION)
TABLE 303 UNITED KINGDOM YOGURT MARKET, BY ORGANIC CATEGORY, 2018-2032 (USD MILLION)
TABLE 304 UNITED KINGDOM YOGURT MARKET, BY BRAND, 2018-2032 (USD MILLION)
TABLE 305 UNITED KINGDOM YOGURT MARKET, BY PRICE RANGE, 2018-2032 (USD MILLION)
TABLE 306 UNITED KINGDOM YOGURT MARKET, BY PACKAGING TYPE, 2018-2032 (USD MILLION)
TABLE 307 UNITED KINGDOM JARS IN YOGURT MARKET, BY PACKAGING TYPE, 2018-2032 (USD MILLION)
TABLE 308 UNITED KINGDOM BOTTLES IN YOGURT MARKET, BY PACKAGING TYPE, 2018-2032 (USD MILLION)
TABLE 309 UNITED KINGDOM YOGURT MARKET, BY PACKAGING SIZE, 2018-2032 (USD MILLION)
TABLE 310 UNITED KINGDOM YOGURT MARKET, BY CLAIM, 2018-2032 (USD MILLION)
TABLE 311 UNITED KINGDOM YOGURT MARKET, BY DISTRIBUTION CHANNEL, 2018-2032 (USD MILLION)
TABLE 312 UNITED KINGDOM STORE-BASED RETAILING IN YOGURT MARKET, BY DISTRIBUTION CHANNEL, 2018-2032 (USD MILLION)
TABLE 313 UNITED KINGDOM NON-STORE RETAILING IN YOGURT MARKET, BY DISTRIBUTION CHANNEL,2018-2032 (USD MILLION)
TABLE 314 PORTUGAL YOGURT MARKET, BY YOGURT TYPE, 2018-2032 (USD MILLION)
TABLE 315 PORTUGAL YOGURT MARKET, BY YOGURT TYPE, 2018-2032 (KILO TONS)
TABLE 316 PORTUGAL YOGURT MARKET, BY PRODUCT TYPE, 2018-2032 (USD MILLION)
TABLE 317 PORTUGAL YOGURT MARKET, BY FAT CONTENT, 2018-2032 (USD MILLION)
TABLE 318 PORTUGAL YOGURT MARKET, BY FLAVOR, 2018-2032 (USD MILLION)
TABLE 319 PORTUGAL FLAVORED IN YOGURT MARKET, BY FLAVOR, 2018-2032 (USD MILLION)
TABLE 320 PORTUGAL YOGURT MARKET, BY SOURCE, 2018-2032 (USD MILLION)
TABLE 321 PORTUGAL ANIMAL-BASED IN YOGURT MARKET, BY SOURCE, 2018-2032 (USD MILLION)
TABLE 322 PORTUGAL PLANT-BASED IN YOGURT MARKET, BY SOURCE, 2018-2032 (USD MILLION)
TABLE 323 PORTUGAL YOGURT MARKET, BY FORMULATION, 2018-2032 (USD MILLION)
TABLE 324 PORTUGAL YOGURT MARKET, BY INCLUSION CATEGORY, 2018-2032 (USD MILLION)
TABLE 325 PORTUGAL WITH INCLUSIONS & TOPPINGS IN YOGURT MARKET, BY INCLUSION CATEGORY, 2018-2032 (USD MILLION)
TABLE 326 PORTUGAL NUTS IN YOGURT MARKET, BY INCLUSION CATEGORY, 2018-2032 (USD MILLION)
TABLE 327 PORTUGAL CHOCOLATES IN YOGURT MARKET, BY INCLUSION CATEGORY, 2018-2032 (USD MILLION)
TABLE 328 PORTUGAL YOGURT MARKET, BY FORTIFICATION, 2018-2032 (USD MILLION)
TABLE 329 PORTUGAL YOGURT MARKET, BY ORGANIC CATEGORY, 2018-2032 (USD MILLION)
TABLE 330 PORTUGAL YOGURT MARKET, BY BRAND, 2018-2032 (USD MILLION)
TABLE 331 PORTUGAL YOGURT MARKET, BY PRICE RANGE, 2018-2032 (USD MILLION)
TABLE 332 PORTUGAL YOGURT MARKET, BY PACKAGING TYPE, 2018-2032 (USD MILLION)
TABLE 333 PORTUGAL JARS IN YOGURT MARKET, BY PACKAGING TYPE, 2018-2032 (USD MILLION)
TABLE 334 PORTUGAL BOTTLES IN YOGURT MARKET, BY PACKAGING TYPE, 2018-2032 (USD MILLION)
TABLE 335 PORTUGAL YOGURT MARKET, BY PACKAGING SIZE, 2018-2032 (USD MILLION)
TABLE 336 PORTUGAL YOGURT MARKET, BY CLAIM, 2018-2032 (USD MILLION)
TABLE 337 PORTUGAL YOGURT MARKET, BY DISTRIBUTION CHANNEL, 2018-2032 (USD MILLION)
TABLE 338 PORTUGAL STORE-BASED RETAILING IN YOGURT MARKET, BY DISTRIBUTION CHANNEL, 2018-2032 (USD MILLION)
TABLE 339 PORTUGAL NON-STORE RETAILING IN YOGURT MARKET, BY DISTRIBUTION CHANNEL,2018-2032 (USD MILLION)
TABLE 340 SWITZERLAND YOGURT MARKET, BY YOGURT TYPE, 2018-2032 (USD MILLION)
TABLE 341 SWITZERLAND YOGURT MARKET, BY YOGURT TYPE, 2018-2032 (KILO TONS)
TABLE 342 SWITZERLAND YOGURT MARKET, BY PRODUCT TYPE, 2018-2032 (USD MILLION)
TABLE 343 SWITZERLAND YOGURT MARKET, BY FAT CONTENT, 2018-2032 (USD MILLION)
TABLE 344 SWITZERLAND YOGURT MARKET, BY FLAVOR, 2018-2032 (USD MILLION)
TABLE 345 SWITZERLAND FLAVORED IN YOGURT MARKET, BY FLAVOR, 2018-2032 (USD MILLION)
TABLE 346 SWITZERLAND YOGURT MARKET, BY SOURCE, 2018-2032 (USD MILLION)
TABLE 347 SWITZERLAND ANIMAL-BASED IN YOGURT MARKET, BY SOURCE, 2018-2032 (USD MILLION)
TABLE 348 SWITZERLAND PLANT-BASED IN YOGURT MARKET, BY SOURCE, 2018-2032 (USD MILLION)
TABLE 349 SWITZERLAND YOGURT MARKET, BY FORMULATION, 2018-2032 (USD MILLION)
TABLE 350 SWITZERLAND YOGURT MARKET, BY INCLUSION CATEGORY, 2018-2032 (USD MILLION)
TABLE 351 SWITZERLAND WITH INCLUSIONS & TOPPINGS IN YOGURT MARKET, BY INCLUSION CATEGORY, 2018-2032 (USD MILLION)
TABLE 352 SWITZERLAND NUTS IN YOGURT MARKET, BY INCLUSION CATEGORY, 2018-2032 (USD MILLION)
TABLE 353 SWITZERLAND CHOCOLATES IN YOGURT MARKET, BY INCLUSION CATEGORY, 2018-2032 (USD MILLION)
TABLE 354 SWITZERLAND YOGURT MARKET, BY FORTIFICATION, 2018-2032 (USD MILLION)
TABLE 355 SWITZERLAND YOGURT MARKET, BY ORGANIC CATEGORY, 2018-2032 (USD MILLION)
TABLE 356 SWITZERLAND YOGURT MARKET, BY BRAND, 2018-2032 (USD MILLION)
TABLE 357 SWITZERLAND YOGURT MARKET, BY PRICE RANGE, 2018-2032 (USD MILLION)
TABLE 358 SWITZERLAND YOGURT MARKET, BY PACKAGING TYPE, 2018-2032 (USD MILLION)
TABLE 359 SWITZERLAND JARS IN YOGURT MARKET, BY PACKAGING TYPE, 2018-2032 (USD MILLION)
TABLE 360 SWITZERLAND BOTTLES IN YOGURT MARKET, BY PACKAGING TYPE, 2018-2032 (USD MILLION)
TABLE 361 SWITZERLAND YOGURT MARKET, BY PACKAGING SIZE, 2018-2032 (USD MILLION)
TABLE 362 SWITZERLAND YOGURT MARKET, BY CLAIM, 2018-2032 (USD MILLION)
TABLE 363 SWITZERLAND YOGURT MARKET, BY DISTRIBUTION CHANNEL, 2018-2032 (USD MILLION)
TABLE 364 SWITZERLAND STORE-BASED RETAILING IN YOGURT MARKET, BY DISTRIBUTION CHANNEL, 2018-2032 (USD MILLION)
TABLE 365 SWITZERLAND NON-STORE RETAILING IN YOGURT MARKET, BY DISTRIBUTION CHANNEL,2018-2032 (USD MILLION)
TABLE 366 IRELAND YOGURT MARKET, BY YOGURT TYPE, 2018-2032 (USD MILLION)
TABLE 367 IRELAND YOGURT MARKET, BY YOGURT TYPE, 2018-2032 (KILO TONS)
TABLE 368 IRELAND YOGURT MARKET, BY PRODUCT TYPE, 2018-2032 (USD MILLION)
TABLE 369 IRELAND YOGURT MARKET, BY FAT CONTENT, 2018-2032 (USD MILLION)
TABLE 370 IRELAND YOGURT MARKET, BY FLAVOR, 2018-2032 (USD MILLION)
TABLE 371 IRELAND FLAVORED IN YOGURT MARKET, BY FLAVOR, 2018-2032 (USD MILLION)
TABLE 372 IRELAND YOGURT MARKET, BY SOURCE, 2018-2032 (USD MILLION)
TABLE 373 IRELAND ANIMAL-BASED IN YOGURT MARKET, BY SOURCE, 2018-2032 (USD MILLION)
TABLE 374 IRELAND PLANT-BASED IN YOGURT MARKET, BY SOURCE, 2018-2032 (USD MILLION)
TABLE 375 IRELAND YOGURT MARKET, BY FORMULATION, 2018-2032 (USD MILLION)
TABLE 376 IRELAND YOGURT MARKET, BY INCLUSION CATEGORY, 2018-2032 (USD MILLION)
TABLE 377 IRELAND WITH INCLUSIONS & TOPPINGS IN YOGURT MARKET, BY INCLUSION CATEGORY, 2018-2032 (USD MILLION)
TABLE 378 IRELAND NUTS IN YOGURT MARKET, BY INCLUSION CATEGORY, 2018-2032 (USD MILLION)
TABLE 379 IRELAND CHOCOLATES IN YOGURT MARKET, BY INCLUSION CATEGORY, 2018-2032 (USD MILLION)
TABLE 380 IRELAND YOGURT MARKET, BY FORTIFICATION, 2018-2032 (USD MILLION)
TABLE 381 IRELAND YOGURT MARKET, BY ORGANIC CATEGORY, 2018-2032 (USD MILLION)
TABLE 382 IRELAND YOGURT MARKET, BY BRAND, 2018-2032 (USD MILLION)
TABLE 383 IRELAND YOGURT MARKET, BY PRICE RANGE, 2018-2032 (USD MILLION)
TABLE 384 IRELAND YOGURT MARKET, BY PACKAGING TYPE, 2018-2032 (USD MILLION)
TABLE 385 IRELAND JARS IN YOGURT MARKET, BY PACKAGING TYPE, 2018-2032 (USD MILLION)
TABLE 386 IRELAND BOTTLES IN YOGURT MARKET, BY PACKAGING TYPE, 2018-2032 (USD MILLION)
TABLE 387 IRELAND YOGURT MARKET, BY PACKAGING SIZE, 2018-2032 (USD MILLION)
TABLE 388 IRELAND YOGURT MARKET, BY CLAIM, 2018-2032 (USD MILLION)
TABLE 389 IRELAND YOGURT MARKET, BY DISTRIBUTION CHANNEL, 2018-2032 (USD MILLION)
TABLE 390 IRELAND STORE-BASED RETAILING IN YOGURT MARKET, BY DISTRIBUTION CHANNEL, 2018-2032 (USD MILLION)
TABLE 391 IRELAND NON-STORE RETAILING IN YOGURT MARKET, BY DISTRIBUTION CHANNEL,2018-2032 (USD MILLION)
TABLE 392 FINLAND YOGURT MARKET, BY YOGURT TYPE, 2018-2032 (USD MILLION)
TABLE 393 FINLAND YOGURT MARKET, BY YOGURT TYPE, 2018-2032 (KILO TONS)
TABLE 394 FINLAND YOGURT MARKET, BY PRODUCT TYPE, 2018-2032 (USD MILLION)
TABLE 395 FINLAND YOGURT MARKET, BY FAT CONTENT, 2018-2032 (USD MILLION)
TABLE 396 FINLAND YOGURT MARKET, BY FLAVOR, 2018-2032 (USD MILLION)
TABLE 397 FINLAND FLAVORED IN YOGURT MARKET, BY FLAVOR, 2018-2032 (USD MILLION)
TABLE 398 FINLAND YOGURT MARKET, BY SOURCE, 2018-2032 (USD MILLION)
TABLE 399 FINLAND ANIMAL-BASED IN YOGURT MARKET, BY SOURCE, 2018-2032 (USD MILLION)
TABLE 400 FINLAND PLANT-BASED IN YOGURT MARKET, BY SOURCE, 2018-2032 (USD MILLION)
TABLE 401 FINLAND YOGURT MARKET, BY FORMULATION, 2018-2032 (USD MILLION)
TABLE 402 FINLAND YOGURT MARKET, BY INCLUSION CATEGORY, 2018-2032 (USD MILLION)
TABLE 403 FINLAND WITH INCLUSIONS & TOPPINGS IN YOGURT MARKET, BY INCLUSION CATEGORY, 2018-2032 (USD MILLION)
TABLE 404 FINLAND NUTS IN YOGURT MARKET, BY INCLUSION CATEGORY, 2018-2032 (USD MILLION)
TABLE 405 FINLAND CHOCOLATES IN YOGURT MARKET, BY INCLUSION CATEGORY, 2018-2032 (USD MILLION)
TABLE 406 FINLAND YOGURT MARKET, BY FORTIFICATION, 2018-2032 (USD MILLION)
TABLE 407 FINLAND YOGURT MARKET, BY ORGANIC CATEGORY, 2018-2032 (USD MILLION)
TABLE 408 FINLAND YOGURT MARKET, BY BRAND, 2018-2032 (USD MILLION)
TABLE 409 FINLAND YOGURT MARKET, BY PRICE RANGE, 2018-2032 (USD MILLION)
TABLE 410 FINLAND YOGURT MARKET, BY PACKAGING TYPE, 2018-2032 (USD MILLION)
TABLE 411 FINLAND JARS IN YOGURT MARKET, BY PACKAGING TYPE, 2018-2032 (USD MILLION)
TABLE 412 FINLAND BOTTLES IN YOGURT MARKET, BY PACKAGING TYPE, 2018-2032 (USD MILLION)
TABLE 413 FINLAND YOGURT MARKET, BY PACKAGING SIZE, 2018-2032 (USD MILLION)
TABLE 414 FINLAND YOGURT MARKET, BY CLAIM, 2018-2032 (USD MILLION)
TABLE 415 FINLAND YOGURT MARKET, BY DISTRIBUTION CHANNEL, 2018-2032 (USD MILLION)
TABLE 416 FINLAND STORE-BASED RETAILING IN YOGURT MARKET, BY DISTRIBUTION CHANNEL, 2018-2032 (USD MILLION)
TABLE 417 FINLAND NON-STORE RETAILING IN YOGURT MARKET, BY DISTRIBUTION CHANNEL,2018-2032 (USD MILLION)
TABLE 418 LUXEMBOURG YOGURT MARKET, BY YOGURT TYPE, 2018-2032 (USD MILLION)
TABLE 419 LUXEMBOURG YOGURT MARKET, BY YOGURT TYPE, 2018-2032 (KILO TONS)
TABLE 420 LUXEMBOURG YOGURT MARKET, BY PRODUCT TYPE, 2018-2032 (USD MILLION)
TABLE 421 LUXEMBOURG YOGURT MARKET, BY FAT CONTENT, 2018-2032 (USD MILLION)
TABLE 422 LUXEMBOURG YOGURT MARKET, BY FLAVOR, 2018-2032 (USD MILLION)
TABLE 423 LUXEMBOURG FLAVORED IN YOGURT MARKET, BY FLAVOR, 2018-2032 (USD MILLION)
TABLE 424 LUXEMBOURG YOGURT MARKET, BY SOURCE, 2018-2032 (USD MILLION)
TABLE 425 LUXEMBOURG ANIMAL-BASED IN YOGURT MARKET, BY SOURCE, 2018-2032 (USD MILLION)
TABLE 426 LUXEMBOURG PLANT-BASED IN YOGURT MARKET, BY SOURCE, 2018-2032 (USD MILLION)
TABLE 427 LUXEMBOURG YOGURT MARKET, BY FORMULATION, 2018-2032 (USD MILLION)
TABLE 428 LUXEMBOURG YOGURT MARKET, BY INCLUSION CATEGORY, 2018-2032 (USD MILLION)
TABLE 429 LUXEMBOURG WITH INCLUSIONS & TOPPINGS IN YOGURT MARKET, BY INCLUSION CATEGORY, 2018-2032 (USD MILLION)
TABLE 430 LUXEMBOURG NUTS IN YOGURT MARKET, BY INCLUSION CATEGORY, 2018-2032 (USD MILLION)
TABLE 431 LUXEMBOURG CHOCOLATES IN YOGURT MARKET, BY INCLUSION CATEGORY, 2018-2032 (USD MILLION)
TABLE 432 LUXEMBOURG YOGURT MARKET, BY FORTIFICATION, 2018-2032 (USD MILLION)
TABLE 433 LUXEMBOURG YOGURT MARKET, BY ORGANIC CATEGORY, 2018-2032 (USD MILLION)
TABLE 434 LUXEMBOURG YOGURT MARKET, BY BRAND, 2018-2032 (USD MILLION)
TABLE 435 LUXEMBOURG YOGURT MARKET, BY PRICE RANGE, 2018-2032 (USD MILLION)
TABLE 436 LUXEMBOURG YOGURT MARKET, BY PACKAGING TYPE, 2018-2032 (USD MILLION)
TABLE 437 LUXEMBOURG JARS IN YOGURT MARKET, BY PACKAGING TYPE, 2018-2032 (USD MILLION)
TABLE 438 LUXEMBOURG BOTTLES IN YOGURT MARKET, BY PACKAGING TYPE, 2018-2032 (USD MILLION)
TABLE 439 LUXEMBOURG YOGURT MARKET, BY PACKAGING SIZE, 2018-2032 (USD MILLION)
TABLE 440 LUXEMBOURG YOGURT MARKET, BY CLAIM, 2018-2032 (USD MILLION)
TABLE 441 LUXEMBOURG YOGURT MARKET, BY DISTRIBUTION CHANNEL, 2018-2032 (USD MILLION)
TABLE 442 LUXEMBOURG STORE-BASED RETAILING IN YOGURT MARKET, BY DISTRIBUTION CHANNEL, 2018-2032 (USD MILLION)
TABLE 443 LUXEMBOURG NON-STORE RETAILING IN YOGURT MARKET, BY DISTRIBUTION CHANNEL,2018-2032 (USD MILLION)
TABLE 444 REST OF EUROPE YOGURT MARKET, BY YOGURT TYPE, 2018-2032 (USD MILLION)
TABLE 445 REST OF EUROPE YOGURT MARKET, BY YOGURT TYPE, 2018-2032 (KILO TONS)
List of Figure
FIGURE 1 EUROPE YOGURT MARKET: SEGMENTATION
FIGURE 2 EUROPE YOGURT MARKET: DATA TRIANGULATION
FIGURE 3 EUROPE YOGURT MARKET: DROC ANALYSIS
FIGURE 4 EUROPE YOGURT MARKET: EUROPE VS REGIONAL MARKET ANALYSIS
FIGURE 5 EUROPE YOGURT MARKET: COMPANY RESEARCH ANALYSIS
FIGURE 6 EUROPE YOGURT MARKET: INTERVIEW DEMOGRAPHICS
FIGURE 7 EUROPE YOGURT MARKET: DBMR MARKET POSITION GRID
FIGURE 8 EUROPE YOGURT MARKET: MARKET APPLICATION COVERAGE GRID
FIGURE 9 EUROPE YOGURT MARKET: VENDOR SHARE ANALYSIS
FIGURE 10 EUROPE YOGURT MARKET: SEGMENTATION
FIGURE 11 EIGHT SEGMENTS COMPRISE THE EUROPE YOGURT MARKET, BY YOGURT TYPE
FIGURE 12 CHANGING LIFESTYLES OF PEOPLE TO OPT FOR HEALTHIER PRODUCTS IS EXPECTED TO DRIVE THE EUROPE YOGURT MARKET IN THE FORECAST PERIOD 2025 TO 2032
FIGURE 13 REGULAR YOGURT SEGMENT IS EXPECTED TO ACCOUNT FOR THE LARGEST SHARE OF THE EUROPE YOGURT MARKET IN 2025 AND 2032
FIGURE 14 IMPORT EXPORT SCENARIO (USD THOUSAND)
FIGURE 15 PRICING ANALYSIS
FIGURE 16 DROC ANALYSIS
FIGURE 17 EUROPE YOGURT MARKET: BY PRODUCT TYPE, 2024
FIGURE 18 EUROPE YOGURT MARKET: BY PRODUCT TYPE, 2025-2032 (USD MILLION)
FIGURE 19 EUROPE YOGURT MARKET: BY PRODUCT TYPE, CAGR (2025-2032)
FIGURE 20 EUROPE YOGURT MARKET: BY PRODUCT TYPE, LIFELINE CURVE
FIGURE 21 EUROPE YOGURT MARKET: BY FORMULATION, 2024
FIGURE 22 EUROPE YOGURT MARKET: BY FORMULATION, 2025-2032 (USD MILLION)
FIGURE 23 EUROPE YOGURT MARKET: BY FORMULATION, CAGR (2025-2032)
FIGURE 24 EUROPE YOGURT MARKET: BY FORMULATION, LIFELINE CURVE
FIGURE 25 EUROPE YOGURT MARKET: BY INCLUSION CATEGORY, 2024
FIGURE 26 EUROPE YOGURT MARKET: BY INCLUSION CATEGORY, 2025-2032 (USD MILLION)
FIGURE 27 EUROPE YOGURT MARKET: BY INCLUSION CATEGORY, CAGR (2025-2032)
FIGURE 28 EUROPE YOGURT MARKET: BY INCLUSION CATEGORY, LIFELINE CURVE
FIGURE 29 EUROPE YOGURT MARKET: BY SOURCE, 2024
FIGURE 30 EUROPE YOGURT MARKET: BY SOURCE, 2025-2032 (USD MILLION)
FIGURE 31 EUROPE YOGURT MARKET: BY SOURCE, CAGR (2025-2032)
FIGURE 32 EUROPE YOGURT MARKET: BY SOURCE, LIFELINE CURVE
FIGURE 33 EUROPE YOGURT MARKET: BY FLAVOR, 2024
FIGURE 34 EUROPE YOGURT MARKET: BY FLAVOR, 2025-2032 (USD MILLION)
FIGURE 35 EUROPE YOGURT MARKET: BY FLAVOR, CAGR (2025-2032)
FIGURE 36 EUROPE YOGURT MARKET: BY FLAVOR, LIFELINE CURVE
FIGURE 37 EUROPE YOGURT MARKET: BY FAT CONTENT, 2024
FIGURE 38 EUROPE YOGURT MARKET: BY FAT CONTENT, 2025-2032 (USD MILLION)
FIGURE 39 EUROPE YOGURT MARKET: BY FAT CONTENT, CAGR (2025-2032)
FIGURE 40 EUROPE YOGURT MARKET: BY FAT CONTENT, LIFELINE CURVE
FIGURE 41 EUROPE YOGURT MARKET: BY FORTIFICATION, 2024
FIGURE 42 EUROPE YOGURT MARKET: BY FORTIFICATION, 2025-2032 (USD MILLION)
FIGURE 43 EUROPE YOGURT MARKET: BY FORTIFICATION, CAGR (2025-2032)
FIGURE 44 EUROPE YOGURT MARKET: BY FORTIFICATION, LIFELINE CURVE
FIGURE 45 EUROPE YOGURT MARKET: BY ORGANIC CATEGORY, 2024
FIGURE 46 EUROPE YOGURT MARKET: BY ORGANIC CATEGORY, 2025-2032 (USD MILLION)
FIGURE 47 EUROPE YOGURT MARKET: BY ORGANIC CATEGORY, CAGR (2025-2032)
FIGURE 48 EUROPE YOGURT MARKET: BY ORGANIC CATEGORY, LIFELINE CURVE
FIGURE 49 EUROPE YOGURT MARKET: BY DISTRIBUTION CHANNEL, 2024
FIGURE 50 EUROPE YOGURT MARKET: BY DISTRIBUTION CHANNEL, 2025-2032 (USD MILLION)
FIGURE 51 EUROPE YOGURT MARKET: BY DISTRIBUTION CHANNEL, CAGR (2025-2032)
FIGURE 52 EUROPE YOGURT MARKET: BY DISTRIBUTION CHANNEL, LIFELINE CURVE
FIGURE 53 EUROPE YOGURT MARKET: BY PACKAGING SIZE, 2024
FIGURE 54 EUROPE YOGURT MARKET: BY PACKAGING SIZE, 2025-2032 (USD MILLION)
FIGURE 55 EUROPE YOGURT MARKET: BY PACKAGING SIZE, CAGR (2025-2032)
FIGURE 56 EUROPE YOGURT MARKET: BY PACKAGING SIZE, LIFELINE CURVE
FIGURE 57 EUROPE YOGURT MARKET: BY CLAIM, 2024
FIGURE 58 EUROPE YOGURT MARKET: BY CLAIM, 2025-2032 (USD MILLION)
FIGURE 59 EUROPE YOGURT MARKET: BY CLAIM, CAGR (2025-2032)
FIGURE 60 EUROPE YOGURT MARKET: BY CLAIM, LIFELINE CURVE
FIGURE 61 EUROPE YOGURT MARKET: BY BRAND, 2024
FIGURE 62 EUROPE YOGURT MARKET: BY BRAND, 2025-2032 (USD MILLION)
FIGURE 63 EUROPE YOGURT MARKET: BY BRAND, CAGR (2025-2032)
FIGURE 64 EUROPE YOGURT MARKET: BY BRAND, LIFELINE CURVE
FIGURE 65 EUROPE YOGURT MARKET: BY PRICE RANGE, 2024
FIGURE 66 EUROPE YOGURT MARKET: BY PRICE RANGE, 2025-2032 (USD MILLION)
FIGURE 67 EUROPE YOGURT MARKET: BY PRICE RANGE, CAGR (2025-2032)
FIGURE 68 EUROPE YOGURT MARKET: BY PRICE RANGE, LIFELINE CURVE
FIGURE 69 EUROPE YOGURT MARKET: BY PACKAGING TYPE, 2024
FIGURE 70 EUROPE YOGURT MARKET: BY PACKAGING TYPE, 2025-2032 (USD MILLION)
FIGURE 71 EUROPE YOGURT MARKET: BY PACKAGING TYPE, CAGR (2025-2032)
FIGURE 72 EUROPE YOGURT MARKET: BY PACKAGING TYPE, LIFELINE CURVE
FIGURE 73 EUROPE YOGURT MARKET: SNAPSHOT (2024)
FIGURE 74 EUROPE YOGURT MARKET: COMPANY SHARE 2024 (%)
Europe Yogurt Market, Supply Chain Analysis and Ecosystem Framework
To support market growth and help clients navigate the impact of geopolitical shifts, DBMR has integrated in-depth supply chain analysis into its Europe Yogurt Market research reports. This addition empowers clients to respond effectively to global changes affecting their industries. The supply chain analysis section includes detailed insights such as Europe Yogurt Market consumption and production by country, price trend analysis, the impact of tariffs and geopolitical developments, and import and export trends by country and HSN code. It also highlights major suppliers with data on production capacity and company profiles, as well as key importers and exporters. In addition to research, DBMR offers specialized supply chain consulting services backed by over a decade of experience, providing solutions like supplier discovery, supplier risk assessment, price trend analysis, impact evaluation of inflation and trade route changes, and comprehensive market trend analysis.
Data collection and base year analysis are done using data collection modules with large sample sizes. The stage includes obtaining market information or related data through various sources and strategies. It includes examining and planning all the data acquired from the past in advance. It likewise envelops the examination of information inconsistencies seen across different information sources. The market data is analysed and estimated using market statistical and coherent models. Also, market share analysis and key trend analysis are the major success factors in the market report. To know more, please request an analyst call or drop down your inquiry.
The key research methodology used by DBMR research team is data triangulation which involves data mining, analysis of the impact of data variables on the market and primary (industry expert) validation. Data models include Vendor Positioning Grid, Market Time Line Analysis, Market Overview and Guide, Company Positioning Grid, Patent Analysis, Pricing Analysis, Company Market Share Analysis, Standards of Measurement, Global versus Regional and Vendor Share Analysis. To know more about the research methodology, drop in an inquiry to speak to our industry experts.
Data Bridge Market Research is a leader in advanced formative research. We take pride in servicing our existing and new customers with data and analysis that match and suits their goal. The report can be customized to include price trend analysis of target brands understanding the market for additional countries (ask for the list of countries), clinical trial results data, literature review, refurbished market and product base analysis. Market analysis of target competitors can be analyzed from technology-based analysis to market portfolio strategies. We can add as many competitors that you require data about in the format and data style you are looking for. Our team of analysts can also provide you data in crude raw excel files pivot tables (Fact book) or can assist you in creating presentations from the data sets available in the report.


