Global Quinoa Market
Tamaño del mercado en miles de millones de dólares
Tasa de crecimiento anual compuesta (CAGR) :
% 
 USD
1.08 Billion
USD
2.05 Billion
2024
2032
USD
1.08 Billion
USD
2.05 Billion
2024
2032
| 2025 –2032 | |
| USD 1.08 Billion | |
| USD 2.05 Billion | |
| % | |
|
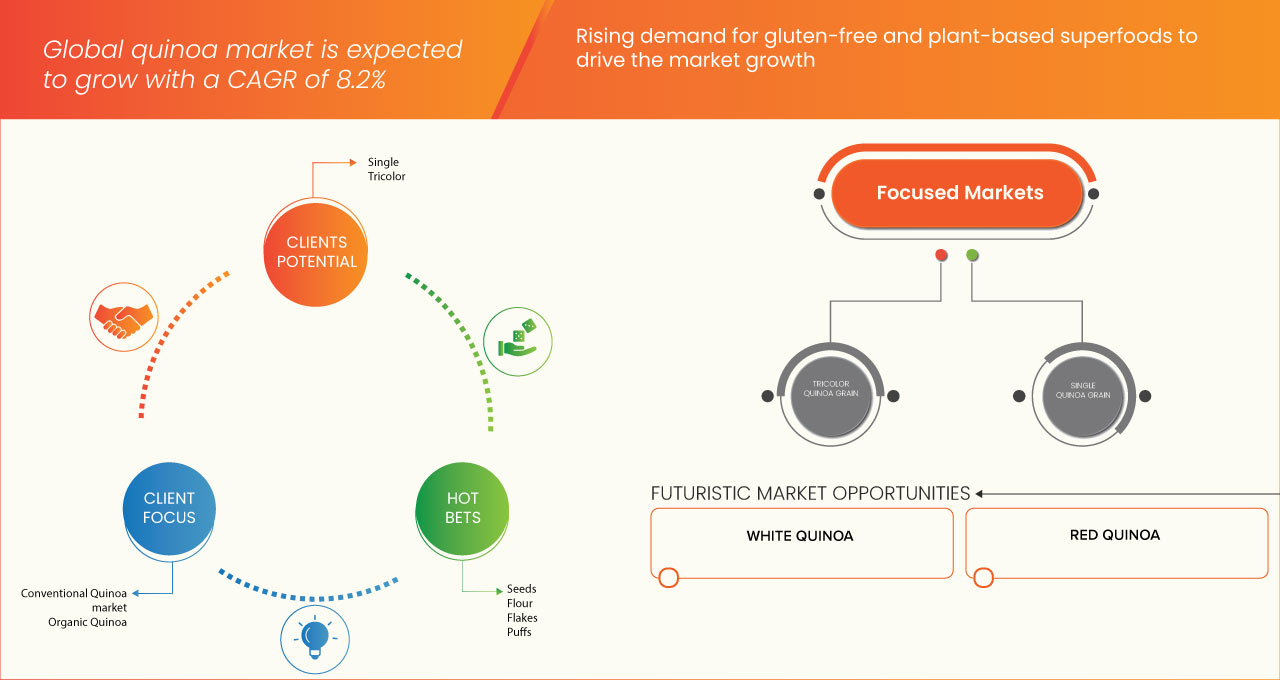
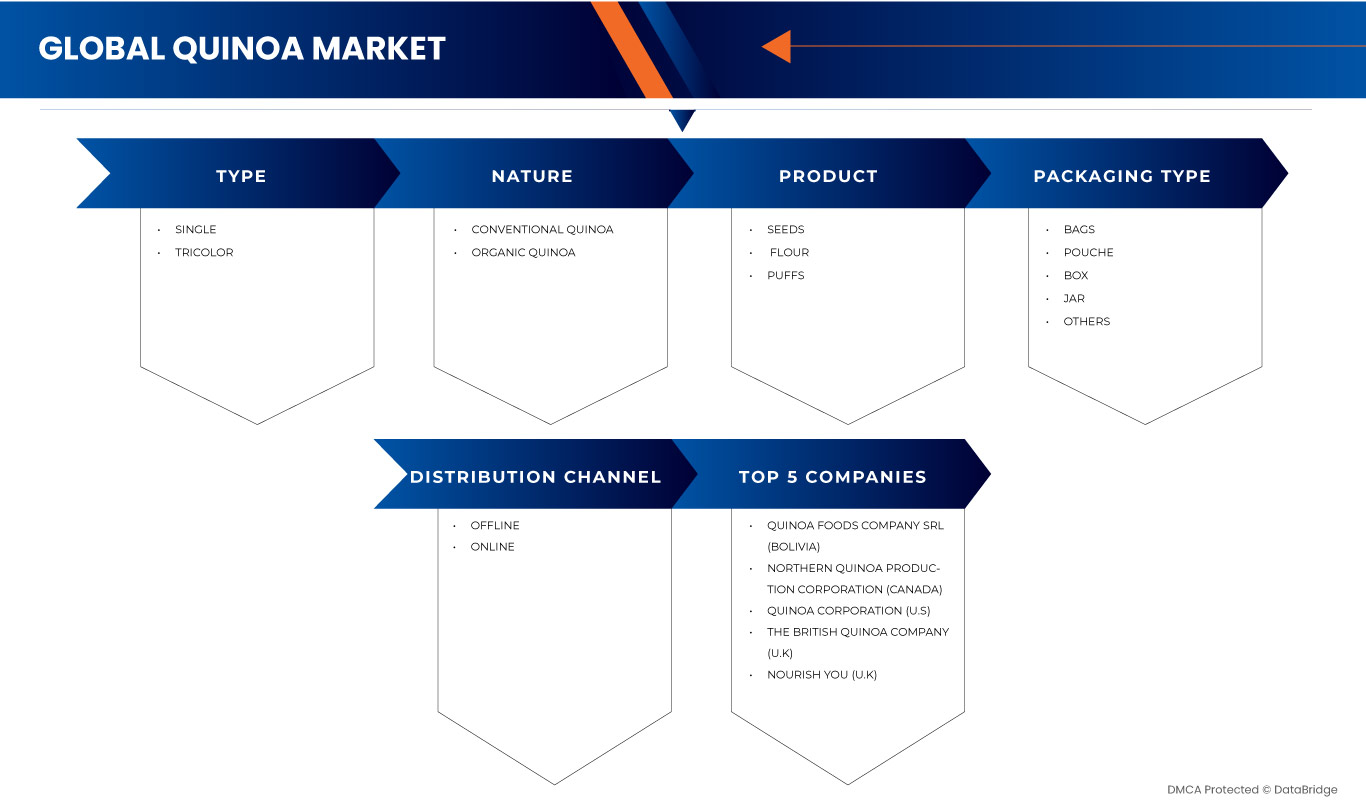
Segmentación del mercado global de quinua: por tipo (monocolor y tricolor), por naturaleza (quinua convencional y orgánica), por producto (semillas, harina, hojuelas y bolitas), por tipo de empaque (bolsas, sobres, cajas, frascos y otros), por canal de distribución (presencial y en línea): tendencias de la industria y pronóstico hasta 2032.
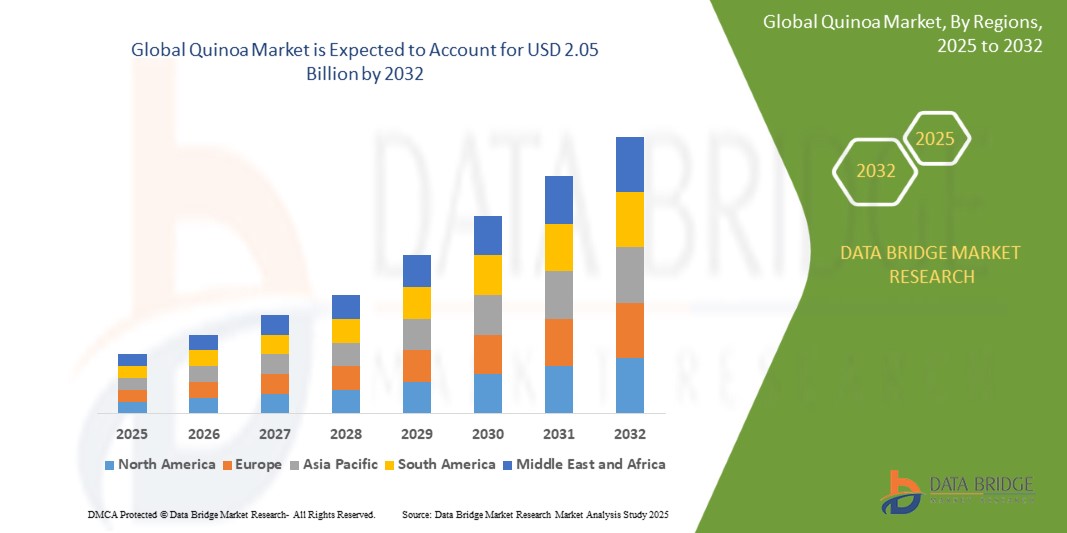
Tamaño del mercado de la quinua
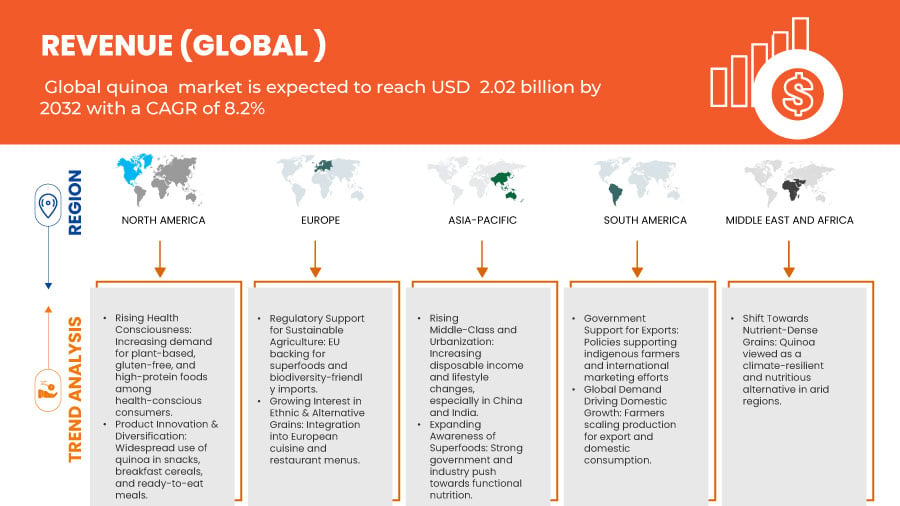
- El mercado mundial de quinua se valoró en USD 1.080 millones en 2024 y se espera que alcance los USD 2.050 millones en 2032.
- Durante el período de pronóstico de 2025 a 2032, es probable que el mercado crezca a una CAGR del 8,2%, impulsado principalmente por la creciente demanda de alimentos sin gluten y de origen vegetal.
- Este crecimiento está impulsado por factores como la creciente conciencia de la salud entre los consumidores urbanos globales y las tendencias de estilos de vida dietéticos veganos y vegetarianos en rápida expansión.
Análisis del mercado de la quinua
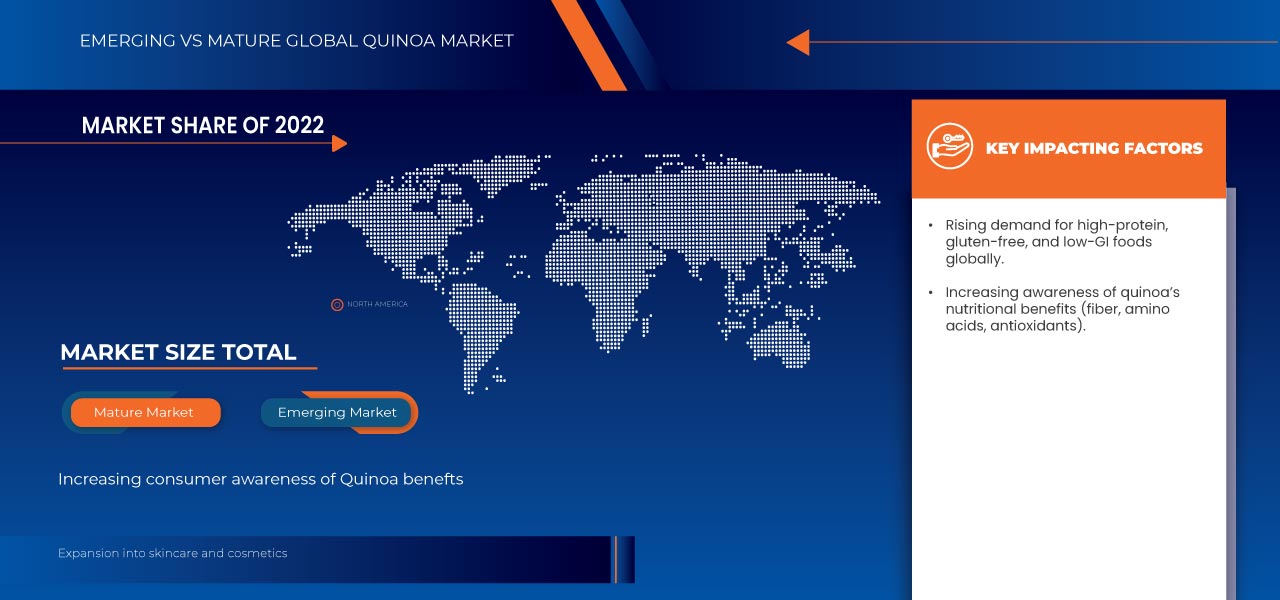
- La quinoa es un pseudocereal rico en nutrientes y sin gluten, derivado de las semillas de la planta Chenopodium quinoa, originaria de la región andina de Sudamérica. Aunque a menudo se utiliza como un grano, técnicamente es una semilla y se valora por su alto contenido proteico, que contiene los nueve aminoácidos esenciales.
- La creciente aplicación de la quinua en productos alimenticios funcionales y fortificados son algunos de los factores impulsores que se espera que impulsen el crecimiento del mercado.
- Se espera que en 2025, América del Norte domine con una participación de mercado del 35,24%, debido a la creciente conciencia sobre la salud, las dietas sin gluten y basadas en plantas, el aumento de la producción nacional, el fuerte crecimiento de las importaciones y los productos innovadores de quinua que impulsan la adopción generalizada por parte del consumidor.
- Se espera que el segmento único domine el mercado con una participación de mercado del 63,08%, debido a la creciente demanda de los consumidores de trazabilidad, autenticidad y calidad superior, a menudo vinculada al abastecimiento ético, la sostenibilidad y las distinciones nutricionales regionales.
Alcance del informe y segmentación del mercado de la quinua
|
Atributos |
Perspectivas clave del mercado de la quinua |
|
Segmentos cubiertos |
|
|
Países cubiertos |
EE. UU., Canadá, México, Alemania, Francia, Reino Unido, Italia, España, Países Bajos, Bélgica, Rusia, Suiza, Polonia, Dinamarca, Noruega, Turquía, Suecia, Resto de Europa, China, India, Japón, Australia, Corea del Sur, Tailandia, Malasia, Indonesia, Filipinas, Singapur, Nueva Zelanda, Resto de Asia-Pacífico, Brasil, Argentina, Resto de Sudamérica, Emiratos Árabes Unidos, Arabia Saudita, Israel, Sudáfrica, Egipto y Resto de Oriente Medio y África. |
|
Actores clave del mercado |
|
|
Oportunidades de mercado |
|
|
Conjuntos de información de datos de valor añadido |
Además de los conocimientos sobre escenarios de mercado como valor de mercado, tasa de crecimiento, segmentación, cobertura geográfica y actores principales, los informes de mercado seleccionados por Data Bridge Market Research también incluyen análisis de importación y exportación, descripción general de la capacidad de producción, análisis del consumo de producción, análisis de tendencias de precios, escenario de cambio climático, análisis de la cadena de suministro, análisis de la cadena de valor, descripción general de materias primas/consumibles, criterios de selección de proveedores, análisis PESTLE, análisis de Porter y marco regulatorio. |
Tendencias del mercado de la quinua
Avances en I+D orientados a la eficiencia agronómica, la mejora nutricional y la innovación en el procesamiento.
- La investigación y el desarrollo (I+D) en el cultivo y procesamiento de la quinua están abordando desafíos clave como la adaptabilidad climática, la variabilidad del rendimiento y las pérdidas poscosecha, desbloqueando un nuevo potencial comercial en mercados emergentes y maduros.
- Las innovaciones en técnicas de mejoramiento están produciendo cultivares de quinua con mejor tolerancia a la sequía, resistencia a la salinidad y resiliencia a las plagas, lo que ayuda a expandir el cultivo más allá de las regiones andinas tradicionales a áreas de África, Asia y Europa.
- La I+D agronómica también está mejorando las características nutricionales de la quinua, como un mayor contenido de proteínas, mayores niveles de lisina y menores concentraciones de saponina, lo que hace que el cultivo sea más deseable para los consumidores preocupados por la salud y para aplicaciones alimentarias especializadas como alimentos para bebés, repostería sin gluten y nutrición deportiva.
- Las innovaciones poscosecha, que incluyen clasificación automatizada, secado a baja temperatura y sistemas de descascarado de precisión, están reduciendo los costos de procesamiento y mejorando la consistencia en la calidad y la vida útil.
- Además, se están explorando modelos integrados de desarrollo de cadenas de valor —que combinan mejoras en las explotaciones agrícolas con la optimización del procesamiento— para aumentar los ingresos de los agricultores y reducir el desperdicio. Las colaboraciones público-privadas, como las que apoyan universidades agrícolas y ONG, están impulsando aún más las iniciativas de I+D en este ámbito.
Dinámica del mercado de la quinua
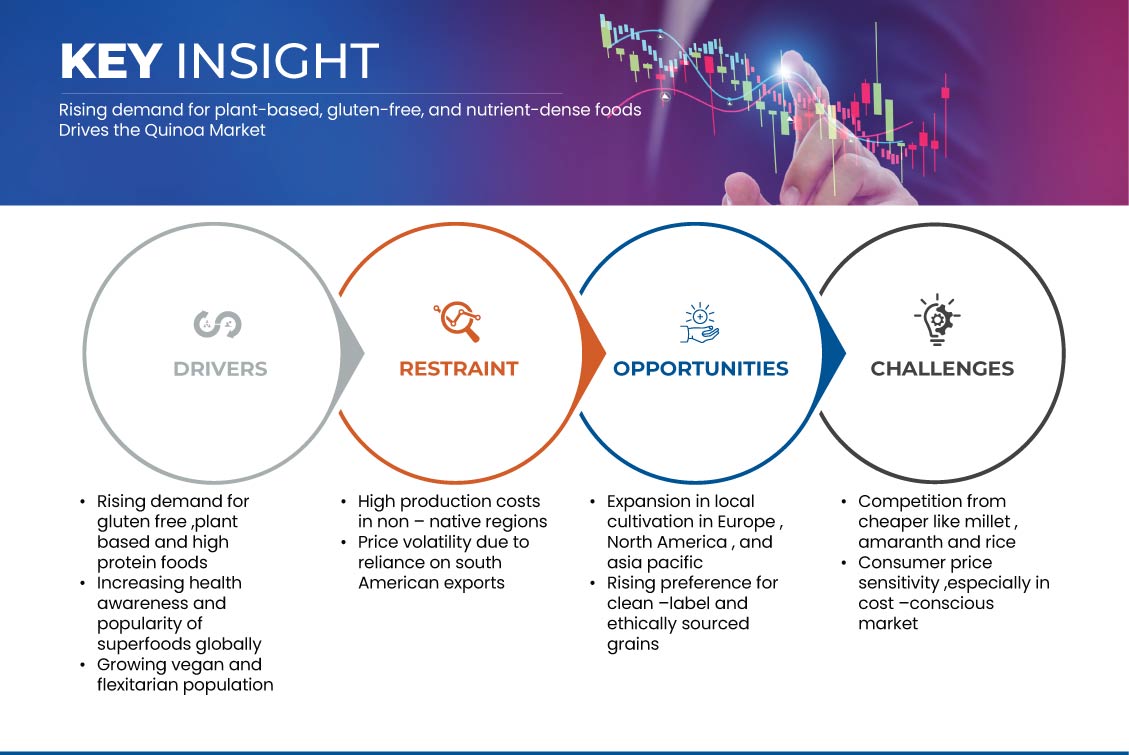
Conductor
“AUMENTO DE LA DEMANDA DE ALIMENTOS SIN GLUTEN Y DE ORIGEN VEGETAL”
- El mercado se ve impulsado significativamente por la creciente tendencia de los consumidores hacia hábitos alimentarios sin gluten y de origen vegetal. La quinoa, al ser un pseudocereal naturalmente libre de gluten, se ha convertido en la alternativa preferida para personas con enfermedad celíaca, intolerancia al gluten o quienes adoptan dietas sin gluten como estilo de vida. Además, su alto contenido proteico, que incluye los nueve aminoácidos esenciales, la posiciona como una fuente superior de proteína vegetal, lo que la hace muy atractiva para vegetarianos, veganos y flexitarianos.
- A medida que crece la conciencia global sobre la salud, el bienestar y la transparencia nutricional, el rico perfil de fibra, vitaminas, minerales y antioxidantes de la quinua se alinea con las preferencias cambiantes de los consumidores preocupados por su salud. El auge de la innovación en alimentos de origen vegetal en categorías como alternativas a la carne, sustitutos de lácteos y snacks funcionales también ha integrado la quinua en aplicaciones comunes, lo que ha mejorado aún más su visibilidad y consumo.
Por ejemplo,
- En septiembre de 2024, según una noticia publicada por la Asociación Estadounidense del Corazón, la quinua fue reconocida como una potencia nutricional moderna, elogiada por su contenido de proteína de origen vegetal y sus propiedades sin gluten, lo que la convierte en una opción dietética ideal para los consumidores conscientes de la salud que buscan hábitos alimenticios equilibrados, libres de alérgenos y sostenibles.
- En marzo de 2024, según un artículo publicado por Medical News Today, la quinua se destacó como un grano rico en nutrientes, sin gluten, rico en proteínas de origen vegetal y aminoácidos esenciales, lo que refuerza su valor en las dietas vegetarianas y veganas y apoya su creciente popularidad entre los consumidores globales conscientes de la salud que buscan una nutrición equilibrada.
Oportunidad
“EXPANSIÓN DEL CULTIVO DE QUINOA EN PAÍSES DE ASIA, ÁFRICA, NORTEAMÉRICA Y EUROPA”
La expansión del cultivo de quinua en regiones no tradicionales como Asia, África, Norteamérica y Europa representa una importante oportunidad para el mercado de la quinua. Cultivada tradicionalmente en las regiones andinas de Sudamérica, su adaptabilidad a diversas condiciones agroecológicas ha permitido su exitosa introducción en diversas geografías. Países como India, China, Kenia, Marruecos, Estados Unidos, Canadá, Francia y Dinamarca han iniciado ensayos o cultivos comerciales de quinua para satisfacer la creciente demanda local y mundial.
Esta diversificación geográfica mitiga los riesgos en la cadena de suministro asociados a la excesiva dependencia de la producción andina, como la volatilidad climática y las perturbaciones socioeconómicas. Además, mejora la seguridad alimentaria regional al introducir un cultivo resiliente y rico en nutrientes, capaz de crecer en suelos semiáridos y con propensión a la salinidad, condiciones cada vez más prevalentes debido al cambio climático.
Por ejemplo,
- En julio de 2023, según un artículo publicado en ResearchGate titulado Desarrollo mundial de prácticas de gestión agronómica para el cultivo de quinua: una revisión sistemática, se descubrió que la quinua se cultivaba con éxito en más de 100 países, incluidas regiones de Asia, África, Europa y América del Norte, lo que destaca su adaptabilidad global y potencial de expansión del mercado.
- En marzo de 2022, según un artículo publicado por Elsevier BV, el cultivo de quinua se ha expandido con éxito a regiones no tradicionales, como Asia, África y Europa, demostrando una alta adaptabilidad a duras condiciones agroecológicas y ofreciendo soluciones prometedoras para la seguridad alimentaria, la resiliencia climática y el desarrollo agrícola sostenible en entornos con recursos limitados.
Restricción/Desafío
INCERTIDUMBRES REGULATORIAS Y COMERCIALES
- El mercado de la quinua se ve notablemente limitado por la evolución de los marcos regulatorios y la incertidumbre comercial que dificulta el comercio internacional fluido. Las regiones importadoras, como la Unión Europea, aplican regulaciones estrictas sobre residuos de plaguicidas, seguridad alimentaria, certificación orgánica, etiquetado y trazabilidad de los productos de quinua. Cumplir con estas leyes requiere una inversión significativa en pruebas, documentación y certificación, lo que afecta de forma desproporcionada a los pequeños y medianos productores y exportadores.
- Además, los acuerdos internacionales como las medidas sanitarias y fitosanitarias (MSF) y los obstáculos técnicos al comercio (OTC) de la OMC permiten a cada país introducir barreras comerciales no arancelarias basadas en la salud y la seguridad públicas, lo que puede llevar a una implementación inconsistente o proteccionista.
Por ejemplo,
- En noviembre de 2020, según un artículo publicado por el Centro para la Promoción de Importaciones de Países en Desarrollo (CBI), los exportadores de quinua enfrentan estrictas regulaciones de la Unión Europea sobre residuos de pesticidas, seguridad alimentaria y certificación orgánica, lo que subraya importantes barreras comerciales y regulatorias para la entrada al mercado y la competitividad a largo plazo en la región.
- En marzo de 2025, según un artículo publicado por Essfeed, las estrictas regulaciones de la Unión Europea sobre los límites de pesticidas y la trazabilidad han impactado significativamente las importaciones de quinua, desafiando a los exportadores de los países en desarrollo a cumplir con los estándares de cumplimiento y contribuyendo a las incertidumbres comerciales en el mercado mundial de la quinua.
Alcance del mercado de la quinua
El mercado mundial de quinua está segmentado en cinco segmentos notables según el tipo, la naturaleza, el producto, el tipo de empaque y el canal de distribución.
Por tipo
Según el tipo, el mercado se segmenta en monocolor y tricolor. En 2025, se espera que el segmento monocolor domine el mercado con una cuota de mercado del 63,08 %. Se espera que alcance los 1260 millones de dólares para 2032, con una tasa de crecimiento anual compuesta (TCAC) del 8,3 % durante el período de pronóstico de 2025 a 2032.
Por naturaleza
En función de la naturaleza, el mercado se segmenta en quinua convencional y quinua orgánica. En 2025, se prevé que el segmento convencional domine el mercado con una cuota de mercado del 92,67 %, debido a la creciente demanda de trazabilidad, autenticidad y calidad premium por parte de los consumidores, a menudo vinculada al abastecimiento ético, la sostenibilidad y las distinciones nutricionales regionales.
Por producto
Según el producto, el mercado se segmenta en semillas, harina, copos y hojuelas. En 2025, se prevé que el segmento de semillas domine el mercado con una cuota de mercado del 69,03 % gracias a sus menores costes de producción, mayor disponibilidad y su idoneidad para el consumo masivo, satisfaciendo así la creciente demanda de los sectores alimentario y minorista.
Por embalaje
Según el tipo de envase, el mercado se segmenta en bolsas, sobres, cajas, frascos y otros. En 2025, se prevé que el segmento de bolsas domine el mercado con una cuota del 45,28 %, gracias a su versatilidad en la cocina, su larga vida útil y la creciente demanda de superalimentos vegetales ricos en nutrientes, tanto en el sector minorista como en el de la restauración.
Por canal de distribución
Según el canal de distribución, el mercado se segmenta en offline y online. En 2025, se prevé que el segmento offline domine el mercado con una cuota de mercado del 73,88 %, ya que ofrece soluciones de envasado prácticas, rentables y ecológicas, dirigidas a compradores a granel, minoristas y consumidores con conciencia ambiental que buscan opciones de almacenamiento sostenibles.
Análisis regional del mercado de la quinua
América del norte
Se espera que en 2025, América del Norte domine con una participación de mercado del 35,24%, debido a la creciente conciencia sobre la salud, las dietas sin gluten y basadas en plantas, el aumento de la producción nacional, el fuerte crecimiento de las importaciones y los productos innovadores de quinua que impulsan la adopción generalizada por parte del consumidor.
Perspectiva del mercado de la quinua en EE. UU.
El mercado estadounidense de la quinua está en constante crecimiento gracias a la creciente concienciación sobre la salud, las tendencias en dietas basadas en plantas y la demanda de alimentos sin gluten. El aumento de la producción nacional y la diversidad de aplicaciones del producto en snacks, ensaladas y cereales impulsan aún más la expansión del mercado en los sectores minorista y de servicios de alimentación.
Europa
Europa representó una importante cuota de ingresos del 27,63 % en 2024, impulsada por la creciente demanda de alimentos orgánicos, ricos en proteínas y sin gluten. Países como Francia, Alemania y el Reino Unido lideran el consumo, gracias a la preocupación por la salud de los consumidores y al aumento de las importaciones procedentes de Latinoamérica y de las iniciativas de cultivo local.
Perspectivas del mercado de la quinua en el Reino Unido
El mercado británico de quinua está impulsado por el creciente veganismo, la preferencia por las etiquetas limpias y la demanda de granos ricos en proteínas. Los consumidores preocupados por su salud y la fuerte presencia minorista en las categorías de productos orgánicos y superalimentos están impulsando las importaciones y fomentando el cultivo nacional de quinua a pequeña escala.
Perspectivas del mercado de la quinua en Alemania
El mercado alemán de quinoa está en crecimiento gracias a su enfoque en dietas sostenibles, vegetales y ricas en proteínas. La fuerte demanda en supermercados ecológicos y cadenas de alimentación saludable, junto con el aumento de lanzamientos de productos veganos, está impulsando el consumo de quinoa, especialmente entre los grupos demográficos urbanos y aquellos que buscan una vida activa.
Asia-Pacífico
La región Asia-Pacífico representará el 21,56 % del mercado en 2024, impulsada por la creciente concienciación sobre la salud, el aumento de los ingresos de la clase media y la demanda de superalimentos funcionales. Países como China, India, Japón y Australia están experimentando un aumento en las importaciones de quinua, mientras que el cultivo local está emergiendo en segmentos nicho de la salud.
Perspectivas del mercado de la quinua en Japón
El mercado japonés de la quinua se está expandiendo debido al creciente interés en dietas bajas en carbohidratos y altas en proteínas, así como en alimentos funcionales. El envejecimiento de la población y la creciente demanda de productos sin gluten y aptos para diabéticos impulsan el uso de la quinua en cereales, bebidas y platos preparados saludables.
Perspectivas del mercado de la quinua en China
El mercado chino de quinua está en constante crecimiento, impulsado por el cultivo respaldado por el gobierno en regiones como Qinghai y Gansu. La creciente atención de los consumidores a la nutrición, el control de peso y las tendencias de salud occidentales está impulsando la demanda de quinua en snacks, alimentos saludables y categorías premium de venta al por menor.
Cuota de mercado de la quinua
El panorama competitivo del mercado ofrece detalles por competidor. Se incluye información general de la empresa, sus estados financieros, ingresos generados, potencial de mercado, inversión en investigación y desarrollo, nuevas iniciativas de mercado, presencia global, plantas de producción, capacidad de producción, fortalezas y debilidades de la empresa, lanzamiento de productos, alcance y variedad de productos, y dominio de las aplicaciones. Los datos anteriores se refieren únicamente al enfoque de mercado de las empresas.
Los principales líderes del mercado que operan en el mercado son:
- COMPAÑÍA DE ALIMENTOS QUINOA SRL
- CORPORACIÓN DE PRODUCCIÓN DE QUINUA DEL NORTE
- Corporación de Quinoa
- La Compañía Británica de Quinoa
- Nutrirte
- Tattva orgánico
- Industrias Agropecuarias Adinath
- SPA SARCHIO
- LA COMIDA DE AARY
- MOLINOS ARDIENTES
- Appkin Agro Private Limited
- Elworld Orgánico
- Apex Internacional
- SHANTILAL E HIJOS HUF
- Industrias Vedaliya LLP.
- Granjas Shiloh
- COMPAÑÍA ROYAL NUT
- MAATITATVA AGRO INDUSTRIES PRIVATE LIMITED
- Industrias agropecuarias de desarrollo
- Productos puros
- Alimentos ecológicos alterados
- Irupana
Últimos avances en el mercado mundial de la quinua
- En febrero de 2024, la firma de inversión Trek One Capital completó la adquisición de Alter Eco Foods, la marca orgánica premium conocida por su quinoa, granola, chocolate y trufas. La operación busca acelerar el crecimiento de su gama de snacks premium y ampliar sus canales de distribución.
- En mayo de 2025, Mehrotra Consumer Products presentó su “Quinoa orgánica” en la Feria de Alimentos Saudita en Riad, destacando su superalimento sin gluten, rico en proteínas y antioxidantes ante los compradores internacionales.
SKU-
Obtenga acceso en línea al informe sobre la primera nube de inteligencia de mercado del mundo

- Panel de análisis de datos interactivo
- Panel de análisis de empresas para oportunidades con alto potencial de crecimiento
- Acceso de analista de investigación para personalización y consultas
- Análisis de la competencia con panel interactivo
- Últimas noticias, actualizaciones y análisis de tendencias
- Aproveche el poder del análisis de referencia para un seguimiento integral de la competencia
Tabla de contenido
1 INTRODUCCIÓN
1.1 OBJETIVOS DEL ESTUDIO
1.2 DEFINICIÓN DE MERCADO
1.3 INFORMACIÓN GENERAL
1.4 LIMITACIONES
1.5 MERCADOS CUBIERTOS
2 SEGMENTACIÓN DEL MERCADO
2.1 MERCADOS CUBIERTOS
2.2 ÁMBITO GEOGRÁFICO
2,3 AÑOS CONSIDERADOS PARA EL ESTUDIO
2.4 MONEDA Y PRECIOS
2.5 MODELO DE VALIDACIÓN DE DATOS TRÍPODE DBMR
2.6 MODELADO MULTIVARIADO
2.7 ENTREVISTAS PRINCIPALES CON LÍDERES DE OPINIÓN CLAVE
2.8 CUADRÍCULA DE POSICIÓN DE MERCADO DBMR
2.9 ANÁLISIS DE LA PARTICIPACIÓN DE LOS PROVEEDORES
2.1 FUENTES SECUNDARIAS
2.11 SUPUESTOS
3 RESUMEN EJECUTIVO
4 INFORMACIÓN PREMIUM
4.1 ANÁLISIS DE PRECIOS
4.2 DESGLOSE DEL ANÁLISIS DE COSTOS DEL MERCADO MUNDIAL DE LA QUINUA
4.3 FACTORES QUE AFECTAN LA DECISIÓN DE COMPRA
4.3.1 PRECIO
4.3.2 CALIDAD DEL PRODUCTO
4.3.3 REPUTACIÓN DE LA MARCA
4.3.4 PUBLICIDAD Y PROMOCIONES
4.3.5 DISPONIBILIDAD DEL PRODUCTO
4.3.6 ACCESIBILIDAD FINANCIERA
4.3.7 RECOMENDACIONES DE PARES Y EXPERTOS
4.4 IMPACTO DE LA DESACELERACIÓN ECONÓMICA EN EL MERCADO MUNDIAL DE LA QUINUA
4.4.1 IMPACTO DEL PRECIO
4.4.2 IMPACTO EN LA CADENA DE SUMINISTRO
4.4.3 IMPACTO EN EL ENVÍO
4.4.4 IMPACTO EN LA DEMANDA
4.4.5 IMPACTO EN LAS DECISIONES ESTRATÉGICAS
4.5 ANÁLISIS DEL ECOSISTEMA INDUSTRIA
4.5.1 EMPRESAS DESTACADAS
4.5.2 PEQUEÑAS Y MEDIANAS EMPRESAS
4.5.3 USUARIOS FINALES
4.6 SEGUIMIENTO DE INNOVACIÓN Y ANÁLISIS ESTRATÉGICO
4.6.1 ANÁLISIS DE GRANDES ACUERDOS Y ALIANZAS ESTRATÉGICAS
4.6.1.1 EMPRESAS CONJUNTAS
4.6.1.2 FUSIONES Y ADQUISICIONES
4.6.1.3 LICENCIAS Y ASOCIACIONES
4.6.1.4 COLABORACIONES TECNOLÓGICAS
4.6.1.5 DESINVERSIONES ESTRATÉGICAS
4.6.2 NÚMERO DE PRODUCTOS EN DESARROLLO
4.6.3 ETAPA DE DESARROLLO
4.6.4 CRONOGRAMAS E HITOS
4.6.5 ESTRATEGIAS Y METODOLOGÍAS DE INNOVACIÓN
4.6.6 EVALUACIÓN Y MITIGACIÓN DE RIESGOS
4.6.7 PERSPECTIVAS FUTURAS
4.7 CALIDAD Y RESISTENCIA DE LA PATENTE
4.8 FAMILIAS DE PATENTES
4.8.1 LICENCIAS Y COLABORACIONES
4.8.1.1 PANORAMA DE PATENTES DE EMPRESAS
4.8.1.2 PANORAMA DE PATENTES DE LA REGIÓN
4.8.1.3 ESTRATEGIA Y GESTIÓN DE LA PROPIEDAD INTELECTUAL
4.8.2 ANÁLISIS DE PATENTES
4.8.3 COMPORTAMIENTO DE COMPRA DEL CONSUMIDOR
4.9 ESCENARIO DE ADOPCIÓN DEL PRODUCTO
4.9.1 PENETRACIÓN DEL SEGMENTO DE CONSUMIDORES
4.9.2 ADOPCIÓN INDUSTRIAL Y DE SERVICIOS DE ALIMENTOS
4.9.3 EXPANSIÓN GEOGRÁFICA
4.9.4 BARRERAS A LA ADOPCIÓN
4.1 ANÁLISIS DE ABASTECIMIENTO DE MATERIA PRIMA
4.10.1 MATERIA PRIMA CLAVE: SEMILLAS DE QUINOA
4.10.2 PRINCIPALES PAÍSES PRODUCTORES DE QUINUA
4.10.3 CANALES DE ABASTECIMIENTO
4.10.4 CERTIFICACIONES Y ESTÁNDARES DE CALIDAD
4.10.5 DESAFÍOS EN EL ABASTECIMIENTO DE MATERIA PRIMA
4.10.6 TENDENCIAS EN LA ESTRATEGIA DE ABASTECIMIENTO
4.11 ANÁLISIS DE LA CADENA DE SUMINISTRO
4.11.1 DESCRIPCIÓN GENERAL
4.11.2 ESCENARIO DE COSTOS LOGÍSTICOS
4.11.3 IMPORTANCIA DE LOS PROVEEDORES DE SERVICIOS LOGÍSTICOS
5 ARANCELES Y SU IMPACTO EN EL MERCADO
5.1 TASAS ARANCELARIAS ACTUALES EN LOS MERCADOS DE LOS 5 PAÍSES PRINCIPALES
5.2 PERSPECTIVAS: PRODUCCIÓN LOCAL VS. DEPENDENCIA DE LAS IMPORTACIONES
5.3 DINÁMICA DE LOS CRITERIOS DE SELECCIÓN DE PROVEEDORES
5.4 IMPACTO EN LA CADENA DE SUMINISTRO
5.4.1 ADQUISICIÓN DE MATERIA PRIMA
5.4.2 FABRICACIÓN Y PRODUCCIÓN
5.4.3 LOGÍSTICA Y DISTRIBUCIÓN
5.4.4 PRECIOS DE LANZAMIENTO Y POSICIÓN DEL MERCADO
5.5 PARTICIPANTES DE LA INDUSTRIA: ACCIONES PROACTIVAS
5.5.1 OPTIMIZACIÓN DE LA CADENA DE SUMINISTRO
5.5.2 ESTABLECIMIENTOS DE EMPRESAS CONJUNTAS
5.6 IMPACTO EN LOS PRECIOS
5.7 INCLINACIÓN REGULADORA
5.7.1 SITUACIÓN GEOPOLÍTICA
5.7.2 ASOCIACIONES COMERCIALES ENTRE PAÍSES
5.7.2.1 TRATADOS DE LIBRE COMERCIO
5.7.2.2 ESTABLECIMIENTOS DE LA ALIANZA
5.7.3 ACREDITACIÓN DE ESTATUS (INCLUIDA LA NMF)
5.7.4 CURSO DE CORRECCIÓN DOMÉSTICA
5.7.4.1 ESQUEMAS DE INCENTIVOS PARA IMPULSAR LA PRODUCCIÓN
5.7.4.2 ESTABLECIMIENTO DE ZONAS ECONÓMICAS ESPECIALES / PARQUES INDUSTRIALES
6 COBERTURA REGLAMENTARIA
7 DESCRIPCIÓN GENERAL DEL MERCADO
7.1 CONDUCTOR
7.1.1 AUMENTO DE LA DEMANDA DE ALIMENTOS SIN GLUTEN Y DE ORIGEN VEGETAL
7.1.2 AUMENTAR LA CONCIENCIACIÓN SOBRE LA SALUD ENTRE LOS CONSUMIDORES URBANOS GLOBALES
7.1.3 TENDENCIAS DE ESTILO DE VIDA ALIMENTICIO VEGANO Y VEGETARIANO EN RÁPIDA EXPANSIÓN
7.1.4 APLICACIÓN CRECIENTE DE LA QUINOA EN PRODUCTOS ALIMENTICIOS FUNCIONALES Y FORTIFICADOS
7.2 RESTRICCIONES
7.2.1 LOS ALTOS COSTOS DE PRODUCCIÓN LIMITAN LA EXPANSIÓN COMERCIAL A GRAN ESCALA
7.2.2 LA EXPANSIÓN DEL MONOCULTIVO DE QUINUA CONDUCE A LA DEGRADACIÓN DEL SUELO, LA PÉRDIDA DE BIODIVERSIDAD Y LA SUSCEPTIBILIDAD AL ESTRÉS CLIMÁTICO
7.3 OPORTUNIDADES
7.3.1 EXPANSIÓN DEL CULTIVO DE QUINUA EN PAÍSES DE ASIA, ÁFRICA, AMÉRICA DEL NORTE Y EUROPA
7.3.2 APOYO GUBERNAMENTAL E INCENTIVOS POLÍTICOS QUE PROMUEVEN A LOS AGRICULTORES A ADOPTAR LA QUINUA COMO UN CULTIVO RESILIENTE AL CLIMA
7.3.3 AUMENTO DE LA POPULARIDAD DE LAS PRÁCTICAS DE AGRICULTURA ORGÁNICA Y SOSTENIBLE
7.4 DESAFÍOS
7.4.1 INCERTIDUMBRES REGULATORIAS Y COMERCIALES
7.4.2 INCONSISTENCIAS DE CALIDAD EN LAS CADENAS INTERNACIONALES DE SUMINISTRO DE QUINUA
8 MERCADO MUNDIAL DE QUINUA, POR TIPO
8.1 DESCRIPCIÓN GENERAL
8.2 SIMPLE
8.3 TRICOLOR
9 MERCADO MUNDIAL DE QUINOA, POR PRODUCTO
9.1 INFORMACIÓN GENERAL
9.2 SEMILLAS
9.3 HARINA
9.4 COPOS
9.5 bocanadas
10 MERCADO MUNDIAL DE QUINOA, POR TIPO DE ENVASE
10.1 INFORMACIÓN GENERAL
10.2 BOLSAS
10.3 BOLSAS
10.4 CAJA
10,5 tarro
10.6 OTROS
11 MERCADO MUNDIAL DE LA QUINOA, POR NATURALEZA
11.1 INFORMACIÓN GENERAL
11.2 QUINUA CONVENCIONAL
11.3 QUINOA ORGÁNICA
12 MERCADO MUNDIAL DE QUINOA, POR CANAL DE DISTRIBUCIÓN
12.1 INFORMACIÓN GENERAL
12.2 SIN CONEXIÓN
12.3 EN LÍNEA
13 MERCADO MUNDIAL DE QUINUA, POR REGIÓN
13.1 INFORMACIÓN GENERAL
13.2 AMÉRICA DEL NORTE
13.2.1 EE. UU.
13.2.2 CANADÁ
13.2.3 MÉXICO
13.3 EUROPA
13.3.1 ALEMANIA
13.3.2 FRANCIA
13.3.3 Reino Unido
13.3.4 ITALIA
13.3.5 ESPAÑA
13.3.6 PAÍSES BAJOS
13.3.7 BÉLGICA
13.3.8 RUSIA
13.3.9 SUIZA
13.3.10 POLONIA
13.3.11 DINAMARCA
13.3.12 NORUEGA
13.3.13 TURQUÍA
13.3.14 SUECIA
13.3.15 RESTO DE EUROPA
13.4 ASIA-PACÍFICO
13.4.1 CHINA
13.4.2 INDIA
13.4.3 JAPÓN
13.4.4 AUSTRALIA
13.4.5 COREA DEL SUR
13.4.6 TAILANDIA
13.4.7 MALASIA
13.4.8 INDONESIA
13.4.9 FILIPINAS
13.4.10 SINGAPUR
13.4.11 NUEVA ZELANDA
13.4.12 RESTO DE ASIA-PACÍFICO
13.5 SUDAMÉRICA
13.5.1 BRASIL
13.5.2 ARGENTINA
13.5.3 RESTO DE SUDAMÉRICA
13.6 ORIENTE MEDIO Y ÁFRICA
13.6.1 Emiratos Árabes Unidos
13.6.2 ARABIA SAUDITA
13.6.3 ISRAEL
13.6.4 SUDÁFRICA
13.6.5 EGIPTO
13.6.6 RESTO DE ORIENTE MEDIO Y ÁFRICA
14 PANORAMA EMPRESARIAL DEL MERCADO GLOBAL DE LA QUINOA
14.1 ANÁLISIS DE ACCIONES DE LA EMPRESA: GLOBAL
14.2 ANÁLISIS DE ACCIONES DE EMPRESAS: AMÉRICA DEL NORTE
14.3 ANÁLISIS DE ACCIONES DE EMPRESAS: EUROPA
14.4 ANÁLISIS DE ACCIONES DE LA EMPRESA: ASIA-PACÍFICO
15 ANÁLISIS FODA
16 PERFIL DE LA EMPRESA
16.1 MOLINOS ARDIENTES
16.1.1 INSTANTÁNEA DE LA EMPRESA
16.1.2 ANÁLISIS DE LAS ACCIONES DE LA EMPRESA
16.1.3 PORTAFOLIO DE PRODUCTOS
16.1.4 DESARROLLO RECIENTE
16.2 INDUSTRIAS AGROADMINISTRATIVAS
16.2.1 INSTANTÁNEA DE LA EMPRESA
16.2.2 ANÁLISIS DE LAS ACCIONES DE LA EMPRESA
16.2.3 PORTAFOLIO DE PRODUCTOS
16.2.4 DESARROLLO RECIENTE
16.3 NUTRE TU
16.3.1 INSTANTÁNEA DE LA EMPRESA
16.3.2 ANÁLISIS DE LAS ACCIONES DE LA EMPRESA
16.3.3 PORTAFOLIO DE PRODUCTOS
16.3.4 DESARROLLOS RECIENTES
16.4 APEX INTERNACIONAL
16.4.1 INSTANTÁNEA DE LA EMPRESA
16.4.2 ANÁLISIS DE LAS ACCIONES DE LA EMPRESA
16.4.3 PORTAFOLIO DE PRODUCTOS
16.4.4 DESARROLLO RECIENTE
16.5 LA COMIDA DE AARY
16.5.1 INSTANTÁNEA DE LA EMPRESA
16.5.2 ANÁLISIS DE LAS ACCIONES DE LA EMPRESA
16.5.3 PORTAFOLIO DE PRODUCTOS
16.5.4 DESARROLLO RECIENTE
16.6 ALIMENTOS ALTER ECO
16.6.1 INSTANTÁNEA DE LA EMPRESA
16.6.2 PORTAFOLIO DE PRODUCTOS
16.6.3 DESARROLLO RECIENTE
16.7 APPKIN AGRO PRIVATE LIMITED
16.7.1 INSTANTÁNEA DE LA EMPRESA
16.7.2 PORTAFOLIO DE PRODUCTOS
16.7.3 DESARROLLO RECIENTE
16.8 DEV AGRO INDUSTRIAS
16.8.1 INSTANTÁNEA DE LA EMPRESA
16.8.2 PORTAFOLIO DE PRODUCTOS
16.8.3 DESARROLLO RECIENTE
16.9 ELWORLD ORGÁNICO
16.9.1 INSTANTÁNEA DE LA EMPRESA
16.9.2 PORTAFOLIO DE PRODUCTOS
16.9.3 DESARROLLO RECIENTE
16.1 IRUPANA ANDEN ALIMENTOS ORGÁNICOS SA
16.10.1 INSTANTÁNEA DE LA EMPRESA
16.10.2 PORTAFOLIO DE PRODUCTOS
16.10.3 DESARROLLO RECIENTE
16.11 MAATITATVA AGRO INDUSTRIES PRIVATE LIMITED
16.11.1 INSTANTÁNEA DE LA EMPRESA
16.11.2 PORTAFOLIO DE PRODUCTOS
16.11.3 DESARROLLO RECIENTE
16.12 CORPORACIÓN DE PRODUCCIÓN DE QUINUA DEL NORTE
16.12.1 INSTANTÁNEA DE LA EMPRESA
16.12.2 PORTAFOLIO DE PRODUCTOS
16.12.3 DESARROLLOS RECIENTES
16.13 TATTVA ORGÁNICO
16.13.1 INSTANTÁNEA DE LA EMPRESA
16.13.2 PORTAFOLIO DE PRODUCTOS
16.13.3 DESARROLLO RECIENTE/NOTICIAS
16.14 PRODUCTOS PUROS
16.14.1 INSTANTÁNEA DE LA EMPRESA
16.14.2 PORTAFOLIO DE PRODUCTOS
16.14.3 DESARROLLO RECIENTE
16.15 CORPORACIÓN DE QUINOA
16.15.1 INSTANTÁNEA DE LA EMPRESA
16.15.2 PORTAFOLIO DE PRODUCTOS
16.15.3 DESARROLLOS RECIENTES
16.16 COMPAÑÍA DE ALIMENTOS QUINOA SRL
16.16.1 INSTANTÁNEA DE LA EMPRESA
16.16.2 PORTAFOLIO DE PRODUCTOS
16.16.3 DESARROLLOS RECIENTES
16.17 COMPAÑÍA ROYAL NUT.
16.17.1 INSTANTÁNEA DE LA EMPRESA
16.17.2 PORTAFOLIO DE PRODUCTOS
16.17.3 DESARROLLO RECIENTE
16.18 SARCHIO SPA
16.18.1 INSTANTÁNEA DE LA EMPRESA
16.18.2 PORTAFOLIO DE PRODUCTOS
16.18.3 DESARROLLO RECIENTE
16.19 SHANTILAL & SONS HUF
16.19.1 INSTANTÁNEA DE LA EMPRESA
16.19.2 PORTAFOLIO DE PRODUCTOS
16.19.3 DESARROLLO RECIENTE
16.2 GRANJAS SHILOH
16.20.1 INSTANTÁNEA DE LA EMPRESA
16.20.2 PORTAFOLIO DE PRODUCTOS
16.20.3 DESARROLLOS RECIENTES
16.21 LA COMPAÑÍA BRITÁNICA DE QUINOA
16.21.1 INSTANTÁNEA DE LA EMPRESA
16.21.2 PORTAFOLIO DE PRODUCTOS
16.21.3 DESARROLLOS RECIENTES
16.22 VEDALIYA INDUSTRIES LLP.
16.22.1 INSTANTÁNEA DE LA EMPRESA
16.22.2 PORTAFOLIO DE PRODUCTOS
16.22.3 DESARROLLO RECIENTE
17 CUESTIONARIO
18 INFORMES RELACIONADOS
Lista de Tablas
CUADRO 1 COBERTURA REGULATORIA
TABLA 2 MERCADO MUNDIAL DE QUINUA, POR TIPO, 2018-2032 (MILES DE USD)
CUADRO 3 MERCADO MUNDIAL DE QUINUA, POR TIPO, 2018-2032 (KILOTONELADAS)
TABLA 4 MERCADO MUNDIAL DE QUINUA, POR TIPO, 2018-2032 (MILES DE USD)
TABLA 5 MERCADO MUNDIAL DE QUINUA, POR REGIÓN, 2018-2032 (MILES DE USD)
TABLA 6 MERCADO MUNDIAL DE QUINUA TRICOLOR, POR REGIÓN, 2018-2032 (MILES DE USD)
TABLA 7 MERCADO MUNDIAL DE QUINUA, POR PRODUCTO, 2018-2032 (MILES DE USD)
TABLA 8 MERCADO MUNDIAL DE SEMILLAS DE QUINUA, POR REGIÓN, 2018-2032 (MILES DE USD)
TABLA 9 MERCADO MUNDIAL DE HARINA DE QUINUA, POR REGIÓN, 2018-2032 (MILES DE USD)
TABLA 10 MERCADO MUNDIAL DE HOJUELAS DE QUINUA, POR REGIÓN, 2018-2032 (MILES DE USD)
TABLA 11 MERCADO MUNDIAL DE SOPAS DE QUINUA, POR REGIÓN, 2018-2032 (MILES DE USD)
TABLA 12 MERCADO MUNDIAL DE QUINUA, POR TIPO DE ENVASE, 2018-2032 (MILES DE USD)
TABLA 13 BOLSAS MUNDIALES EN EL MERCADO DE QUINUA, POR REGIÓN, 2018-2032 (MILES DE USD)
TABLA 14 MERCADO MUNDIAL DE BOLSAS DE QUINUA, POR REGIÓN, 2018-2032 (MILES DE USD)
TABLA 15 CUADRO GLOBAL DEL MERCADO DE QUINUA, POR REGIÓN, 2018-2032 (MILES DE USD)
TABLA 16 MERCADO MUNDIAL DE QUINUA EN FRASCO, POR REGIÓN, 2018-2032 (MILES DE USD)
TABLA 17 OTROS MERCADOS GLOBALES DE QUINUA, POR REGIÓN, 2018-2032 (MILES DE USD)
TABLA 18 MERCADO MUNDIAL DE QUINUA, POR NATURALEZA, 2018-2032 (MILES DE USD)
TABLA 19 MERCADO MUNDIAL DE QUINUA CONVENCIONAL, POR REGIÓN, 2018-2032 (MILES DE USD)
TABLA 20 MERCADO MUNDIAL DE QUINUA ORGÁNICA, POR REGIÓN, 2018-2032 (MILES DE USD)
TABLA 21 MERCADO MUNDIAL DE QUINUA, POR CANAL DE DISTRIBUCIÓN, 2018-2032 (MILES DE USD)
TABLA 22 MERCADO GLOBAL DE QUINUA SIN CONEXIÓN, POR CANAL DE DISTRIBUCIÓN, 2018-2032 (MILES DE USD)
TABLA 23 MERCADO GLOBAL DE QUINUA SIN CONEXIÓN, POR REGIÓN, 2018-2032 (MILES DE USD)
TABLA 24 MERCADO GLOBAL DE QUINUA EN LÍNEA, POR CANAL DE DISTRIBUCIÓN, 2018-2032 (MILES DE USD)
TABLA 25 MERCADO MUNDIAL DE QUINUA EN LÍNEA, POR REGIÓN, 2018-2032 (MILES DE USD)
TABLA 26 MERCADO MUNDIAL DE QUINUA, POR REGIÓN, 2018-2032 (MILES DE USD)
TABLA 27 MERCADO DE QUINUA EN AMÉRICA DEL NORTE, POR PAÍS, 2018-2032 (MILES DE USD)
TABLA 28 MERCADO DE QUINUA EN AMÉRICA DEL NORTE, POR TIPO, 2018-2032 (MILES DE USD)
TABLA 29 MERCADO DE QUINUA EN AMÉRICA DEL NORTE, POR TIPO, 2018-2032 (MILES DE USD) (KILOTONELADAS)
TABLA 30 MERCADO ÚNICO DE QUINUA EN AMÉRICA DEL NORTE, POR TIPO, 2018-2032 (MILES DE USD)
TABLA 31 MERCADO DE QUINUA EN AMÉRICA DEL NORTE, POR NATURALEZA, 2018-2032 (MILES DE USD)
TABLA 32 MERCADO DE QUINUA EN AMÉRICA DEL NORTE, POR PRODUCTO, 2018-2032 (MILES DE USD)
TABLA 33 MERCADO DE QUINUA EN AMÉRICA DEL NORTE, POR TIPO DE EMPAQUE, 2018-2032 (MILES DE USD)
TABLA 34 MERCADO DE QUINUA EN AMÉRICA DEL NORTE, POR CANAL DE DISTRIBUCIÓN 2018-2032 (MILES DE USD)
TABLA 35 NORTE AMÉRICA FUERA DE LÍNEA EN EL MERCADO DE QUINUA, POR CANAL DE DISTRIBUCIÓN 2018-2032 (MILES DE USD)
TABLA 36 MERCADO DE QUINUA EN LÍNEA EN AMÉRICA DEL NORTE, POR CANAL DE DISTRIBUCIÓN 2018-2032 (MILES DE USD)
TABLA 37 MERCADO DE QUINUA EN ESTADOS UNIDOS, POR TIPO, 2018-2032 (MILES DE USD)
TABLA 38 MERCADO DE QUINUA EN ESTADOS UNIDOS, POR TIPO, 2018-2032 (MILES DE USD) (KILOTONELADAS)
TABLA 39 MERCADO DE QUINUA EN ESTADOS UNIDOS, POR TIPO, 2018-2032 (MILES DE USD)
TABLA 40 MERCADO DE QUINUA EN ESTADOS UNIDOS, POR NATURALEZA, 2018-2032 (MILES DE USD)
TABLA 41 MERCADO DE QUINUA EN ESTADOS UNIDOS, POR PRODUCTO, 2018-2032 (MILES DE USD)
TABLA 42 MERCADO DE QUINUA EN ESTADOS UNIDOS, POR TIPO DE EMPAQUE, 2018-2032 (MILES DE USD)
TABLA 43 MERCADO DE QUINUA EN ESTADOS UNIDOS, POR CANAL DE DISTRIBUCIÓN, 2018-2032 (MILES DE USD)
TABLA 44 MERCADO DE QUINUA FUERA DE LÍNEA DE EE. UU., POR CANAL DE DISTRIBUCIÓN, 2018-2032 (MILES DE USD)
TABLA 45 MERCADO DE QUINUA EN LÍNEA DE EE. UU., POR CANAL DE DISTRIBUCIÓN, 2018-2032 (MILES DE USD)
TABLA 46 MERCADO DE QUINUA DE CANADÁ, POR TIPO, 2018-2032 (MILES DE USD)
TABLA 47 MERCADO DE QUINUA DE CANADÁ, POR TIPO, 2018-2032 (MILES DE USD) (KILOTONELADAS)
TABLA 48 MERCADO ÚNICO DE QUINUA DE CANADÁ, POR TIPO, 2018-2032 (MILES DE USD)
TABLA 49 MERCADO DE QUINUA DE CANADÁ, POR NATURALEZA, 2018-2032 (MILES DE USD)
TABLA 50 MERCADO DE QUINUA DE CANADÁ, POR PRODUCTO, 2018-2032 (MILES DE USD)
TABLA 51 MERCADO DE QUINUA EN CANADÁ, POR TIPO DE EMPAQUE, 2018-2032 (MILES DE USD)
TABLA 52 MERCADO DE QUINUA EN CANADÁ, POR CANAL DE DISTRIBUCIÓN, 2018-2032 (MILES DE USD)
TABLA 53 CANADÁ SIN CONEXIÓN EN EL MERCADO DE QUINUA, POR CANAL DE DISTRIBUCIÓN, 2018-2032 (MILES DE USD)
TABLA 54 MERCADO DE QUINUA EN LÍNEA DE CANADÁ, POR CANAL DE DISTRIBUCIÓN, 2018-2032 (MILES DE USD)
TABLA 55 MERCADO DE QUINUA EN MÉXICO, POR TIPO, 2018-2032 (MILES DE USD)
TABLA 56 MERCADO DE QUINUA EN MÉXICO, POR TIPO, 2018-2032 (MILES DE USD) (KILOTONELADAS)
TABLA 57 MERCADO ÚNICO DE QUINUA EN MÉXICO, POR TIPO, 2018-2032 (MILES DE USD)
TABLA 58 MERCADO DE QUINUA EN MÉXICO, POR NATURALEZA, 2018-2032 (MILES DE USD)
TABLA 59 MERCADO DE QUINUA EN MÉXICO, POR PRODUCTO, 2018-2032 (MILES DE USD)
TABLA 60 MERCADO DE QUINUA EN MÉXICO, POR TIPO DE EMPAQUE, 2018-2032 (MILES DE USD)
TABLA 61 MERCADO DE QUINUA EN MÉXICO, POR CANAL DE DISTRIBUCIÓN, 2018-2032 (MILES DE USD)
TABLA 62 MÉXICO SIN CONEXIÓN EN EL MERCADO DE QUINUA, POR CANAL DE DISTRIBUCIÓN, 2018-2032 (MILES DE USD)
TABLA 63 MERCADO DE QUINUA EN LÍNEA EN MÉXICO, POR CANAL DE DISTRIBUCIÓN, 2018-2032 (MILES DE USD)
TABLA 64 MERCADO EUROPEO DE QUINOA, POR PAÍS, 2018-2032 (MILES DE USD)
TABLA 65 MERCADO EUROPEO DE QUINOA, POR TIPO, 2018-2032 (MILES DE USD)
TABLA 66 MERCADO EUROPEO DE QUINOA, POR TIPO, 2018-2032 (MILES DE USD) (KILOTONELADAS)
TABLA 67 MERCADO ÚNICO EUROPEO DE QUINOA, POR TIPO, 2018-2032 (MILES DE USD)
TABLA 68 MERCADO EUROPEO DE QUINOA, POR NATURALEZA, 2018-2032 (MILES DE USD)
TABLA 69 MERCADO EUROPEO DE QUINOA, POR PRODUCTO, 2018-2032 (MILES DE USD)
TABLA 70 MERCADO EUROPEO DE QUINOA, POR TIPO DE ENVASE, 2018-2032 (MILES DE USD)
TABLA 71 MERCADO EUROPEO DE QUINOA, POR CANAL DE DISTRIBUCIÓN, 2018-2032 (MILES DE USD)
TABLA 72 MERCADO DE QUINUA SIN CONEXIÓN EN EUROPA, POR CANAL DE DISTRIBUCIÓN, 2018-2032 (MILES DE USD)
TABLA 73 MERCADO DE QUINOA EN LÍNEA EN EUROPA, POR CANAL DE DISTRIBUCIÓN, 2018-2032 (MILES DE USD)
TABLA 74 MERCADO DE QUINUA EN ALEMANIA, POR TIPO, 2018-2032 (MILES DE USD)
TABLA 75 MERCADO DE QUINUA EN ALEMANIA, POR TIPO, 2018-2032 (MILES DE USD) (KILOTONELADAS)
TABLA 76 ALEMANIA SOLO EN EL MERCADO DE QUINUA, POR TIPO, 2018-2032 (MILES DE USD)
TABLA 77 MERCADO DE QUINUA EN ALEMANIA, POR NATURALEZA, 2018-2032 (MILES DE USD)
TABLA 78 MERCADO DE QUINUA EN ALEMANIA, POR PRODUCTO 2018-2032 (MILES DE USD)
TABLA 79 MERCADO DE QUINUA EN ALEMANIA, POR TIPO DE ENVASE, 2018-2032 (MILES DE USD)
TABLA 80 MERCADO DE QUINUA EN ALEMANIA, POR CANAL DE DISTRIBUCIÓN, 2018-2032 (MILES DE USD)
TABLA 81 ALEMANIA SIN CONEXIÓN EN EL MERCADO DE QUINUA, POR CANAL DE DISTRIBUCIÓN, 2018-2032 (MILES DE USD)
TABLA 82 ALEMANIA EN EL MERCADO DE QUINUA EN LÍNEA, POR CANAL DE DISTRIBUCIÓN, 2018-2032 (MILES DE USD)
CUADRO 83 MERCADO DE QUINUA EN FRANCIA, POR TIPO, 2018-2032 (MILES DE USD)
CUADRO 84 MERCADO DE QUINOA EN FRANCIA, POR TIPO, 2018-2032 (MILES DE USD) (KILOTONELADAS)
TABLA 85 FRANCIA ÚNICA EN EL MERCADO DE QUINOA, POR TIPO, 2018-2032 (MILES DE USD)
TABLA 86 MERCADO DE QUINOA EN FRANCIA, POR NATURALEZA, 2018-2032 (MILES DE USD)
CUADRO 87 MERCADO DE QUINUA EN FRANCIA, POR PRODUCTO, 2018-2032 (MILES DE USD)
CUADRO 88 MERCADO DE QUINUA EN FRANCIA, POR TIPO DE ENVASE, 2018-2032 (MILES DE USD)
CUADRO 89 MERCADO DE QUINUA EN FRANCIA, POR CANAL DE DISTRIBUCIÓN, 2018-2032 (MILES DE USD)
TABLA 90 FRANCIA SIN CONEXIÓN EN EL MERCADO DE QUINOA, POR CANAL DE DISTRIBUCIÓN, 2018-2032 (MILES DE USD)
TABLA 91 FRANCIA EN EL MERCADO DE QUINOA EN LÍNEA, POR CANAL DE DISTRIBUCIÓN, 2018-2032 (MILES DE USD)
TABLA 92 MERCADO DE QUINOA EN EL REINO UNIDO, POR TIPO, 2018-2032 (MILES DE USD)
TABLA 93 MERCADO DE QUINOA EN EL REINO UNIDO, POR TIPO, 2018-2032 (MILES DE USD) (KILOTONELADAS)
TABLA 94 MERCADO ÚNICO DE QUINOA EN EL REINO UNIDO, POR TIPO, 2018-2032 (MILES DE USD)
TABLA 95 MERCADO DE QUINOA EN EL REINO UNIDO, POR NATURALEZA, 2018-2032 (MILES DE USD)
TABLA 96 MERCADO DE QUINOA EN EL REINO UNIDO, POR PRODUCTO, 2018-2032 (MILES DE USD)
TABLA 97 MERCADO DE QUINUA EN EL REINO UNIDO, POR TIPO DE ENVASE, 2018-2032 (MILES DE USD)
TABLA 98 MERCADO DE QUINUA EN EL REINO UNIDO, POR CANAL DE DISTRIBUCIÓN, 2018-2032 (MILES DE USD)
TABLA 99 REINO UNIDO SIN CONEXIÓN EN EL MERCADO DE QUINOA, POR CANAL DE DISTRIBUCIÓN, 2018-2032 (MILES DE USD)
TABLA 100 MERCADO DE QUINOA EN LÍNEA DEL REINO UNIDO, POR CANAL DE DISTRIBUCIÓN, 2018-2032 (MILES DE USD)
TABLA 101 MERCADO DE QUINOA EN ITALIA, POR TIPO, 2018-2032 (MILES DE USD)
TABLA 102 MERCADO DE QUINOA EN ITALIA, POR TIPO, 2018-2032 (MILES DE USD) (KILOTONELADAS)
TABLA 103 ITALIA ÚNICA EN EL MERCADO DE QUINOA, POR TIPO, 2018-2032 (MILES DE USD)
TABLA 104 MERCADO DE QUINOA EN ITALIA, POR NATURALEZA, 2018-2032 (MILES DE USD)
TABLA 105 MERCADO DE QUINOA EN ITALIA, POR PRODUCTO, 2018-2032 (MILES DE USD)
TABLA 106 MERCADO DE QUINOA EN ITALIA, POR TIPO DE ENVASE, 2018-2032 (MILES DE USD)
TABLA 107 MERCADO DE QUINUA EN ITALIA, POR CANAL DE DISTRIBUCIÓN, 2018-2032 (MILES DE USD)
TABLA 108 ITALIA FUERA DE LÍNEA EN EL MERCADO DE QUINOA, POR CANAL DE DISTRIBUCIÓN, 2018-2032 (MILES DE USD)
TABLA 109 ITALIA EN EL MERCADO DE QUINOA EN LÍNEA, POR CANAL DE DISTRIBUCIÓN, 2018-2032 (MILES DE USD)
TABLA 110 MERCADO DE QUINOA EN ESPAÑA, POR TIPO, 2018-2032 (MILES DE USD)
TABLA 111 MERCADO DE QUINOA EN ESPAÑA, POR TIPO, 2018-2032 (MILES DE USD) (KILOTONELADAS)
TABLA 112 ESPAÑA SOLO EN EL MERCADO DE LA QUINOA, POR TIPO, 2018-2032 (MILES DE USD)
TABLA 113 MERCADO DE QUINOA EN ESPAÑA, POR NATURALEZA, 2018-2032 (MILES DE USD)
TABLA 114 MERCADO DE QUINOA EN ESPAÑA, POR PRODUCTO, 2018-2032 (MILES DE USD)
TABLA 115 MERCADO DE QUINOA EN ESPAÑA, POR TIPO DE ENVASE, 2018-2032 (MILES DE USD)
TABLA 116 MERCADO DE QUINOA EN ESPAÑA, POR CANAL DE DISTRIBUCIÓN, 2018-2032 (MILES DE USD)
TABLA 117 ESPAÑA SIN CONEXIÓN EN EL MERCADO DE QUINOA, POR CANAL DE DISTRIBUCIÓN, 2018-2032 (MILES DE USD)
TABLA 118 MERCADO DE QUINOA EN LÍNEA EN ESPAÑA, POR CANAL DE DISTRIBUCIÓN, 2018-2032 (MILES DE USD)
TABLA 119 MERCADO DE QUINUA EN LOS PAÍSES BAJOS, POR TIPO, 2018-2032 (MILES DE USD)
TABLA 120 MERCADO DE QUINUA EN LOS PAÍSES BAJOS, POR TIPO, 2018-2032 (MILES DE USD) (KILOTONELADAS)
TABLA 121 MERCADO ÚNICO DE QUINUA EN PAÍSES BAJOS, POR TIPO, 2018-2032 (MILES DE USD)
TABLA 122 MERCADO DE QUINUA EN LOS PAÍSES BAJOS, POR NATURALEZA, 2018-2032 (MILES DE USD)
TABLA 123 MERCADO DE QUINUA EN LOS PAÍSES BAJOS, POR PRODUCTO, 2018-2032 (MILES DE USD)
TABLA 124 MERCADO DE QUINUA EN LOS PAÍSES BAJOS, POR TIPO DE ENVASE, 2018-2032 (MILES DE USD)
TABLA 125 MERCADO DE QUINUA EN LOS PAÍSES BAJOS, POR CANAL DE DISTRIBUCIÓN, 2018-2032 (MILES DE USD)
TABLA 126 PAÍSES BAJOS SIN CONEXIÓN EN EL MERCADO DE QUINUA, POR CANAL DE DISTRIBUCIÓN, 2018-2032 (MILES DE USD)
TABLA 127 PAÍSES BAJOS EN LÍNEA EN EL MERCADO DE QUINOA, POR CANAL DE DISTRIBUCIÓN, 2018-2032 (MILES DE USD)
TABLA 128 MERCADO DE QUINOA EN BÉLGICA, POR TIPO, 2018-2032 (MILES DE USD)
TABLA 129 MERCADO DE QUINOA EN BÉLGICA, POR TIPO, 2018-2032 (MILES DE USD) (KILOTONELADAS)
TABLA 130 BÉLGICA ÚNICO EN EL MERCADO DE QUINOA, POR TIPO, 2018-2032 (MILES DE USD)
TABLA 131 MERCADO DE QUINOA EN BÉLGICA, POR NATURALEZA, 2018-2032 (MILES DE USD)
TABLA 132 MERCADO DE QUINOA EN BÉLGICA, POR PRODUCTO, 2018-2032 (MILES DE USD)
TABLA 133 MERCADO DE QUINOA EN BÉLGICA, POR TIPO DE ENVASE, 2018-2032 (MILES DE USD)
TABLA 134 MERCADO DE QUINUA EN BÉLGICA, POR CANAL DE DISTRIBUCIÓN, 2018-2032 (MILES DE USD)
TABLA 135 BÉLGICA SIN CONEXIÓN EN EL MERCADO DE QUINUA, POR CANAL DE DISTRIBUCIÓN, 2018-2032 (MILES DE USD)
TABLA 136 MERCADO DE QUINUA EN LÍNEA EN BÉLGICA, POR CANAL DE DISTRIBUCIÓN, 2018-2032 (MILES DE USD)
TABLA 137 MERCADO DE QUINUA EN RUSIA, POR TIPO, 2018-2032 (MILES DE USD)
TABLA 138 MERCADO DE QUINUA EN RUSIA, POR TIPO, 2018-2032 (MILES DE USD) (KILOTONELADAS)
TABLA 139 RUSIA ÚNICA EN EL MERCADO DE QUINUA, POR TIPO, 2018-2032 (MILES DE USD)
TABLA 140 MERCADO DE QUINUA EN RUSIA, POR NATURALEZA, 2018-2032 (MILES DE USD)
TABLA 141 MERCADO DE QUINUA EN RUSIA, POR PRODUCTO, 2018-2032 (MILES DE USD)
TABLA 142 MERCADO DE QUINUA EN RUSIA, POR TIPO DE ENVASE, 2018-2032 (MILES DE USD)
TABLA 143 MERCADO DE QUINUA EN RUSIA, POR CANAL DE DISTRIBUCIÓN, 2018-2032 (MILES DE USD)
TABLA 144 RUSIA DESCONECTADA EN EL MERCADO DE QUINUA, POR CANAL DE DISTRIBUCIÓN, 2018-2032 (MILES DE USD)
TABLA 145 RUSIA EN LÍNEA EN EL MERCADO DE QUINUA, POR CANAL DE DISTRIBUCIÓN, 2018-2032 (MILES DE USD)
TABLA 146 MERCADO DE QUINUA EN SUIZA, POR TIPO, 2018-2032 (MILES DE USD)
TABLA 147 MERCADO DE QUINUA EN SUIZA, POR TIPO, 2018-2032 (MILES DE USD) (KILOTONELADAS)
TABLA 148 SUIZA SOLO EN EL MERCADO DE QUINUA, POR TIPO, 2018-2032 (MILES DE USD)
TABLA 149 MERCADO DE QUINUA EN SUIZA, POR NATURALEZA, 2018-2032 (MILES DE USD)
TABLA 150 MERCADO DE QUINUA EN SUIZA, POR PRODUCTO, 2018-2032 (MILES DE USD)
TABLA 151 MERCADO DE QUINUA EN SUIZA, POR TIPO DE ENVASE, 2018-2032 (MILES DE USD)
TABLA 152 MERCADO DE QUINUA EN SUIZA, POR CANAL DE DISTRIBUCIÓN, 2018-2032 (MILES DE USD)
TABLA 153 SUIZA FUERA DE LÍNEA EN EL MERCADO DE QUINUA, POR CANAL DE DISTRIBUCIÓN, 2018-2032 (MILES DE USD)
TABLA 154 SUIZA EN LÍNEA EN EL MERCADO DE QUINUA, POR CANAL DE DISTRIBUCIÓN, 2018-2032 (MILES DE USD)
TABLA 155 MERCADO DE QUINUA EN POLONIA, POR TIPO, 2018-2032 (MILES DE USD)
TABLA 156 MERCADO DE QUINOA EN POLONIA, POR TIPO, 2018-2032 (MILES DE USD) (KILOTONELADAS)
TABLA 157 POLONIA, MERCADO ÚNICO DE QUINUA, POR TIPO, 2018-2032 (MILES DE USD)
TABLA 158 MERCADO DE QUINUA EN POLONIA, POR NATURALEZA, 2018-2032 (MILES DE USD)
TABLA 159 MERCADO DE QUINUA EN POLONIA, POR PRODUCTO, 2018-2032 (MILES DE USD)
TABLA 160 MERCADO DE QUINUA EN POLONIA, POR TIPO DE ENVASE, 2018-2032 (MILES DE USD)
TABLA 161 MERCADO DE QUINUA EN POLONIA, POR CANAL DE DISTRIBUCIÓN, 2018-2032 (MILES DE USD)
TABLA 162 POLONIA SIN CONEXIÓN EN EL MERCADO DE QUINUA, POR CANAL DE DISTRIBUCIÓN, 2018-2032 (MILES DE USD)
TABLA 163 POLONIA EN EL MERCADO DE QUINUA EN LÍNEA, POR CANAL DE DISTRIBUCIÓN, 2018-2032 (MILES DE USD)
TABLA 164 MERCADO DE QUINUA EN DINAMARCA, POR TIPO, 2018-2032 (MILES DE USD)
TABLA 165 MERCADO DE QUINUA EN DINAMARCA, POR TIPO, 2018-2032 (MILES DE USD) (KILOTONELADAS)
TABLA 166 DINAMARCA SOLO EN EL MERCADO DE QUINUA, POR TIPO, 2018-2032 (MILES DE USD)
TABLA 167 MERCADO DE QUINUA EN DINAMARCA, POR NATURALEZA, 2018-2032 (MILES DE USD)
TABLA 168 MERCADO DE QUINUA EN DINAMARCA, POR PRODUCTO, 2018-2032 (MILES DE USD)
TABLA 169 MERCADO DE QUINUA EN DINAMARCA, POR TIPO DE ENVASE, 2018-2032 (MILES DE USD)
TABLA 170 MERCADO DE QUINUA EN DINAMARCA, POR CANAL DE DISTRIBUCIÓN, 2018-2032 (MILES DE USD)
TABLA 171 DINAMARCA SIN CONEXIÓN EN EL MERCADO DE QUINUA, POR CANAL DE DISTRIBUCIÓN, 2018-2032 (MILES DE USD)
TABLA 172 DINAMARCA EN EL MERCADO DE QUINUA EN LÍNEA, POR CANAL DE DISTRIBUCIÓN, 2018-2032 (MILES DE USD)
TABLA 173 MERCADO DE QUINUA DE NORUEGA, POR TIPO, 2018-2032 (MILES DE USD)
TABLA 174 MERCADO DE QUINUA DE NORUEGA, POR TIPO, 2018-2032 (MILES DE USD) (KILOTONELADAS)
TABLA 175 MERCADO ÚNICO DE QUINUA DE NORUEGA, POR TIPO, 2018-2032 (MILES DE USD)
TABLA 176 MERCADO DE QUINUA DE NORUEGA, POR NATURALEZA, 2018-2032 (MILES DE USD)
TABLA 177 MERCADO DE QUINUA DE NORUEGA, POR PRODUCTO, 2018-2032 (MILES DE USD)
TABLA 178 MERCADO DE QUINUA DE NORUEGA, POR TIPO DE ENVASE, 2018-2032 (MILES DE USD)
TABLA 179 MERCADO DE QUINUA DE NORUEGA, POR CANAL DE DISTRIBUCIÓN, 2018-2032 (MILES DE USD)
TABLA 180 NORUEGA SIN CONEXIÓN EN EL MERCADO DE QUINUA, POR CANAL DE DISTRIBUCIÓN, 2018-2032 (MILES DE USD)
TABLA 181 MERCADO DE QUINUA EN LÍNEA EN NORUEGA, POR CANAL DE DISTRIBUCIÓN, 2018-2032 (MILES DE USD)
TABLA 182 MERCADO DE QUINOA DE TURQUÍA, POR TIPO, 2018-2032 (MILES DE USD)
TABLA 183 MERCADO DE QUINOA DE TURQUÍA, POR TIPO, 2018-2032 (MILES DE USD) (KILOTONELADAS)
TABLA 184 TURQUÍA EN EL MERCADO DE QUINOA, POR TIPO, 2018-2032 (MILES DE USD)
TABLA 185 MERCADO DE QUINOA DE TURQUÍA, POR NATURALEZA, 2018-2032 (MILES DE USD)
TABLA 186 MERCADO DE QUINOA DE TURQUÍA, POR PRODUCTO, 2018-2032 (MILES DE USD)
TABLA 187 MERCADO DE QUINUA DE TURQUÍA, POR TIPO DE ENVASE, 2018-2032 (MILES DE USD)
TABLA 188 MERCADO DE QUINUA DE TURQUÍA, POR CANAL DE DISTRIBUCIÓN, 2018-2032 (MILES DE USD)
TABLA 189 TURQUÍA SIN CONEXIÓN EN EL MERCADO DE QUINUA, POR CANAL DE DISTRIBUCIÓN, 2018-2032 (MILES DE USD)
TABLA 190 MERCADO DE QUINUA EN LÍNEA DE TURQUÍA, POR CANAL DE DISTRIBUCIÓN, 2018-2032 (MILES DE USD)
TABLA 191 MERCADO DE QUINUA EN SUECIA, POR TIPO, 2018-2032 (MILES DE USD)
TABLA 192 MERCADO DE QUINUA EN SUECIA, POR TIPO, 2018-2032 (MILES DE USD) (KILOTONELADAS)
TABLA 193 SUECIA ÚNICA EN EL MERCADO DE QUINOA, POR TIPO, 2018-2032 (MILES DE USD)
TABLA 194 MERCADO DE QUINUA EN SUECIA, POR NATURALEZA, 2018-2032 (MILES DE USD)
TABLA 195 MERCADO DE QUINUA EN SUECIA, POR PRODUCTO, 2018-2032 (MILES DE USD)
TABLA 196 MERCADO DE QUINUA EN SUECIA, POR TIPO DE ENVASE, 2018-2032 (MILES DE USD)
TABLA 197 MERCADO DE QUINUA EN SUECIA, POR CANAL DE DISTRIBUCIÓN, 2018-2032 (MILES DE USD)
TABLA 198 SUECIA SIN CONEXIÓN EN EL MERCADO DE QUINUA, POR CANAL DE DISTRIBUCIÓN, 2018-2032 (MILES DE USD)
TABLA 199 SUECIA EN EL MERCADO DE QUINUA EN LÍNEA, POR CANAL DE DISTRIBUCIÓN, 2018-2032 (MILES DE USD)
TABLA 200 MERCADO DE QUINOA EN EL RESTO DE EUROPA, POR TIPO, 2018-2032 (MILES DE USD)
TABLA 201 MERCADO DE QUINOA EN EL RESTO DE EUROPA, POR TIPO, 2018-2032 (MILES DE USD) (KILOTONELADAS)
CUADRO 202 MERCADO DE QUINUA EN ASIA-PACÍFICO, POR PAÍS, 2018-2032 (MILES DE USD)
CUADRO 203 MERCADO DE QUINUA EN ASIA-PACÍFICO, POR TIPO, 2018-2032 (MILES DE USD)
CUADRO 204 MERCADO DE QUINUA EN ASIA-PACÍFICO, POR TIPO, 2018-2032 (MILES DE USD) (KILOTONELADAS)
TABLA 205 MERCADO ÚNICO DE QUINUA EN ASIA-PACÍFICO, POR TIPO, 2018-2032 (MILES DE USD)
TABLA 206 MERCADO DE QUINUA EN ASIA-PACÍFICO, POR NATURALEZA, 2018-2032 (MILES DE USD)
CUADRO 207 MERCADO DE QUINUA EN ASIA-PACÍFICO, POR PRODUCTO, 2018-2032 (MILES DE USD)
CUADRO 208 MERCADO DE QUINUA EN ASIA-PACÍFICO, POR TIPO DE ENVASE, 2018-2032 (MILES DE USD)
CUADRO 209 MERCADO DE QUINUA EN ASIA-PACÍFICO, POR CANAL DE DISTRIBUCIÓN, 2018-2032 (MILES DE USD)
TABLA 210 MERCADO DE QUINUA FUERA DE LÍNEA EN ASIA-PACÍFICO, POR CANAL DE DISTRIBUCIÓN, 2018-2032 (MILES DE USD)
TABLA 211 MERCADO DE QUINUA EN LÍNEA EN ASIA-PACÍFICO, POR CANAL DE DISTRIBUCIÓN, 2018-2032 (MILES DE USD)
TABLA 212 MERCADO DE QUINUA EN CHINA, POR TIPO, 2018-2032 (MILES DE USD)
TABLA 213 MERCADO DE QUINUA EN CHINA, POR TIPO, 2018-2032 (MILES DE USD) (KILOTONELADAS)
TABLA 214 PARTICIPACIÓN DE CHINA EN EL MERCADO DE QUINUA, POR TIPO, 2018-2032 (MILES DE USD)
TABLA 215 MERCADO DE QUINUA EN CHINA, POR NATURALEZA, 2018-2032 (MILES DE USD)
TABLA 216 MERCADO DE QUINUA EN CHINA, POR PRODUCTO, 2018-2032 (MILES DE USD)
TABLA 217 MERCADO DE QUINUA EN CHINA, POR TIPO DE ENVASE, 2018-2032 (MILES DE USD)
TABLA 218 MERCADO DE QUINUA EN CHINA, POR CANAL DE DISTRIBUCIÓN, 2018-2032 (MILES DE USD)
TABLA 219 CHINA DESCONECTADA EN EL MERCADO DE QUINUA, POR CANAL DE DISTRIBUCIÓN, 2018-2032 (MILES DE USD)
TABLA 220 PARTICIPACIÓN DE CHINA EN EL MERCADO DE QUINUA EN LÍNEA, POR CANAL DE DISTRIBUCIÓN, 2018-2032 (MILES DE USD)
TABLA 221 MERCADO DE QUINUA EN INDIA, POR TIPO, 2018-2032 (MILES DE USD)
TABLA 222 MERCADO DE QUINUA EN INDIA, POR TIPO, 2018-2032 (MILES DE USD) (KILOTONELADAS)
TABLA 223 INDIA, MERCADO DE QUINUA, POR TIPO, 2018-2032 (MILES DE USD)
TABLA 224 MERCADO DE QUINUA EN INDIA, POR NATURALEZA, 2018-2032 (MILES DE USD)
TABLA 225 MERCADO DE QUINUA EN INDIA, POR PRODUCTO, 2018-2032 (MILES DE USD)
TABLA 226 MERCADO DE QUINUA EN INDIA, POR TIPO DE ENVASE, 2018-2032 (MILES DE USD)
TABLA 227 MERCADO DE QUINUA EN INDIA, POR CANAL DE DISTRIBUCIÓN, 2018-2032 (MILES DE USD)
TABLA 228 INDIA SIN CONEXIÓN EN EL MERCADO DE QUINUA, POR CANAL DE DISTRIBUCIÓN, 2018-2032 (MILES DE USD)
TABLA 229 INDIA EN EL MERCADO DE QUINUA EN LÍNEA, POR CANAL DE DISTRIBUCIÓN, 2018-2032 (MILES DE USD)
TABLA 230 MERCADO DE QUINUA EN JAPÓN, POR TIPO, 2018-2032 (MILES DE USD)
TABLA 231 MERCADO DE QUINUA EN JAPÓN, POR TIPO, 2018-2032 (MILES DE USD) (KILOTONELADAS)
TABLA 232 MERCADO ÚNICO DE QUINUA EN JAPÓN, POR TIPO, 2018-2032 (MILES DE USD)
TABLA 233 MERCADO DE QUINUA EN JAPÓN, POR NATURALEZA, 2018-2032 (MILES DE USD)
TABLA 234 MERCADO DE QUINUA EN JAPÓN, POR PRODUCTO, 2018-2032 (MILES DE USD)
TABLA 235 MERCADO DE QUINUA EN JAPÓN, POR TIPO DE ENVASE, 2018-2032 (MILES DE USD)
TABLA 236 MERCADO DE QUINUA EN JAPÓN, POR CANAL DE DISTRIBUCIÓN, 2018-2032 (MILES DE USD)
TABLA 237 JAPÓN SIN CONEXIÓN EN EL MERCADO DE QUINUA, POR CANAL DE DISTRIBUCIÓN, 2018-2032 (MILES DE USD)
TABLA 238 MERCADO DE QUINUA EN LÍNEA EN JAPÓN, POR CANAL DE DISTRIBUCIÓN, 2018-2032 (MILES DE USD)
TABLA 239 MERCADO DE QUINUA EN AUSTRALIA, POR TIPO, 2018-2032 (MILES DE USD)
TABLA 240 MERCADO DE QUINUA EN AUSTRALIA, POR TIPO, 2018-2032 (MILES DE USD) (KILOTONELADAS)
TABLA 241 AUSTRALIA ÚNICO EN EL MERCADO DE QUINUA, POR TIPO, 2018-2032 (MILES DE USD)
TABLA 242 MERCADO DE QUINUA EN AUSTRALIA, POR NATURALEZA, 2018-2032 (MILES DE USD)
TABLA 243 MERCADO DE QUINUA EN AUSTRALIA, POR PRODUCTO, 2018-2032 (MILES DE USD)
TABLA 244 MERCADO DE QUINUA EN AUSTRALIA, POR TIPO DE ENVASE, 2018-2032 (MILES DE USD)
TABLA 245 MERCADO DE QUINUA EN AUSTRALIA, POR CANAL DE DISTRIBUCIÓN, 2018-2032 (MILES DE USD)
TABLA 246 AUSTRALIA FUERA DE LÍNEA EN EL MERCADO DE QUINUA, POR CANAL DE DISTRIBUCIÓN, 2018-2032 (MILES DE USD)
TABLA 247 AUSTRALIA EN EL MERCADO DE QUINUA EN LÍNEA, POR CANAL DE DISTRIBUCIÓN, 2018-2032 (MILES DE USD)
TABLA 248 MERCADO DE QUINUA DE COREA DEL SUR, POR TIPO, 2018-2032 (MILES DE USD)
TABLA 249 MERCADO DE QUINUA DE COREA DEL SUR, POR TIPO, 2018-2032 (MILES DE USD) (KILOTONELADAS)
TABLA 250 MERCADO DE QUINUA DE COREA DEL SUR, POR TIPO, 2018-2032 (MILES DE USD)
TABLA 251 MERCADO DE QUINUA DE COREA DEL SUR, POR NATURALEZA, 2018-2032 (MILES DE USD)
TABLA 252 MERCADO DE QUINUA DE COREA DEL SUR, POR PRODUCTO, 2018-2032 (MILES DE USD)
TABLA 253 MERCADO DE QUINUA DE COREA DEL SUR, POR TIPO DE ENVASE, 2018-2032 (MILES DE USD)
TABLA 254 MERCADO DE QUINUA DE COREA DEL SUR, POR CANAL DE DISTRIBUCIÓN, 2018-2032 (MILES DE USD)
TABLA 255 COREA DEL SUR SIN CONEXIÓN EN EL MERCADO DE QUINUA, POR CANAL DE DISTRIBUCIÓN, 2018-2032 (MILES DE USD)
TABLA 256 MERCADO DE QUINUA EN LÍNEA DE COREA DEL SUR, POR CANAL DE DISTRIBUCIÓN, 2018-2032 (MILES DE USD)
TABLA 257 MERCADO DE QUINUA DE TAILANDIA, POR TIPO, 2018-2032 (MILES DE USD)
TABLA 258 MERCADO DE QUINUA DE TAILANDIA, POR TIPO, 2018-2032 (MILES DE USD) (KILOTONELADAS)
TABLA 259 TAILANDIA: MERCADO DE QUINOA, POR TIPO, 2018-2032 (MILES DE USD)
TABLA 260 MERCADO DE QUINOA EN TAILANDIA, POR NATURALEZA, 2018-2032 (MILES DE USD)
TABLA 261 MERCADO DE QUINUA DE TAILANDIA, POR PRODUCTO, 2018-2032 (MILES DE USD)
TABLA 262 MERCADO DE QUINUA DE TAILANDIA, POR TIPO DE ENVASE, 2018-2032 (MILES DE USD)
TABLA 263 MERCADO DE QUINUA DE TAILANDIA, POR CANAL DE DISTRIBUCIÓN, 2018-2032 (MILES DE USD)
TABLA 264 TAILANDIA SIN CONEXIÓN EN EL MERCADO DE QUINUA, POR CANAL DE DISTRIBUCIÓN, 2018-2032 (MILES DE USD)
TABLA 265 MERCADO DE QUINUA EN LÍNEA EN TAILANDIA, POR CANAL DE DISTRIBUCIÓN, 2018-2032 (MILES DE USD)
TABLA 266 MERCADO DE QUINUA DE MALASIA, POR TIPO, 2018-2032 (MILES DE USD)
TABLA 267 MERCADO DE QUINUA DE MALASIA, POR TIPO, 2018-2032 (MILES DE USD) (KILOTONELADAS)
TABLA 268 MALASIA, MERCADO ÚNICO DE QUINUA, POR TIPO, 2018-2032 (MILES DE USD)
TABLA 269 MERCADO DE QUINUA DE MALASIA, POR NATURALEZA, 2018-2032 (MILES DE USD)
TABLA 270 MERCADO DE QUINUA DE MALASIA, POR PRODUCTO, 2018-2032 (MILES DE USD)
TABLA 271 MERCADO DE QUINUA DE MALASIA, POR TIPO DE ENVASE, 2018-2032 (MILES DE USD)
TABLA 272 MERCADO DE QUINUA DE MALASIA, POR CANAL DE DISTRIBUCIÓN, 2018-2032 (MILES DE USD)
TABLA 273 MALASIA SIN CONEXIÓN EN EL MERCADO DE QUINUA, POR CANAL DE DISTRIBUCIÓN, 2018-2032 (MILES DE USD)
TABLA 274 MALASIA EN LÍNEA EN EL MERCADO DE QUINUA, POR CANAL DE DISTRIBUCIÓN, 2018-2032 (MILES DE USD)
TABLA 275 MERCADO DE QUINUA EN INDONESIA, POR TIPO, 2018-2032 (MILES DE USD)
TABLA 276 MERCADO DE QUINUA EN INDONESIA, POR TIPO, 2018-2032 (MILES DE USD) (KILOTONELADAS)
TABLA 277 INDONESIA, MERCADO ÚNICO DE QUINUA, POR TIPO, 2018-2032 (MILES DE USD)
TABLA 278 MERCADO DE QUINUA EN INDONESIA, POR NATURALEZA, 2018-2032 (MILES DE USD)
TABLA 279 MERCADO DE QUINUA EN INDONESIA, POR PRODUCTO, 2018-2032 (MILES DE USD)
TABLA 280 MERCADO DE QUINUA EN INDONESIA, POR TIPO DE ENVASE, 2018-2032 (MILES DE USD)
TABLA 281 MERCADO DE QUINUA EN INDONESIA, POR CANAL DE DISTRIBUCIÓN, 2018-2032 (MILES DE USD)
TABLA 282 INDONESIA SIN CONEXIÓN EN EL MERCADO DE QUINUA, POR CANAL DE DISTRIBUCIÓN, 2018-2032 (MILES DE USD)
TABLA 283 INDONESIA EN EL MERCADO DE QUINUA EN LÍNEA, POR CANAL DE DISTRIBUCIÓN, 2018-2032 (MILES DE USD)
TABLA 284 MERCADO DE QUINUA EN FILIPINAS, POR TIPO, 2018-2032 (MILES DE USD)
TABLA 285 MERCADO DE QUINUA EN FILIPINAS, POR TIPO, 2018-2032 (MILES DE USD) (KILOTONELADAS)
TABLA 286 FILIPINAS, SOLO EN EL MERCADO DE QUINUA, POR TIPO, 2018-2032 (MILES DE USD)
TABLA 287 MERCADO DE QUINUA EN FILIPINAS, POR NATURALEZA, 2018-2032 (MILES DE USD)
TABLA 288 MERCADO DE QUINUA EN FILIPINAS, POR PRODUCTO, 2018-2032 (MILES DE USD)
TABLA 289 MERCADO DE QUINUA EN FILIPINAS, POR TIPO DE ENVASE, 2018-2032 (MILES DE USD)
TABLA 290 MERCADO DE QUINUA EN FILIPINAS, POR CANAL DE DISTRIBUCIÓN, 2018-2032 (MILES DE USD)
TABLA 291 FILIPINAS SIN CONEXIÓN EN EL MERCADO DE QUINUA, POR CANAL DE DISTRIBUCIÓN, 2018-2032 (MILES DE USD)
TABLA 292 MERCADO DE QUINUA EN LÍNEA EN FILIPINAS, POR CANAL DE DISTRIBUCIÓN, 2018-2032 (MILES DE USD)
TABLA 293 MERCADO DE QUINUA DE SINGAPUR, POR TIPO, 2018-2032 (MILES DE USD)
TABLA 294 MERCADO DE QUINUA DE SINGAPUR, POR TIPO, 2018-2032 (MILES DE USD) (KILOTONELADAS)
TABLA 295 SINGAPUR, MERCADO DE QUINUA, POR TIPO, 2018-2032 (MILES DE USD)
TABLA 296 MERCADO DE QUINUA DE SINGAPUR, POR NATURALEZA, 2018-2032 (MILES DE USD)
TABLA 297 MERCADO DE QUINUA DE SINGAPUR, POR PRODUCTO, 2018-2032 (MILES DE USD)
TABLA 298 MERCADO DE QUINUA DE SINGAPUR, POR TIPO DE ENVASE, 2018-2032 (MILES DE USD)
TABLA 299 MERCADO DE QUINUA DE SINGAPUR, POR CANAL DE DISTRIBUCIÓN, 2018-2032 (MILES DE USD)
TABLA 300 SINGAPUR SIN CONEXIÓN EN EL MERCADO DE QUINOA, POR CANAL DE DISTRIBUCIÓN, 2018-2032 (MILES DE USD)
TABLA 301 MERCADO DE QUINUA EN LÍNEA EN SINGAPUR, POR CANAL DE DISTRIBUCIÓN, 2018-2032 (MILES DE USD)
TABLA 302 MERCADO DE QUINUA DE NUEVA ZELANDA, POR TIPO, 2018-2032 (MILES DE USD)
TABLA 303 MERCADO DE QUINUA DE NUEVA ZELANDA, POR TIPO, 2018-2032 (MILES DE USD) (KILOTONELADAS)
TABLA 304 NUEVA ZELANDA: MERCADO DE QUINUA, POR TIPO, 2018-2032 (MILES DE USD)
TABLA 305 MERCADO DE QUINUA DE NUEVA ZELANDA, POR NATURALEZA, 2018-2032 (MILES DE USD)
TABLA 306 MERCADO DE QUINUA DE NUEVA ZELANDA, POR PRODUCTO, 2018-2032 (MILES DE USD)
TABLA 307 MERCADO DE QUINUA DE NUEVA ZELANDA, POR TIPO DE ENVASE, 2018-2032 (MILES DE USD)
TABLA 308 MERCADO DE QUINUA DE NUEVA ZELANDA, POR CANAL DE DISTRIBUCIÓN, 2018-2032 (MILES DE USD)
TABLA 309 NUEVA ZELANDA SIN CONEXIÓN EN EL MERCADO DE QUINUA, POR CANAL DE DISTRIBUCIÓN, 2018-2032 (MILES DE USD)
TABLA 310 NUEVA ZELANDA EN EL MERCADO DE QUINUA EN LÍNEA, POR CANAL DE DISTRIBUCIÓN, 2018-2032 (MILES DE USD)
TABLA 311 RESTO DEL MERCADO DE QUINUA DE ASIA-PACÍFICO, POR TIPO, 2018-2032 (MILES DE USD)
TABLA 312 RESTO DEL MERCADO DE QUINUA DE ASIA-PACÍFICO, POR TIPO, 2018-2032 (MILES DE USD) (KILOTONELADAS)
TABLA 313 MERCADO DE QUINUA EN AMÉRICA DEL SUR, POR PAÍS, 2018-2032 (MILES DE USD)
TABLA 314 MERCADO DE QUINUA EN AMÉRICA DEL SUR, POR TIPO, 2018-2032 (MILES DE USD)
TABLA 315 MERCADO DE QUINUA EN AMÉRICA DEL SUR, POR TIPO, 2018-2032 (MILES DE USD) (KILOTONELADAS)
TABLA 316 SUDAMÉRICA SOLO EN EL MERCADO DE QUINUA, POR TIPO, 2018-2032 (MILES DE USD)
TABLA 317 MERCADO DE QUINUA EN AMÉRICA DEL SUR, POR NATURALEZA, 2018-2032 (MILES DE USD)
CUADRO 318 MERCADO DE QUINUA EN AMÉRICA DEL SUR, POR PRODUCTO, 2018-2032 (MILES DE USD)
TABLA 319 MERCADO DE QUINUA EN AMÉRICA DEL SUR, POR TIPO DE ENVASE, 2018-2032 (MILES DE USD)
TABLA 320 MERCADO DE QUINUA EN AMÉRICA DEL SUR, POR CANAL DE DISTRIBUCIÓN, 2018-2032 (MILES DE USD)
TABLA 321 SUDAMÉRICA FUERA DE LÍNEA EN EL MERCADO DE QUINUA, POR CANAL DE DISTRIBUCIÓN, 2018-2032 (MILES DE USD)
TABLA 322 MERCADO DE QUINUA EN LÍNEA EN SUDAMÉRICA, POR CANAL DE DISTRIBUCIÓN, 2018-2032 (MILES DE USD)
TABLA 323 MERCADO DE QUINUA DE BRASIL, POR TIPO, 2018-2032 (MILES DE USD)
TABLA 324 MERCADO DE QUINUA DE BRASIL, POR TIPO, 2018-2032 (MILES DE USD) (KILOTONELADAS)
TABLA 325 BRASIL SOLO EN EL MERCADO DE QUINOA, POR TIPO, 2018-2032 (MILES DE USD)
TABLA 326 MERCADO DE QUINUA EN BRASIL, POR NATURALEZA, 2018-2032 (MILES DE USD)
TABLA 327 MERCADO DE QUINUA EN BRASIL, POR PRODUCTO, 2018-2032 (MILES DE USD)
TABLA 328 MERCADO DE QUINUA EN BRASIL, POR TIPO DE ENVASE, 2018-2032 (MILES DE USD)
TABLA 329 MERCADO DE QUINUA DE BRASIL, POR CANAL DE DISTRIBUCIÓN, 2018-2032 (MILES DE USD)
TABLA 330 BRASIL SIN CONEXIÓN EN EL MERCADO DE QUINUA, POR CANAL DE DISTRIBUCIÓN, 2018-2032 (MILES DE USD)
TABLA 331 MERCADO DE QUINUA EN LÍNEA EN BRASIL, POR CANAL DE DISTRIBUCIÓN, 2018-2032 (MILES DE USD)
TABLA 332 MERCADO DE QUINOA EN ARGENTINA, POR TIPO, 2018-2032 (MILES DE USD)
TABLA 333 MERCADO DE QUINOA EN ARGENTINA, POR TIPO, 2018-2032 (MILES DE USD) (KILOTONELADAS)
TABLA 334 MERCADO ÚNICO DE QUINOA EN ARGENTINA, POR TIPO, 2018-2032 (MILES DE USD)
TABLA 335 MERCADO DE QUINOA EN ARGENTINA, POR NATURALEZA, 2018-2032 (MILES DE USD)
CUADRO 336 MERCADO DE QUINOA EN ARGENTINA, POR PRODUCTO, 2018-2032 (MILES DE USD)
TABLA 337 MERCADO DE QUINOA EN ARGENTINA, POR TIPO DE ENVASE, 2018-2032 (MILES DE USD)
TABLA 338 MERCADO DE QUINOA EN ARGENTINA, POR CANAL DE DISTRIBUCIÓN, 2018-2032 (MILES DE USD)
TABLA 339 ARGENTINA FUERA DE LÍNEA EN EL MERCADO DE QUINOA, POR CANAL DE DISTRIBUCIÓN, 2018-2032 (MILES DE USD)
TABLA 340 MERCADO DE QUINOA EN LÍNEA EN ARGENTINA, POR CANAL DE DISTRIBUCIÓN, 2018-2032 (MILES DE USD)
TABLA 341 RESTO DE AMÉRICA DEL MERCADO DE QUINUA, POR TIPO, 2018-2032 (MILES DE USD)
TABLA 342 RESTO DE SUDAMÉRICA MERCADO DE QUINUA POR TIPO, 2018-2032 (MILES DE USD) (KILOTONELADAS)
TABLA 343 MERCADO DE QUINUA EN ORIENTE MEDIO Y ÁFRICA, POR PAÍS, 2018-2032 (MILES DE USD)
TABLA 344 MERCADO DE QUINUA EN ORIENTE MEDIO Y ÁFRICA, POR TIPO, 2018-2032 (MILES DE USD)
TABLA 345 MERCADO DE QUINUA EN ORIENTE MEDIO Y ÁFRICA, POR TIPO, 2018-2032 (MILES DE USD) (KILOTONELADAS)
TABLA 346 ORIENTE MEDIO Y ÁFRICA MERCADO ÚNICO DE QUINUA, POR TIPO, 2018-2032 (MILES DE USD)
TABLA 347 MERCADO DE QUINUA EN ORIENTE MEDIO Y ÁFRICA, POR NATURALEZA, 2018-2032 (MILES DE USD)
TABLA 348 MERCADO DE QUINUA EN ORIENTE MEDIO Y ÁFRICA, POR PRODUCTO, 2018-2032 (MILES DE USD)
TABLA 349 MERCADO DE QUINUA EN ORIENTE MEDIO Y ÁFRICA, POR TIPO DE ENVASE, 2018-2032 (MILES DE USD)
TABLA 350 MERCADO DE QUINUA EN ORIENTE MEDIO Y ÁFRICA, POR CANAL DE DISTRIBUCIÓN, 2018-2032 (MILES DE USD)
TABLA 351 ORIENTE MEDIO Y ÁFRICA FUERA DE LÍNEA EN EL MERCADO DE QUINUA, POR CANAL DE DISTRIBUCIÓN, 2018-2032 (MILES DE USD)
TABLA 352 ORIENTE MEDIO Y ÁFRICA MERCADO DE QUINUA EN LÍNEA, POR CANAL DE DISTRIBUCIÓN, 2018-2032 (MILES DE USD)
TABLA 353 MERCADO DE QUINUA DE LOS EMIRATOS ÁRABES UNIDOS, POR TIPO, 2018-2032 (MILES DE USD)
TABLA 354 MERCADO DE QUINUA DE LOS EMIRATOS ÁRABES UNIDOS, POR TIPO, 2018-2032 (MILES DE USD) (KILOTONELADAS)
TABLA 355 MERCADO DE QUINOA EN LOS EMIRATOS ÁRABES UNIDOS, POR TIPO, 2018-2032 (MILES DE USD)
TABLA 356 MERCADO DE QUINUA DE LOS EMIRATOS ÁRABES UNIDOS, POR NATURALEZA, 2018-2032 (MILES DE USD)
TABLA 357 MERCADO DE QUINUA DE LOS EMIRATOS ÁRABES UNIDOS, POR PRODUCTO, 2018-2032 (MILES DE USD)
TABLA 358 MERCADO DE QUINUA DE LOS EMIRATOS ÁRABES UNIDOS, POR TIPO DE ENVASE, 2018-2032 (MILES DE USD)
TABLA 359 MERCADO DE QUINUA DE LOS EMIRATOS ÁRABES UNIDOS, POR CANAL DE DISTRIBUCIÓN, 2018-2032 (MILES DE USD)
TABLA 360 EMIRATOS ÁRABES UNIDOS SIN CONEXIÓN EN EL MERCADO DE QUINOA, POR CANAL DE DISTRIBUCIÓN, 2018-2032 (MILES DE USD)
TABLA 361 MERCADO DE QUINOA EN LÍNEA EN LOS EAU, POR CANAL DE DISTRIBUCIÓN, 2018-2032 (MILES DE USD)
TABLA 362 MERCADO DE QUINUA DE ARABIA SAUDITA, POR TIPO, 2018-2032 (MILES DE USD)
TABLA 363 MERCADO DE QUINUA DE ARABIA SAUDITA, POR TIPO, 2018-2032 (MILES DE USD) (KILOTONELADAS)
TABLA 364 ARABIA SAUDITA, MERCADO DE QUINUA, POR TIPO, 2018-2032 (MILES DE USD)
TABLA 365 MERCADO DE QUINOA EN ARABIA SAUDITA, POR NATURALEZA, 2018-2032 (MILES DE USD)
TABLA 366 MERCADO DE QUINUA EN ARABIA SAUDITA, POR PRODUCTO, 2018-2032 (MILES DE USD)
TABLA 367 MERCADO DE QUINUA EN ARABIA SAUDITA, POR TIPO DE ENVASE, 2018-2032 (MILES DE USD)
TABLA 368 MERCADO DE QUINUA DE ARABIA SAUDITA, POR CANAL DE DISTRIBUCIÓN, 2018-2032 (MILES DE USD)
TABLA 369 ARABIA SAUDITA SIN CONEXIÓN EN EL MERCADO DE QUINUA, POR CANAL DE DISTRIBUCIÓN, 2018-2032 (MILES DE USD)
TABLA 370 MERCADO DE QUINUA EN LÍNEA EN ARABIA SAUDITA, POR CANAL DE DISTRIBUCIÓN, 2018-2032 (MILES DE USD)
TABLA 371 MERCADO DE QUINUA EN ISRAEL, POR TIPO, 2018-2032 (MILES DE USD)
TABLA 372 MERCADO DE QUINUA EN ISRAEL, POR TIPO, 2018-2032 (MILES DE USD) (KILOTONELADAS)
TABLA 373 ISRAEL ÚNICO EN EL MERCADO DE QUINUA, POR TIPO, 2018-2032 (MILES DE USD)
TABLA 374 MERCADO DE QUINUA EN ISRAEL, POR NATURALEZA, 2018-2032 (MILES DE USD)
TABLA 375 MERCADO DE QUINUA EN ISRAEL, POR PRODUCTO, 2018-2032 (MILES DE USD)
TABLA 376 MERCADO DE QUINUA EN ISRAEL, POR TIPO DE ENVASE, 2018-2032 (MILES DE USD)
TABLA 377 MERCADO DE QUINUA EN ISRAEL, POR CANAL DE DISTRIBUCIÓN, 2018-2032 (MILES DE USD)
TABLA 378 ISRAEL FUERA DE LÍNEA EN EL MERCADO DE QUINUA, POR CANAL DE DISTRIBUCIÓN, 2018-2032 (MILES DE USD)
TABLA 379 MERCADO DE QUINUA EN LÍNEA DE ISRAEL, POR CANAL DE DISTRIBUCIÓN, 2018-2032 (MILES DE USD)
TABLA 380 MERCADO DE QUINUA EN SUDÁFRICA, POR TIPO, 2018-2032 (MILES DE USD)
TABLA 381 MERCADO DE QUINUA DE SUDÁFRICA, POR TIPO, 2018-2032 (MILES DE USD) (KILOTONELADAS)
TABLA 382 SUDÁFRICA MERCADO ÚNICO DE QUINOA, POR TIPO, 2018-2032 (MILES DE USD)
TABLA 383 MERCADO DE QUINUA EN SUDÁFRICA, POR NATURALEZA, 2018-2032 (MILES DE USD)
TABLA 384 MERCADO DE QUINUA EN SUDÁFRICA, POR PRODUCTO, 2018-2032 (MILES DE USD)
TABLA 385 MERCADO DE QUINUA EN SUDÁFRICA, POR TIPO DE ENVASE, 2018-2032 (MILES DE USD)
TABLA 386 MERCADO DE QUINUA EN SUDÁFRICA, POR CANAL DE DISTRIBUCIÓN, 2018-2032 (MILES DE USD)
TABLA 387 SUDÁFRICA SIN CONEXIÓN EN EL MERCADO DE QUINUA, POR CANAL DE DISTRIBUCIÓN, 2018-2032 (MILES DE USD)
TABLA 388 SUDÁFRICA MERCADO DE QUINUA EN LÍNEA, POR CANAL DE DISTRIBUCIÓN, 2018-2032 (MILES DE USD)
TABLA 389 MERCADO DE QUINUA EN EGIPTO, POR TIPO, 2018-2032 (MILES DE USD)
TABLA 390 MERCADO DE QUINUA EN EGIPTO, POR TIPO, 2018-2032 (MILES DE USD) (KILOTONELADAS)
TABLA 391 EGIPTO, SOLO EN EL MERCADO DE QUINUA, POR TIPO, 2018-2032 (MILES DE USD)
TABLA 392 MERCADO DE QUINUA EN EGIPTO, POR NATURALEZA, 2018-2032 (MILES DE USD)
TABLA 393 MERCADO DE QUINUA EN EGIPTO, POR PRODUCTO, 2018-2032 (MILES DE USD)
TABLA 394 MERCADO DE QUINUA EN EGIPTO, POR TIPO DE ENVASE, 2018-2032 (MILES DE USD)
TABLA 395 MERCADO DE QUINUA EN EGIPTO, POR CANAL DE DISTRIBUCIÓN, 2018-2032 (MILES DE USD)
TABLA 396 EGIPTO SIN CONEXIÓN EN EL MERCADO DE QUINUA, POR CANAL DE DISTRIBUCIÓN, 2018-2032 (MILES DE USD)
TABLA 397 MERCADO DE QUINUA EN LÍNEA EN EGIPTO, POR CANAL DE DISTRIBUCIÓN, 2018-2032 (MILES DE USD)
TABLA 398 RESTO DEL MERCADO DE QUINUA EN ORIENTE MEDIO Y ÁFRICA, POR TIPO, 2018-2032 (MILES DE USD)
TABLA 399 RESTO DEL MERCADO DE QUINUA EN ORIENTE MEDIO Y ÁFRICA, POR TIPO, 2018-2032 (MILES DE USD) (KILOTONELADAS)
Lista de figuras
FIGURA 1 MERCADO MUNDIAL DE QUINUA
FIGURA 2 MERCADO MUNDIAL DE QUINOA: TRIANGULACIÓN DE DATOS
FIGURA 3 MERCADO MUNDIAL DE QUINUA: ANÁLISIS DROC
FIGURA 4 MERCADO MUNDIAL DE QUINOA: ANÁLISIS DEL MERCADO MUNDIAL VS. REGIONAL
FIGURA 5 MERCADO MUNDIAL DE QUINOA: ANÁLISIS DE INVESTIGACIÓN DE EMPRESAS
FIGURA 6 MERCADO MUNDIAL DE QUINUA: MODELADO MULTIVARIADO
FIGURA 7 MERCADO MUNDIAL DE QUINUA: DATOS DEMOGRÁFICOS DE LA ENTREVISTA
FIGURA 8 MERCADO MUNDIAL DE QUINOA: CUADRÍCULA DE POSICIÓN DE MERCADO DE DBMR
FIGURA 9 ANÁLISIS DE LA PARTICIPACIÓN DE LOS PROVEEDORES
FIGURA 10 MERCADO MUNDIAL DE QUINUA: RESUMEN EJECUTIVO
FIGURA 11 MERCADO MUNDIAL DE QUINUA: SEGMENTACIÓN
FIGURA 12 DOS SEGMENTOS COMPRENDEN EL MERCADO MUNDIAL DE QUINUA, POR TIPO
FIGURA 13 DECISIONES ESTRATÉGICAS
FIGURA 14 SE ESPERA QUE AMÉRICA DEL NORTE DOMINARÁ EL MERCADO MUNDIAL DE QUINUA Y SE ESPERA QUE CREZCA CON LA CAGR MÁS ALTA EN EL PERÍODO DE PRONÓSTICO
FIGURA 15 SE ESPERA QUE LA AUMENTO DE LA DEMANDA DE ALIMENTOS SIN GLUTEN Y DE ORIGEN VEGETAL IMPULSE EL MERCADO MUNDIAL DE QUINOA EN EL PERÍODO DE PRONÓSTICO
FIGURA 16 SE ESPERA QUE EL SEGMENTO ÚNICO REPRESENTE LA MAYOR PARTICIPACIÓN DEL MERCADO MUNDIAL DE QUINUA EN 2025 Y 2032
FIGURA 17 AMÉRICA DEL NORTE ES EL MERCADO DE MAYOR CRECIMIENTO PARA EL MERCADO MUNDIAL DE QUINUA EN EL PERÍODO DE PRONÓSTICO
FIGURA 18 MERCADO MUNDIAL DE POLIAMIDA DE CADENA LARGA, 2024-2032, PRECIO DE VENTA PROMEDIO (USD/KG)
FIGURA 19 FAMILIAS DE PATENTES
FIGURA 20 NÚMERO DE FAMILIAS DE PATENTES INTERNACIONALES POR AÑO DE PUBLICACIÓN
FIGURA 21 IMPULSORES, RESTRICCIONES, OPORTUNIDADES Y DESAFÍOS DEL MERCADO DE ZEOLITAS DE INDONESIA
FIGURA 22 MERCADO MUNDIAL DE QUINUA, POR TIPO, 2018-2032 (MILES DE USD)
FIGURA 23 MERCADO MUNDIAL DE QUINUA, POR PRODUCTO, 2018-2032 (MILES DE USD)
FIGURA 24 MERCADO MUNDIAL DE QUINUA, POR TIPO DE ENVASE, 2018-2032 (MILES DE USD)
FIGURA 25 MERCADO MUNDIAL DE QUINUA, POR NATURALEZA, 2018-2032 (MILES DE USD)
FIGURA 26 MERCADO MUNDIAL DE QUINUA, POR CANAL DE DISTRIBUCIÓN, 2018-2032 (MILES DE USD)
FIGURA 27 MERCADO MUNDIAL DE QUINUA: INSTANTÁNEA (2023)
FIGURA 28 MERCADO DE QUINUA EN AMÉRICA DEL NORTE: INSTANTÁNEA (2023)
FIGURA 29 MERCADO EUROPEO DE QUINOA: INSTANTÁNEA (2023)
FIGURA 30 MERCADO DE QUINUA EN ASIA-PACÍFICO: INSTANTÁNEA (2023)
FIGURA 31 MERCADO DE QUINUA EN AMÉRICA DEL SUR: INSTANTÁNEA (2023)
FIGURA 32 MERCADO DE QUINOA EN ORIENTE MEDIO Y ÁFRICA: INSTANTÁNEA (2023)
FIGURA 33 MERCADO MUNDIAL DE QUINOA: PARTICIPACIÓN DE LA EMPRESA 2024 (%)
FIGURA 34 MERCADO DE QUINUA EN AMÉRICA DEL NORTE: PARTICIPACIÓN DE LA EMPRESA 2024 (%)
FIGURA 35 MERCADO EUROPEO DE QUINOA: PARTICIPACIÓN DE LA EMPRESA 2024 (%)
FIGURA 36 MERCADO DE QUINUA DE ASIA-PACÍFICO: PARTICIPACIÓN DE LA EMPRESA 2024 (%)
Metodología de investigación
La recopilación de datos y el análisis del año base se realizan utilizando módulos de recopilación de datos con muestras de gran tamaño. La etapa incluye la obtención de información de mercado o datos relacionados a través de varias fuentes y estrategias. Incluye el examen y la planificación de todos los datos adquiridos del pasado con antelación. Asimismo, abarca el examen de las inconsistencias de información observadas en diferentes fuentes de información. Los datos de mercado se analizan y estiman utilizando modelos estadísticos y coherentes de mercado. Además, el análisis de la participación de mercado y el análisis de tendencias clave son los principales factores de éxito en el informe de mercado. Para obtener más información, solicite una llamada de un analista o envíe su consulta.
La metodología de investigación clave utilizada por el equipo de investigación de DBMR es la triangulación de datos, que implica la extracción de datos, el análisis del impacto de las variables de datos en el mercado y la validación primaria (experto en la industria). Los modelos de datos incluyen cuadrícula de posicionamiento de proveedores, análisis de línea de tiempo de mercado, descripción general y guía del mercado, cuadrícula de posicionamiento de la empresa, análisis de patentes, análisis de precios, análisis de participación de mercado de la empresa, estándares de medición, análisis global versus regional y de participación de proveedores. Para obtener más información sobre la metodología de investigación, envíe una consulta para hablar con nuestros expertos de la industria.
Personalización disponible
Data Bridge Market Research es líder en investigación formativa avanzada. Nos enorgullecemos de brindar servicios a nuestros clientes existentes y nuevos con datos y análisis que coinciden y se adaptan a sus objetivos. El informe se puede personalizar para incluir análisis de tendencias de precios de marcas objetivo, comprensión del mercado de países adicionales (solicite la lista de países), datos de resultados de ensayos clínicos, revisión de literatura, análisis de mercado renovado y base de productos. El análisis de mercado de competidores objetivo se puede analizar desde análisis basados en tecnología hasta estrategias de cartera de mercado. Podemos agregar tantos competidores sobre los que necesite datos en el formato y estilo de datos que esté buscando. Nuestro equipo de analistas también puede proporcionarle datos en archivos de Excel sin procesar, tablas dinámicas (libro de datos) o puede ayudarlo a crear presentaciones a partir de los conjuntos de datos disponibles en el informe.