Middle East And Africa Animal Feed Organic Trace Minerals Market
Tamaño del mercado en miles de millones de dólares
Tasa de crecimiento anual compuesta (CAGR) :
% 
 USD
78.38 Million
USD
127.94 Million
2024
2032
USD
78.38 Million
USD
127.94 Million
2024
2032
| 2025 –2032 | |
| USD 78.38 Million | |
| USD 127.94 Million | |
| % | |
|
Segmentación del mercado de minerales traza orgánicos para piensos animales en Oriente Medio y África, por producto (calcio, fósforo, magnesio, sodio, cloruro, azufre, potasio, zinc, hierro, cobre, yodo, cobalto, manganeso, selenio, cromo, molibdeno y otros), forma (seca y líquida), tipo de quelato (proteinato, complejo de aminoácidos, complejo de polisacáridos [quelato de zinc], quelato de cobre, quelato de magnesio y otros), ciclo de vida (pienso de crecimiento, de finalización, de inicio y de cría), aplicación (estimulación del crecimiento, prevención de enfermedades, mejora de la fertilidad, optimización del rendimiento y otros), ganadería (rumiantes, aves de corral, porcinos, acuicultura, mascotas, equinos y otros): tendencias de la industria y pronóstico hasta 2032.
Tamaño del mercado de minerales traza orgánicos para alimentación animal en Oriente Medio y África
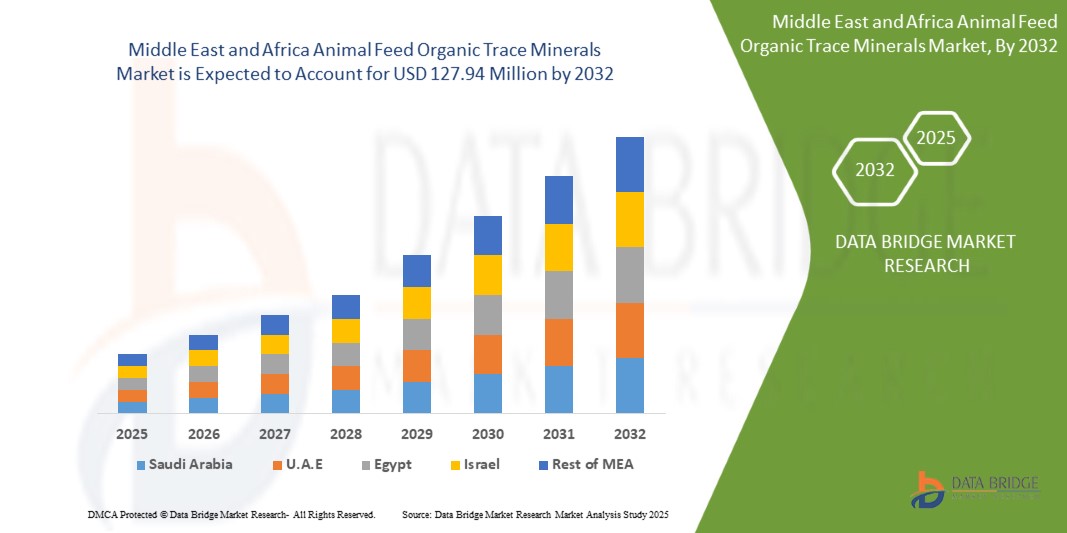
- El mercado de minerales traza orgánicos para alimentación animal en Oriente Medio y África se valoró en 78,38 millones de dólares en 2024 y se espera que alcance los 127,94 millones de dólares en 2032.
- Durante el período de pronóstico de 2025 a 2032, es probable que el mercado crezca a una CAGR del 6,42 %, impulsado principalmente por la creciente demanda de productos alimenticios derivados de animales enriquecidos con nutrientes y un mayor enfoque en mejorar la salud del ganado.
- Este crecimiento está impulsado por factores como la productividad y el cambio creciente hacia aditivos alimentarios orgánicos y sostenibles y regulaciones gubernamentales que limitan el uso de componentes sintéticos para alimentos.
Análisis del mercado de minerales traza orgánicos para piensos animales en Oriente Medio y África
- El mercado de minerales traza orgánicos para piensos animales en Oriente Medio y África está experimentando un crecimiento constante, impulsado por la creciente demanda de piensos fortificados nutricionalmente y la mejora de la productividad animal. Estos minerales, como el zinc, el cobre, el manganeso y el hierro, están quelados o unidos a proteínas, lo que ofrece una biodisponibilidad superior a la de sus homólogos inorgánicos. Su papel en la mejora de la inmunidad, la reproducción y la eficiencia alimentaria está cobrando importancia en los sectores de la avicultura comercial, la porcicultura y la cría de rumiantes. Sin embargo, persisten los desafíos para estandarizar las formulaciones, garantizar la trazabilidad y equilibrar los niveles de minerales para prevenir la toxicidad o la escorrentía ambiental.
- La transición de la industria ganadera hacia aditivos alimentarios sostenibles y que mejoran el rendimiento es un factor clave, especialmente a medida que los productores buscan alternativas a los antibióticos promotores del crecimiento (AGP). Los oligoelementos orgánicos favorecen la salud intestinal, el desarrollo esquelético y la modulación inmunitaria, en consonancia con el creciente énfasis de la región en el bienestar y la productividad animal. Los cambios regulatorios y la creciente preferencia por prácticas agrícolas sostenibles están impulsando aún más la adopción de suplementos minerales orgánicos.
- Sudáfrica domina el mercado de Oriente Medio y África, gracias a sus consolidados sectores avícola y de rumiantes, la creciente adopción de soluciones de alimentación sostenible y la creciente demanda de proteína animal de alta calidad. La creciente inversión en tecnologías modernas de alimentación y el uso de oligoelementos orgánicos para mejorar los índices de conversión alimenticia y reducir el impacto ambiental están consolidando el liderazgo de Sudáfrica.
- Los actores del mercado se están enfocando en tecnologías avanzadas de quelación para mejorar la absorción de minerales y minimizar la excreción. La innovación de productos se centra en formulaciones específicas para cada especie, métodos de encapsulación e integración con aditivos funcionales como probióticos y enzimas. Fortalecer la trazabilidad y el cumplimiento de las normas internacionales de calidad de los alimentos será clave para mantener la competitividad y satisfacer la creciente demanda en la región.
Alcance del informe y segmentación del mercado de minerales traza orgánicos para alimentación animal en Oriente Medio y África
|
Atributos |
Información clave del mercado de minerales traza orgánicos para piensos para animales en Oriente Medio y África |
|
Segmentos cubiertos |
|
|
Países cubiertos |
Oriente Medio y África
|
|
Actores clave del mercado |
|
|
Oportunidades de mercado |
|
|
Conjuntos de información de datos de valor añadido |
Además de los conocimientos sobre escenarios de mercado como valor de mercado, tasa de crecimiento, segmentación, cobertura geográfica y actores principales, los informes de mercado seleccionados por Data Bridge Market Research también incluyen análisis de expertos en profundidad, análisis de precios, análisis de participación de marca, encuesta de consumidores, análisis demográfico, análisis de la cadena de suministro, análisis de la cadena de valor, descripción general de materias primas/consumibles, criterios de selección de proveedores, análisis PESTLE, análisis de Porter y marco regulatorio. |
Tendencias del mercado de minerales traza orgánicos para alimentación animal en Oriente Medio y África
Nutrición de precisión y abastecimiento sostenible de minerales en la alimentación del ganado
- Una tendencia destacada en el mercado de minerales traza orgánicos para alimentos para animales en Oriente Medio y África es el creciente enfoque en la nutrición de precisión y la adopción de formulaciones minerales de origen sostenible adaptadas a los requisitos dietéticos específicos de cada especie.
- El mercado está experimentando una mayor demanda de minerales traza quelados y proteinados debido a su mayor biodisponibilidad, menor excreción ambiental y mejor rendimiento animal. Este cambio se debe a la creciente preocupación por la eficiencia alimentaria, la salud animal y la huella ecológica de las explotaciones ganaderas.
- Por ejemplo, en 2024, Zinpro Corporation lanzó una nueva línea de mezclas minerales orgánicas optimizadas para cada especie que mejoran las tasas de absorción y reducen el impacto ambiental. Estos productos se desarrollan mediante metodologías de Análisis del Ciclo de Vida (ACV) y cumplen con los estándares de sostenibilidad de Oriente Medio y África, como las directrices LEAP de la FAO.
- Las principales empresas están integrando tecnologías de formulación basadas en datos —que aprovechan el monitoreo del consumo de alimento, el modelado del crecimiento y el análisis de salud— para ofrecer una dosificación precisa de minerales. Simultáneamente, se hace cada vez más hincapié en prácticas responsables de abastecimiento de minerales, como cadenas de suministro trazables, certificaciones de minería ética (p. ej., IRMA) y procesos de fabricación con emisiones de carbono neutras.
- Dado que los organismos reguladores y los usuarios finales exigen trazabilidad y cumplimiento ambiental, los productores de minerales traza orgánicos se están centrando en aditivos alimentarios de etiqueta limpia, auditorías de sostenibilidad de terceros e informes alineados con ESG, lo que les ayuda a construir una diferenciación competitiva y la confianza de los compradores a largo plazo en los mercados internacionales.
Dinámica del mercado de minerales traza orgánicos para piensos animales en Oriente Medio y África
Conductor
Creciente demanda de productos alimenticios de origen animal enriquecidos con nutrientes
- Uno de los principales impulsores del mercado de minerales traza orgánicos para piensos animales en Oriente Medio y África es la creciente demanda de productos alimenticios de origen animal enriquecidos con nutrientes, como carne, leche y huevos fortificados. A medida que los consumidores de todo el mundo se preocupan cada vez más por su salud, se da mayor importancia a la calidad nutricional y los beneficios funcionales de los alimentos de origen animal.
- Los oligoelementos orgánicos, como el zinc quelado, el cobre, el selenio y el manganeso, contribuyen a una mayor densidad de nutrientes en los productos de origen animal al mejorar la absorción y retención de minerales en el ganado. Esto contribuye a una mejor calidad de la carne, la composición de la leche y el contenido nutricional de los huevos, en línea con la demanda de los consumidores de opciones alimentarias más saludables y con mayor valor añadido.
- La creciente conciencia de las deficiencias de micronutrientes en las dietas humanas ha impulsado a los productores ganaderos y fabricantes de alimentos a optimizar las formulaciones de alimentos con minerales orgánicos, que son más biodisponibles que sus contrapartes inorgánicas y garantizan una mejor transferencia de nutrientes esenciales a través de la cadena alimentaria.
- A medida que los mercados de Medio Oriente y África priorizan cada vez más la seguridad alimentaria, la nutrición y la sostenibilidad, el uso de minerales traza orgánicos en la alimentación animal se está convirtiendo en una estrategia clave para mejorar la salud animal, mejorar la calidad del producto y cumplir con los estándares dietéticos y regulatorios cambiantes, lo que en última instancia impulsa el crecimiento del mercado a largo plazo en todas las regiones.
Oportunidad
Avances tecnológicos en quelación y microencapsulación
- Los nuevos métodos de quelación permiten una unión más fuerte de los minerales con aminoácidos y ligandos orgánicos, lo que mejora significativamente la biodisponibilidad y la absorción en el ganado. Esto garantiza una utilización más eficiente de los nutrientes en comparación con las formas inorgánicas tradicionales.
- Las tecnologías de microencapsulación se están adoptando cada vez más para proteger los oligoelementos de la degradación durante el procesamiento y la digestión del alimento. Estas innovaciones permiten una liberación controlada y una administración dirigida en el punto de absorción.
- Los sistemas de encapsulación avanzados también permiten la combinación de minerales con otros aditivos funcionales, como probióticos y vitaminas, creando plataformas de suministro de múltiples nutrientes adaptadas a las necesidades específicas de las especies.
- Estas mejoras tecnológicas no solo aumentan la eficiencia alimentaria y el rendimiento animal, sino que también reducen el desperdicio de minerales y la escorrentía ambiental, alineándose con la sostenibilidad y los requisitos regulatorios en la agricultura animal moderna.
- Las empresas que invierten en procesos de quelación validados y plataformas de encapsulación de próxima generación están obteniendo ventajas competitivas al ofrecer un rendimiento más consistente, cumplimiento de los estándares de calidad y soluciones ecológicas.
Restricción/Desafío
Equilibrar la nutrición con la asequibilidad
- Uno de los principales desafíos que frena el crecimiento del mercado de oligoelementos orgánicos para piensos en Oriente Medio y África es la dificultad de equilibrar la nutrición de alto rendimiento con la rentabilidad. Si bien los oligoelementos orgánicos ofrecen una biodisponibilidad superior y beneficios para la salud animal, sus mayores costos de producción y formulación limitan su accesibilidad, especialmente en las regiones en desarrollo.
- Los fabricantes de piensos y los ganaderos a menudo se enfrentan a la presión de los precios para mantener la competitividad de los costes generales de los piensos. Como resultado, a veces se relega la adopción de minerales orgánicos de primera calidad a favor de alternativas inorgánicas más asequibles, incluso a costa de la productividad animal a largo plazo y la eficiencia ambiental.
- Los productores de pequeña y mediana escala, en particular, tienen dificultades para absorber los costos adicionales asociados con la inclusión de minerales orgánicos, a pesar del posible retorno de la inversión a través de mejores índices de conversión alimenticia, inmunidad y desempeño reproductivo.
- La volatilidad de los costos de las materias primas, sumada a la limitada capacidad de producción local en ciertas regiones, complica aún más la dinámica de los precios, obligando a los fabricantes a hacer concesiones entre la calidad nutricional y la viabilidad económica en las formulaciones de alimentos.
- Hasta que las tecnologías de optimización de costos se difundan más y la propuesta de valor se comunique mejor a lo largo de la cadena de suministro, la asequibilidad seguirá siendo una barrera crítica para la adopción a gran escala de minerales traza orgánicos en las estrategias de nutrición animal de Medio Oriente y África.
Alcance del mercado de minerales traza orgánicos para piensos animales en Oriente Medio y África
El mercado de minerales traza orgánicos para alimentos para animales en Oriente Medio y África está segmentado en seis segmentos notables según el producto, la forma, el tipo de quelato, el ciclo de vida, la aplicación y el ganado.
• Por producto
En cuanto al producto, el mercado de minerales traza orgánicos para piensos en Oriente Medio y África se segmenta en calcio, fósforo, magnesio, sodio, cloruro, azufre, potasio, zinc, hierro, cobre, yodo, cobalto, manganeso, selenio, cromo, molibdeno, entre otros. En 2025, se proyecta que el segmento del calcio domine con una cuota de mercado del 17,32%, debido a su papel fundamental en el desarrollo óseo, la formación de la cáscara y la función muscular del ganado. Su amplio uso en aves de corral, cerdos y rumiantes respalda su sólida cuota de mercado.
Se prevé que el calcio gane impulso con una tasa de crecimiento anual compuesta (TCAC) del 7,75 % durante el período de pronóstico de 2025 a 2032, impulsado por su papel esencial en la inmunidad y la reproducción. Su creciente adopción en programas de nutrición de precisión lo posiciona como un factor clave para el crecimiento del mercado a largo plazo.
• Por formulario
Según su presentación, el mercado se clasifica en seco y líquido. En 2025, se prevé que el segmento seco domine con una cuota de mercado del 85,56 %, debido principalmente a su facilidad de almacenamiento, manipulación e incorporación en formulaciones de piensos compuestos. Las presentaciones secas también garantizan una mayor estabilidad durante el procesamiento y el transporte del pienso.
Se proyecta que el segmento seco se expandirá de manera constante con una CAGR del 6,51% a medida que gane popularidad en las prácticas agrícolas intensivas, particularmente en la avicultura y la acuicultura.
• Por tipo de quelato
Según el tipo de quelato, el mercado se segmenta en proteinatos, complejos de aminoácidos, complejos de polisacáridos (quelato de zinc), quelatos de cobre, quelatos de magnesio y otros. Para 2025, se prevé que el segmento de proteinatos domine con una cuota de mercado del 34,83 %, gracias a su superior biodisponibilidad y eficiencia en la administración de minerales directamente unidos a proteínas o aminoácidos. Su probada eficacia para mejorar el crecimiento, la reproducción y la inmunidad animal sustenta su demanda.
Es probable que el segmento de proteinatos experimente un crecimiento acelerado del 7,27% durante el período de pronóstico, respaldado por innovaciones en la tecnología de quelación que mejoran la estabilidad y la absorción de minerales.
• Por ciclo de vida
Según el ciclo de vida, el mercado se segmenta en alimento para engorde, alimento para finalización, alimento para iniciación y alimento para cría. En 2025, se proyecta que el segmento de alimento para engorde domine con una participación de mercado del 43,88%, impulsado por el papel crucial de los oligoelementos para promover una ganancia de peso óptima, el desarrollo muscular y la eficiencia metabólica durante la fase de crecimiento del ganado.
El segmento de alimentos para productores está ganando importancia y creciendo con una CAGR del 6,90 % debido a la creciente demanda de una ganancia de peso optimizada, desarrollo muscular y eficiencia alimentaria durante la fase crítica de crecimiento del ganado.
• Por aplicación
Según su aplicación, el mercado se segmenta en promoción del crecimiento, prevención de enfermedades, mejora de la fertilidad, optimización del rendimiento, entre otros. En 2025, se prevé que el segmento de promoción del crecimiento domine con una cuota de mercado del 35,50 %, impulsado por la creciente demanda en Oriente Medio y África de una mayor producción de carne y lácteos. Los productores están optando cada vez más por la suplementación mineral como alternativa sostenible a los antibióticos promotores del crecimiento.
Se espera que el segmento de promoción del crecimiento crezca a una CAGR del 7,15%, impulsado por la creciente demanda de mayores rendimientos de carne y productos lácteos, una mejor eficiencia alimentaria y el cambio hacia alternativas sostenibles a los promotores de crecimiento antibióticos.
• Por ganado
En cuanto a la ganadería, el mercado se segmenta en rumiantes, aves de corral, cerdos, acuicultura, mascotas, equinos y otros. Se proyecta que, en 2025, el segmento de rumiantes lidere con una cuota de mercado del 32,22 %, debido a la gran población bovina de Oriente Medio y África y al papel crucial de los oligoelementos en la producción de leche, la fertilidad y la resistencia a las enfermedades.
Se prevé que el segmento de rumiantes registre el crecimiento más rápido del 7,60% durante 2025 a 2032, impulsado por la creciente demanda de leche y carne de vacuno de Oriente Medio y África, junto con la adopción de minerales quelados para mejorar la fertilidad, la inmunidad y la eficiencia alimentaria en el ganado y otros rumiantes.
Oriente Medio y África Mercado de minerales traza orgánicos para alimentación animal en Oriente Medio y África: análisis regional
- Se espera que el mercado de Medio Oriente y África se expanda de manera constante, impulsado por la creciente demanda de producción ganadera sostenible, el aumento de las inversiones en la fabricación de alimentos modernos y la creciente conciencia de los beneficios de la nutrición animal.
- La adopción de minerales traza orgánicos está respaldada por esfuerzos para mejorar la eficiencia alimentaria, mejorar la salud animal y reducir el impacto ambiental, en particular en regiones con una producción avícola y lechera intensificada.
- Sudáfrica domina el mercado regional, apoyada por su avanzado sector ganadero, sus industrias avícola y de carne vacuna en expansión y la creciente preferencia de los consumidores por productos animales de alta calidad y rastreables.
Perspectiva del mercado de minerales traza orgánicos en alimentos para animales de Sudáfrica, Oriente Medio y África
Sudáfrica representa el mercado líder de minerales traza orgánicos en Oriente Medio y África, gracias a su avanzado sector ganadero y a sus consolidadas industrias avícola y de carne de vacuno. La moderna infraestructura de fabricación de piensos del país, la creciente adopción de la nutrición de precisión y el creciente énfasis en la salud y la productividad animal impulsan la demanda. La creciente preferencia de los consumidores por productos animales de alta calidad, trazables y sin antibióticos, junto con las iniciativas de la industria para mejorar la eficiencia alimentaria y reducir la excreción de nutrientes, consolidan aún más la posición de Sudáfrica en el mercado.
Perspectiva del mercado de minerales traza orgánicos en piensos para animales en Arabia Saudita, Oriente Medio y África
Arabia Saudita se está consolidando como un mercado clave en Oriente Medio, impulsada por las inversiones gubernamentales en seguridad alimentaria, autosuficiencia y modernización de la ganadería. El fuerte enfoque del país en la producción avícola y láctea, sumado a políticas de apoyo para reducir la dependencia de las importaciones, está acelerando la adopción de oligoelementos orgánicos. La creciente demanda de carne y lácteos de primera calidad por parte de los consumidores, los avances en las tecnologías de producción de piensos y las iniciativas que promueven prácticas ganaderas sostenibles impulsan aún más el crecimiento del mercado en Arabia Saudita.
Los principales líderes del mercado que operan en el mercado son:
- ADM (EE. UU.)
- Nutreco (Países Bajos)
- Adisseo (Francia)
- Novus International, Inc. (EE. UU.)
- Alltech (EE. UU.)
- dsm-firmenich (Suiza)
- Phibro Animal Health Corporation (EE. UU.)
- Cargill, Incorporated (EE. UU.)
- BASF (Alemania)
- Zinpro (EE. UU.)
- Biochem Zusatzstoffe Handels- und Produktionsgesellschaft mbH (Alemania)
Últimos avances en el mercado de minerales traza orgánicos para alimentación animal en Oriente Medio y África
- En julio de 2025, Adisseo anunció la próxima inauguración de una nueva planta de producción de MetaSmart, prevista para finales del segundo semestre de 2025, para satisfacer las crecientes necesidades de la industria láctea mundial. Esta ampliación de capacidad reforzará la capacidad de Adisseo para suministrar metionina protegida, crucial para la nutrición de rumiantes. Este desarrollo respalda el enfoque estratégico de la compañía en la producción lechera sostenible y mejora la fiabilidad de su suministro global.
- En febrero de 2023, Adisseo anunció la adquisición de Nor-Feed, empresa especializada en aditivos vegetales naturales para la nutrición animal. Esta estrategia fortalece la cartera de ingredientes especiales para piensos de Adisseo y consolida su posición en el segmento de aditivos naturales y sostenibles. La adquisición respalda la estrategia de innovación y el crecimiento de Adisseo en el mercado de piensos funcionales.
- En abril de 2025, NOVUS International amplió su presencia en el mercado asiático apoyando a las industrias porcina y avícola de Vietnam mediante soluciones nutricionales específicas y servicios técnicos. Esta iniciativa fortalece la presencia de NOVUS en el mercado regional, impulsa la visibilidad de la marca y fomenta la fidelización de los clientes. Al abordar los desafíos de la producción local con sus ofertas clave, como suplementos de metionina, aditivos enzimáticos para piensos y soluciones para la salud intestinal, NOVUS fortalece su posicionamiento en el mercado e impulsa la adopción de sus innovaciones en nutrición animal en todo Vietnam.
- En mayo de 2025, en el evento FENAVI Valle, NOVUS destacó su compromiso continuo con el desarrollo de la eficiencia de la soja y la promoción de soluciones agrícolas sostenibles. Al presentar sus enfoques innovadores para mejorar el rendimiento de los cultivos y minimizar el impacto ambiental, NOVUS resaltó su liderazgo en el sector. Sus contribuciones al debate sobre prácticas agrícolas sostenibles no solo refuerzan su papel como pioneros en la industria, sino que también se alinean con los esfuerzos de Oriente Medio y África para aumentar la seguridad alimentaria y reducir el uso de recursos. Esta participación posiciona a NOVUS como un actor clave en el sector de la tecnología agrícola, fortaleciendo su reputación y su potencial de crecimiento a largo plazo al aprovechar la creciente demanda de soluciones agrícolas ecológicas.
SKU-
Obtenga acceso en línea al informe sobre la primera nube de inteligencia de mercado del mundo

- Panel de análisis de datos interactivo
- Panel de análisis de empresas para oportunidades con alto potencial de crecimiento
- Acceso de analista de investigación para personalización y consultas
- Análisis de la competencia con panel interactivo
- Últimas noticias, actualizaciones y análisis de tendencias
- Aproveche el poder del análisis de referencia para un seguimiento integral de la competencia
Tabla de contenido
1 INTRODUCCIÓN
1.1 OBJETIVOS DEL ESTUDIO
1.2 DEFINICIÓN DE MERCADO
1.3 RESUMEN
1.4 LIMITACIONES
1.5 MERCADOS CUBIERTOS
2 SEGMENTACIÓN DEL MERCADO
2.1 MERCADOS CUBIERTOS
2.2 ÁMBITO GEOGRÁFICO
2,3 AÑOS CONSIDERADOS PARA EL ESTUDIO
2.4 MONEDA Y PRECIOS
2.5 MODELO DE VALIDACIÓN DE DATOS TRÍPODE DBMR
2.6 MODELADO MULTIVARIADO
2.7 ENTREVISTAS PRINCIPALES CON LÍDERES DE OPINIÓN CLAVE
2.8 CUADRÍCULA DE POSICIÓN DE MERCADO DBMR
2.9 ANÁLISIS DE PARTICIPACIÓN DE PROVEEDORES DE DBMR
2.1 CUADRÍCULA DE COBERTURA DE APLICACIONES DEL MERCADO
2.11 FUENTES SECUNDARIAS
2.12 SUPUESTOS
3 RESUMEN EJECUTIVO
4 INFORMACIÓN PREMIUM
4.1 ANÁLISIS DE LAS CINCO FUERZAS DE PORTER
4.1.1 AMENAZA DE NUEVOS ENTRANTES
4.1.2 PODER DE NEGOCIACIÓN DE LOS PROVEEDORES
4.1.3 PODER DE NEGOCIACIÓN DE LOS COMPRADORES
4.1.4 AMENAZA DE SUSTITUTOS
4.1.5 COMPETENCIA INTERNA
4.2 ANÁLISIS DE PATENTES
4.2.1 CALIDAD Y RESISTENCIA DE LA PATENTE
4.2.2 FAMILIAS DE PATENTES
4.2.3 PANORAMA REGIONAL DE PATENTES
4.2.4 ESTRATEGIA Y GESTIÓN DE LA PROPIEDAD INTELECTUAL
4.2.5 CONCLUSIÓN
4.3 ANÁLISIS DE PRECIOS
4.4 COBERTURA DE MATERIA PRIMA – MERCADO DE MINERALES TRAZA ORGÁNICOS DE ALIMENTOS PARA ANIMALES EN ORIENTE MEDIO Y ÁFRICA
4.4.1 FUENTES MINERALES PRIMARIAS
4.4.2 LIGANDOS ORGÁNICOS Y AGENTES QUELATANTES
4.4.3 ADITIVOS AUXILIARES E INSUMOS DE PROCESAMIENTO
4.4.4 TENDENCIAS DE ABASTECIMIENTO Y CONSIDERACIONES DE LA CADENA DE SUMINISTRO
4.4.5 CONCLUSIÓN
4.5 CUADRANTE DE EVALUACIÓN DE EMPRESAS
4.6 ESCENARIO DE IMPORTACIÓN Y EXPORTACIÓN
4.6.1 IMPORTAR CONJUNTOS DE DATOS
4.6.2 EXPORTAR CONJUNTOS DE DATOS
4.7 ANÁLISIS DE PRODUCCIÓN Y CONSUMO
4.7.1 PRODUCCIÓN
4.7.2 CONSUMO
4.8 ESCENARIO DE IMPORTACIÓN Y EXPORTACIÓN
4.9 SEGUIMIENTO DE INNOVACIÓN Y ANÁLISIS ESTRATÉGICO.
4.9.1 ANÁLISIS DE GRANDES ACUERDOS Y ALIANZAS ESTRATÉGICAS
4.9.1.1 EMPRESAS CONJUNTAS
4.9.1.2 FUSIONES Y ADQUISICIONES
4.9.1.3 LICENCIAS Y ASOCIACIONES
4.9.1.4 COLABORACIONES TECNOLÓGICAS
4.9.2 PRODUCTOS EN DESARROLLO
4.9.3 ETAPA DE DESARROLLO
4.9.4 CRONOGRAMAS E HITOS
4.9.5 ESTRATEGIAS Y METODOLOGÍAS DE INNOVACIÓN
4.9.6 EVALUACIÓN Y MITIGACIÓN DE RIESGOS
4.9.7 PERSPECTIVAS FUTURAS
4.1 DESGLOSE DEL ANÁLISIS DE COSTOS
4.10.1 COSTOS DE MATERIA PRIMA (40%–55% DEL COSTO TOTAL)
4.10.2 COSTOS DE PROCESAMIENTO Y FABRICACIÓN (20%–30%)
4.10.3 CUMPLIMIENTO NORMATIVO Y CONTROL DE CALIDAD (5%–10%)
4.10.4 EMBALAJE, ETIQUETADO Y LOGÍSTICA (5%–8%)
4.10.5 INVESTIGACIÓN Y DESARROLLO (3%–6%)
4.10.6 MARKETING, VENTAS Y DISTRIBUCIÓN (2%–5%)
4.10.7 COSTOS ADMINISTRATIVOS Y GENERALES (5%–8%)
4.11 PERSPECTIVA DE LA MARCA
4.12 ANÁLISIS DE LA CADENA DE SUMINISTRO
4.12.1 DESCRIPCIÓN GENERAL
4.12.2 ESCENARIO DE COSTOS LOGÍSTICOS
4.12.3 IMPORTANCIA DE LOS PROVEEDORES DE SERVICIOS LOGÍSTICOS
4.13 ANÁLISIS DE LA CADENA DE VALOR
4.13.1 PROVEEDORES DE MATERIAS PRIMAS: LA BASE DE LA BIODISPONIBILIDAD
4.13.2 FABRICANTES DE MINERALES OLIGOSO ORGÁNICOS: CREACIÓN DE INSUMOS NUTRICIONALES DE ALTO RENDIMIENTO
4.13.3 FABRICANTES DE PREMEZCLAS Y PIENSOS: INTEGRANDO LA NUTRICIÓN EN LA DIETA DIARIA
4.13.4 DISTRIBUIDORES Y SOCIOS DE LA CADENA DE SUMINISTRO: GARANTIZAR LA ACCESIBILIDAD Y LA EFICIENCIA
4.13.5 PRODUCTORES DE GANADO Y USUARIOS FINALES: LOS IMPULSORES DE LA DEMANDA NUTRICIONAL
4.13.6 ORGANISMOS REGULADORES Y MARCOS DE CUMPLIMIENTO: CONFIGURANDO LAS PRÁCTICAS DEL MERCADO
4.13.7 INSTITUCIONES DE INVESTIGACIÓN Y ASOCIACIONES INDUSTRIALES: CATALIZADORES DEL AVANCE CIENTÍFICO
4.14 AVANCES TECNOLÓGICOS
4.14.1 TECNOLOGÍAS DE QUELACIÓN Y COMPLEJACIÓN
4.14.2 SISTEMAS DE ENCAPSULACIÓN Y LIBERACIÓN CONTROLADA
4.14.3 NANOTECNOLOGÍA EN MINERALES TRAZA
4.14.4 PRODUCCIÓN DE MINERALES BASADA EN FERMENTACIÓN
4.14.5 NUTRICIÓN DE PRECISIÓN Y HERRAMIENTAS DE FORMULACIÓN IMPULSADAS POR IA
4.14.6 INNOVACIONES ENFOCADAS EN LA SOSTENIBILIDAD
4.14.7 TRAZABILIDAD DIGITAL E INTEGRACIÓN DE BLOCKCHAIN
4.14.8 USO DE IOT Y SENSORES EN EL MONITOREO DE LA EFICACIA MINERAL
4.14.9 DESARROLLO DE MEZCLAS MINERALES CON ADITIVOS FUNCIONALES
4.14.10 CONTROL DE CALIDAD AVANZADO Y PRUEBAS ANALÍTICAS
4.15 CRITERIOS DE SELECCIÓN DE PROVEEDORES.
4.15.1 CALIDAD Y CERTIFICACIÓN DEL PRODUCTO
4.15.2 CAPACIDADES DE FABRICACIÓN
4.15.3 INVESTIGACIÓN Y DESARROLLO (I+D) E INNOVACIÓN
4.15.4 CUMPLIMIENTO NORMATIVO Y TRAZABILIDAD
4.15.5 CONFIABILIDAD DE LA CADENA DE SUMINISTRO
4.15.6 PRECIOS Y TÉRMINOS COMERCIALES
4.15.7 EMBALAJE Y LOGÍSTICA
4.15.8 SERVICIOS DE ASESORAMIENTO Y SOPORTE TÉCNICO
4.15.9 PRÁCTICAS DE SOSTENIBILIDAD Y ESG
4.15.10 REPUTACIÓN Y REFERENCIAS DE CLIENTES
4.15.11 DOCUMENTACIÓN Y CUMPLIMIENTO LEGAL
4.15.12 GESTIÓN DE LA RELACIÓN CON EL CLIENTE
4.16 ARANCELES E IMPACTO EN EL MERCADO DE MINERALES ORGÁNICOS PARA ALIMENTOS ANIMALES EN ORIENTE MEDIO Y ÁFRICA
4.16.1 PANORAMA ARANCELARIO: DERECHOS APLICABLES A LOS INSUMOS DE MINERALES ORGÁNICOS TRAZA Y PREMEZCLAS TERMINADAS
4.16.2 IMPACTO DE LOS ARANCELES EN LOS COSTOS Y LA DINÁMICA DE LA CADENA DE SUMINISTRO
4.16.3 INFLUENCIA DE LAS POLÍTICAS COMERCIALES Y LOS DESARROLLOS GEOPOLÍTICOS
4.16.4 TENDENCIAS DEL MERCADO QUE AMPLIFICAN EL IMPACTO ARANCELARIO
4.16.5 IMPLICACIONES COMPETITIVAS PARA LOS AGENTES DEL MERCADO
4.16.6 DESAFÍOS Y OPORTUNIDADES DERIVADOS DE LOS ARANCELES
4.16.7 JUGADORES CLAVE
4.16.8 CONCLUSIÓN
5 COBERTURA REGLAMENTARIA
6 PANORAMA GENERAL DEL MERCADO
6.1 CONDUCTORES
6.1.1 AUMENTO DE LA DEMANDA DE PRODUCTOS ALIMENTICIOS DE ORIGEN ANIMAL ENRIQUECIDOS CON NUTRIENTES
6.1.2 MAYOR ENFOQUE EN LA MEJORA DE LA SALUD Y LA PRODUCTIVIDAD DEL GANADO
6.1.3 CAMBIO CRECIENTE HACIA ADITIVOS PARA ALIMENTOS ORGÁNICOS Y SOSTENIBLES
6.1.4 REGLAMENTOS GUBERNAMENTALES QUE LIMITAN EL USO DE COMPONENTES SINTÉTICOS DE ALIMENTOS
6.2 RESTRICCIONES
6.2.1 MAYORES COSTOS DE PRODUCCIÓN Y FORMULACIÓN DE MINERALES ORGÁNICOS
6.2.2 POCA CONCIENCIA DE LOS AGRICULTORES EN MERCADOS DE GANADO DE BAJOS INGRESOS O RURALES
6.3 OPORTUNIDADES
6.3.1 AVANCES TECNOLÓGICOS EN QUELACIÓN Y MICROENCAPSULACIÓN
6.3.2 ENFOQUE CRECIENTE EN LA NUTRICIÓN DE PRECISIÓN Y FÓRMULAS PERSONALIZADAS
6.3.3 EXPANSIÓN DEL MERCADO DE ALIMENTOS ACUÍCOLAS
6.4 DESAFÍOS
6.4.1 EQUILIBRAR LA NUTRICIÓN CON LA ASEQUIBILIDAD
6.4.2 COMPETENCIA DE MINERALES INORGÁNICOS CONVENCIONALES
7 MERCADO DE MINERALES ORGÁNICOS PARA ALIMENTOS ANIMALES EN ORIENTE MEDIO Y ÁFRICA, POR PRODUCTO
7.1 DESCRIPCIÓN GENERAL
7.2 CALCIO
7.3 FÓSFORO
7.4 MAGNESIO
7.5 SODIO
7.6 CLORURO
7.7 AZUFRE
7.8 POTASIO
7.9 ZINC
7.1 HIERRO
7.11 COBRE
7.12 YODO
7.13 COBALTO
7.14 MANGANESO
7.15 SELENIO
7.16 CROMO
7.17 MOLIBDENO
7.18 OTROS
8 MERCADO DE MINERALES ORGÁNICOS PARA ALIMENTOS ANIMALES EN ORIENTE MEDIO Y ÁFRICA, POR FORMA
8.1 DESCRIPCIÓN GENERAL
8.2 SECO
8.3 LÍQUIDO
9 MERCADO DE MINERALES ORGÁNICOS PARA ALIMENTOS ANIMALES EN ORIENTE MEDIO Y ÁFRICA, POR TIPO DE QUELATO
9.1 DESCRIPCIÓN GENERAL
9.2 PROTEINATO
9.3 COMPLEJO DE AMINOÁCIDOS
9.4 COMPLEJO DE POLISACÁRIDOS (QUELATO DE ZN)
9.5 QUELATO DE COBRE
9.6 QUELATO DE MAGNESIO
9.7 OTROS
10 MERCADO DE MINERALES ORGÁNICOS PARA ALIMENTOS ANIMALES EN ORIENTE MEDIO Y ÁFRICA, POR CICLO DE VIDA
10.1 DESCRIPCIÓN GENERAL
10.2 ALIMENTO PARA EL CRECIMIENTO
10.3 ALIMENTACIÓN DEL FINALIZADOR
10.4 ALIMENTO INICIAL
10.5 ALIMENTO PARA CRIADORAS
11 MERCADO DE MINERALES ORGÁNICOS PARA ALIMENTOS ANIMALES EN ORIENTE MEDIO Y ÁFRICA, POR APLICACIÓN
11.1 DESCRIPCIÓN GENERAL
11.2 PROMOCIÓN DEL CRECIMIENTO
11.3 PREVENCIÓN DE ENFERMEDADES
11.4 MEJORA DE LA FERTILIDAD
11.5 OPTIMIZACIÓN DEL RENDIMIENTO
11.6 OTROS
12 MERCADO DE MINERALES ORGÁNICOS PARA ALIMENTOS ANIMALES EN ORIENTE MEDIO Y ÁFRICA, POR GANADO
12.1 DESCRIPCIÓN GENERAL
12.2 RUMIANTES
12.3 AVES DE CORRAL
12.4 CERDOS
12.5 ACUICULTURA
12.6 MASCOTAS
12.7 EQUINO
12.8 OTROS
13 MERCADO DE MINERALES ORGÁNICOS PARA ALIMENTOS ANIMALES EN ORIENTE MEDIO Y ÁFRICA, POR REGIÓN
13.1 ORIENTE MEDIO Y ÁFRICA
13.1.1 SUDÁFRICA
13.1.2 ARABIA SAUDITA
13.1.3 EGIPTO
13.1.4 Emiratos Árabes Unidos
13.1.5 ISRAEL
13.1.6 KUWAIT
13.1.7 OMÁN
13.1.8 CATAR
13.1.9 RESTO DE ORIENTE MEDIO Y ÁFRICA
14 ORIENTE MEDIO Y ÁFRICA MERCADO DE MINERALES TRAZATIVOS ORGÁNICOS DE ALIMENTOS PARA ANIMALES, PANORAMA EMPRESARIAL
14.1 ANÁLISIS DE ACCIONES DE EMPRESAS: ORIENTE MEDIO Y ÁFRICA
15 ANÁLISIS FODA
16 PERFILES DE EMPRESAS
16.1 ADM
16.1.1 INSTANTÁNEA DE LA EMPRESA
16.1.2 INFORMACIÓN FINANCIERA RECIENTE
16.1.3 ANÁLISIS DE LAS ACCIONES DE LA EMPRESA
16.1.4 PORTAFOLIO DE PRODUCTOS
16.1.5 DESARROLLO RECIENTE
16.2 NUTRECO
16.2.1 INSTANTÁNEA DE LA EMPRESA
16.2.2 ANÁLISIS DE LAS ACCIONES DE LA EMPRESA
16.2.3 PORTAFOLIO DE PRODUCTOS
16.2.4 DESARROLLO RECIENTE
16.3 ADISSEO
16.3.1 INSTANTÁNEA DE LA EMPRESA
16.3.2 ANÁLISIS DE INGRESOS
16.3.3 ANÁLISIS DE LAS ACCIONES DE LA EMPRESA
16.3.4 PORTAFOLIO DE PRODUCTOS
16.3.5 DESARROLLOS RECIENTES
16.4 NOVUS INTERNATIONAL, INC.
16.4.1 INSTANTÁNEA DE LA EMPRESA
16.4.2 ANÁLISIS DE LAS ACCIONES DE LA EMPRESA
16.4.3 PORTAFOLIO DE PRODUCTOS
16.4.4 DESARROLLOS RECIENTES
16.5 ALLTECH
16.5.1 INSTANTÁNEA DE LA EMPRESA
16.5.2 ANÁLISIS DE LAS ACCIONES DE LA EMPRESA
16.5.3 PORTAFOLIO DE PRODUCTOS
16.5.4 DESARROLLO RECIENTE
16.6 BASF
16.6.1 INSTANTÁNEA DE LA EMPRESA
16.6.2 ANÁLISIS DE INGRESOS
16.6.3 PORTAFOLIO DE PRODUCTOS
16.6.4 DESARROLLOS/NOTICIAS RECIENTES
16.7 BIOCHEM ZUSATZSTOFFE HANDELS- UND PRODUKTIONSGESELLSCHAFT MBH
16.7.1 INSTANTÁNEA DE LA EMPRESA
16.7.2 PORTAFOLIO DE PRODUCTOS
16.7.3 DESARROLLOS RECIENTES
16.8 CARGILL, INCORPORADA
16.8.1 INSTANTÁNEA DE LA EMPRESA
16.8.2 PORTAFOLIO DE PRODUCTOS
16.8.3 DESARROLLO RECIENTE
16.9 DSM-FIRMENICH
16.9.1 INSTANTÁNEA DE LA EMPRESA
16.9.2 ANÁLISIS DE INGRESOS
16.9.3 PORTAFOLIO DE PRODUCTOS
16.9.4 DESARROLLOS RECIENTES
16.1 CORPORACIÓN DE SALUD ANIMAL PHIBRO
16.10.1 INSTANTÁNEA DE LA EMPRESA
16.10.2 ANÁLISIS DE INGRESOS
16.10.3 PORTAFOLIO DE PRODUCTOS
16.10.4 DESARROLLOS/NOTICIAS RECIENTES
16.11 ZINPRO
16.11.1 INSTANTÁNEA DE LA EMPRESA
16.11.2 PORTAFOLIO DE PRODUCTOS
16.11.3 DESARROLLO RECIENTE
17 CUESTIONARIO
18 INFORMES RELACIONADOS
Lista de Tablas
TABLA 1 CRONOGRAMAS E HITOS
CUADRO 2 EVALUACIÓN Y MITIGACIÓN DE RIESGOS
TABLA 3 PERSPECTIVA DE LA MARCA: MERCADO DE MINERALES ORGÁNICOS PARA ALIMENTOS ANIMALES
CUADRO 4 COBERTURA REGULATORIA
TABLA 5 MERCADO DE MINERALES ORGÁNICOS PARA ALIMENTOS ANIMALES EN ORIENTE MEDIO Y ÁFRICA, POR PRODUCTO, 2018-2032 (MILES DE USD)
CUADRO 6 MERCADO DE MINERALES ORGÁNICOS PARA ALIMENTOS ANIMALES EN ORIENTE MEDIO Y ÁFRICA, POR PRODUCTO, 2018-2032 (MILES DE TONELADAS DE USD)
TABLA 7 MERCADO DE MINERALES TRAZA ORGÁNICOS DE CALCIO PARA ALIMENTOS ANIMALES EN ORIENTE MEDIO Y ÁFRICA, POR REGIÓN, 2018-2032 (MILES DE USD)
CUADRO 8 MERCADO DE MINERALES OLIGOSÓRICOS ORGÁNICOS PARA ALIMENTOS ANIMALES CON FÓSFORO EN ORIENTE MEDIO Y ÁFRICA, POR REGIÓN, 2018-2032 (MILES DE USD)
TABLA 9 MERCADO DE MINERALES TRAZA ORGÁNICOS DE MAGNESIO PARA ALIMENTOS ANIMALES EN ORIENTE MEDIO Y ÁFRICA, POR REGIÓN, 2018-2032 (MILES DE USD)
TABLA 10 MERCADO DE MINERALES TRAZA ORGÁNICOS PARA ALIMENTOS ANIMALES CON SODIO EN ORIENTE MEDIO Y ÁFRICA, POR REGIÓN, 2018-2032 (MILES DE USD)
TABLA 11 MERCADO DE MINERALES TRAZA ORGÁNICOS DE CLORURO PARA ALIMENTOS ANIMALES EN ORIENTE MEDIO Y ÁFRICA, POR REGIÓN, 2018-2032 (MILES DE USD)
TABLA 12 MERCADO DE MINERALES TRAZA ORGÁNICOS PARA ALIMENTOS ANIMALES CON AZUFRE EN ORIENTE MEDIO Y ÁFRICA, POR REGIÓN, 2018-2032 (MILES DE USD)
CUADRO 13 MERCADO DE MINERALES TRAZA ORGÁNICOS DE POTASIO PARA ALIMENTOS ANIMALES EN ORIENTE MEDIO Y ÁFRICA, POR REGIÓN, 2018-2032 (MILES DE USD)
TABLA 14 MERCADO DE MINERALES TRAZATIVOS ORGÁNICOS DE ZINC PARA ALIMENTOS ANIMALES EN ORIENTE MEDIO Y ÁFRICA, POR REGIÓN, 2018-2032 (MILES DE USD)
TABLA 15 MERCADO DE MINERALES ORGÁNICOS DE HIERRO PARA ALIMENTOS ANIMALES EN ORIENTE MEDIO Y ÁFRICA, POR REGIÓN, 2018-2032 (MILES DE USD)
TABLA 16 MERCADO DE MINERALES TRAZATIVOS ORGÁNICOS DE COBRE PARA ALIMENTOS ANIMALES EN ORIENTE MEDIO Y ÁFRICA, POR REGIÓN, 2018-2032 (MILES DE USD)
CUADRO 17 MERCADO DE MINERALES OLIGOSORIALES ORGÁNICOS PARA ALIMENTOS ANIMALES CON YODO EN ORIENTE MEDIO Y ÁFRICA, POR REGIÓN, 2018-2032 (MILES DE USD)
TABLA 18 MERCADO DE MINERALES TRAZA ORGÁNICOS DE COBALTO PARA ALIMENTOS ANIMALES EN ORIENTE MEDIO Y ÁFRICA, POR REGIÓN, 2018-2032 (MILES DE USD)
TABLA 19 MERCADO DE MINERALES TRAZA ORGÁNICOS DE MANGANESO PARA ALIMENTOS ANIMALES EN ORIENTE MEDIO Y ÁFRICA, POR REGIÓN, 2018-2032 (MILES DE USD)
TABLA 20 MERCADO DE MINERALES OLIGOS ORGÁNICOS PARA ALIMENTOS ANIMALES CON SELENIO EN ORIENTE MEDIO Y ÁFRICA, POR REGIÓN, 2018-2032 (MILES DE USD)
CUADRO 21 MERCADO DE MINERALES TRAZA ORGÁNICOS DE CROMO PARA ALIMENTOS ANIMALES EN ORIENTE MEDIO Y ÁFRICA, POR REGIÓN, 2018-2032 (MILES DE USD)
TABLA 22 MERCADO DE MINERALES TRAZA ORGÁNICOS DE MOLIBDENO PARA ALIMENTOS ANIMALES EN ORIENTE MEDIO Y ÁFRICA, POR REGIÓN, 2018-2032 (MILES DE USD)
CUADRO 23 ORIENTE MEDIO Y ÁFRICA OTROS MERCADOS DE MINERALES OLIGOSO ORGÁNICOS PARA ALIMENTOS ANIMALES, POR REGIÓN, 2018-2032 (MILES DE USD)
TABLA 24 MERCADO DE MINERALES OLIGOS ORGÁNICOS PARA ALIMENTOS ANIMALES EN ORIENTE MEDIO Y ÁFRICA, POR FORMA, 2018-2032 (MILES DE USD)
CUADRO 25 MERCADO DE MINERALES ORGÁNICOS PARA ALIMENTOS ANIMALES EN ORIENTE MEDIO Y ÁFRICA, POR FORMA, 2018-2032 (MILES DE TONELADAS)
TABLA 26 MERCADO DE MINERALES ORGÁNICOS SECADOS EN ALIMENTOS ANIMALES EN ORIENTE MEDIO Y ÁFRICA, POR REGIÓN, 2018-2032 (MILES DE USD)
TABLA 27 MERCADO DE MINERALES ORGÁNICOS SECADOS EN ALIMENTOS ANIMALES EN ORIENTE MEDIO Y ÁFRICA, POR TIPO, 2018-2032 (MILES DE USD)
TABLA 28 MERCADO DE MINERALES OLIGOSO ORGÁNICOS EN POLVO PARA ALIMENTOS ANIMALES EN ORIENTE MEDIO Y ÁFRICA, POR TIPO, 2018-2032 (MILES DE USD)
TABLA 29 MERCADO DE MINERALES ORGÁNICOS LÍQUIDOS EN ALIMENTOS ANIMALES EN ORIENTE MEDIO Y ÁFRICA, POR REGIÓN, 2018-2032 (MILES DE USD)
TABLA 30 MERCADO DE MINERALES OLIGOSO ORGÁNICOS PARA ALIMENTOS ANIMALES EN ORIENTE MEDIO Y ÁFRICA, POR TIPO DE QUELATO, 2018-2032 (MILES DE USD)
CUADRO 31 MERCADO DE MINERALES ORGÁNICOS PARA ALIMENTOS ANIMALES EN ORIENTE MEDIO Y ÁFRICA, POR TIPO DE QUELATO, 2018-2032 (MILES DE TONELADAS)
TABLA 32 MERCADO DE MINERALES TRAZA ORGÁNICOS DE PROTEINATOS EN ALIMENTOS ANIMALES EN ORIENTE MEDIO Y ÁFRICA, POR REGIÓN, 2018-2032 (MILES DE USD)
TABLA 33 ORIENTE MEDIO Y ÁFRICA MERCADO DE MINERALES TRAZA ORGÁNICOS EN ALIMENTOS ANIMALES, POR REGIÓN, 2018-2032 (MILES DE USD)
TABLA 34 ORIENTE MEDIO Y ÁFRICA COMPLEJO DE POLISACÁRIDOS (QUELATO DE ZN) EN EL MERCADO DE MINERALES TRAZA ORGÁNICOS PARA ALIMENTOS ANIMALES, POR REGIÓN, 2018-2032 (MILES DE USD)
TABLA 35 ORIENTE MEDIO Y ÁFRICA MERCADO DE MINERALES TRAZA ORGÁNICOS DE QUELATO DE COBRE EN ALIMENTOS ANIMALES, POR REGIÓN, 2018-2032 (MILES DE USD)
TABLA 36 ORIENTE MEDIO Y ÁFRICA MERCADO DE MINERALES OLIGOSO ORGÁNICOS QUELADOS EN ALIMENTOS ANIMALES, POR REGIÓN, 2018-2032 (MILES DE USD)
TABLA 37 ORIENTE MEDIO Y ÁFRICA OTROS MERCADOS DE MINERALES ORGÁNICOS PARA ALIMENTOS ANIMALES, POR REGIÓN, 2018-2032 (MILES DE USD)
TABLA 38 MERCADO DE MINERALES OLIGOSO ORGÁNICOS PARA ALIMENTOS ANIMALES EN ORIENTE MEDIO Y ÁFRICA, POR CICLO DE VIDA, 2018-2032 (MILES DE USD)
CUADRO 39 MERCADO DE MINERALES OLIGOSO ORGÁNICOS PARA ALIMENTOS ANIMALES EN ORIENTE MEDIO Y ÁFRICA, POR CICLO DE VIDA, 2018-2032 (MILES DE TONELADAS)
TABLA 40. MERCADO DE MINERALES TRAZATIVOS ORGÁNICOS PARA LA PRODUCCIÓN DE ALIMENTOS PARA ANIMALES EN ORIENTE MEDIO Y ÁFRICA, POR REGIÓN, 2018-2032 (MILES DE USD)
TABLA 41 ORIENTE MEDIO Y ÁFRICA ALIMENTOS DE FINALIZACIÓN EN EL MERCADO DE MINERALES ORGÁNICOS PARA ALIMENTOS ANIMALES, POR REGIÓN, 2018-2032 (MILES DE USD)
TABLA 42 ORIENTE MEDIO Y ÁFRICA MERCADO DE ALIMENTOS DE INICIO DE MINERALES ORGÁNICOS PARA ALIMENTOS ANIMALES, POR REGIÓN, 2018-2032 (MILES DE USD)
CUADRO 43 ALIMENTO PARA GANADERAS DE CRÍA EN EL MERCADO DE MINERALES TRAZATIVOS ORGÁNICOS DE ALIMENTO PARA ANIMALES DE ORIENTE MEDIO Y ÁFRICA, POR REGIÓN, 2018-2032 (MILES DE USD)
TABLA 44 MERCADO DE MINERALES OLIGOSO ORGÁNICOS PARA ALIMENTOS ANIMALES EN ORIENTE MEDIO Y ÁFRICA, POR APLICACIÓN, 2018-2032 (MILES DE USD)
CUADRO 45 MERCADO DE MINERALES OLIGOSO ORGÁNICOS PARA ALIMENTOS ANIMALES EN ORIENTE MEDIO Y ÁFRICA, POR APLICACIÓN, 2018-2032 (MILES DE TONELADAS)
CUADRO 46 PROMOCIÓN DEL CRECIMIENTO EN EL MERCADO DE MINERALES ORGÁNICOS PARA ALIMENTOS ANIMALES EN ORIENTE MEDIO Y ÁFRICA, POR REGIÓN, 2018-2032 (MILES DE USD)
TABLA 47 PREVENCIÓN DE ENFERMEDADES EN EL MERCADO DE MINERALES ORGÁNICOS PARA ALIMENTOS ANIMALES EN ORIENTE MEDIO Y ÁFRICA, POR REGIÓN, 2018-2032 (MILES DE USD)
CUADRO 48 MEJORA DE LA FERTILIDAD EN EL MERCADO DE MINERALES ORGÁNICOS PARA ALIMENTOS ANIMALES EN ORIENTE MEDIO Y ÁFRICA, POR REGIÓN, 2018-2032 (MILES DE USD)
TABLA 49 OPTIMIZACIÓN DEL RENDIMIENTO EN EL MERCADO DE MINERALES ORGÁNICOS PARA ALIMENTOS ANIMALES EN ORIENTE MEDIO Y ÁFRICA, POR REGIÓN, 2018-2032 (MILES DE USD)
TABLA 50 ORIENTE MEDIO Y ÁFRICA OTROS MERCADOS DE MINERALES ORGÁNICOS PARA ALIMENTOS ANIMALES, POR REGIÓN, 2018-2032 (MILES DE USD)
TABLA 51 MERCADO DE MINERALES OLIGOSO ORGÁNICOS PARA ALIMENTOS ANIMALES EN ORIENTE MEDIO Y ÁFRICA, POR GANADO, 2018-2032 (MILES DE USD)
CUADRO 52 MERCADO DE MINERALES ORGÁNICOS PARA ALIMENTOS ANIMALES EN ORIENTE MEDIO Y ÁFRICA, POR GANADO, 2018-2032 (MILES DE TONELADAS)
CUADRO 53 MERCADO DE MINERALES TRAZA ORGÁNICOS PARA RUMIANTES EN ALIMENTOS ANIMALES EN ORIENTE MEDIO Y ÁFRICA, POR REGIÓN, 2018-2032 (MILES DE USD)
TABLA 54 MERCADO DE MINERALES ORGÁNICOS PARA RUMIANTES EN ALIMENTOS ANIMALES EN ORIENTE MEDIO Y ÁFRICA, POR TIPO, 2018-2032 (MILES DE USD)
TABLA 55 MERCADO DE MINERALES ORGÁNICOS PARA RUMIANTES EN ALIMENTOS ANIMALES EN ORIENTE MEDIO Y ÁFRICA, POR PRODUCTO, 2018-2032 (MILES DE USD)
CUADRO 56 MERCADO DE MINERALES ORGÁNICOS PARA AVES DE CORRAL EN ALIMENTOS ANIMALES EN ORIENTE MEDIO Y ÁFRICA, POR REGIÓN, 2018-2032 (MILES DE USD)
TABLA 57 MERCADO DE MINERALES ORGÁNICOS PARA AVES DE CORRAL EN ALIMENTOS ANIMALES DE ORIENTE MEDIO Y ÁFRICA, POR TIPO, 2018-2032 (MILES DE USD)
TABLA 58 MERCADO DE MINERALES ORGÁNICOS PARA AVES DE CORRAL EN ALIMENTOS ANIMALES EN ORIENTE MEDIO Y ÁFRICA, POR PRODUCTO, 2018-2032 (MILES DE USD)
CUADRO 59 MERCADO DE MINERALES OLIGOSO ORGÁNICOS PARA CERDOS EN ALIMENTOS ANIMALES EN ORIENTE MEDIO Y ÁFRICA, POR REGIÓN, 2018-2032 (MILES DE USD)
TABLA 60 MERCADO DE MINERALES ORGÁNICOS PARA CERDOS EN ALIMENTOS ANIMALES EN ORIENTE MEDIO Y ÁFRICA, POR TIPO, 2018-2032 (MILES DE USD)
TABLA 61 MERCADO DE MINERALES OLIGOSO ORGÁNICOS PARA CERDOS EN ALIMENTOS ANIMALES EN ORIENTE MEDIO Y ÁFRICA, POR PRODUCTO, 2018-2032 (MILES DE USD)
CUADRO 62 MERCADO DE MINERALES OLIGOSO ORGÁNICOS PARA LA ACUICULTURA EN ALIMENTOS ANIMALES EN ORIENTE MEDIO Y ÁFRICA, POR REGIÓN, 2018-2032 (MILES DE USD)
CUADRO 63 MERCADO DE MINERALES OLIGOSO ORGÁNICOS PARA LA ACUICULTURA EN ALIMENTOS ANIMALES EN ORIENTE MEDIO Y ÁFRICA, POR TIPO, 2018-2032 (MILES DE USD)
TABLA 64 ORIENTE MEDIO Y ÁFRICA CRUSTÁCEOS EN EL MERCADO DE MINERALES OLIGOSO ORGÁNICOS PARA ALIMENTOS ANIMALES, POR TIPO, 2018-2032 (MILES DE USD)
TABLA 65 ORIENTE MEDIO Y ÁFRICA MERCADO DE MINERALES ORGÁNICOS PARA EL USO DE PESCADO EN ALIMENTOS ANIMALES, POR TIPO, 2018-2032 (MILES DE USD)
TABLA 66 ORIENTE MEDIO Y ÁFRICA MOLUSCOS EN EL MERCADO DE MINERALES TRAZA ORGÁNICOS PARA ALIMENTOS ANIMALES, POR TIPO, 2018-2032 (MILES DE USD)
CUADRO 67 ORIENTE MEDIO Y ÁFRICA MERCADO DE MINERALES OLIGOSO ORGÁNICOS PARA LA ACUICULTURA EN ALIMENTOS ANIMALES, POR PRODUCTO, 2018-2032 (MILES DE USD)
TABLA 68 ORIENTE MEDIO Y ÁFRICA MERCADO DE MINERALES ORGÁNICOS PARA MASCOTAS EN ALIMENTOS ANIMALES, POR REGIÓN, 2018-2032 (MILES DE USD)
TABLA 69 ORIENTE MEDIO Y ÁFRICA MERCADO DE MINERALES ORGÁNICOS PARA MASCOTAS EN ALIMENTOS ANIMALES, POR TIPO, 2018-2032 (MILES DE USD)
TABLA 70 ORIENTE MEDIO Y ÁFRICA MERCADO DE MINERALES ORGÁNICOS PARA MASCOTAS EN ALIMENTOS ANIMALES, POR PRODUCTO, 2018-2032 (MILES DE USD)
TABLA 71 MERCADO DE MINERALES OLIGOSO ORGÁNICOS PARA EQUINOS EN ALIMENTOS ANIMALES DE ORIENTE MEDIO Y ÁFRICA, POR REGIÓN, 2018-2032 (MILES DE USD)
TABLA 72 MERCADO DE MINERALES TRAZA ORGÁNICOS PARA EQUINOS EN ALIMENTOS ANIMALES DE ORIENTE MEDIO Y ÁFRICA, POR PRODUCTO, 2018-2032 (MILES DE USD)
TABLA 73 ORIENTE MEDIO Y ÁFRICA OTROS MERCADOS DE MINERALES ORGÁNICOS PARA ALIMENTOS ANIMALES, POR REGIÓN, 2018-2032 (MILES DE USD)
TABLA 74 ORIENTE MEDIO Y ÁFRICA OTROS MERCADOS DE MINERALES ORGÁNICOS PARA ALIMENTOS ANIMALES, POR PRODUCTO, 2018-2032 (MILES DE USD)
TABLA 75 MERCADO DE MINERALES OLIGOSO ORGÁNICOS PARA ALIMENTOS ANIMALES EN ORIENTE MEDIO Y ÁFRICA, POR PAÍS, 2018-2032 (MILES DE USD)
CUADRO 76 MERCADO DE MINERALES OLIGOSO ORGÁNICOS PARA ALIMENTOS ANIMALES EN ORIENTE MEDIO Y ÁFRICA, POR PAÍS, 2018-2032 (MILES DE TONELADAS)
TABLA 77 MERCADO DE MINERALES OLIGOSO ORGÁNICOS PARA ALIMENTOS ANIMALES EN ORIENTE MEDIO Y ÁFRICA, POR PRODUCTO, 2018-2032 (MILES DE USD)
CUADRO 78 MERCADO DE MINERALES ORGÁNICOS PARA ALIMENTOS ANIMALES EN ORIENTE MEDIO Y ÁFRICA, POR PRODUCTO, 2018-2032 (MILES DE TONELADAS)
TABLA 79 MERCADO DE MINERALES ORGÁNICOS PARA ALIMENTOS ANIMALES EN ORIENTE MEDIO Y ÁFRICA, POR FORMA, 2018-2032 (MILES DE USD)
CUADRO 80 MERCADO DE MINERALES ORGÁNICOS PARA ALIMENTOS ANIMALES EN ORIENTE MEDIO Y ÁFRICA, POR FORMA, 2018-2032 (MILES DE TONELADAS)
TABLA 81 ORIENTE MEDIO Y ÁFRICA MERCADO DE MINERALES ORGÁNICOS SECADOS EN ALIMENTOS ANIMALES, POR TIPO, 2018-2032 (MILES DE USD)
TABLA 82 ORIENTE MEDIO Y ÁFRICA MERCADO DE MINERALES ORGÁNICOS EN POLVO PARA ALIMENTOS ANIMALES, POR TIPO, 2018-2032 (MILES DE USD)
TABLA 83 MERCADO DE MINERALES OLIGOSO ORGÁNICOS PARA ALIMENTOS ANIMALES EN ORIENTE MEDIO Y ÁFRICA, POR TIPO DE QUELATO, 2018-2032 (MILES DE USD)
TABLA 84 MERCADO DE MINERALES ORGÁNICOS PARA ALIMENTOS ANIMALES EN ORIENTE MEDIO Y ÁFRICA, POR TIPO DE QUELATO, 2018-2032 (MILES DE TONELADAS)
TABLA 85 MERCADO DE MINERALES OLIGOSO ORGÁNICOS PARA ALIMENTOS ANIMALES EN ORIENTE MEDIO Y ÁFRICA, POR CICLO DE VIDA, 2018-2032 (MILES DE USD)
CUADRO 86 MERCADO DE MINERALES OLIGOSO ORGÁNICOS PARA ALIMENTOS ANIMALES EN ORIENTE MEDIO Y ÁFRICA, POR CICLO DE VIDA, 2018-2032 (MILES DE TONELADAS)
TABLA 87 MERCADO DE MINERALES OLIGOSO ORGÁNICOS PARA ALIMENTOS ANIMALES EN ORIENTE MEDIO Y ÁFRICA, POR APLICACIÓN, 2018-2032 (MILES DE USD)
CUADRO 88 MERCADO DE MINERALES OLIGOSO ORGÁNICOS PARA ALIMENTOS ANIMALES EN ORIENTE MEDIO Y ÁFRICA, POR APLICACIÓN, 2018-2032 (MILES DE TONELADAS)
TABLA 89 MERCADO DE MINERALES OLIGOSO ORGÁNICOS PARA ALIMENTOS ANIMALES EN ORIENTE MEDIO Y ÁFRICA, POR GANADO, 2018-2032 (MILES DE USD)
CUADRO 90 MERCADO DE MINERALES OLIGOSO ORGÁNICOS PARA ALIMENTOS ANIMALES EN ORIENTE MEDIO Y ÁFRICA, POR GANADO, 2018-2032 (MILES DE TONELADAS)
TABLA 91 MERCADO DE MINERALES TRAZA ORGÁNICOS PARA RUMIANTES EN ALIMENTOS ANIMALES EN ORIENTE MEDIO Y ÁFRICA, POR TIPO, 2018-2032 (MILES DE USD)
TABLA 92 MERCADO DE MINERALES TRAZA ORGÁNICOS PARA RUMIANTES EN ALIMENTOS ANIMALES EN ORIENTE MEDIO Y ÁFRICA, POR PRODUCTO, 2018-2032 (MILES DE USD)
TABLA 93 MERCADO DE MINERALES ORGÁNICOS PARA AVES DE CORRAL EN ALIMENTOS ANIMALES EN ORIENTE MEDIO Y ÁFRICA, POR TIPO, 2018-2032 (MILES DE USD)
TABLA 94 MERCADO DE MINERALES ORGÁNICOS PARA AVES DE CORRAL EN ALIMENTOS ANIMALES EN ORIENTE MEDIO Y ÁFRICA, POR PRODUCTO, 2018-2032 (MILES DE USD)
TABLA 95 MERCADO DE MINERALES ORGÁNICOS PARA CERDOS EN ALIMENTOS ANIMALES EN ORIENTE MEDIO Y ÁFRICA, POR TIPO, 2018-2032 (MILES DE USD)
TABLA 96 MERCADO DE MINERALES OLIGOSO ORGÁNICOS PARA CERDOS EN ALIMENTOS ANIMALES EN ORIENTE MEDIO Y ÁFRICA, POR PRODUCTO, 2018-2032 (MILES DE USD)
CUADRO 97 MERCADO DE MINERALES OLIGOSO ORGÁNICOS PARA LA ACUICULTURA EN ALIMENTOS ANIMALES EN ORIENTE MEDIO Y ÁFRICA, POR TIPO, 2018-2032 (MILES DE USD)
TABLA 98 ORIENTE MEDIO Y ÁFRICA MERCADO DE MINERALES OLIGOSO ORGÁNICOS PARA CRUSTÁCEOS EN ALIMENTOS ANIMALES, POR TIPO, 2018-2032 (MILES DE USD)
TABLA 99 ORIENTE MEDIO Y ÁFRICA MERCADO DE MINERALES ORGÁNICOS PARA EL USO DE PESCADO EN ALIMENTOS ANIMALES, POR TIPO, 2018-2032 (MILES DE USD)
TABLA 100 MOLUSCOS EN EL MERCADO DE MINERALES TRAZA ORGÁNICOS DE ALIMENTOS ANIMALES DE ORIENTE MEDIO Y ÁFRICA, POR TIPO, 2018-2032 (MILES DE USD)
TABLA 101 ORIENTE MEDIO Y ÁFRICA MERCADO DE MINERALES OLIGOSO ORGÁNICOS PARA LA ACUICULTURA EN ALIMENTOS ANIMALES, POR PRODUCTO, 2018-2032 (MILES DE USD)
TABLA 102 ORIENTE MEDIO Y ÁFRICA MERCADO DE MINERALES ORGÁNICOS PARA MASCOTAS EN ALIMENTOS ANIMALES, POR TIPO, 2018-2032 (MILES DE USD)
TABLA 103 ORIENTE MEDIO Y ÁFRICA MERCADO DE MINERALES ORGÁNICOS PARA MASCOTAS EN ALIMENTOS ANIMALES, POR PRODUCTO, 2018-2032 (MILES DE USD)
TABLA 104 MERCADO DE MINERALES ORGÁNICOS PARA EQUINOS EN ALIMENTOS ANIMALES DE ORIENTE MEDIO Y ÁFRICA, POR PRODUCTO, 2018-2032 (MILES DE USD)
TABLA 105 ORIENTE MEDIO Y ÁFRICA OTROS MERCADOS DE MINERALES ORGÁNICOS EN ALIMENTOS ANIMALES, POR PRODUCTO, 2018-2032 (MILES DE USD)
TABLA 106 MERCADO DE MINERALES ORGÁNICOS PARA ALIMENTOS ANIMALES EN SUDÁFRICA, POR PRODUCTO, 2018-2032 (MILES DE USD)
CUADRO 107 MERCADO DE MINERALES ORGÁNICOS PARA ALIMENTOS ANIMALES EN SUDÁFRICA, POR PRODUCTO, 2018-2032 (MILES DE TONELADAS)
TABLA 108 MERCADO DE MINERALES ORGÁNICOS PARA ALIMENTOS ANIMALES DE SUDÁFRICA, POR FORMA, 2018-2032 (MILES DE USD)
CUADRO 109 MERCADO DE MINERALES ORGÁNICOS PARA ALIMENTOS ANIMALES DE SUDÁFRICA, POR FORMA, 2018-2032 (MILES DE TONELADAS)
TABLA 110 MERCADO DE MINERALES ORGÁNICOS SECADOS EN ALIMENTOS ANIMALES DE SUDÁFRICA, POR TIPO, 2018-2032 (MILES DE USD)
TABLA 111 MERCADO DE MINERALES ORGÁNICOS EN POLVO PARA ALIMENTOS ANIMALES EN SUDÁFRICA, POR TIPO, 2018-2032 (MILES DE USD)
TABLA 112 MERCADO DE MINERALES ORGÁNICOS PARA ALIMENTOS ANIMALES EN SUDÁFRICA, POR TIPO DE QUELATO, 2018-2032 (MILES DE USD)
CUADRO 113 MERCADO DE MINERALES ORGÁNICOS PARA ALIMENTOS ANIMALES EN SUDÁFRICA, POR TIPO DE QUELATO, 2018-2032 (MILES DE TONELADAS)
TABLA 114 MERCADO DE MINERALES ORGÁNICOS PARA ALIMENTOS ANIMALES EN SUDÁFRICA, POR CICLO DE VIDA, 2018-2032 (MILES DE USD)
CUADRO 115 MERCADO DE MINERALES ORGÁNICOS PARA ALIMENTOS ANIMALES EN SUDÁFRICA, POR CICLO DE VIDA, 2018-2032 (MILES DE TONELADAS)
TABLA 116 MERCADO DE MINERALES ORGÁNICOS PARA ALIMENTOS ANIMALES DE SUDÁFRICA, POR APLICACIÓN, 2018-2032 (MILES DE USD)
CUADRO 117 MERCADO DE MINERALES ORGÁNICOS PARA ALIMENTOS ANIMALES DE SUDÁFRICA, POR APLICACIÓN, 2018-2032 (MILES DE TONELADAS)
TABLA 118 MERCADO DE MINERALES ORGÁNICOS PARA ALIMENTOS ANIMALES EN SUDÁFRICA, POR GANADO, 2018-2032 (MILES DE USD)
CUADRO 119 MERCADO DE MINERALES ORGÁNICOS PARA ALIMENTOS ANIMALES EN SUDÁFRICA, POR GANADO, 2018-2032 (MILES DE TONELADAS)
TABLA 120 MERCADO DE MINERALES ORGÁNICOS PARA RUMIANTES EN ALIMENTOS ANIMALES DE SUDÁFRICA, POR TIPO, 2018-2032 (MILES DE USD)
TABLA 121 MERCADO DE MINERALES ORGÁNICOS PARA RUMIANTES EN ALIMENTOS ANIMALES DE SUDÁFRICA, POR PRODUCTO, 2018-2032 (MILES DE USD)
TABLA 122 MERCADO DE MINERALES ORGÁNICOS PARA AVES DE CORRAL EN ALIMENTOS ANIMALES DE SUDÁFRICA, POR TIPO, 2018-2032 (MILES DE USD)
TABLA 123 MERCADO DE MINERALES ORGÁNICOS PARA AVES DE CORRAL EN ALIMENTOS ANIMALES DE SUDÁFRICA, POR PRODUCTO, 2018-2032 (MILES DE USD)
TABLA 124 MERCADO DE MINERALES ORGÁNICOS PARA CERDOS EN ALIMENTOS ANIMALES DE SUDÁFRICA, POR TIPO, 2018-2032 (MILES DE USD)
TABLA 125 MERCADO DE MINERALES ORGÁNICOS PARA CERDOS EN ALIMENTOS ANIMALES DE SUDÁFRICA, POR PRODUCTO, 2018-2032 (MILES DE USD)
TABLA 126 MERCADO DE MINERALES ORGÁNICOS PARA ALIMENTOS ANIMALES EN LA ACUICULTURA DE SUDÁFRICA, POR TIPO, 2018-2032 (MILES DE USD)
TABLA 127 MERCADO DE CRUSTÁCEOS EN ALIMENTOS ANIMALES DE SUDÁFRICA, POR TIPO, 2018-2032 (MILES DE USD)
TABLA 128 MERCADO DE MINERALES ORGÁNICOS PARA EL USO DE PESCADO EN ALIMENTOS ANIMALES EN SUDÁFRICA, POR TIPO, 2018-2032 (MILES DE USD)
TABLA 129 MERCADO DE MOLUSCOS EN ALIMENTOS ANIMALES DE SUDÁFRICA, POR TIPO, 2018-2032 (MILES DE USD)
CUADRO 130 MERCADO DE MINERALES ORGÁNICOS PARA LA ACUICULTURA EN ALIMENTOS ANIMALES DE SUDÁFRICA, POR PRODUCTO, 2018-2032 (MILES DE USD)
TABLA 131 MERCADO DE MINERALES ORGÁNICOS PARA MASCOTAS EN ALIMENTOS ANIMALES DE SUDÁFRICA, POR TIPO, 2018-2032 (MILES DE USD)
TABLA 132 MERCADO DE MINERALES ORGÁNICOS PARA MASCOTAS EN ALIMENTOS ANIMALES DE SUDÁFRICA, POR PRODUCTO, 2018-2032 (MILES DE USD)
TABLA 133 MERCADO DE MINERALES ORGÁNICOS PARA ALIMENTOS ANIMAL EQUINOS EN SUDÁFRICA, POR PRODUCTO, 2018-2032 (MILES DE USD)
TABLA 134 SUDÁFRICA OTROS EN EL MERCADO DE MINERALES ORGÁNICOS PARA ALIMENTOS ANIMALES, POR PRODUCTO, 2018-2032 (MILES DE USD)
TABLA 135 MERCADO DE MINERALES ORGÁNICOS PARA ALIMENTOS ANIMALES EN ARABIA SAUDITA, POR PRODUCTO, 2018-2032 (MILES DE USD)
CUADRO 136 MERCADO DE MINERALES ORGÁNICOS PARA ALIMENTOS ANIMALES EN ARABIA SAUDITA, POR PRODUCTO, 2018-2032 (MILES DE TONELADAS)
TABLA 137 MERCADO DE MINERALES ORGÁNICOS PARA ALIMENTOS ANIMALES EN ARABIA SAUDITA, POR FORMA, 2018-2032 (MILES DE USD)
CUADRO 138 MERCADO DE MINERALES ORGÁNICOS PARA ALIMENTOS ANIMALES EN ARABIA SAUDITA, POR FORMA, 2018-2032 (MILES DE TONELADAS)
TABLA 139 MERCADO DE MINERALES ORGÁNICOS SECADOS EN ALIMENTOS ANIMALES DE ARABIA SAUDITA, POR TIPO, 2018-2032 (MILES DE USD)
TABLA 140 ARABIA SAUDITA MERCADO DE MINERALES ORGÁNICOS EN POLVO PARA ALIMENTOS ANIMALES, POR TIPO, 2018-2032 (MILES DE USD)
TABLA 141 MERCADO DE MINERALES ORGÁNICOS PARA ALIMENTOS ANIMALES EN ARABIA SAUDITA, POR TIPO DE QUELATO, 2018-2032 (MILES DE USD)
CUADRO 142 MERCADO DE MINERALES ORGÁNICOS PARA ALIMENTOS ANIMALES EN ARABIA SAUDITA, POR TIPO DE QUELATO, 2018-2032 (MILES DE TONELADAS)
TABLA 143 MERCADO DE MINERALES ORGÁNICOS PARA ALIMENTOS ANIMALES EN ARABIA SAUDITA, POR CICLO DE VIDA, 2018-2032 (MILES DE USD)
CUADRO 144 MERCADO DE MINERALES ORGÁNICOS PARA ALIMENTOS ANIMALES EN ARABIA SAUDITA, POR CICLO DE VIDA, 2018-2032 (MILES DE TONELADAS)
TABLA 145 MERCADO DE MINERALES ORGÁNICOS PARA ALIMENTOS ANIMALES EN ARABIA SAUDITA, POR APLICACIÓN, 2018-2032 (MILES DE USD)
CUADRO 146 MERCADO DE MINERALES ORGÁNICOS PARA ALIMENTOS ANIMALES EN ARABIA SAUDITA, POR APLICACIÓN, 2018-2032 (MILES DE TONELADAS)
TABLA 147 MERCADO DE MINERALES ORGÁNICOS PARA ALIMENTOS ANIMALES EN ARABIA SAUDITA, POR GANADO, 2018-2032 (MILES DE USD)
CUADRO 148 MERCADO DE MINERALES ORGÁNICOS PARA ALIMENTOS ANIMALES EN ARABIA SAUDITA, POR GANADO, 2018-2032 (MILES DE TONELADAS)
TABLA 149 MERCADO DE MINERALES ORGÁNICOS PARA RUMIANTES EN ALIMENTOS ANIMALES DE ARABIA SAUDITA, POR TIPO, 2018-2032 (MILES DE USD)
CUADRO 150 MERCADO DE MINERALES ORGÁNICOS PARA ALIMENTOS ANIMALES EN RUMIANTES DE ARABIA SAUDITA, POR PRODUCTO, 2018-2032 (MILES DE USD)
TABLA 151 MERCADO DE MINERALES ORGÁNICOS PARA AVES DE CORRAL EN ALIMENTOS ANIMALES DE ARABIA SAUDITA, POR TIPO, 2018-2032 (MILES DE USD)
TABLA 152 MERCADO DE MINERALES ORGÁNICOS PARA AVES DE CORRAL EN ALIMENTOS ANIMALES DE ARABIA SAUDITA, POR PRODUCTO, 2018-2032 (MILES DE USD)
TABLA 153 MERCADO DE MINERALES ORGÁNICOS PARA CERDOS EN ALIMENTOS ANIMALES DE ARABIA SAUDITA, POR TIPO, 2018-2032 (MILES DE USD)
TABLA 154 MERCADO DE MINERALES ORGÁNICOS PARA CERDOS EN ALIMENTOS ANIMALES DE ARABIA SAUDITA, POR PRODUCTO, 2018-2032 (MILES DE USD)
TABLA 155 ARABIA SAUDITA MERCADO DE MINERALES ORGÁNICOS PARA LA ACUICULTURA EN ALIMENTOS ANIMALES, POR TIPO, 2018-2032 (MILES DE USD)
TABLA 156 CRUSTÁCEOS EN EL MERCADO DE MINERALES ORGÁNICOS PARA ALIMENTOS ANIMALES DE ARABIA SAUDITA, POR TIPO, 2018-2032 (MILES DE USD)
TABLA 157 MERCADO DE MINERALES ORGÁNICOS PARA EL USO DE PESCADO EN ALIMENTOS ANIMALES DE ARABIA SAUDITA, POR TIPO, 2018-2032 (MILES DE USD)
TABLA 158 ARABIA SAUDITA MOLUSCOS EN EL MERCADO DE MINERALES ORGÁNICOS PARA ALIMENTOS ANIMALES, POR TIPO, 2018-2032 (MILES DE USD)
CUADRO 159 ARABIA SAUDITA MERCADO DE MINERALES ORGÁNICOS PARA LA ACUICULTURA EN ALIMENTOS ANIMALES, POR PRODUCTO, 2018-2032 (MILES DE USD)
TABLA 160 ARABIA SAUDITA MERCADO DE MINERALES ORGÁNICOS PARA MASCOTAS EN ALIMENTOS ANIMALES, POR TIPO, 2018-2032 (MILES DE USD)
TABLA 161 MERCADO DE MINERALES ORGÁNICOS PARA MASCOTAS EN ALIMENTOS ANIMALES DE ARABIA SAUDITA, POR PRODUCTO, 2018-2032 (MILES DE USD)
TABLA 162 MERCADO DE MINERALES ORGÁNICOS PARA ALIMENTOS PARA EQUINOS EN ARABIA SAUDITA, POR PRODUCTO, 2018-2032 (MILES DE USD)
TABLA 163 ARABIA SAUDITA OTROS MERCADO DE MINERALES ORGÁNICOS PARA ALIMENTOS ANIMALES, POR PRODUCTO, 2018-2032 (MILES DE USD)
TABLA 164 MERCADO DE MINERALES ORGÁNICOS PARA ALIMENTOS ANIMALES EN EGIPTO, POR PRODUCTO, 2018-2032 (MILES DE USD)
TABLA 165 MERCADO DE MINERALES ORGÁNICOS PARA ALIMENTOS ANIMALES EN EGIPTO, POR PRODUCTO, 2018-2032 (MILES DE TONELADAS)
TABLA 166 MERCADO DE MINERALES ORGÁNICOS PARA ALIMENTOS ANIMALES EN EGIPTO, POR FORMA, 2018-2032 (MILES DE USD)
TABLA 167 MERCADO DE MINERALES ORGÁNICOS PARA ALIMENTOS ANIMALES EN EGIPTO, POR FORMA, 2018-2032 (MILES DE TONELADAS)
TABLA 168 MERCADO DE MINERALES ORGÁNICOS SECADOS EN ALIMENTOS ANIMALES EN EGIPTO, POR TIPO, 2018-2032 (MILES DE USD)
TABLA 169 EGIPTO POLVO EN EL MERCADO DE MINERALES ORGÁNICOS PARA ALIMENTOS ANIMALES, POR TIPO, 2018-2032 (MILES DE USD)
TABLA 170 MERCADO DE MINERALES ORGÁNICOS PARA ALIMENTOS ANIMALES EN EGIPTO, POR TIPO DE QUELATO, 2018-2032 (MILES DE USD)
TABLA 171 MERCADO DE MINERALES ORGÁNICOS PARA ALIMENTOS ANIMALES EN EGIPTO, POR TIPO DE QUELATO, 2018-2032 (MILES DE TONELADAS)
TABLA 172 MERCADO DE MINERALES ORGÁNICOS PARA ALIMENTOS ANIMALES EN EGIPTO, POR CICLO DE VIDA, 2018-2032 (MILES DE USD)
TABLA 173 MERCADO DE MINERALES ORGÁNICOS PARA ALIMENTOS ANIMALES EN EGIPTO, POR CICLO DE VIDA, 2018-2032 (MILES DE TONELADAS)
TABLA 174 MERCADO DE MINERALES ORGÁNICOS PARA ALIMENTOS ANIMALES EN EGIPTO, POR APLICACIÓN, 2018-2032 (MILES DE USD)
TABLA 175 MERCADO DE MINERALES ORGÁNICOS PARA ALIMENTOS ANIMALES EN EGIPTO, POR APLICACIÓN, 2018-2032 (MILES DE TONELADAS)
TABLA 176 MERCADO DE MINERALES ORGÁNICOS PARA ALIMENTOS ANIMALES EN EGIPTO, POR GANADO, 2018-2032 (MILES DE USD)
TABLA 177 MERCADO DE MINERALES ORGÁNICOS PARA ALIMENTOS ANIMALES EN EGIPTO, POR GANADO, 2018-2032 (MILES DE TONELADAS)
TABLA 178 MERCADO DE MINERALES ORGÁNICOS PARA RUMIANTES EN ALIMENTOS ANIMALES DE EGIPTO, POR TIPO, 2018-2032 (MILES DE USD)
TABLA 179 MERCADO DE MINERALES ORGÁNICOS PARA RUMIANTES EN ALIMENTOS ANIMALES EN EGIPTO, POR PRODUCTO, 2018-2032 (MILES DE USD)
TABLA 180 MERCADO DE MINERALES ORGÁNICOS PARA AVES DE CORRAL EN ALIMENTOS ANIMALES DE EGIPTO, POR TIPO, 2018-2032 (MILES DE USD)
TABLA 181 MERCADO DE MINERALES ORGÁNICOS PARA AVES DE CORRAL EN ALIMENTOS ANIMALES DE EGIPTO, POR PRODUCTO, 2018-2032 (MILES DE USD)
TABLA 182 MERCADO DE MINERALES ORGÁNICOS PARA CERDOS EN ALIMENTOS ANIMALES DE EGIPTO, POR TIPO, 2018-2032 (MILES DE USD)
TABLA 183 MERCADO DE MINERALES ORGÁNICOS PARA CERDOS EN ALIMENTOS ANIMALES DE EGIPTO, POR PRODUCTO, 2018-2032 (MILES DE USD)
TABLA 184 MERCADO DE MINERALES ORGÁNICOS PARA ALIMENTOS ANIMALES EN LA ACUICULTURA DE EGIPTO, POR TIPO, 2018-2032 (MILES DE USD)
TABLA 185 MERCADO DE CRUSTÁCEOS EN ALIMENTOS ANIMALES CON MINERALES ORGÁNICOS, POR TIPO, 2018-2032 (MILES DE USD)
TABLA 186 MERCADO DE MINERALES ORGÁNICOS PARA EL PESCADO EN ALIMENTOS ANIMALES DE EGIPTO, POR TIPO, 2018-2032 (MILES DE USD)
TABLA 187 EGIPTO MOLUSCOS EN EL MERCADO DE MINERALES ORGÁNICOS PARA ALIMENTOS ANIMALES, POR TIPO, 2018-2032 (MILES DE USD)
TABLA 188 MERCADO DE MINERALES ORGÁNICOS PARA LA ACUICULTURA EN ALIMENTOS ANIMALES EN EGIPTO, POR PRODUCTO, 2018-2032 (MILES DE USD)
TABLA 189 MERCADO DE MINERALES ORGÁNICOS PARA MASCOTAS EN ALIMENTOS ANIMALES DE EGIPTO, POR TIPO, 2018-2032 (MILES DE USD)
TABLA 190 MERCADO DE MINERALES ORGÁNICOS PARA MASCOTAS EN ALIMENTOS ANIMALES DE EGIPTO, POR PRODUCTO, 2018-2032 (MILES DE USD)
TABLA 191 MERCADO DE MINERALES ORGÁNICOS PARA ALIMENTOS ANIMAL EQUINOS EN EGIPTO, POR PRODUCTO, 2018-2032 (MILES DE USD)
TABLA 192 EGIPTO OTROS EN EL MERCADO DE MINERALES ORGÁNICOS PARA ALIMENTOS ANIMALES, POR PRODUCTO, 2018-2032 (MILES DE USD)
TABLA 193 MERCADO DE MINERALES ORGÁNICOS PARA ALIMENTOS ANIMALES EN LOS EAU, POR PRODUCTO, 2018-2032 (MILES DE USD)
TABLA 194 MERCADO DE MINERALES ORGÁNICOS PARA ALIMENTOS ANIMALES EN LOS EAU, POR PRODUCTO, 2018-2032 (MILES DE TONELADAS)
TABLA 195 MERCADO DE MINERALES ORGÁNICOS PARA ALIMENTOS ANIMALES DE LOS EAU, POR FORMA, 2018-2032 (MILES DE USD)
TABLA 196 MERCADO DE MINERALES ORGÁNICOS PARA ALIMENTOS ANIMALES DE LOS EAU, POR FORMA, 2018-2032 (MILES DE TONELADAS)
TABLA 197 MERCADO DE MINERALES ORGÁNICOS SECADOS EN ALIMENTOS ANIMALES DE LOS EAU, POR TIPO, 2018-2032 (MILES DE USD)
TABLA 198 MERCADO DE MINERALES ORGÁNICOS EN POLVO PARA ALIMENTOS ANIMALES DE LOS EAU, POR TIPO, 2018-2032 (MILES DE USD)
TABLA 199 MERCADO DE MINERALES ORGÁNICOS PARA ALIMENTOS ANIMALES EN LOS EAU, POR TIPO DE QUELATO, 2018-2032 (MILES DE USD)
TABLA 200 MERCADO DE MINERALES ORGÁNICOS PARA ALIMENTOS ANIMALES EN LOS EAU, POR TIPO DE QUELATO, 2018-2032 (MILES DE TONELADAS)
TABLA 201 MERCADO DE MINERALES ORGÁNICOS PARA ALIMENTOS ANIMALES EN LOS EAU, POR CICLO DE VIDA, 2018-2032 (MILES DE USD)
TABLA 202 MERCADO DE MINERALES ORGÁNICOS PARA ALIMENTOS ANIMALES EN LOS EAU, POR CICLO DE VIDA, 2018-2032 (MILES DE TONELADAS)
TABLA 203 MERCADO DE MINERALES ORGÁNICOS PARA ALIMENTOS ANIMALES EN LOS EAU, POR APLICACIÓN, 2018-2032 (MILES DE USD)
TABLA 204 MERCADO DE MINERALES ORGÁNICOS PARA ALIMENTOS ANIMALES DE LOS EAU, POR APLICACIÓN, 2018-2032 (MILES DE TONELADAS)
TABLA 205 MERCADO DE MINERALES ORGÁNICOS PARA ALIMENTOS ANIMALES EN LOS EAU, POR GANADO, 2018-2032 (MILES DE USD)
TABLA 206 MERCADO DE MINERALES ORGÁNICOS PARA ALIMENTOS ANIMALES EN LOS EAU, POR GANADO, 2018-2032 (MILES DE TONELADAS)
TABLA 207 MERCADO DE MINERALES ORGÁNICOS PARA RUMIANTES EN ALIMENTOS ANIMALES DE LOS EAU, POR TIPO, 2018-2032 (MILES DE USD)
TABLA 208 MERCADO DE MINERALES ORGÁNICOS PARA RUMIANTES EN ALIMENTOS ANIMALES DE LOS EAU, POR PRODUCTO, 2018-2032 (MILES DE USD)
TABLA 209 MERCADO DE MINERALES ORGÁNICOS PARA AVES DE CORRAL EN ALIMENTOS ANIMALES DE LOS EAU, POR TIPO, 2018-2032 (MILES DE USD)
TABLA 210 MERCADO DE MINERALES ORGÁNICOS PARA AVES DE CORRAL EN ALIMENTOS ANIMALES DE LOS EAU, POR PRODUCTO, 2018-2032 (MILES DE USD)
TABLA 211 MERCADO DE MINERALES ORGÁNICOS PARA CERDOS EN ALIMENTOS ANIMALES DE LOS EAU, POR TIPO, 2018-2032 (MILES DE USD)
TABLA 212 MERCADO DE MINERALES ORGÁNICOS PARA CERDOS EN ALIMENTOS ANIMALES DE LOS EAU, POR PRODUCTO, 2018-2032 (MILES DE USD)
TABLA 213 MERCADO DE MINERALES ORGÁNICOS PARA ALIMENTOS ANIMALES EN LA ACUICULTURA DE LOS EAU, POR TIPO, 2018-2032 (MILES DE USD)
TABLA 214 MERCADO DE CRUSTÁCEOS EN ALIMENTOS ANIMALES CON MINERALES ORGÁNICOS, POR TIPO, 2018-2032 (MILES DE USD)
TABLA 215 MERCADO DE MINERALES ORGÁNICOS PARA EL PESCADO EN ALIMENTOS ANIMALES DE LOS EAU, POR TIPO, 2018-2032 (MILES DE USD)
TABLA 216 MERCADO DE MINERALES ORGÁNICOS PARA MOLUSCOS EN ALIMENTOS ANIMALES DE LOS EAU, POR TIPO, 2018-2032 (MILES DE USD)
TABLA 217 MERCADO DE MINERALES ORGÁNICOS PARA ALIMENTOS ANIMALES EN LA ACUICULTURA DE LOS EAU, POR PRODUCTO, 2018-2032 (MILES DE USD)
TABLA 218 MERCADO DE MINERALES ORGÁNICOS PARA MASCOTAS EN ALIMENTOS ANIMALES DE LOS EAU, POR TIPO, 2018-2032 (MILES DE USD)
TABLA 219 MERCADO DE MINERALES ORGÁNICOS PARA MASCOTAS EN ALIMENTOS ANIMALES DE LOS EAU, POR PRODUCTO, 2018-2032 (MILES DE USD)
TABLA 220 MERCADO DE MINERALES ORGÁNICOS PARA ALIMENTOS ANIMAL EQUINOS EN LOS EAU, POR PRODUCTO, 2018-2032 (MILES DE USD)
TABLA 221 EMIRATOS ÁRABES UNIDOS OTROS EN EL MERCADO DE MINERALES ORGÁNICOS PARA ALIMENTOS ANIMALES, POR PRODUCTO, 2018-2032 (MILES DE USD)
TABLA 222 MERCADO DE MINERALES ORGÁNICOS PARA ALIMENTOS ANIMALES EN ISRAEL, POR PRODUCTO, 2018-2032 (MILES DE USD)
TABLA 223 MERCADO DE MINERALES ORGÁNICOS PARA ALIMENTOS ANIMALES EN ISRAEL, POR PRODUCTO, 2018-2032 (MILES DE TONELADAS)
TABLA 224 MERCADO DE MINERALES ORGÁNICOS PARA ALIMENTOS ANIMALES DE ISRAEL, POR FORMA, 2018-2032 (MILES DE USD)
TABLA 225 MERCADO DE MINERALES ORGÁNICOS PARA ALIMENTOS ANIMALES EN ISRAEL, POR FORMA, 2018-2032 (MILES DE TONELADAS)
TABLA 226 MERCADO DE MINERALES ORGÁNICOS SECOS EN ALIMENTOS ANIMALES DE ISRAEL, POR TIPO, 2018-2032 (MILES DE USD)
TABLA 227 MERCADO DE MINERALES ORGÁNICOS EN POLVO PARA ALIMENTOS ANIMALES DE ISRAEL, POR TIPO, 2018-2032 (MILES DE USD)
TABLA 228 MERCADO DE MINERALES ORGÁNICOS PARA ALIMENTOS ANIMALES EN ISRAEL, POR TIPO DE QUELATO, 2018-2032 (MILES DE USD)
TABLA 229 MERCADO DE MINERALES ORGÁNICOS PARA ALIMENTOS ANIMALES EN ISRAEL, POR TIPO DE QUELATO, 2018-2032 (MILES DE TONELADAS)
TABLA 230 MERCADO DE MINERALES ORGÁNICOS PARA ALIMENTOS ANIMALES EN ISRAEL, POR CICLO DE VIDA, 2018-2032 (MILES DE USD)
TABLA 231 MERCADO DE MINERALES ORGÁNICOS PARA ALIMENTOS ANIMALES EN ISRAEL, POR CICLO DE VIDA, 2018-2032 (MILES DE TONELADAS)
TABLA 232 MERCADO DE MINERALES ORGÁNICOS PARA ALIMENTOS ANIMALES EN ISRAEL, POR APLICACIÓN, 2018-2032 (MILES DE USD)
TABLA 233 MERCADO DE MINERALES ORGÁNICOS PARA ALIMENTOS ANIMALES EN ISRAEL, POR APLICACIÓN, 2018-2032 (MILES DE TONELADAS)
TABLA 234 MERCADO DE MINERALES ORGÁNICOS PARA ALIMENTOS ANIMALES EN ISRAEL, POR GANADO, 2018-2032 (MILES DE USD)
TABLA 235 MERCADO DE MINERALES ORGÁNICOS PARA ALIMENTOS ANIMALES EN ISRAEL, POR GANADO, 2018-2032 (MILES DE TONELADAS)
TABLA 236 MERCADO DE MINERALES ORGÁNICOS PARA RUMIANTES EN ALIMENTOS ANIMALES DE ISRAEL, POR TIPO, 2018-2032 (MILES DE USD)
TABLA 237 MERCADO DE MINERALES ORGÁNICOS PARA RUMIANTES EN ALIMENTOS ANIMALES DE ISRAEL, POR PRODUCTO, 2018-2032 (MILES DE USD)
TABLA 238 MERCADO DE MINERALES ORGÁNICOS PARA AVES DE CORRAL EN ALIMENTOS ANIMALES DE ISRAEL, POR TIPO, 2018-2032 (MILES DE USD)
TABLA 239 MERCADO DE MINERALES ORGÁNICOS PARA AVES DE CORRAL EN ALIMENTOS ANIMALES DE ISRAEL, POR PRODUCTO, 2018-2032 (MILES DE USD)
TABLA 240 MERCADO DE MINERALES ORGÁNICOS PARA CERDOS EN ALIMENTOS ANIMALES DE ISRAEL, POR TIPO, 2018-2032 (MILES DE USD)
TABLA 241 MERCADO DE MINERALES ORGÁNICOS PARA CERDOS EN ALIMENTOS ANIMALES DE ISRAEL, POR PRODUCTO, 2018-2032 (MILES DE USD)
TABLA 242 MERCADO DE MINERALES ORGÁNICOS PARA ALIMENTOS ANIMALES EN LA ACUICULTURA DE ISRAEL, POR TIPO, 2018-2032 (MILES DE USD)
TABLA 243 MERCADO DE CRUSTÁCEOS DE ISRAEL EN ALIMENTOS ANIMALES CON MINERALES ORGÁNICOS, POR TIPO, 2018-2032 (MILES DE USD)
TABLA 244 MERCADO DE MINERALES ORGÁNICOS PARA EL USO DE PESCADO EN ALIMENTOS ANIMALES DE ISRAEL, POR TIPO, 2018-2032 (MILES DE USD)
TABLA 245 MOLUSCOS DE ISRAEL EN EL MERCADO DE MINERALES ORGÁNICOS PARA ALIMENTOS ANIMALES, POR TIPO, 2018-2032 (MILES DE USD)
TABLA 246 MERCADO DE MINERALES ORGÁNICOS PARA LA ACUICULTURA EN ALIMENTOS ANIMALES DE ISRAEL, POR PRODUCTO, 2018-2032 (MILES DE USD)
TABLA 247 MERCADO DE MINERALES ORGÁNICOS PARA MASCOTAS EN ALIMENTOS ANIMALES DE ISRAEL, POR TIPO, 2018-2032 (MILES DE USD)
TABLA 248 MERCADO DE MINERALES ORGÁNICOS PARA MASCOTAS EN ALIMENTOS ANIMALES DE ISRAEL, POR PRODUCTO, 2018-2032 (MILES DE USD)
TABLA 249 MERCADO DE MINERALES ORGÁNICOS PARA ALIMENTOS ANIMAL EQUINOS EN ISRAEL, POR PRODUCTO, 2018-2032 (MILES DE USD)
TABLA 250 OTROS MERCADOS DE MINERALES ORGÁNICOS PARA ALIMENTOS ANIMALES EN ISRAEL, POR PRODUCTO, 2018-2032 (MILES DE USD)
TABLA 251 MERCADO DE MINERALES ORGÁNICOS PARA ALIMENTOS ANIMALES DE KUWAIT, POR PRODUCTO, 2018-2032 (MILES DE USD)
TABLA 252 MERCADO DE MINERALES ORGÁNICOS PARA ALIMENTOS ANIMALES DE KUWAIT, POR PRODUCTO, 2018-2032 (MILES DE TONELADAS)
TABLA 253 MERCADO DE MINERALES ORGÁNICOS PARA ALIMENTOS ANIMALES DE KUWAIT, POR FORMA, 2018-2032 (MILES DE USD)
TABLA 254 MERCADO DE MINERALES ORGÁNICOS PARA ALIMENTOS ANIMALES DE KUWAIT, POR FORMA, 2018-2032 (MILES DE TONELADAS)
TABLA 255 MERCADO DE MINERALES ORGÁNICOS SECOS EN ALIMENTOS ANIMALES DE KUWAIT, POR TIPO, 2018-2032 (MILES DE USD)
TABLA 256 MERCADO DE MINERALES ORGÁNICOS EN POLVO DE KUWAIT EN ALIMENTOS ANIMALES, POR TIPO, 2018-2032 (MILES DE USD)
TABLA 257 MERCADO DE MINERALES ORGÁNICOS PARA ALIMENTOS ANIMALES DE KUWAIT, POR TIPO DE QUELATO, 2018-2032 (MILES DE USD)
TABLA 258 MERCADO DE MINERALES ORGÁNICOS PARA ALIMENTOS ANIMALES DE KUWAIT, POR TIPO DE QUELATO, 2018-2032 (MILES DE TONELADAS)
TABLA 259 MERCADO DE MINERALES ORGÁNICOS PARA ALIMENTOS ANIMALES DE KUWAIT, POR CICLO DE VIDA, 2018-2032 (MILES DE USD)
TABLA 260 MERCADO DE MINERALES ORGÁNICOS PARA ALIMENTOS ANIMALES DE KUWAIT, POR CICLO DE VIDA, 2018-2032 (MILES DE TONELADAS)
TABLA 261 MERCADO DE MINERALES ORGÁNICOS PARA ALIMENTOS ANIMALES DE KUWAIT, POR APLICACIÓN, 2018-2032 (MILES DE USD)
CUADRO 262 MERCADO DE MINERALES ORGÁNICOS PARA ALIMENTOS ANIMALES DE KUWAIT, POR APLICACIÓN, 2018-2032 (MILES DE TONELADAS)
TABLA 263 MERCADO DE MINERALES ORGÁNICOS PARA ALIMENTOS ANIMALES EN KUWAIT, POR GANADO, 2018-2032 (MILES DE USD)
TABLA 264 MERCADO DE MINERALES ORGÁNICOS PARA ALIMENTOS ANIMALES EN KUWAIT, POR GANADO, 2018-2032 (MILES DE TONELADAS)
TABLA 265 MERCADO DE MINERALES ORGÁNICOS PARA RUMIANTES EN ALIMENTOS ANIMALES DE KUWAIT, POR TIPO, 2018-2032 (MILES DE USD)
TABLA 266 MERCADO DE MINERALES ORGÁNICOS PARA RUMIANTES EN ALIMENTOS ANIMALES DE KUWAIT, POR PRODUCTO, 2018-2032 (MILES DE USD)
TABLA 267 MERCADO DE MINERALES ORGÁNICOS PARA AVES DE CORRAL EN ALIMENTOS ANIMALES DE KUWAIT, POR TIPO, 2018-2032 (MILES DE USD)
TABLA 268 MERCADO DE MINERALES ORGÁNICOS PARA AVES DE CORRAL EN ALIMENTOS ANIMALES DE KUWAIT, POR PRODUCTO, 2018-2032 (MILES DE USD)
TABLA 269 MERCADO DE MINERALES ORGÁNICOS PARA LA ALIMENTACIÓN ANIMAL PORCINA DE KUWAIT, POR TIPO, 2018-2032 (MILES DE USD)
TABLA 270 MERCADO DE MINERALES ORGÁNICOS PARA CERDOS DE KUWAIT EN ALIMENTOS ANIMALES, POR PRODUCTO, 2018-2032 (MILES DE USD)
TABLA 271 MERCADO DE MINERALES ORGÁNICOS PARA ALIMENTOS ANIMALES EN LA ACUICULTURA DE KUWAIT, POR TIPO, 2018-2032 (MILES DE USD)
TABLA 272 MERCADO DE CRUSTÁCEOS DE KUWAIT EN ALIMENTOS ANIMALES, POR TIPO, 2018-2032 (MILES DE USD)
TABLA 273 MERCADO DE MINERALES ORGÁNICOS PARA EL USO DE PESCADO EN ALIMENTOS ANIMALES DE KUWAIT, POR TIPO, 2018-2032 (MILES DE USD)
TABLA 274 MOLUSCOS DE KUWAIT EN EL MERCADO DE MINERALES ORGÁNICOS PARA ALIMENTOS ANIMALES, POR TIPO, 2018-2032 (MILES DE USD)
TABLA 275 MERCADO DE MINERALES ORGÁNICOS PARA LA ACUICULTURA EN ALIMENTOS ANIMALES DE KUWAIT, POR PRODUCTO, 2018-2032 (MILES DE USD)
TABLA 276 MERCADO DE MINERALES ORGÁNICOS PARA MASCOTAS EN ALIMENTOS ANIMALES DE KUWAIT, POR TIPO, 2018-2032 (MILES DE USD)
TABLA 277 MERCADO DE MINERALES ORGÁNICOS PARA MASCOTAS EN ALIMENTOS ANIMALES DE KUWAIT, POR PRODUCTO, 2018-2032 (MILES DE USD)
TABLA 278 MERCADO DE MINERALES ORGÁNICOS PARA ALIMENTOS ANIMAL EQUINOS DE KUWAIT, POR PRODUCTO, 2018-2032 (MILES DE USD)
TABLA 279 KUWAIT OTROS EN EL MERCADO DE MINERALES ORGÁNICOS PARA ALIMENTOS ANIMALES, POR PRODUCTO, 2018-2032 (MILES DE USD)
TABLA 280 MERCADO DE MINERALES ORGÁNICOS PARA ALIMENTOS ANIMALES DE OMÁN, POR PRODUCTO, 2018-2032 (MILES DE USD)
TABLA 281 MERCADO DE MINERALES ORGÁNICOS PARA ALIMENTOS ANIMALES EN OMÁN, POR PRODUCTO, 2018-2032 (MILES DE TONELADAS)
TABLA 282 MERCADO DE MINERALES ORGÁNICOS PARA ALIMENTOS ANIMALES DE OMÁN, POR FORMA, 2018-2032 (MILES DE USD)
TABLA 283 MERCADO DE MINERALES ORGÁNICOS PARA ALIMENTOS ANIMALES EN OMÁN, POR FORMA, 2018-2032 (MILES DE TONELADAS)
TABLA 284 MERCADO DE MINERALES ORGÁNICOS SECADOS EN ALIMENTOS ANIMALES DE OMÁN, POR TIPO, 2018-2032 (MILES DE USD)
TABLA 285 MERCADO DE MINERALES ORGÁNICOS EN POLVO PARA ALIMENTOS ANIMALES, POR TIPO, 2018-2032 (MILES DE USD)
TABLA 286 MERCADO DE MINERALES ORGÁNICOS PARA ALIMENTOS ANIMALES EN OMÁN, POR TIPO DE QUELATO, 2018-2032 (MILES DE USD)
TABLA 287 MERCADO DE MINERALES ORGÁNICOS PARA ALIMENTOS ANIMALES EN OMÁN, POR TIPO DE QUELATO, 2018-2032 (MILES DE TONELADAS)
TABLA 288 MERCADO DE MINERALES ORGÁNICOS PARA ALIMENTOS ANIMALES EN OMÁN, POR CICLO DE VIDA, 2018-2032 (MILES DE USD)
TABLA 289 MERCADO DE MINERALES ORGÁNICOS PARA ALIMENTOS ANIMALES EN OMÁN, POR CICLO DE VIDA, 2018-2032 (MILES DE TONELADAS)
TABLA 290 MERCADO DE MINERALES ORGÁNICOS PARA ALIMENTOS ANIMALES EN OMÁN, POR APLICACIÓN, 2018-2032 (MILES DE USD)
TABLA 291 MERCADO DE MINERALES ORGÁNICOS PARA ALIMENTOS ANIMALES DE OMÁN, POR APLICACIÓN, 2018-2032 (MILES DE TONELADAS)
TABLA 292 MERCADO DE MINERALES ORGÁNICOS PARA ALIMENTOS ANIMALES EN OMÁN, POR GANADO, 2018-2032 (MILES DE USD)
TABLA 293 MERCADO DE MINERALES ORGÁNICOS PARA ALIMENTOS ANIMALES EN OMÁN, POR GANADO, 2018-2032 (MILES DE TONELADAS)
TABLA 294 MERCADO DE MINERALES ORGÁNICOS PARA RUMIANTES EN ALIMENTOS ANIMALES, POR TIPO, 2018-2032 (MILES DE USD)
TABLA 295 MERCADO DE MINERALES ORGÁNICOS PARA RUMIANTES EN ALIMENTOS ANIMALES, POR PRODUCTO, 2018-2032 (MILES DE USD)
TABLA 296 MERCADO DE MINERALES ORGÁNICOS PARA AVES DE CORRAL EN ALIMENTOS ANIMALES DE OMÁN, POR TIPO, 2018-2032 (MILES DE USD)
TABLA 297 MERCADO DE MINERALES ORGÁNICOS PARA AVES DE CORRAL EN ALIMENTOS ANIMALES DE OMÁN, POR PRODUCTO, 2018-2032 (MILES DE USD)
TABLA 298 MERCADO DE MINERALES ORGÁNICOS PARA CERDOS EN ALIMENTOS ANIMALES DE OMÁN, POR TIPO, 2018-2032 (MILES DE USD)
TABLA 299 MERCADO DE MINERALES ORGÁNICOS PARA CERDOS EN ALIMENTOS ANIMALES DE OMÁN, POR PRODUCTO, 2018-2032 (MILES DE USD)
TABLA 300 MERCADO DE MINERALES ORGÁNICOS PARA ALIMENTOS ANIMALES EN LA ACUICULTURA DE OMÁN, POR TIPO, 2018-2032 (MILES DE USD)
TABLA 301 MERCADO DE CRUSTÁCEOS DE OMÁN EN ALIMENTOS ANIMALES, POR TIPO, 2018-2032 (MILES DE USD)
TABLA 302 MERCADO DE MINERALES ORGÁNICOS PARA EL USO DE PESCADO EN ALIMENTOS ANIMALES, POR TIPO, 2018-2032 (MILES DE USD)
TABLA 303 MERCADO DE MOLUSCOS DE OMÁN EN ALIMENTOS ANIMALES CON MINERALES ORGÁNICOS, POR TIPO, 2018-2032 (MILES DE USD)
TABLA 304 MERCADO DE MINERALES ORGÁNICOS PARA ALIMENTOS ANIMALES EN ACUICULTURA DE OMÁN, POR PRODUCTO, 2018-2032 (MILES DE USD)
TABLA 305 MERCADO DE MINERALES ORGÁNICOS PARA MASCOTAS EN ALIMENTOS ANIMALES DE OMÁN, POR TIPO, 2018-2032 (MILES DE USD)
TABLA 306 MERCADO DE MINERALES ORGÁNICOS PARA MASCOTAS EN ALIMENTOS ANIMALES DE OMÁN, POR PRODUCTO, 2018-2032 (MILES DE USD)
TABLA 307 MERCADO DE MINERALES ORGÁNICOS PARA ALIMENTOS ANIMAL EQUINOS DE OMÁN, POR PRODUCTO, 2018-2032 (MILES DE USD)
TABLA 308 OMÁN OTROS EN EL MERCADO DE MINERALES ORGÁNICOS PARA ALIMENTOS ANIMALES, POR PRODUCTO, 2018-2032 (MILES DE USD)
TABLA 309 MERCADO DE MINERALES ORGÁNICOS PARA ALIMENTOS ANIMALES EN QATAR, POR PRODUCTO, 2018-2032 (MILES DE USD)
TABLA 310 MERCADO DE MINERALES ORGÁNICOS PARA ALIMENTOS ANIMALES DE QATAR, POR PRODUCTO, 2018-2032 (MILES DE TONELADAS)
TABLA 311 MERCADO DE MINERALES ORGÁNICOS PARA ALIMENTOS ANIMALES DE QATAR, POR FORMA, 2018-2032 (MILES DE USD)
TABLA 312 MERCADO DE MINERALES ORGÁNICOS PARA ALIMENTOS ANIMALES DE QATAR, POR FORMA, 2018-2032 (MILES DE TONELADAS)
TABLA 313 MERCADO DE MINERALES ORGÁNICOS SECADOS EN ALIMENTOS ANIMALES DE QATAR, POR TIPO, 2018-2032 (MILES DE USD)
TABLA 314 MERCADO DE MINERALES ORGÁNICOS EN POLVO PARA ALIMENTOS ANIMALES, POR TIPO, 2018-2032 (MILES DE USD)
TABLA 315 MERCADO DE MINERALES ORGÁNICOS PARA ALIMENTOS ANIMALES EN QATAR, POR TIPO DE QUELATO, 2018-2032 (MILES DE USD)
TABLA 316 MERCADO DE MINERALES ORGÁNICOS PARA ALIMENTOS ANIMALES EN QATAR, POR TIPO DE QUELATO, 2018-2032 (MILES DE TONELADAS)
TABLA 317 MERCADO DE MINERALES ORGÁNICOS PARA ALIMENTOS ANIMALES DE QATAR, POR CICLO DE VIDA, 2018-2032 (MILES DE USD)
TABLA 318 MERCADO DE MINERALES ORGÁNICOS PARA ALIMENTOS ANIMALES EN QATAR, POR CICLO DE VIDA, 2018-2032 (MILES DE TONELADAS)
TABLA 319 MERCADO DE MINERALES ORGÁNICOS PARA ALIMENTOS ANIMALES DE QATAR, POR APLICACIÓN, 2018-2032 (MILES DE USD)
TABLA 320 MERCADO DE MINERALES ORGÁNICOS PARA ALIMENTOS ANIMALES DE QATAR, POR APLICACIÓN, 2018-2032 (MILES DE TONELADAS)
TABLA 321 MERCADO DE MINERALES ORGÁNICOS PARA ALIMENTOS ANIMALES EN QATAR, POR GANADO, 2018-2032 (MILES DE USD)
TABLA 322 MERCADO DE MINERALES ORGÁNICOS PARA ALIMENTOS ANIMALES EN QATAR, POR GANADO, 2018-2032 (MILES DE TONELADAS)
TABLA 323 MERCADO DE MINERALES ORGÁNICOS PARA RUMIANTES EN ALIMENTOS ANIMALES DE QATAR, POR TIPO, 2018-2032 (MILES DE USD)
TABLA 324 MERCADO DE MINERALES ORGÁNICOS PARA RUMIANTES EN ALIMENTOS ANIMALES DE QATAR, POR PRODUCTO, 2018-2032 (MILES DE USD)
TABLA 325 MERCADO DE MINERALES ORGÁNICOS PARA AVES DE CORRAL EN ALIMENTOS ANIMALES DE QATAR, POR TIPO, 2018-2032 (MILES DE USD)
TABLA 326 MERCADO DE MINERALES ORGÁNICOS PARA AVES DE CORRAL EN ALIMENTOS ANIMALES DE QATAR, POR PRODUCTO, 2018-2032 (MILES DE USD)
TABLA 327 MERCADO DE MINERALES ORGÁNICOS PARA CERDOS EN ALIMENTOS ANIMALES DE QATAR, POR TIPO, 2018-2032 (MILES DE USD)
TABLA 328 MERCADO DE MINERALES ORGÁNICOS PARA CERDOS EN ALIMENTOS ANIMALES DE QATAR, POR PRODUCTO, 2018-2032 (MILES DE USD)
TABLA 329 MERCADO DE MINERALES ORGÁNICOS PARA LA ACUICULTURA EN ALIMENTOS ANIMALES DE QATAR, POR TIPO, 2018-2032 (MILES DE USD)
TABLA 330 MERCADO DE CRUSTÁCEOS EN ALIMENTOS ANIMALES DE CATAR, POR TIPO, 2018-2032 (MILES DE USD)
TABLA 331 MERCADO DE MINERALES ORGÁNICOS PARA EL PESCADO EN ALIMENTOS ANIMALES DE QATAR, POR TIPO, 2018-2032 (MILES DE USD)
TABLA 332 MERCADO DE MOLUSCOS EN ALIMENTOS ANIMALES DE QATAR, POR TIPO, 2018-2032 (MILES DE USD)
TABLA 333 MERCADO DE MINERALES ORGÁNICOS PARA LA ACUICULTURA EN ALIMENTOS ANIMALES DE QATAR, POR PRODUCTO, 2018-2032 (MILES DE USD)
TABLA 334 MERCADO DE MINERALES ORGÁNICOS PARA MASCOTAS EN ALIMENTOS ANIMALES DE QATAR, POR TIPO, 2018-2032 (MILES DE USD)
TABLA 335 MERCADO DE MINERALES ORGÁNICOS PARA MASCOTAS EN ALIMENTOS ANIMALES DE QATAR, POR PRODUCTO, 2018-2032 (MILES DE USD)
TABLA 336 MERCADO DE MINERALES ORGÁNICOS PARA ALIMENTOS ANIMAL EQUINOS DE QATAR, POR PRODUCTO, 2018-2032 (MILES DE USD)
TABLA 337 QATAR OTROS EN EL MERCADO DE MINERALES ORGÁNICOS PARA ALIMENTOS ANIMALES, POR PRODUCTO, 2018-2032 (MILES DE USD)
CUADRO 338 BAHREIN
TABLA 339 MERCADO DE MINERALES ORGÁNICOS PARA ALIMENTOS ANIMALES EN BAHREIN, POR PRODUCTO, 2018-2032 (MILES DE USD)
TABLA 340 MERCADO DE MINERALES ORGÁNICOS PARA ALIMENTOS ANIMALES EN BAHREIN, POR PRODUCTO, 2018-2032 (MILES DE TONELADAS)
TABLA 341 MERCADO DE MINERALES ORGÁNICOS PARA ALIMENTOS ANIMALES DE BAHREIN, POR FORMA, 2018-2032 (MILES DE USD)
TABLA 342 MERCADO DE MINERALES ORGÁNICOS PARA ALIMENTOS ANIMALES DE BAHREIN, POR FORMA, 2018-2032 (MILES DE TONELADAS)
TABLA 343 MERCADO DE MINERALES ORGÁNICOS SECADOS EN ALIMENTOS ANIMALES DE BAHREIN, POR TIPO, 2018-2032 (MILES DE USD)
TABLA 344 MERCADO DE MINERALES ORGÁNICOS EN POLVO PARA ALIMENTOS ANIMALES DE BAHREIN, POR TIPO, 2018-2032 (MILES DE USD)
TABLA 345 MERCADO DE MINERALES ORGÁNICOS PARA ALIMENTOS ANIMALES EN BAHREIN, POR TIPO DE QUELATO, 2018-2032 (MILES DE USD)
TABLA 346 MERCADO DE MINERALES ORGÁNICOS PARA ALIMENTOS ANIMALES EN BAHREIN, POR TIPO DE QUELATO, 2018-2032 (MILES DE TONELADAS)
TABLA 347 MERCADO DE MINERALES ORGÁNICOS PARA ALIMENTOS ANIMALES EN BAHREIN, POR CICLO DE VIDA, 2018-2032 (MILES DE USD)
TABLA 348 MERCADO DE MINERALES ORGÁNICOS PARA ALIMENTOS ANIMALES EN BAHREIN, POR CICLO DE VIDA, 2018-2032 (MILES DE TONELADAS)
TABLA 349 MERCADO DE MINERALES ORGÁNICOS PARA ALIMENTOS ANIMALES DE BAHREIN, POR APLICACIÓN, 2018-2032 (MILES DE USD)
TABLA 350 MERCADO DE MINERALES ORGÁNICOS PARA ALIMENTOS ANIMALES DE BAHREIN, POR APLICACIÓN, 2018-2032 (MILES DE TONELADAS)
TABLA 351 MERCADO DE MINERALES ORGÁNICOS PARA ALIMENTOS ANIMALES EN BAHREIN, POR GANADO, 2018-2032 (MILES DE USD)
TABLA 352 MERCADO DE MINERALES ORGÁNICOS PARA ALIMENTOS ANIMALES EN BAHREIN, POR GANADO, 2018-2032 (MILES DE TONELADAS)
TABLA 353 MERCADO DE MINERALES ORGÁNICOS PARA RUMIANTES EN ALIMENTOS ANIMALES DE BAHREIN, POR TIPO, 2018-2032 (MILES DE USD)
TABLA 354 MERCADO DE MINERALES ORGÁNICOS PARA RUMIANTES EN ALIMENTOS ANIMALES DE BAHREIN, POR PRODUCTO, 2018-2032 (MILES DE USD)
TABLA 355 MERCADO DE MINERALES ORGÁNICOS PARA AVES DE CORRAL EN ALIMENTOS ANIMALES DE BAHREIN, POR TIPO, 2018-2032 (MILES DE USD)
TABLA 356 MERCADO DE MINERALES ORGÁNICOS PARA AVES DE CORRAL EN ALIMENTOS ANIMALES DE BAHREIN, POR PRODUCTO, 2018-2032 (MILES DE USD)
TABLA 357 MERCADO DE MINERALES ORGÁNICOS PARA CERDOS EN ALIMENTOS ANIMALES DE BAHREIN, POR TIPO, 2018-2032 (MILES DE USD)
TABLA 358 MERCADO DE MINERALES ORGÁNICOS PARA CERDOS EN ALIMENTOS ANIMALES DE BAHREIN, POR PRODUCTO, 2018-2032 (MILES DE USD)
TABLA 359 MERCADO DE MINERALES ORGÁNICOS PARA LA ACUICULTURA EN ALIMENTOS ANIMALES DE BAHREIN, POR TIPO, 2018-2032 (MILES DE USD)
TABLA 360 MERCADO DE CRUSTÁCEOS DE BAHREIN EN ALIMENTOS ANIMALES CON MINERALES ORGÁNICOS, POR TIPO, 2018-2032 (MILES DE USD)
TABLA 361 MERCADO DE MINERALES ORGÁNICOS DE PESCADO EN ALIMENTOS ANIMALES DE BAHREIN, POR TIPO, 2018-2032 (MILES DE USD)
TABLA 362 MERCADO DE MOLUSCOS DE BAHREIN EN ALIMENTOS ANIMALES CON MINERALES ORGÁNICOS, POR TIPO, 2018-2032 (MILES DE USD)
TABLA 363 MERCADO DE MINERALES ORGÁNICOS PARA LA ACUICULTURA EN ALIMENTOS ANIMALES DE BAHREIN, POR PRODUCTO, 2018-2032 (MILES DE USD)
TABLA 364 MERCADO DE MASCOTAS DE BAHRÉIN EN ALIMENTOS ANIMALES CON MINERALES ORGÁNICOS, POR TIPO, 2018-2032 (MILES DE USD)
TABLA 365 MERCADO DE MINERALES ORGÁNICOS PARA MASCOTAS EN ALIMENTOS ANIMALES DE BAHREIN, POR PRODUCTO, 2018-2032 (MILES DE USD)
TABLA 366 MERCADO DE MINERALES ORGÁNICOS PARA ALIMENTOS ANIMAL EQUINOS DE BAHREIN, POR PRODUCTO, 2018-2032 (MILES DE USD)
TABLA 367 BAHREIN OTROS EN EL MERCADO DE MINERALES ORGÁNICOS PARA ALIMENTOS ANIMALES, POR PRODUCTO, 2018-2032 (MILES DE USD)
TABLA 368 RESTO DEL MERCADO DE MINERALES ORGÁNICOS PARA ALIMENTOS ANIMALES EN ORIENTE MEDIO Y ÁFRICA, POR PRODUCTO, 2018-2032 (MILES DE USD)
TABLA 369 RESTO DEL MERCADO DE MINERALES ORGÁNICOS PARA ALIMENTOS ANIMALES EN ORIENTE MEDIO Y ÁFRICA, POR PRODUCTO, 2018-2032 (MILES DE TONELADAS)
Lista de figuras
FIGURA 1 MERCADO DE MINERALES ORGÁNICOS PARA ALIMENTOS ANIMALES EN ORIENTE MEDIO Y ÁFRICA
FIGURA 2 MERCADO DE MINERALES TRAZA ORGÁNICOS DE ALIMENTOS ANIMALES EN ORIENTE MEDIO Y ÁFRICA: TRIANGULACIÓN DE DATOS
FIGURA 3 MERCADO DE MINERALES TRAZA ORGÁNICOS PARA ALIMENTOS ANIMALES EN ORIENTE MEDIO Y ÁFRICA: ANÁLISIS DROC
FIGURA 4 MERCADO DE MINERALES TRAZA ORGÁNICOS PARA ALIMENTOS ANIMALES EN ORIENTE MEDIO Y ÁFRICA: ANÁLISIS DEL MERCADO DE ORIENTE MEDIO Y ÁFRICA VS. REGIONAL
FIGURA 5 MERCADO DE MINERALES OLIGOSO ORGÁNICOS PARA ALIMENTOS ANIMALES EN ORIENTE MEDIO Y ÁFRICA: ANÁLISIS DE INVESTIGACIÓN DE EMPRESAS
FIGURA 6 MERCADO DE MINERALES OLIGOSO ORGÁNICOS PARA ALIMENTOS ANIMALES EN ORIENTE MEDIO Y ÁFRICA: MODELADO MULTIVARIADO
FIGURA 7 MERCADO DE MINERALES OLIGOSO ORGÁNICOS DE ALIMENTOS ANIMALES EN ORIENTE MEDIO Y ÁFRICA: DATOS DEMOGRÁFICOS DE LAS ENTREVISTAS
FIGURA 8 MERCADO DE MINERALES TRAZA ORGÁNICOS DE ALIMENTOS ANIMALES EN ORIENTE MEDIO Y ÁFRICA: CUADRÍCULA DE POSICIÓN DE MERCADO DBMR
FIGURA 9 MERCADO DE MINERALES OLIGOSO ORGÁNICOS PARA ALIMENTOS ANIMALES EN ORIENTE MEDIO Y ÁFRICA: ANÁLISIS DE LA PARTICIPACIÓN DE LOS PROVEEDORES
FIGURA 10 MERCADO DE MINERALES OLIGOSO ORGÁNICOS PARA ALIMENTOS ANIMALES EN ORIENTE MEDIO Y ÁFRICA: CUADRÍCULA DE COBERTURA DE APLICACIONES DEL MERCADO
FIGURA 11 MERCADO DE MINERALES OLIGOESTÉRICOS ORGÁNICOS DE ALIMENTOS PARA ANIMALES EN ORIENTE MEDIO Y ÁFRICA: SEGMENTACIÓN
FIGURA 12 MERCADO DE MINERALES OLIGOSO ORGÁNICOS PARA ALIMENTOS ANIMALES EN ORIENTE MEDIO Y ÁFRICA: RESUMEN EJECUTIVO
FIGURA 13 DIECISIETE SEGMENTOS COMPRENDEN EL MERCADO DE MINERALES ORGÁNICOS PARA ALIMENTOS ANIMALES EN ORIENTE MEDIO Y ÁFRICA, POR PRODUCTO (2024)
FIGURA 14 MERCADO DE MINERALES OLIGOSO ORGÁNICOS PARA ALIMENTOS ANIMALES EN ORIENTE MEDIO Y ÁFRICA: DECISIONES ESTRATÉGICAS
FIGURA 15 SE ESPERA QUE LA AUMENTO DE LA DEMANDA DE PRODUCTOS ALIMENTICIOS DE ORIGEN ANIMAL ENRIQUECIDOS CON NUTRIENTES IMPULSE EL MERCADO DE MINERALES ORGÁNICOS PARA ALIMENTOS ANIMALES EN ORIENTE MEDIO Y ÁFRICA EN EL PERÍODO DE PRONÓSTICO
FIGURA 16 SE ESPERA QUE EL SEGMENTO DE CALCIO REPRESENTE LA MAYOR PARTICIPACIÓN DEL MERCADO DE MINERALES OLIGOS ORGÁNICOS PARA ALIMENTOS ANIMALES EN ORIENTE MEDIO Y ÁFRICA EN 2025 Y 2032
FIGURA 17 ANÁLISIS DE LAS CINCO FUERZAS DE PORTER
FIGURA 18 NÚMERO DE PATENTES V/S AÑO
FIGURA 19 NÚMERO DE PATENTES POR SOLICITANTE
FIGURA 20 PAÍS V/S NÚMERO DE PATENTES
FIGURA 21 ANÁLISIS DE PRECIOS
FIGURA 22 ESCENARIO DE IMPORTACIÓN Y EXPORTACIÓN (MILES DE USD)
FIGURA 23 ANÁLISIS DROC
FIGURA 24 MERCADO DE MINERALES OLIGOSO ORGÁNICOS PARA ALIMENTOS ANIMALES EN ORIENTE MEDIO Y ÁFRICA: POR PRODUCTO, 2024
FIGURA 25 MERCADO DE MINERALES ORGÁNICOS PARA ALIMENTOS ANIMALES EN ORIENTE MEDIO Y ÁFRICA: POR FORMA, 2024
FIGURA 26 MERCADO DE MINERALES OLIGOSO ORGÁNICOS PARA ALIMENTOS ANIMALES EN ORIENTE MEDIO Y ÁFRICA: POR TIPO DE QUELATO, 2024
FIGURA 27 MERCADO DE MINERALES OLIGOSO ORGÁNICOS PARA ALIMENTOS ANIMALES EN ORIENTE MEDIO Y ÁFRICA: POR CICLO DE VIDA, 2024
FIGURA 28 MERCADO DE MINERALES ORGÁNICOS PARA ALIMENTOS ANIMALES EN ORIENTE MEDIO Y ÁFRICA: POR APLICACIÓN, 2024
FIGURA 29 MERCADO DE MINERALES TRAZA ORGÁNICOS PARA ALIMENTOS ANIMALES EN ORIENTE MEDIO Y ÁFRICA: POR GANADO, 2024
FIGURA 30 MERCADO DE MINERALES ORGÁNICOS PARA ALIMENTOS ANIMALES EN ORIENTE MEDIO Y ÁFRICA: INSTANTÁNEA (2024)
FIGURA 31 MERCADO DE MINERALES OLIGOSO ORGÁNICOS PARA ALIMENTOS ANIMALES EN ORIENTE MEDIO Y ÁFRICA: PARTICIPACIÓN DE LA EMPRESA 2024 (%)
Metodología de investigación
La recopilación de datos y el análisis del año base se realizan utilizando módulos de recopilación de datos con muestras de gran tamaño. La etapa incluye la obtención de información de mercado o datos relacionados a través de varias fuentes y estrategias. Incluye el examen y la planificación de todos los datos adquiridos del pasado con antelación. Asimismo, abarca el examen de las inconsistencias de información observadas en diferentes fuentes de información. Los datos de mercado se analizan y estiman utilizando modelos estadísticos y coherentes de mercado. Además, el análisis de la participación de mercado y el análisis de tendencias clave son los principales factores de éxito en el informe de mercado. Para obtener más información, solicite una llamada de un analista o envíe su consulta.
La metodología de investigación clave utilizada por el equipo de investigación de DBMR es la triangulación de datos, que implica la extracción de datos, el análisis del impacto de las variables de datos en el mercado y la validación primaria (experto en la industria). Los modelos de datos incluyen cuadrícula de posicionamiento de proveedores, análisis de línea de tiempo de mercado, descripción general y guía del mercado, cuadrícula de posicionamiento de la empresa, análisis de patentes, análisis de precios, análisis de participación de mercado de la empresa, estándares de medición, análisis global versus regional y de participación de proveedores. Para obtener más información sobre la metodología de investigación, envíe una consulta para hablar con nuestros expertos de la industria.
Personalización disponible
Data Bridge Market Research es líder en investigación formativa avanzada. Nos enorgullecemos de brindar servicios a nuestros clientes existentes y nuevos con datos y análisis que coinciden y se adaptan a sus objetivos. El informe se puede personalizar para incluir análisis de tendencias de precios de marcas objetivo, comprensión del mercado de países adicionales (solicite la lista de países), datos de resultados de ensayos clínicos, revisión de literatura, análisis de mercado renovado y base de productos. El análisis de mercado de competidores objetivo se puede analizar desde análisis basados en tecnología hasta estrategias de cartera de mercado. Podemos agregar tantos competidores sobre los que necesite datos en el formato y estilo de datos que esté buscando. Nuestro equipo de analistas también puede proporcionarle datos en archivos de Excel sin procesar, tablas dinámicas (libro de datos) o puede ayudarlo a crear presentaciones a partir de los conjuntos de datos disponibles en el informe.

