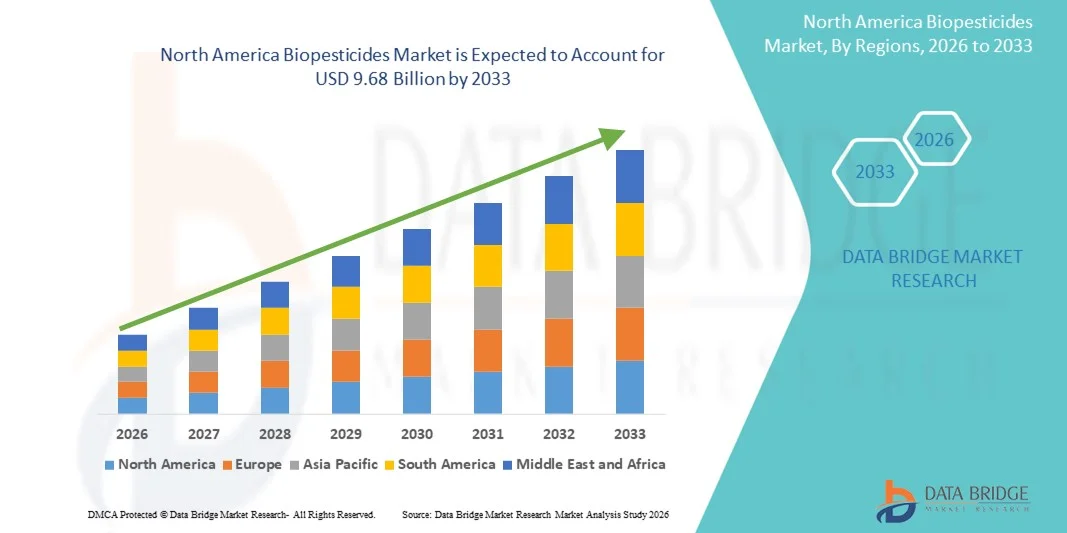
North America Biopesticides Market
Tamaño del mercado en miles de millones de dólares
Tasa de crecimiento anual compuesta (CAGR) :
% 
 USD
3.25 Billion
USD
9.68 Billion
2025
2033
USD
3.25 Billion
USD
9.68 Billion
2025
2033
| 2026 –2033 | |
| USD 3.25 Billion | |
| USD 9.68 Billion | |
| % | |
|
Segmentación del mercado de biopesticidas en Norteamérica: tipo (bioinsecticidas, biofungicidas, bionematicidas, bioherbicidas y otros), origen (microbianos, bioquímicos e insectos), presentación (seca y líquida), aplicación (foliar, fertirrigación, tratamiento de suelos, tratamiento de semillas y otros), categoría (agricultura y horticultura), cultivos (frutas y hortalizas, cereales y granos, oleaginosas y legumbres, césped y plantas ornamentales, entre otros): tendencias y pronóstico de la industria hasta 2033.
Tamaño del mercado de biopesticidas en América del Norte
- El tamaño del mercado de biopesticidas se valoró en USD 3.25 mil millones en 2025 y se espera que alcance los USD 9.68 mil millones para 2033 , con una CAGR del 14,60% durante el período de pronóstico.
- El crecimiento del mercado está impulsado en gran medida por la creciente demanda mundial de alimentos orgánicos, las mayores preocupaciones ambientales y el apoyo gubernamental a las prácticas agrícolas sostenibles.
- La creciente conciencia entre los agricultores sobre los efectos adversos de los pesticidas químicos y la creciente tendencia al manejo integrado de plagas (MIP) están acelerando aún más la adopción de biopesticidas.
Análisis del mercado de biopesticidas en América del Norte
- El mercado de biopesticidas está experimentando un sólido crecimiento, respaldado por el cambio creciente hacia prácticas agrícolas sostenibles y la demanda de soluciones ecológicas de protección de cultivos.
- Los biopesticidas, derivados de materiales naturales como animales, plantas, bacterias y ciertos minerales, están ganando importancia debido a sus menores niveles de toxicidad, su huella ambiental reducida y su acción específica sobre el objetivo.
- El mercado estadounidense de biopesticidas capturó la mayor participación en los ingresos en 2025, impulsado por la creciente adopción de bioinsecticidas, biofungicidas y bioherbicidas en cultivos en hileras, frutas y verduras.
- Se espera que Canadá experimente la mayor tasa de crecimiento anual compuesta (TCAC) en el mercado de biopesticidas de Norteamérica debido a la creciente concienciación sobre la protección biológica de cultivos, la expansión de cultivos de alto valor y especializados, y las iniciativas gubernamentales que promueven la agricultura sostenible. La creciente preferencia por soluciones agrícolas orgánicas y ambientalmente seguras está impulsando la adopción de biopesticidas en el país.
- El segmento de bioinsecticidas representó la mayor cuota de mercado en ingresos, con un 37,4%, en 2025, impulsado principalmente por su acción específica contra las plagas y su mínimo impacto en organismos no objetivo. La creciente resistencia de las plagas a los productos químicos convencionales ha llevado a los agricultores a adoptar los bioinsecticidas como una alternativa sostenible. Además, el apoyo regulatorio a las soluciones ecológicas para la protección de cultivos y la creciente demanda de productos orgánicos impulsan aún más el dominio de este segmento.
Alcance del informe y segmentación del mercado de biopesticidas en América del Norte
|
Atributos |
Perspectivas clave del mercado de biopesticidas en América del Norte |
|
Segmentos cubiertos |
|
|
Países cubiertos |
América del norte
|
|
Actores clave del mercado |
• Marrone Bio Innovations (EE. UU.) |
|
Oportunidades de mercado |
|
|
Conjuntos de información de datos de valor añadido |
Además de los conocimientos sobre escenarios de mercado como valor de mercado, tasa de crecimiento, segmentación, cobertura geográfica y actores principales, los informes de mercado seleccionados por Data Bridge Market Research también incluyen análisis de importación y exportación, descripción general de la capacidad de producción, análisis del consumo de producción, análisis de tendencias de precios, escenario de cambio climático, análisis de la cadena de suministro, análisis de la cadena de valor, descripción general de materias primas/consumibles, criterios de selección de proveedores, análisis PESTLE, análisis de Porter y marco regulatorio. |
Tendencias del mercado de biopesticidas en América del Norte
Creciente adopción de soluciones ecológicas para la protección de cultivos
- El creciente enfoque en la agricultura sostenible y respetuosa con el medio ambiente está transformando significativamente el mercado de los biopesticidas, ya que los agricultores prefieren cada vez más productos que minimizan los residuos químicos y preservan la salud del suelo. Los biopesticidas están ganando terreno gracias a su capacidad para combatir plagas y patógenos sin dañar a los organismos benéficos, lo que consolida su adopción en el cultivo de cereales, frutas, hortalizas y cultivos de alto valor. Esta tendencia anima a los fabricantes a innovar con nuevas formulaciones que se adapten a las prácticas agrícolas en constante evolución.
- La creciente conciencia sobre la salud del suelo, la calidad del rendimiento de los cultivos y las prácticas agrícolas ecológicas ha acelerado la demanda de biopesticidas en cultivos en hileras, horticultura y cultivos de invernadero. Los agricultores y las empresas agroindustriales con conciencia ambiental buscan activamente productos derivados de fuentes naturales, lo que impulsa a las marcas a priorizar el abastecimiento y los procesos de producción sostenibles. Esto también ha impulsado la colaboración entre proveedores de ingredientes y fabricantes de agroquímicos para mejorar la eficacia del control de plagas y la seguridad de los cultivos.
- Las tendencias de sostenibilidad y cumplimiento normativo influyen en las decisiones de compra, y los fabricantes priorizan soluciones de biopesticidas trazables, ecológicas y certificadas. Estos factores ayudan a las marcas a diferenciar sus productos en un mercado competitivo y a generar confianza entre los agricultores, a la vez que impulsan la adopción de la certificación orgánica y el etiquetado ambientalmente seguro. Las empresas utilizan cada vez más campañas educativas para destacar estos beneficios y fomentar su adopción.
- Por ejemplo, en 2024, los principales fabricantes de biopesticidas ampliaron sus carteras de productos con la introducción de nuevas formulaciones microbianas, bioquímicas y bionematicidas. Estos lanzamientos respondieron a la creciente demanda de soluciones ecológicas y eficaces para el control de plagas, con distribución a través de cooperativas agrícolas, comercio minorista y canales en línea. Los productos se comercializaron como seguros para el suelo, los cultivos y los insectos benéficos, lo que fomentó la confianza de los agricultores y su adopción continua.
- Si bien la demanda de biopesticidas está en aumento, la expansión sostenida del mercado depende de la I+D continua, la producción rentable y el mantenimiento de un rendimiento funcional comparable al de los pesticidas químicos. Los fabricantes también se centran en mejorar la escalabilidad, la fiabilidad de la cadena de suministro y el desarrollo de soluciones innovadoras que equilibren coste, eficacia y sostenibilidad para una adopción más amplia.
Dinámica del mercado de biopesticidas en América del Norte
Conductor
Creciente preferencia por soluciones de protección de cultivos sostenibles y ecológicas
- La creciente preferencia de los agricultores por soluciones naturales y respetuosas con el medio ambiente para el control de plagas es un factor clave para el mercado de los biopesticidas. Los fabricantes están sustituyendo cada vez más los pesticidas químicos por alternativas microbianas, bioquímicas y botánicas para cumplir con los requisitos de sostenibilidad, mejorar la seguridad de los cultivos y cumplir con las normas regulatorias. Esta tendencia también impulsa la investigación de nuevas fuentes naturales para la producción de biopesticidas, lo que impulsa la diversificación de productos.
- La expansión de las aplicaciones en cereales, granos, frutas, hortalizas, legumbres, césped y cultivos ornamentales está impulsando el crecimiento del mercado. Los biopesticidas ayudan a mejorar el rendimiento, la calidad y la vida útil de los cultivos, a la vez que mantienen prácticas ecológicas, lo que permite a los agricultores cumplir con las expectativas de sostenibilidad. La creciente adopción de prácticas de manejo integrado de plagas (MIP) a nivel mundial refuerza aún más esta tendencia.
- Los fabricantes de agroquímicos y semillas promueven activamente las formulaciones basadas en biopesticidas mediante innovación de productos, campañas de marketing y certificaciones. Estos esfuerzos se ven respaldados por la creciente preferencia de los agricultores por soluciones de protección de cultivos sostenibles, seguras y de alta calidad, y también fomentan las colaboraciones entre proveedores y agroindustrias para mejorar el rendimiento de los productos y reducir el impacto ambiental.
- Por ejemplo, en 2023, las principales empresas agroquímicas informaron una mayor incorporación de biopesticidas microbianos y bioquímicos en soluciones de protección de cultivos. Esta expansión se produjo tras una mayor demanda de productos de control de plagas no tóxicos, ecológicos y eficaces, lo que impulsó el uso recurrente y la diferenciación en el mercado. Las empresas también destacaron la sostenibilidad y la trazabilidad en sus campañas promocionales para fortalecer la confianza y la fidelidad de los agricultores.
- Si bien las crecientes tendencias de sostenibilidad impulsan el crecimiento, una adopción más amplia depende de la optimización de costos, la disponibilidad de ingredientes y la escalabilidad de los procesos de producción. La inversión en la eficiencia de la cadena de suministro, el abastecimiento sostenible y la tecnología avanzada de formulación serán cruciales para satisfacer la demanda global y mantener la ventaja competitiva.
Restricción/Desafío
Mayor costo y menor concientización en comparación con los pesticidas convencionales
- El costo relativamente más alto de los biopesticidas en comparación con los pesticidas químicos convencionales sigue siendo un desafío clave, lo que limita su adopción entre los agricultores sensibles a los precios. El aumento en los costos de las materias primas, la complejidad de los métodos de producción y formulación contribuyen a un precio elevado. Además, la disponibilidad fluctuante de ingredientes microbianos o botánicos certificados puede afectar la estabilidad de costos y la penetración en el mercado.
- La concienciación y la comprensión de los agricultores siguen siendo desiguales, sobre todo en regiones donde predominan los plaguicidas convencionales. El escaso conocimiento de sus beneficios funcionales restringe su adopción en ciertos tipos de cultivos. Esto también provoca una adopción más lenta en zonas donde la educación agrícola sobre bioplaguicidas es mínima.
- Los desafíos en la cadena de suministro y la distribución también impactan el crecimiento del mercado, ya que los biopesticidas requieren el abastecimiento de productores certificados y el cumplimiento de estrictos estándares de calidad. Las complejidades logísticas y la menor vida útil de algunos productos microbianos o bioquímicos incrementan los costos operativos. Las empresas deben invertir en redes adecuadas de almacenamiento, manipulación y transporte para mantener la integridad del producto.
- Por ejemplo, en 2024, los distribuidores que suministraban bioinsecticidas y biofungicidas informaron de una menor aceptación debido al aumento de precios y a la escasa concienciación sobre su eficacia en comparación con las alternativas químicas. Los requisitos de almacenamiento y el cumplimiento de las certificaciones orgánicas o ecológicas constituyeron barreras adicionales. Algunos minoristas también limitaron el espacio en los anaqueles para los biopesticidas premium, lo que afectó la visibilidad y las ventas.
- Superar estos desafíos requerirá una producción rentable, redes de distribución ampliadas e iniciativas educativas específicas para agricultores y agroindustrias. La colaboración con cooperativas agrícolas, organismos de certificación y proveedores de tecnología puede ayudar a impulsar el potencial de crecimiento a largo plazo del mercado global de biopesticidas. Además, el desarrollo de formulaciones competitivas en costos y altamente efectivas, y el fortalecimiento de las estrategias de marketing en torno a los beneficios de la sostenibilidad serán esenciales para una adopción generalizada.
Alcance del mercado de biopesticidas en América del Norte
El mercado está segmentado según tipo, fuente, forma, aplicación, categoría y cultivos.
- Por tipo
Según el tipo, el mercado norteamericano de biopesticidas se segmenta en bioinsecticidas, biofungicidas, bionematicidas, bioherbicidas y otros. El segmento de bioinsecticidas representó la mayor cuota de mercado en ingresos, con un 37,4%, en 2025, impulsado principalmente por su acción específica contra las plagas y su mínimo impacto en organismos no objetivo. La creciente resistencia de las plagas a los productos químicos convencionales ha llevado a los agricultores a adoptar los bioinsecticidas como una alternativa sostenible. Además, el apoyo regulatorio a las soluciones ecológicas para la protección de cultivos y la creciente demanda de productos orgánicos impulsan aún más el predominio de este segmento.
Se prevé que el segmento de bionematicidas experimente su mayor crecimiento entre 2026 y 2033, debido a la creciente preocupación por la salud del suelo y los efectos adversos de los nematicidas sintéticos. Los bionematicidas ofrecen una alternativa más segura para la protección radicular y están ganando popularidad en los programas de manejo integrado de plagas (MIP), especialmente en regiones con cultivos intensivos de hortalizas y frutas. La creciente concienciación de los agricultores sobre las prácticas agrícolas sostenibles y el mantenimiento de la fertilidad del suelo está impulsando aún más este segmento. Además, se espera que las iniciativas gubernamentales de apoyo que promueven alternativas ecológicas en la agricultura impulsen la penetración de los bionematicidas en el mercado.
- Por fuente
Según su origen, el mercado norteamericano de biopesticidas se segmenta en microbianos, bioquímicos e insectos. El segmento microbiano dominó el mercado en 2025 gracias a la amplia disponibilidad de cepas microbianas como Bacillus thuringiensis y Trichoderma. Estos microbios se utilizan ampliamente en diversos tipos de cultivos gracias a su eficacia comprobada, facilidad de formulación y compatibilidad con otros insumos. Además, la investigación continua está llevando al descubrimiento de nuevas cepas microbianas que atacan plagas y patógenos específicos, mejorando la eficiencia del producto. Este segmento también se beneficia de sólidas redes de distribución y de una mayor concienciación entre los agricultores sobre las soluciones ecológicas para la protección de cultivos.
Se prevé que el segmento bioquímico experimente el mayor crecimiento entre 2026 y 2033, impulsado por el mayor uso de extractos vegetales y feromonas que ofrecen mecanismos únicos para la eliminación de plagas sin dañar a los insectos benéficos ni a los polinizadores. Las innovaciones en las técnicas de extracción y estabilización están permitiendo una mayor potencia y una eficacia más duradera de los productos bioquímicos. La creciente tendencia de la agricultura de precisión y las estrategias de manejo integrado de plagas (MIP) impulsa aún más la adopción de biopesticidas bioquímicos. Además, los organismos reguladores están otorgando aprobaciones favorables para las soluciones bioquímicas, lo que fortalece su potencial de mercado.
- Por formulario
En cuanto a su presentación, el mercado norteamericano de biopesticidas se segmenta en seco y líquido. El segmento líquido registró la mayor participación en 2025, favorecido por su fácil aplicación a través de diversos sistemas, como pulverización foliar, fertirrigación y riego por aspersión. Las formulaciones líquidas también ofrecen una absorción más rápida y una mayor eficacia en el control de plagas en diversas condiciones ambientales. Este segmento se ve impulsado además por los avances en las tecnologías de pulverización y los sistemas de riego automatizados que mejoran la precisión y minimizan el desperdicio de producto. La creciente preferencia de los agricultores por las formulaciones listas para usar y los productos de alta solubilidad también está impulsando la adopción de biopesticidas líquidos.
Se prevé que el segmento de productos secos experimente el mayor crecimiento entre 2026 y 2033 debido a sus ventajas en cuanto a estabilidad de la vida útil, menores costos de transporte y su idoneidad para el tratamiento de semillas, especialmente en cultivos de cereales y legumbres. Las formulaciones secas también son más fáciles de almacenar y manipular, lo que reduce los desafíos logísticos en regiones agrícolas remotas. La creciente adopción de métodos de aplicación basados en recubrimientos y gránulos está mejorando la eficacia de los biopesticidas secos. Además, las empresas agrícolas emergentes y las compañías de semillas están incorporando cada vez más biopesticidas secos en soluciones integrales de protección de cultivos.
- Por aplicación
En función de su aplicación, el mercado norteamericano de biopesticidas se segmenta en aplicación foliar, fertirrigación, tratamiento de suelos, tratamiento de semillas, entre otros. El segmento de aplicación foliar dominó el mercado con una participación importante en 2025, gracias a su eficacia en el control inmediato de plagas y su mínima persistencia ambiental. Este método se adopta comúnmente en el cultivo de frutas y hortalizas, donde los daños visibles causados por plagas afectan directamente el valor del cultivo. Este segmento se beneficia del desarrollo de equipos de pulverización de alta precisión y drones automatizados que mejoran la cobertura y la eficacia. Además, la investigación sobre la compatibilidad de formulaciones garantiza que los productos foliares no dañen los cultivos ni afecten el crecimiento.
Se prevé que el segmento de tratamiento de semillas experimente el mayor crecimiento entre 2026 y 2033, impulsado por una mayor concienciación sobre la protección temprana de los cultivos, la rentabilidad y la compatibilidad con prácticas agrícolas sostenibles. Los tratamientos de semillas también ofrecen protección a largo plazo contra patógenos y plagas del suelo, reduciendo la necesidad de aplicaciones químicas repetidas. La creciente adopción de semillas híbridas y modificadas genéticamente fomenta aún más la integración con biopesticidas. Este segmento se apoya en alianzas entre empresas de semillas y fabricantes de biopesticidas para entregar semillas pretratadas a los agricultores.
- Por categoría
Según la categoría, el mercado norteamericano de biopesticidas se segmenta en agricultura y horticultura. El segmento agrícola representó la mayor cuota de mercado en 2025, impulsado por la creciente adopción de biopesticidas en cultivos en hileras como cereales, granos y legumbres. Los agricultores recurren cada vez más a los biopesticidas para cumplir con las normas regulatorias y reducir los niveles de residuos químicos. Además, las explotaciones agrícolas a gran escala están invirtiendo en soluciones de biopesticidas para mejorar sus credenciales de sostenibilidad y cumplir con los requisitos de exportación. Los servicios de extensión agrícola y los programas gubernamentales de apoyo también están promoviendo el uso de biopesticidas en la agricultura convencional.
Se prevé que el sector de la horticultura experimente el mayor crecimiento entre 2026 y 2033, especialmente en cultivos de invernadero y de alto valor, como bayas y hortalizas de hoja, donde la calidad y la seguridad del producto son cruciales. Las técnicas de aplicación precisa y la agricultura en ambiente controlado impulsan el uso eficiente de biopesticidas en la horticultura. La creciente demanda de frutas y hortalizas orgánicas y sin pesticidas por parte de los consumidores impulsa aún más su adopción en este segmento. La colaboración con proveedores de tecnología hortícola también facilita soluciones de biopesticidas a medida.
- Por cultivos
En cuanto a los cultivos, el mercado norteamericano de biopesticidas se segmenta en frutas y hortalizas, cereales y granos, oleaginosas y legumbres, césped y plantas ornamentales, y otros cultivos. El segmento de frutas y hortalizas dominó el mercado en 2025, debido a las estrictas regulaciones de exportación en materia de residuos químicos y a la creciente demanda de productos orgánicos. Además, los cultivos de alto valor con estándares de calidad exigentes se benefician significativamente de los biopesticidas, lo que impulsa su preferencia sobre las alternativas químicas. Las campañas de concienciación y los incentivos gubernamentales para la agricultura orgánica también impulsan el crecimiento del mercado en esta categoría de cultivos.
Se prevé que el segmento de césped y plantas ornamentales experimente el mayor crecimiento entre 2026 y 2033, especialmente en regiones desarrolladas donde la salud estética de las plantas y las prácticas de paisajismo ecológicas están cobrando impulso. Los biopesticidas en este segmento ayudan a controlar las plagas, manteniendo el atractivo visual y la seguridad ambiental. Su creciente adopción en campos de golf, parques y proyectos de paisajismo urbano está impulsando el crecimiento. Los avances tecnológicos en equipos de aplicación y la estabilidad de las formulaciones impulsan aún más la penetración en el mercado de cultivos de césped y ornamentales.
Análisis regional del mercado de biopesticidas en América del Norte
- El mercado estadounidense de biopesticidas capturó la mayor participación en los ingresos en 2025, impulsado por la creciente adopción de bioinsecticidas, biofungicidas y bioherbicidas en cultivos en hileras, frutas y verduras.
- Los agricultores están priorizando el manejo sostenible de plagas para cumplir con los estándares regulatorios, reducir los residuos químicos y satisfacer la demanda de los consumidores de productos orgánicos.
- La adopción generalizada está respaldada por incentivos gubernamentales, sólidas inversiones en I+D en nuevas formulaciones de biopesticidas y sólidas colaboraciones entre empresas agroquímicas y distribuidores.
Perspectivas del mercado canadiense de biopesticidas
Se prevé que el mercado canadiense de biopesticidas experimente su mayor crecimiento entre 2026 y 2033, impulsado por la creciente concienciación sobre la agricultura ecológica y la demanda de cultivos orgánicos de alta calidad. Los agricultores incorporan cada vez más biopesticidas microbianos y bioquímicos en los programas de manejo integrado de plagas para mejorar la producción y garantizar la seguridad ambiental. Las políticas gubernamentales que promueven la agricultura sostenible, junto con la expansión de las redes de distribución y las iniciativas de investigación para soluciones biopesticidas avanzadas, impulsan aún más el crecimiento del mercado.
Cuota de mercado de biopesticidas en América del Norte
La industria de biopesticidas de América del Norte está liderada principalmente por empresas bien establecidas, entre las que se incluyen:
• Marrone Bio Innovations (EE. UU.)
• Certis USA LLC (EE. UU.)
• Valent BioSciences Corporation (EE. UU.)
• Island IPM (EE.
UU.) • BioWorks, Inc. ( EE. UU.) •
AgBiTech (EE. UU.)
• Andermatt USA (EE. UU.)
• BioSafe Systems (EE. UU.
) • Novozymes Biologicals (EE. UU.)
• Lallemand Plant Care (EE. UU.)
• Gowan Company (EE. UU.)
• T. Stanes & Company (EE. UU.)
• Terramera Inc. (Canadá)
• Nufarm Americas Inc (EE. UU.)
• Stockton Products (EE. UU.)
Últimos avances en el mercado de biopesticidas en América del Norte
- En junio de 2025, BioWorks Inc. lanzó PRINCIPLE WP, un bioinsecticida formulado con Beauveria bassiana, dirigido contra plagas como trips, pulgones y mosca blanca. Diseñado para cultivos de invernadero y de campo, este producto ofrece a los agricultores estadounidenses y canadienses una solución eficiente y sostenible para el control de plagas, promoviendo prácticas agrícolas ecológicas y mejorando la productividad de los cultivos.
- En diciembre de 2024, UPL Corp (EE. UU.) presentó NIMAXXA, un tratamiento bionematicida de base microbiana para semillas de soja y maíz. El producto ofrece un triple beneficio: suprime nematodos, mejora la salud radicular y optimiza la absorción de nutrientes, apoyando iniciativas de agricultura sostenible e impulsando la adopción de soluciones biológicas para la protección de cultivos en el mercado estadounidense.
- En julio de 2024, Andermatt Group AG adquirió BioTEPP Inc., una empresa canadiense conocida por su biopesticida Virosoft CP4 contra el granulovirus, dirigido contra la polilla de la manzana. Esta adquisición fortalece la presencia de Andermatt en Norteamérica, amplía su cartera de productos biológicos para la protección de cultivos y facilita una mayor adopción de soluciones ecológicas de control de plagas en cultivos frutales clave.
SKU-
Obtenga acceso en línea al informe sobre la primera nube de inteligencia de mercado del mundo

- Panel de análisis de datos interactivo
- Panel de análisis de empresas para oportunidades con alto potencial de crecimiento
- Acceso de analista de investigación para personalización y consultas
- Análisis de la competencia con panel interactivo
- Últimas noticias, actualizaciones y análisis de tendencias
- Aproveche el poder del análisis de referencia para un seguimiento integral de la competencia
Metodología de investigación
La recopilación de datos y el análisis del año base se realizan utilizando módulos de recopilación de datos con muestras de gran tamaño. La etapa incluye la obtención de información de mercado o datos relacionados a través de varias fuentes y estrategias. Incluye el examen y la planificación de todos los datos adquiridos del pasado con antelación. Asimismo, abarca el examen de las inconsistencias de información observadas en diferentes fuentes de información. Los datos de mercado se analizan y estiman utilizando modelos estadísticos y coherentes de mercado. Además, el análisis de la participación de mercado y el análisis de tendencias clave son los principales factores de éxito en el informe de mercado. Para obtener más información, solicite una llamada de un analista o envíe su consulta.
La metodología de investigación clave utilizada por el equipo de investigación de DBMR es la triangulación de datos, que implica la extracción de datos, el análisis del impacto de las variables de datos en el mercado y la validación primaria (experto en la industria). Los modelos de datos incluyen cuadrícula de posicionamiento de proveedores, análisis de línea de tiempo de mercado, descripción general y guía del mercado, cuadrícula de posicionamiento de la empresa, análisis de patentes, análisis de precios, análisis de participación de mercado de la empresa, estándares de medición, análisis global versus regional y de participación de proveedores. Para obtener más información sobre la metodología de investigación, envíe una consulta para hablar con nuestros expertos de la industria.
Personalización disponible
Data Bridge Market Research es líder en investigación formativa avanzada. Nos enorgullecemos de brindar servicios a nuestros clientes existentes y nuevos con datos y análisis que coinciden y se adaptan a sus objetivos. El informe se puede personalizar para incluir análisis de tendencias de precios de marcas objetivo, comprensión del mercado de países adicionales (solicite la lista de países), datos de resultados de ensayos clínicos, revisión de literatura, análisis de mercado renovado y base de productos. El análisis de mercado de competidores objetivo se puede analizar desde análisis basados en tecnología hasta estrategias de cartera de mercado. Podemos agregar tantos competidores sobre los que necesite datos en el formato y estilo de datos que esté buscando. Nuestro equipo de analistas también puede proporcionarle datos en archivos de Excel sin procesar, tablas dinámicas (libro de datos) o puede ayudarlo a crear presentaciones a partir de los conjuntos de datos disponibles en el informe.

