
North America Biopesticides Market
Market Size in USD Billion
 USD
3.25 Billion
USD
9.68 Billion
2025
2033
USD
3.25 Billion
USD
9.68 Billion
2025
2033
| 2026 - 2033 | |
| USD 3.25 Billion | |
| USD 9.68 Billion | |
| % | |
|
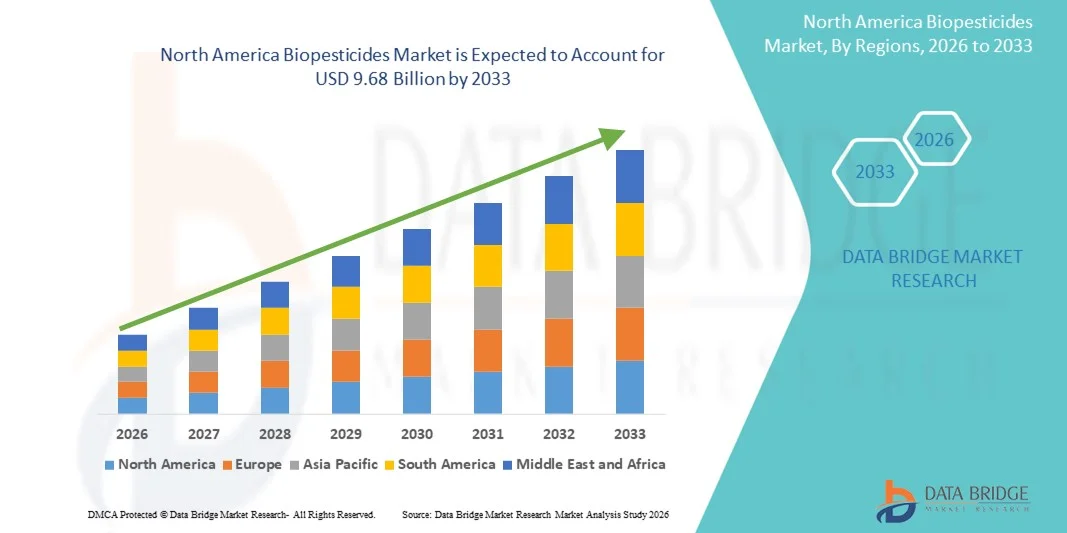
North America Biopesticides Market Size
- The biopesticides market size was valued at USD 3.25 billion in 2025 and is expected to reach USD 9.68 billion by 2033, at a CAGR of 14.60% during the forecast period
- The market growth is largely fuelled by the increasing global demand for organic food, heightened environmental concerns, and government support for sustainable agriculture practices
- The rising awareness among farmers about the adverse effects of chemical pesticides and the growing trend of integrated pest management (IPM) are further accelerating the adoption of biopesticides
North America Biopesticides Market Analysis
- The biopesticides market is experiencing robust growth, supported by the increasing shift towards sustainable agricultural practices and the demand for eco-friendly crop protection solutions
- biopesticides, derived from natural materials such as animals, plants, bacteria, and certain minerals, are gaining prominence due to their lower toxicity levels, reduced environmental footprint, and target-specific action
- U.S. biopesticides market captured the largest revenue share in 2025, fueled by the increasing adoption of bioinsecticides, biofungicides, and bioherbicides across row crops, fruits, and vegetables
- Canada is expected to witness the highest compound annual growth rate (CAGR) in the North America biopesticides market due to rising awareness of biological crop protection, expansion of high-value and specialty crops, and government initiatives promoting sustainable agriculture. The growing preference for organic and environmentally safe farming solutions is boosting the adoption of biopesticides in the country
- The bioinsecticides segment accounted for the largest market revenue share of 37.4% in 2025, primarily driven by their targeted action against pest species and minimal impact on non-target organisms. The increasing resistance of pests to conventional chemicals has led farmers to adopt bioinsecticides as a sustainable alternative. Moreover, regulatory support for eco-friendly crop protection solutions and the rising demand for organic produce further propel the dominance of this segment
Report Scope and North America Biopesticides Market Segmentation
|
Attributes |
North America Biopesticides Key Market Insights |
|
Segments Covered |
|
|
Countries Covered |
North America
|
|
Key Market Players |
• Marrone Bio Innovations (U.S.) |
|
Market Opportunities |
|
|
Value Added Data Infosets |
In addition to the insights on market scenarios such as market value, growth rate, segmentation, geographical coverage, and major players, the market reports curated by the Data Bridge Market Research also include import export analysis, production capacity overview, production consumption analysis, price trend analysis, climate change scenario, supply chain analysis, value chain analysis, raw material/consumables overview, vendor selection criteria, PESTLE Analysis, Porter Analysis, and regulatory framework. |
North America Biopesticides Market Trends
Rising Adoption of Eco-Friendly Crop Protection Solutions
- The growing focus on sustainable and environmentally safe agriculture is significantly shaping the biopesticides market, as farmers increasingly prefer products that minimize chemical residues and preserve soil health. Biopesticides are gaining traction due to their ability to target pests and pathogens without harming beneficial organisms, strengthening their adoption across cereal, fruit, vegetable, and high-value crop cultivation. This trend encourages manufacturers to innovate with new formulations that cater to evolving agricultural practices
- Increasing awareness around soil health, crop yield quality, and eco-friendly farming practices has accelerated the demand for biopesticides in row crops, horticulture, and greenhouse cultivation. Environmentally conscious farmers and agribusinesses are actively seeking products derived from natural sources, prompting brands to prioritize sustainable sourcing and production processes. This has also led to collaborations between ingredient suppliers and agrochemical manufacturers to enhance pest control efficacy and crop safety
- Sustainability and regulatory compliance trends are influencing purchasing decisions, with manufacturers emphasizing traceable, eco-friendly, and certified biopesticide solutions. These factors are helping brands differentiate products in a competitive market and build trust among farmers, while also driving the adoption of organic certification and environmentally safe labeling. Companies are increasingly using educational campaigns to highlight these benefits and encourage adoption
- For instance, in 2024, leading biopesticide manufacturers expanded their product portfolios by introducing novel microbial, biochemical, and bionematicide formulations. These launches were introduced in response to rising demand for eco-friendly and effective pest management solutions, with distribution across agricultural cooperatives, retail, and online channels. The products were marketed as safe for soil, crops, and beneficial insects, enhancing farmer trust and repeat adoption
- While demand for biopesticides is growing, sustained market expansion depends on continuous R&D, cost-efficient production, and maintaining functional performance comparable to chemical pesticides. Manufacturers are also focusing on improving scalability, supply chain reliability, and developing innovative solutions that balance cost, efficacy, and sustainability for broader adoption
North America Biopesticides Market Dynamics
Driver
Growing Preference for Sustainable and Eco-Friendly Crop Protection Solutions
- Rising farmer preference for natural, environmentally safe pest control solutions is a major driver for the biopesticides market. Manufacturers are increasingly replacing chemical pesticides with microbial, biochemical, and botanical alternatives to meet sustainability requirements, improve crop safety, and comply with regulatory standards. This trend is also driving research into novel natural sources for biopesticide production, supporting product diversification
- Expanding applications in cereals, grains, fruits, vegetables, pulses, turf, and ornamental crops are influencing market growth. Biopesticides help enhance crop yield, quality, and shelf life while maintaining eco-friendly practices, enabling farmers to meet sustainability expectations. The increasing adoption of integrated pest management (IPM) practices globally further reinforces this trend
- Agrochemical and seed manufacturers are actively promoting biopesticide-based formulations through product innovation, marketing campaigns, and certifications. These efforts are supported by growing farmer preference for sustainable, safe, and high-quality crop protection solutions, and they also encourage partnerships between suppliers and agribusinesses to improve product performance and reduce environmental footprint
- For instance, in 2023, major agrochemical companies reported increased incorporation of microbial and biochemical biopesticides in crop protection solutions. This expansion followed higher demand for non-toxic, eco-friendly, and effective pest control products, driving repeat usage and market differentiation. Companies also highlighted sustainability and traceability in promotional campaigns to strengthen farmer trust and loyalty
- Although rising sustainability trends support growth, wider adoption depends on cost optimization, ingredient availability, and scalable production processes. Investment in supply chain efficiency, sustainable sourcing, and advanced formulation technology will be critical for meeting global demand and maintaining competitive advantage
Restraint/Challenge
Higher Cost And Limited Awareness Compared To Conventional Pesticides
- The relatively higher cost of biopesticides compared to conventional chemical pesticides remains a key challenge, limiting adoption among price-sensitive farmers. Higher raw material costs, complex production, and formulation methods contribute to elevated pricing. In addition, fluctuating availability of certified microbial or botanical ingredients can affect cost stability and market penetration
- Farmer awareness and understanding remain uneven, particularly in regions where conventional pesticides dominate. Limited knowledge of functional benefits restricts adoption across certain crop types. This also leads to slower uptake in areas where agricultural education on biopesticides is minimal
- Supply chain and distribution challenges also impact market growth, as biopesticides require sourcing from certified producers and adherence to stringent quality standards. Logistical complexities and shorter shelf life of some microbial or biochemical products increase operational costs. Companies must invest in proper storage, handling, and transport networks to maintain product integrity
- For instance, in 2024, distributors supplying bioinsecticides and biofungicides reported slower uptake due to higher prices and limited awareness of efficacy compared to chemical alternatives. Storage requirements and compliance with organic or eco-certifications were additional barriers. Some retailers also limited shelf space for premium biopesticide products, affecting visibility and sales
- Overcoming these challenges will require cost-efficient production, expanded distribution networks, and focused educational initiatives for farmers and agribusinesses. Collaboration with agricultural cooperatives, certification bodies, and technology providers can help unlock the long-term growth potential of the global biopesticides market. In addition, developing cost-competitive, highly effective formulations and strengthening marketing strategies around sustainability benefits will be essential for widespread adoption
North America Biopesticides Market Scope
The market is segmented on the basis of type, source, form, application, category, and crops.
- By Type
On the basis of type, the North America Biopesticides market is segmented into bioinsecticides, biofungicides, bionematicides, bioherbicides, and others. The bioinsecticides segment accounted for the largest market revenue share of 37.4% in 2025, primarily driven by their targeted action against pest species and minimal impact on non-target organisms. The increasing resistance of pests to conventional chemicals has led farmers to adopt bioinsecticides as a sustainable alternative. Moreover, regulatory support for eco-friendly crop protection solutions and the rising demand for organic produce further propel the dominance of this segment.
The bionematicides segment is expected to witness the fastest growth rate from 2026 to 2033, owing to the growing concerns over soil health and the adverse effects of synthetic nematicides. Bionematicides provide a safer alternative for root protection and are gaining popularity in integrated pest management (IPM) programs, especially in regions with intensive vegetable and fruit cultivation. Increasing awareness among farmers about sustainable farming practices and soil fertility maintenance is further driving this segment. In addition, supportive government initiatives promoting eco-friendly alternatives in agriculture are expected to boost market penetration for bionematicides.
- By Source
On the basis of source, the North America Biopesticides market is segmented into microbials, biochemical, and insects. The microbial segment dominated the market in 2025, due to the wide availability of microbial strains such as Bacillus thuringiensis and Trichoderma. These microbes are extensively used across diverse crop types due to their proven efficacy, ease of formulation, and compatibility with other crop inputs. Moreover, ongoing research is leading to the discovery of novel microbial strains that target specific pests and pathogens, enhancing product efficiency. The segment also benefits from strong distribution networks and increasing awareness among farmers about eco-friendly crop protection solutions.
The biochemical segment is expected to witness the fastest growth rate from 2026 to 2033, driven by increased usage of plant extracts and pheromones that offer unique pest-disrupting mechanisms without harming beneficial insects or pollinators. Innovations in extraction and stabilization techniques are enabling higher potency and longer-lasting efficacy of biochemical products. The rising trend of precision agriculture and integrated pest management (IPM) strategies is further supporting the adoption of biochemical biopesticides. In addition, regulatory bodies are providing favorable approvals for biochemical solutions, strengthening their market potential.
- By Form
On the basis of form, the North America biopesticides market is segmented into dry and liquid. The liquid form segment held the highest share in 2025, favored for its ease of application through various delivery systems such as foliar spray, fertigation, and soil drenching. Liquid formulations also offer faster absorption and better pest control efficacy under diverse environmental conditions. The segment is further supported by advancements in spraying technologies and automated irrigation systems that enhance precision and minimize product wastage. Growing farmer preference for ready-to-use formulations and high solubility products is also boosting the adoption of liquid biopesticides.
The dry segment is expected to witness the fastest growth rate from 2026 to 2033 due to its advantages in shelf-life stability, lower transportation cost, and suitability in seed treatment applications, especially in grain crops and pulses. Dry formulations are also easier to store and handle, reducing logistical challenges in remote farming regions. Increasing adoption of coating and granule-based delivery methods is improving the effectiveness of dry biopesticides. Furthermore, agricultural startups and seed companies are increasingly incorporating dry biopesticides into integrated crop protection solutions.
- By Application
On the basis of application, the North America biopesticides market is segmented into foliar application, fertigation, soil treatment, seed treatment, and others. The foliar application segment dominated the market with a major share in 2025, attributed to its effectiveness in immediate pest control and minimal environmental persistence. This method is commonly adopted in fruit and vegetable cultivation, where visible pest damage directly affects crop value. The segment benefits from the development of high-precision spraying equipment and automated drones that improve coverage and efficacy. In addition, research in formulation compatibility ensures foliar products do not damage crops or affect growth.
The seed treatment segment is expected to witness the fastest growth rate from 2026 to 2033, driven by increased awareness about early-stage crop protection, cost-effectiveness, and compatibility with sustainable farming practices. Seed treatments also provide long-term protection against soil-borne pathogens and pests, reducing the need for repeated chemical applications. Growing adoption of hybrid and genetically modified seeds further encourages integration with biopesticides. The segment is supported by partnerships between seed companies and biopesticide manufacturers to deliver pre-treated seeds to farmers.
- By Category
On the basis of category, the North America biopesticides market is segmented into agriculture and horticulture. The agriculture segment accounted for the largest market share in 2025, driven by the rising adoption of biopesticides in row crops such as cereals, grains, and pulses. Farmers are increasingly relying on biopesticides to meet regulatory standards and reduce chemical residue levels. In addition, large-scale farming operations are investing in biopesticide solutions to improve sustainability credentials and comply with export requirements. Agricultural extension services and government support programs are also promoting the use of biopesticides in conventional farming.
The horticulture segment is expected to witness the fastest growth rate from 2026 to 2033, particularly in greenhouse cultivation and high-value crops such as berries and leafy vegetables, where product quality and safety are critical. Precision application techniques and controlled-environment agriculture are supporting the efficient use of biopesticides in horticulture. Rising consumer demand for organic and pesticide-free fruits and vegetables is further propelling the adoption in this segment. Collaboration with horticultural technology providers is also enabling tailored biopesticide solutions.
- By Crops
On the basis of crops, the North America biopesticides market is segmented into fruits and vegetables, cereals and grains, oilseeds and pulses, turf and ornamentals, and other crops. The fruits and vegetables segment dominated the market in 2025, due to stringent export regulations regarding chemical residues and the growing demand for organic produce. In addition, high-value crops with sensitive quality standards benefit significantly from biopesticides, driving their preference over chemical alternatives. Awareness campaigns and government incentives for organic farming also support market growth in this crop category.
The turf and ornamentals segment is expected to witness the fastest growth rate from 2026 to 2033, particularly in developed regions where aesthetic plant health and eco-conscious landscaping practices are gaining traction. Biopesticides in this segment help manage pests while maintaining visual appeal and environmental safety. Increased adoption in golf courses, parks, and urban landscaping projects is driving growth. Technological advancements in application equipment and formulation stability further enhance market penetration in turf and ornamental crops.
North America Biopesticides Market Regional Analysis
- U.S. biopesticides market captured the largest revenue share in 2025, fueled by the increasing adoption of bioinsecticides, biofungicides, and bioherbicides across row crops, fruits, and vegetables
- Farmers are prioritizing sustainable pest management to comply with regulatory standards, reduce chemical residues, and meet consumer demand for organic produce
- The widespread adoption is supported by government incentives, robust R&D investments in novel biopesticide formulations, and strong collaborations between agrochemical companies and distributors
Canada Biopesticides Market Insight
The Canada biopesticides market is expected to witness the fastest growth rate from 2026 to 2033, driven by rising awareness of eco-friendly farming and the demand for high-quality organic crops. Farmers are increasingly incorporating microbial and biochemical biopesticides into integrated pest management programs to enhance yield and ensure environmental safety. Government policies promoting sustainable agriculture, coupled with expanding distribution networks and research initiatives for advanced biopesticide solutions, are further propelling market growth.
North America Biopesticides Market Share
The North America biopesticides industry is primarily led by well-established companies, including:
• Marrone Bio Innovations (U.S.)
• Certis USA LLC (U.S.)
• Valent BioSciences Corporation (U.S.)
• Island IPM (U.S.)
• BioWorks, Inc. (U.S.)
• AgBiTech (U.S.)
• Andermatt USA (U.S.)
• BioSafe Systems (U.S.)
• Novozymes Biologicals (U.S.)
• Lallemand Plant Care (U.S.)
• Gowan Company (U.S.)
• T. Stanes & Company (U.S.)
• Terramera Inc. (Canada)
• Nufarm Americas Inc (U.S.)
• Stockton Products (U.S.)
Latest Developments in North America Biopesticides Market
- In June 2025, BioWorks Inc. launched PRINCIPLE WP, a bioinsecticide formulated with Beauveria bassiana, targeting pests such as thrips, aphids, and whiteflies. Designed for greenhouse and field crops, this product provides U.S. and Canadian growers with an efficient, sustainable pest management solution, promoting eco-friendly agricultural practices and enhancing crop productivity
- In December 2024, UPL Corp (USA) introduced NIMAXXA, a microbial-based bionematicide seed treatment for soybeans and corn. The product offers triple benefits by suppressing nematodes, improving root health, and enhancing nutrient uptake, supporting sustainable farming initiatives and driving the adoption of biological crop protection solutions in the U.S. market
- In July 2024, Andermatt Group AG acquired BioTEPP Inc., a Canadian company known for its Virosoft CP4 granulovirus biopesticide targeting codling moths. This acquisition strengthens Andermatt’s presence in North America, expands its biological crop protection portfolio, and enables broader adoption of eco-friendly pest control solutions across key fruit crops
SKU-

- Interactive Data Analysis Dashboard
- Company Analysis Dashboard for high growth potential opportunities
- Research Analyst Access for customization & queries
- Competitor Analysis with Interactive dashboard
- Latest News, Updates & Trend analysis
- Harness the Power of Benchmark Analysis for Comprehensive Competitor Tracking
Data collection and base year analysis are done using data collection modules with large sample sizes. The stage includes obtaining market information or related data through various sources and strategies. It includes examining and planning all the data acquired from the past in advance. It likewise envelops the examination of information inconsistencies seen across different information sources. The market data is analysed and estimated using market statistical and coherent models. Also, market share analysis and key trend analysis are the major success factors in the market report. To know more, please request an analyst call or drop down your inquiry.
The key research methodology used by DBMR research team is data triangulation which involves data mining, analysis of the impact of data variables on the market and primary (industry expert) validation. Data models include Vendor Positioning Grid, Market Time Line Analysis, Market Overview and Guide, Company Positioning Grid, Patent Analysis, Pricing Analysis, Company Market Share Analysis, Standards of Measurement, Global versus Regional and Vendor Share Analysis. To know more about the research methodology, drop in an inquiry to speak to our industry experts.
Data Bridge Market Research is a leader in advanced formative research. We take pride in servicing our existing and new customers with data and analysis that match and suits their goal. The report can be customized to include price trend analysis of target brands understanding the market for additional countries (ask for the list of countries), clinical trial results data, literature review, refurbished market and product base analysis. Market analysis of target competitors can be analyzed from technology-based analysis to market portfolio strategies. We can add as many competitors that you require data about in the format and data style you are looking for. Our team of analysts can also provide you data in crude raw excel files pivot tables (Fact book) or can assist you in creating presentations from the data sets available in the report.


