North America Ready To Eat Food Market
Tamaño del mercado en miles de millones de dólares
Tasa de crecimiento anual compuesta (CAGR) :
% 
 USD
61.29 Billion
USD
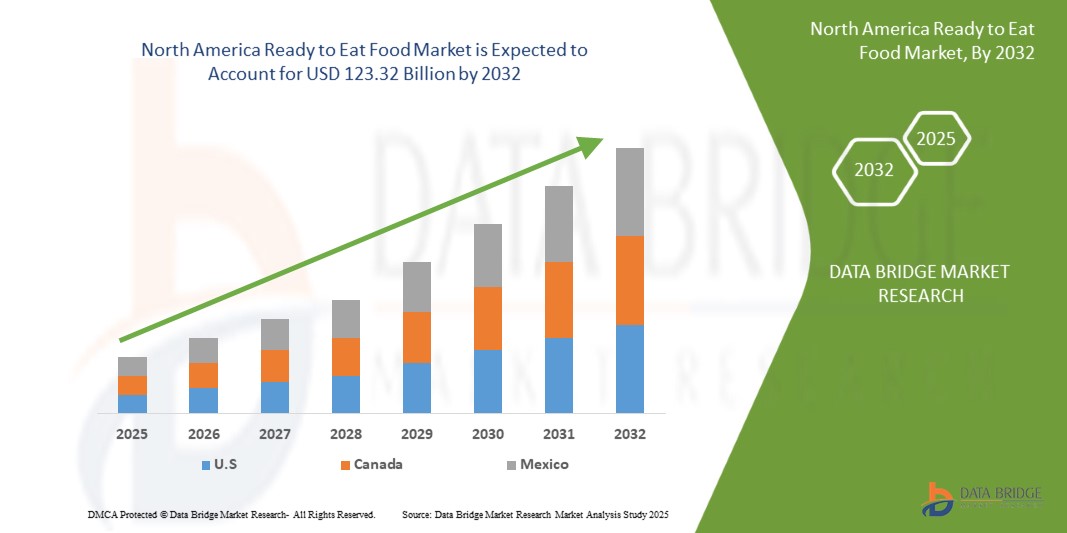
123.32 Billion
2024
2032
USD
61.29 Billion
USD
123.32 Billion
2024
2032
| 2025 –2032 | |
| USD 61.29 Billion | |
| USD 123.32 Billion | |
| % | |
|
Segmentación del mercado de alimentos listos para comer en Norteamérica, por tipo de producto (productos cárnicos, productos a base de cereales, productos lácteos, productos de panadería, dulces salados, productos de confitería, productos a base de vegetales, sopas instantáneas, refrigerios salados, alimentos refrigerados, refrigerios de carne a base de plantas y comidas listas para comer), categoría (convencional y especial), tipo de empaque (bolsas/sobres, latas, frascos y contenedores, botellas, cajas y otros), tamaño del empaque (menos de 250 gramos, 251-500 gramos, 501-750 gramos, 751-1000 gramos y más de 1000 gramos), tecnología de empaque (capturadores de oxígeno, control de humedad, antimicrobianos, indicadores de temperatura y tiempo y películas comestibles), tipo de almacenamiento (congelado/refrigerado, estable en almacenamiento, enlatado y otros), canal de distribución (canal basado en tienda y canal no basado en tienda), usuario final (industria alimentaria) Servicios, Hogares y Otros) – Tendencias de la Industria y Pronóstico hasta 2032
Análisis del mercado de alimentos listos para consumir en América del Norte
El mercado norteamericano de alimentos listos para consumir (RTE) crece de forma constante, impulsado por la creciente demanda de opciones de comida prácticas y que ahorren tiempo. La urbanización, los estilos de vida ajetreados y los cambios en los hábitos alimenticios son factores clave que influyen en este cambio. Las comidas congeladas, los snacks instantáneos y los productos envasados listos para consumir están ganando popularidad entre diversos grupos demográficos. Si bien Norteamérica y Europa lideran el mercado, Asia-Pacífico se perfila como un fuerte competidor debido al aumento de la renta disponible y la evolución de las preferencias alimentarias. Los consumidores preocupados por su salud buscan opciones orgánicas, sin conservantes y nutritivas. La innovación en envasado, sostenibilidad y calidad de los ingredientes está moldeando el futuro del mercado, a pesar de los desafíos de la cadena de suministro.
Tamaño del mercado de alimentos listos para comer de América del Norte
El tamaño del mercado de alimentos listos para comer de América del Norte se valoró en USD 61.29 mil millones en 2024 y se proyecta que alcance los USD 123.32 mil millones para 2032, con una CAGR del 9,26% durante el período de pronóstico de 2025 a 2032. Además de los conocimientos sobre escenarios de mercado como el valor de mercado, la tasa de crecimiento, la segmentación, la cobertura geográfica y los principales actores, los informes de mercado seleccionados por Data Bridge Market Research también incluyen un análisis experto en profundidad, análisis de precios, análisis de participación de marca, encuesta de consumidores, análisis demográfico, análisis de la cadena de suministro, análisis de la cadena de valor, descripción general de materias primas / consumibles, criterios de selección de proveedores, análisis PESTLE, análisis de Porter y marco regulatorio.
Tendencias del mercado de alimentos listos para consumir en América del Norte
“Aumento de las horas de trabajo y estilos de vida acelerados”
A medida que las personas se esfuerzan por equilibrar sus compromisos profesionales y personales, la demanda de opciones de comida convenientes ha aumentado. Según un informe de la Organización Internacional del Trabajo (OIT), la jornada laboral promedio en América del Norte ha aumentado aproximadamente un 8 % en la última década, lo que pone de manifiesto la creciente presión sobre la gestión del tiempo. En consecuencia, los consumidores optan por opciones de comida rápidas y sencillas que requieren una preparación mínima y ofrecen un ahorro de tiempo considerable.
El mercado de alimentos listos para comer se ha beneficiado enormemente de este cambio, ya que estos productos satisfacen las necesidades de las personas ocupadas que buscan comidas prácticas, nutritivas y de consumo inmediato. El ritmo de vida acelerado es particularmente frecuente en las poblaciones urbanas, donde las agendas apretadas limitan el tiempo para la preparación de comidas tradicionales. Esto ha impulsado a los fabricantes a innovar y a introducir una amplia gama de productos listos para comer que satisfacen diversas preferencias de sabor y necesidades dietéticas.
Además, el creciente número de hogares con doble ingreso ha contribuido a la expansión del mercado. En países como Estados Unidos y el Reino Unido, más del 60 % de los hogares tienen ahora a ambos miembros de la pareja trabajando, lo que deja menos tiempo para preparar comidas elaboradas. Este cambio demográfico ha provocado un aumento de la demanda de productos listos para consumir que se pueden consumir cómodamente en el trabajo, durante los desplazamientos o en casa después de largas jornadas laborales.
Por ejemplo,
- En marzo de 2023, la Organización Internacional del Trabajo (OIT) informó que Camboya trabajó un promedio de aproximadamente 2456 horas al año en 2017, lo que equivale a casi 47 horas semanales, la cifra más alta entre los 66 países estudiados. Esto indica una importante limitación de tiempo para la preparación de comidas, lo que impulsa la demanda de productos alimenticios listos para el consumo.
En países como México y la República Checa, los empleados suelen trabajar más de 2.000 horas al año, lo que genera una fuerte preferencia por opciones de comidas rápidas y sin complicaciones, incluidos productos listos para comer.
A medida que los estilos de vida ocupados se vuelven más frecuentes en todo el mundo, el mercado de alimentos listos para comer está preparado para un crecimiento sólido, impulsado por la necesidad inquebrantable de soluciones de comidas rápidas, accesibles y satisfactorias.
Alcance del informe y segmentación del mercado
|
Atributos |
Perspectivas clave del mercado de alimentos listos para consumir en América del Norte |
|
Segmentos cubiertos |
|
|
Países cubiertos |
Estados Unidos, Canadá y México |
|
Actores clave del mercado |
Mondelēz International, Inc. (EE. UU.), The Kraft Heinz Company (EE. UU.), General Mills Inc (EE. UU.), Nestlé (Suiza), Kellanova (EE. UU.), McCain Foods Limited (Canadá), Hormel Foods, LLC (EE. UU.), Unilever (Reino Unido), Lamb Weston, Inc. (EE. UU.), Simplot (EE. UU.), Tyson Foods, Inc. (EE. UU.), Nomad Foods (Inglaterra), Greencore Group plc (Irlanda), 2 Sisters Food Group (Inglaterra), ITC Limited (India), Agristo (Bélgica), Premier Foods plc (Reino Unido), Bakkavor Group plc (Reino Unido), The Hain Celestial Group, Inc. (EE. UU.), Orkla (Noruega), Farm Frites (Países Bajos), Haldiram's (India), Greenyard (Bélgica), Agrarfrost GmbH (Alemania), Regal Kitchen Foods (India), GODREJ AGROVET LTD. (India), Gitsfood.com (India), LIGHT MASS (Brasil), Koyara Food (India), Genie Food Group (India), Himalaya Food International Ltd. (India), Vimal Agro Products Pvt Ltd (India), Vechem Organics (P) Limited (India), Eateasy New (India), Sankalpfoods.com (India), CSC Brands LP (Canadá) y Priya Foods (Ushodaya Enterprises Pvt Ltd) (India). |
|
Oportunidades de mercado |
|
|
Conjuntos de información de datos de valor añadido |
Además de los conocimientos sobre escenarios de mercado, como valor de mercado, tasa de crecimiento, segmentación, cobertura geográfica y actores principales, los informes de mercado seleccionados por Data Bridge Market Research también incluyen análisis en profundidad de expertos, análisis de precios, análisis de participación de marca, encuesta de consumidores, análisis demográfico, análisis de la cadena de suministro, análisis de la cadena de valor, descripción general de materias primas/consumibles, criterios de selección de proveedores, análisis PESTLE, análisis de Porter y marco regulatorio. |
Definición del mercado de alimentos listos para comer de América del Norte
Los alimentos listos para consumir (RTE) se refieren a productos alimenticios precocinados, preenvasados y que requieren mínima o ninguna preparación adicional antes de su consumo. Estos alimentos están diseñados para la comodidad y se adaptan a estilos de vida ajetreados, ofreciendo soluciones de comidas rápidas y fáciles sin comprometer el sabor ni la calidad. Los alimentos RTE incluyen una amplia variedad de productos, como comidas congeladas, alimentos enlatados, productos refrigerados y refrigerados, y refrigerios envasados no perecederos. Se encuentran comúnmente en supermercados, hipermercados, tiendas de conveniencia y plataformas de venta minorista en línea. Los alimentos RTE son particularmente populares entre profesionales, estudiantes y consumidores urbanos que buscan opciones de comida que les ahorren tiempo.
Dinámica del mercado de alimentos listos para consumir en América del Norte
Conductores
- Aumento del ingreso disponible del consumidor y mayor poder adquisitivo
A medida que las economías continúan expandiéndose, los consumidores experimentan una mayor estabilidad financiera, lo que les permite gastar más en productos alimenticios prácticos y de alta calidad. Según el Banco Mundial, la renta disponible per cápita en América del Norte ha experimentado un crecimiento constante durante la última década, lo que permite a los consumidores explorar una mayor variedad de opciones alimentarias que ofrecen comodidad y calidad.
Este aumento de la renta disponible ha provocado un cambio en las preferencias de los consumidores hacia soluciones de comida rápida y sin complicaciones. A medida que más personas pueden permitirse comprar productos listos para comer premium y de mayor precio, los fabricantes están aprovechando esta tendencia ofreciendo opciones de comida diversas e innovadoras que satisfacen diversas preferencias dietéticas, incluyendo variedades orgánicas, sin gluten y de origen vegetal. El aumento de la renta disponible es particularmente evidente en economías emergentes como China, India y Brasil, donde la creciente clase media se inclina cada vez más por opciones de comida convenientes en medio de los ajetreados estilos de vida urbanos. Solo en China, la renta disponible promedio por hogar aumentó alrededor de un 5,3 % en 2024, en comparación con el 5,1 % del año anterior, lo que impulsó significativamente la demanda de productos listos para comer.
Por ejemplo,
- En febrero de 2025, un artículo de The Economic Times destacó que Adani Wilmar, conocida por marcas como el arroz Kohinoor y los aceites de cocina Fortune, anticipa un crecimiento del 10 % en el volumen de ventas para el próximo año fiscal. El director ejecutivo, Angshu Mallick, atribuye este crecimiento previsto al aumento del gasto urbano, impulsado por las reducciones del impuesto sobre la renta personal y la creciente demanda de aplicaciones de entrega rápida de comestibles.
- En 2023, el ingreso personal disponible en China aumentó a 7,2 mil dólares, frente a los 6,9 mil dólares de 2022. Durante el período de 1978 a 2023, el ingreso personal disponible en China promedió 1,97 mil dólares, alcanzando un máximo de 7,2 mil dólares en 2023 y un mínimo histórico de 0,048 mil dólares en 1978.
Además, el mayor poder adquisitivo ha animado a los consumidores a priorizar la calidad, el sabor y la nutrición, impulsando a los fabricantes a desarrollar ofertas de alimentos listos para consumir con valor añadido. A medida que la renta disponible continúa aumentando en Norteamérica, se prevé un auge del mercado de alimentos listos para consumir, impulsado por la disposición de los consumidores a invertir en soluciones de comida premium y prácticas.
- Canales de comercio minorista y electrónico en rápida expansión
Los fabricantes están aprovechando los formatos minoristas modernos y las soluciones de compra digital para aumentar la visibilidad y la accesibilidad de sus productos a medida que los consumidores los siguen adoptando. La creciente presencia de supermercados, hipermercados, tiendas de conveniencia y plataformas de alimentación en línea ha hecho que los productos alimenticios listos para consumir sean más accesibles, adaptándose al ritmo de vida acelerado de los consumidores urbanos.
El comercio electrónico, en particular, ha transformado el panorama del comercio minorista de alimentos al ofrecer la comodidad de comprar comidas listas para comer desde la comodidad del hogar. Actualmente, alrededor de 2.770 millones de personas en todo el mundo realizan compras en línea a través de plataformas de comercio electrónico especializadas o tiendas en redes sociales, lo que refleja una creciente preferencia por las compras en línea. Esta tendencia se ve impulsada por la creciente penetración de los teléfonos inteligentes y la mejora de la conectividad a internet, especialmente en las economías emergentes. Los gigantes del comercio minorista y las plataformas digitales están aprovechando esta oportunidad ampliando sus carteras de productos listos para comer, incluyendo comidas congeladas, refrigerios instantáneos y kits de comidas saludables. Las colaboraciones estratégicas entre fabricantes de alimentos y plataformas de comercio electrónico como Amazon, Walmart y actores regionales como BigBasket en India y JD.com en China han facilitado a los consumidores el acceso a una amplia variedad de opciones listas para comer con solo unos clics, lo que ha agilizado la distribución, reducido los plazos de entrega y mejorado la satisfacción del cliente. Además, la adopción de la venta minorista omnicanal (que integra las ventas físicas y digitales) ha demostrado ser muy eficaz para satisfacer las diversas demandas de los consumidores modernos.
Por ejemplo,
- Los resultados de SellersCommerce indican que, con más del 33 % de la población mundial comprando en línea, el comercio electrónico se ha convertido en una industria de 6,8 billones de dólares y se proyecta que alcance los 8 billones de dólares para 2027. Alrededor de 2770 millones de personas en todo el mundo realizan compras a través de plataformas de comercio electrónico especializadas o tiendas en redes sociales. China y Estados Unidos lideran las compras en línea, lo que genera grandes oportunidades para las marcas de alimentos listos para comer (RTE). Dado que los consumidores prefieren cada vez más las compras sin complicaciones, los productos listos para comer (RTE) están bien posicionados para prosperar.
- BigBasket, la plataforma líder de alimentación en línea de India, ha ampliado su catálogo de productos listos para consumir (RTE) para satisfacer la creciente demanda de opciones de comida práctica. Centrada en ofrecer productos frescos y de alta calidad, la empresa busca aprovechar la creciente preferencia de los consumidores por comidas rápidas y sin complicaciones. Esta estrategia permite a BigBasket capitalizar la creciente popularidad de los alimentos RTE en el mercado indio.
- En China, las tiendas Hema Fresh de Alibaba combinan la venta en línea y fuera de línea, lo que permite a los consumidores pedir comidas preparadas a través de una aplicación y recibirlas en 30 minutos. Hema reportó un aumento del 20% en sus ventas brutas en 2022.
Esta experiencia de compra fluida, sumada a atractivos descuentos y modelos de suscripción, ha convertido el comercio electrónico en el canal predilecto de los consumidores activos. Como resultado, los fabricantes se asocian cada vez más con plataformas en línea para ampliar su alcance, impulsando así el crecimiento y la innovación del mercado.
Oportunidades
- Creciente demanda de alimentos listos para consumir, de origen vegetal y veganos
La creciente conciencia sobre los beneficios para la salud, la sostenibilidad ambiental y las consideraciones éticas asociadas con las dietas basadas en plantas es una tendencia actual. A medida que más consumidores adoptan estilos de vida veganos o flexitarianos, la demanda de comidas prácticas y listas para comer que se ajusten a estas opciones continúa en aumento.
Los actores del mercado están capitalizando esta tendencia con el lanzamiento de productos listos para comer (RTE) innovadores, sabrosos y ricos en nutrientes, derivados de ingredientes vegetales. Según un informe del Good Food Institute, el sector de alimentos de origen vegetal ha experimentado un crecimiento de dos dígitos en los últimos años, impulsado por el creciente interés de los consumidores y la mayor disponibilidad de productos. Los principales fabricantes de alimentos y startups, por ejemplo, invierten cada vez más en soluciones de comidas veganas, desde curris y pastas vegetales hasta postres sin lácteos y ensaladas ricas en proteínas. Las redes sociales y las tendencias alimentarias impulsadas por influencers también han desempeñado un papel fundamental en la promoción de comidas veganas RTE, haciéndolas más populares y accesibles. Además, la expansión de los canales minoristas y de comercio electrónico ha impulsado aún más la visibilidad y el alcance de las ofertas de origen vegetal.
Por ejemplo,
- En noviembre de 2021, un estudio de NielsenIQ reveló que 2,7 millones de hogares en el Reino Unido tenían al menos un residente vegano o vegetariano. Además, 10,5 millones de hogares optaban por alternativas veganas o vegetarianas al menos una vez a la semana en lugar de comidas a base de carne. Entre los encuestados, el 40 % citó los beneficios para la salud como su motivación, mientras que el 31 % creía que era mejor para el planeta.
- En 2022, un estudio de Ipsos reveló que la creciente demanda de alimentos listos para consumir (LTE) de origen vegetal y veganos es evidente, ya que los consumidores buscan cada vez más opciones más saludables y sostenibles. Según un estudio de Ipsos, casi la mitad (46%) de los británicos de entre 16 y 75 años se plantea reducir el consumo de productos animales, y el 48% ya utiliza alternativas a la leche vegetal, como la de almendras, avena y coco. El mercado de LTE puede aprovechar esta tendencia ofreciendo soluciones de comidas prácticas, nutritivas y de origen vegetal.
- En la Encuesta Europea de Consumidores sobre Alimentos de Origen Vegetal de 2021, realizada por ProVeg International, se destacó que el Reino Unido lidera la compra y el consumo de productos de origen vegetal en Europa, incluyendo platos veganos preparados y comida para llevar. Dado que los consumidores priorizan cada vez más la salud y la sostenibilidad, el mercado de alimentos listos para comer (RTE) puede aprovechar esta tendencia ofreciendo opciones de comidas vegetales prácticas y variadas.
Dado que los consumidores preocupados por su salud buscan opciones alimentarias nutritivas y éticas, existe un amplio margen para que los fabricantes innoven y diversifiquen sus carteras de productos. La colaboración con proveedores de ingredientes de origen vegetal y la inversión en investigación y desarrollo pueden aumentar aún más el atractivo de los alimentos veganos listos para consumir (RTE). A medida que el mercado evoluciona, la adopción del movimiento de origen vegetal presenta una prometedora oportunidad de crecimiento sostenido y rentabilidad.
- Avances tecnológicos en el procesamiento y envasado de alimentos
Las innovaciones en los métodos de procesamiento, como el procesamiento a alta presión (HPP) y la esterilización térmica asistida por microondas (MATS), han permitido a los fabricantes prolongar la vida útil de los productos, preservando al mismo tiempo la frescura, el sabor y el valor nutricional. Estas técnicas de vanguardia satisfacen la demanda de los consumidores de productos mínimamente procesados y sin aditivos, sin comprometer la seguridad ni la calidad.
En el ámbito del envasado, la adopción de soluciones inteligentes y sostenibles está cobrando impulso. Las tecnologías de envasado activas e inteligentes, como los captadores de oxígeno y los indicadores de tiempo y temperatura, mejoran la seguridad del producto y mantienen la calidad a lo largo de la cadena de suministro. Además, la transición hacia materiales ecológicos, como envases biodegradables y reciclables, atrae a consumidores con conciencia ambiental, alineándose con los objetivos de sostenibilidad de Norteamérica. La automatización y la digitalización en el procesamiento de alimentos también están revolucionando la eficiencia de la producción. Los sistemas automatizados de clasificación, porcionado y control de calidad reducen los costes laborales y garantizan la consistencia, lo que permite a los fabricantes aumentar la producción manteniendo altos estándares. Asimismo, la maquinaria de envasado avanzada, con capacidades como el sellado al vacío y el envasado en atmósfera modificada (MAP), aumenta aún más el atractivo del producto al conservar la textura y el sabor durante más tiempo.
La integración de soluciones de trazabilidad, como la tecnología blockchain y los códigos QR en los envases, proporciona a los consumidores información en tiempo real sobre el origen del producto y el control de calidad. Esta transparencia genera confianza y mejora la fidelidad a la marca, haciendo que los productos listos para consumir sean más atractivos para los consumidores más exigentes.
Por ejemplo,
- Tetra Pak revolucionó el envasado de alimentos con su tecnología aséptica, que permite almacenar los productos sin refrigeración durante largos periodos, conservando su valor nutricional y sabor. Esta innovación ha sido fundamental para ampliar la distribución y la vida útil de los productos listos para consumir, especialmente en regiones con escasez de infraestructura para la cadena de frío.
- La esterilización térmica asistida por microondas (MATS) es una tecnología de vanguardia que combina agua caliente a presión y energía de microondas de onda larga para esterilizar productos alimenticios. A diferencia de la esterilización convencional en autoclave, MATS reduce significativamente el tiempo de procesamiento, minimizando la pérdida de nutrientes y preservando la calidad de los alimentos. Empresas líderes en Norteamérica como Eka North America están aprovechando esta innovación para mejorar sus soluciones de envasado, satisfaciendo así las necesidades cambiantes de la industria alimentaria.
- La tecnología de sensores inteligentes está revolucionando el control de calidad en el procesamiento de alimentos al proporcionar monitoreo en tiempo real de la temperatura, la humedad y los niveles de contaminación. Estos sensores detectan desviaciones al instante, lo que permite ajustes rápidos para mantener la calidad y seguridad del producto. El registro automatizado de datos garantiza la trazabilidad y el cumplimiento de las normas de seguridad alimentaria, lo que aumenta la fiabilidad y eficiencia de la producción.
Estos avances no solo mejoran el atractivo de los productos, sino que también abren nuevos mercados al abordar los desafíos logísticos, especialmente en zonas remotas. Como resultado, las innovaciones tecnológicas impulsan el crecimiento, permitiendo a los fabricantes satisfacer las cambiantes demandas de los consumidores y, al mismo tiempo, mantener la rentabilidad.
Restricciones/Desafíos
- Alto costo de los alimentos listos para comer (RTE) en comparación con las comidas caseras
Los consumidores, especialmente en regiones con precios sensibles, suelen encontrar los alimentos listos para comer considerablemente más caros que preparar comidas caseras. Esta disparidad de costos se puede atribuir a varios factores, como el uso de ingredientes de primera calidad, el envasado, el procesamiento y los gastos logísticos.
Según la Oficina de Estadísticas Laborales, el costo promedio de una comida casera en EE. UU. es de aproximadamente USD4 por porción, mientras que el costo de una sola comida lista para comer puede variar entre USD7 y USD15, dependiendo de la marca y los ingredientes utilizados. Esta brecha de precios dificulta que muchos consumidores, especialmente aquellos de ingresos medios y bajos, justifiquen la compra frecuente de productos listos para comer. Además, la percepción de que las comidas listas para comer ofrecen una menor relación calidad-precio en comparación con las comidas caseras recién preparadas limita aún más la penetración en el mercado. A medida que los consumidores se vuelven más conscientes de sus gastos, especialmente en medio de las incertidumbres económicas, tienden a preferir opciones de comida casera y económica. Además, las preferencias culturales por las comidas recién cocinadas en muchos países continúan influyendo en las decisiones de los consumidores, ya que las familias priorizan los platos caseros sobre las alternativas preenvasadas. Esta tendencia a optar por métodos de cocción tradicionales plantea un desafío para los fabricantes que buscan capturar una mayor participación en el mercado.
Por ejemplo,
- Un artículo del New York Times de enero de 2025 destacó cómo las personas ahorraron cantidades sustanciales anualmente al reducir su dependencia de la comida rápida y optar por comidas caseras. Una persona ahorró casi 11 000 dólares al año al optar por preparar comidas en casa en lugar de comprar opciones preparadas.
- En agosto de 2023, un estudio destacado por Real Plans indica que los kits de entrega de comidas pueden ser hasta tres veces más caros que comprar ingredientes en supermercados locales y preparar comidas en casa.
Advance Financial informó que el alto costo de los alimentos listos para consumir (RTE) en comparación con las comidas caseras sigue siendo una preocupación para muchos consumidores. En promedio, una comida casera cuesta entre USD 4 y USD 6 por persona, mientras que una comida de restaurante o RTE puede costar entre USD 15 y USD 20 o más. Esta significativa diferencia de precio, de al menos USD 10 por comida, puede acumularse rápidamente, especialmente para quienes compran con frecuencia.
El alto costo de los productos alimenticios listos para consumir (RTE) en comparación con las comidas caseras sigue siendo un obstáculo importante para el crecimiento del mercado. A medida que los consumidores priorizan cada vez más las opciones económicas y recién preparadas, el mercado enfrenta constantes limitaciones para lograr una aceptación generalizada, especialmente en regiones con precios sensibles.
- Intensa competencia en el mercado entre las principales marcas de alimentos y los actores regionales
Las grandes marcas multinacionales están aprovechando sus sólidas redes de distribución y su prestigio consolidado para mantener su dominio, mientras que los actores regionales aprovechan las preferencias locales y las ventajas de costes. Esta competencia obliga a los fabricantes a innovar y diferenciar sus ofertas de productos para captar la atención del consumidor. Las marcas invierten cada vez más en estrategias de marketing y diversificación de productos para destacar, introduciendo a menudo sabores únicos, ingredientes fortificados y fórmulas saludables. Sin embargo, mantener la competitividad en medio de estrategias de precios agresivas y campañas promocionales sigue siendo un reto importante. Los fabricantes más pequeños y regionales a menudo tienen dificultades para igualar las economías de escala de los gigantes del sector, lo que se traduce en márgenes de beneficio más reducidos. Además, la aparición de productos de marca blanca en las grandes cadenas minoristas está ejerciendo mayor presión sobre los productos de marca, ya que los consumidores optan cada vez más por alternativas asequibles sin comprometer la calidad.
Además, la evolución de las preferencias de los consumidores y la creciente popularidad de productos dietéticos de nicho, como las opciones vegetales y sin gluten, obligan a las marcas a adaptar y ampliar continuamente sus portafolios. Equilibrar la innovación de productos con la rentabilidad sigue siendo una tarea abrumadora, especialmente para las empresas pequeñas con recursos limitados.
Por ejemplo,
- En marzo de 2025, Reuters publicó un artículo que afirmaba que los consumidores se inclinaban cada vez más por marcas de alimentos más pequeñas e independientes, a menudo percibidas como productoras menos procesadas y más asequibles. Este cambio ha afectado a grandes conglomerados como Unilever y Procter & Gamble, cuya cuota de mercado ha disminuido a medida que los consumidores optan por alternativas como la mayonesa Duke's y la mayonesa Mike's Amazing en lugar de marcas tradicionales como Hellmann's.
- Un artículo de noviembre de 2022 de Dow Jones & Company, Inc. (WALL STREET JOURNAL) destacó que los minoristas están desarrollando cada vez más sus propios productos alimenticios listos para consumir (RTE) de marca blanca, ofreciendo a los consumidores alternativas rentables a las marcas establecidas. Esta estrategia no solo ofrece a los consumidores más opciones, sino que también intensifica la competencia, obligando a las grandes marcas a reevaluar sus precios y propuestas de valor.
En medio de esta intensa competencia, mantener la lealtad a la marca y sostener la rentabilidad se ha vuelto cada vez más difícil, ya que tanto los actores establecidos como los emergentes navegan en un panorama en rápida evolución con mayores expectativas de los consumidores.
Impacto y escenario actual del mercado ante la escasez de materias primas y los retrasos en los envíos
Data Bridge Market Research ofrece un análisis exhaustivo del mercado y proporciona información considerando el impacto y el entorno actual del mercado en la escasez de materias primas y los retrasos en los envíos. Esto se traduce en la evaluación de posibilidades estratégicas, la creación de planes de acción eficaces y la asistencia a las empresas en la toma de decisiones importantes.
Además del informe estándar, también ofrecemos un análisis en profundidad del nivel de adquisiciones a partir de retrasos de envío previstos, mapeo de distribuidores por región, análisis de productos básicos, análisis de producción, tendencias de mapeo de precios, abastecimiento, análisis del desempeño de categorías, soluciones de gestión de riesgos de la cadena de suministro, evaluación comparativa avanzada y otros servicios para adquisiciones y soporte estratégico.
Impacto esperado de la desaceleración económica en los precios y la disponibilidad de los productos
Cuando la actividad económica se desacelera, las industrias empiezan a verse afectadas. Los efectos previstos de la recesión económica en los precios y la accesibilidad de los productos se tienen en cuenta en los informes de análisis de mercado y los servicios de inteligencia que ofrece DBMR. Gracias a esto, nuestros clientes pueden, por lo general, adelantarse a sus competidores, proyectar sus ventas e ingresos, y estimar sus gastos de resultados.
Panorama del mercado de alimentos listos para consumir en América del Norte
El mercado está segmentado según el tipo de producto, la categoría, el tipo de empaque, el tamaño del empaque, la tecnología de empaque, el tipo de almacenamiento, el canal de distribución y el usuario final. El crecimiento de estos segmentos le permitirá analizar los segmentos con menor crecimiento en las industrias y brindar a los usuarios una valiosa visión general del mercado y perspectivas que les ayudarán a tomar decisiones estratégicas para identificar las principales aplicaciones del mercado.
Tipo de producto
- Productos cárnicos
- Productos a base de cereales
- Productos lácteos
- Productos de panadería
- Dulces Salados
- Productos de confitería
- Productos a base de vegetales
- Sopas instantáneas, bocadillos salados
- Alimentos refrigerados
- Snacks de carne a base de plantas
- Comidas listas para comer
Categoría
- Convencional
- Especialidad
Tipo de embalaje
- Bolsas/sobres
- Latas
- Frascos y contenedores
- Botellas
- Cajas
- Otros
Tamaño del embalaje
- Menos de 250 gramos
- 251-500 gramos
- 501-750 gramos
- 751-1000 gramos
- Más de 1000 gramos
Tecnología de embalaje
- Absorbedores de oxígeno
- Control de humedad
- Antimicrobianos
- Indicadores de temperatura y tiempo
- Películas comestibles
Tipo de fuente
- Congelado/Refrigerado
- Estable en almacenamiento
- Enlatado
- Otros
Canal de distribución
- Basado en la tienda
- Canal no basado en tienda
Usuario final
- Servicios de la industria alimentaria
- Hogares
- Otros
Análisis regional del mercado de alimentos listos para consumir en América del Norte
Se analiza el mercado y se proporcionan información sobre el tamaño del mercado y las tendencias por país, tipo de producto, categoría, tipo de embalaje, tamaño del embalaje, tecnología de embalaje, tipo de almacenamiento, canal de distribución y usuario final como se mencionó anteriormente.
Los países cubiertos en el mercado son Estados Unidos, Canadá y México.
Se espera que Estados Unidos domine el mercado de alimentos listos para consumir (RTE) debido a un estilo de vida acelerado, la alta demanda de conveniencia por parte de los consumidores y un alto poder adquisitivo. La tecnología avanzada de procesamiento de alimentos, una red minorista consolidada y la adopción generalizada del comercio electrónico impulsan aún más el crecimiento del mercado. La presencia de importantes marcas de alimentos, la innovación continua de productos y las crecientes tendencias saludables contribuyen a la expansión del mercado. Además, una sólida infraestructura de cadena de frío garantiza un almacenamiento y una distribución eficientes de productos RTE.
Se prevé que Estados Unidos sea el mercado de alimentos listos para consumir (RTE) con mayor crecimiento debido a la creciente demanda de conveniencia, los estilos de vida ajetreados y la preferencia por soluciones de comida rápida. La expansión de las cadenas de supermercados, los servicios de entrega de comida en línea y los avances tecnológicos en conservación de alimentos impulsan la expansión del mercado. Además, la creciente concienciación sobre la salud impulsa la demanda de opciones orgánicas, ricas en proteínas y de etiqueta limpia. La innovación continua de las principales marcas de alimentos y las tendencias de envasado sostenible impulsan aún más el crecimiento del mercado.
La sección de países del informe también presenta los factores que impactan el mercado individual y los cambios en la regulación del mercado nacional, los cuales impactan las tendencias actuales y futuras. Datos como el análisis de la cadena de valor aguas abajo y aguas arriba, las tendencias técnicas, el análisis de las cinco fuerzas de Porter y los estudios de caso son algunos de los indicadores utilizados para pronosticar el escenario del mercado en cada país. Además, se considera la presencia y disponibilidad de marcas norteamericanas y los desafíos que enfrentan debido a la alta o escasa competencia de marcas locales y nacionales, el impacto de los aranceles internos y las rutas comerciales, al proporcionar un análisis de pronóstico de los datos del país.
Cuota de mercado de alimentos listos para comer en América del Norte
El panorama competitivo del mercado proporciona detalles por competidores. Se incluye información general de la empresa, sus estados financieros, ingresos generados, potencial de mercado, inversión en investigación y desarrollo, nuevas iniciativas de mercado, presencia en Norteamérica, plantas de producción, capacidad de producción, fortalezas y debilidades de la empresa, lanzamiento de productos, alcance y variedad de productos, y dominio de las aplicaciones. Los datos anteriores se refieren únicamente al enfoque de mercado de las empresas.
Los líderes del mercado de alimentos listos para comer de América del Norte que operan en el mercado son:
- Lamb Weston (Estados Unidos)
- Simplot (EE. UU.)
- Haldiram (India)
- Patatas fritas de granja (Países Bajos)
- Greenyard (Bélgica)
- Agrarfrost GmbH (Alemania)
- Agristo (Bélgica)
- CSC Brands LP (Canadá)
- El Grupo Celestial Hain, Inc. (EE. UU.)
- Bakkavor Group plc (Reino Unido)
- McCain Foods Limited (Canadá)
- Premier Foods plc (Reino Unido)
- gitsfood.com (India)
- Nomad Foods (Reino Unido)
- General Mills (EE. UU.)
- Greencore Group plc (Irlanda)
- Orkla (Noruega)
- ITC Limited (India)
- Himalaya Food International Ltd. (India)
- Grupo Internacional Mondelēz (EE. UU.)
- Kraft Heinz (EE. UU.)
- Tyson Foods, Inc. (EE. UU.)
- Soluciones alimentarias de Unilever (Reino Unido)
- Nestlé (Suiza)
- Misa ligera (Brasil)
- Kellanova (EE. UU.)
- Hormel Foods, LLC. (EE. UU.)
- Comida Koyara (India)
- Priya Foods (India)
- Grupo de alimentos Genie (India)
- Vechem Organics (P) Limited (India)
- Vimal Agro Products Pvt Ltd (India)
- sankalpfoods.com (India)
- Alimentos de cocina real (India)
- Eateasy nuevo (India)
- GODREJ AGROVET LTD. (India)
- 2 Sisters Food Group (Reino Unido)
Últimos avances en el mercado de alimentos listos para consumir en América del Norte
- En enero de 2025, OREO inicia el año con el lanzamiento de seis nuevos y emocionantes sabores, incluyendo ediciones limitadas y productos permanentes. Entre los sabores más destacados se encuentran las galletas OREO Game Day, con relieves inspirados en el fútbol americano, perfectas para los días de partido y las fiestas para ver el partido. Las nuevas galletas OREO Loaded, disponibles permanentemente, ofrecen crema Mega Stuf rellena con trocitos de OREO. Otras novedades permanentes incluyen las OREO Cakesters Doradas, las OREO Irish Creme THINS y las OREO Minis Peanut Butter. Las OREO Cakesters Doradas son pastelitos dorados rellenos de crema, las OREO Irish Creme THINS ofrecen un toque de crema irlandesa, y las OREO Minis Peanut Butter combinan galletas de chocolate con una suave crema de mantequilla de cacahuete. Además, las galletas OREO congeladas completan la nueva y emocionante línea de productos.
- En septiembre de 2024, la alianza entre OREO y Coca-Cola presenta una divertida y emocionante colaboración llamada "Besties", que celebra el vínculo único de la amistad. Las marcas se han unido para ofrecer dos productos por tiempo limitado: la galleta sándwich OREO Coca-Cola y la Coca-Cola OREO Zero Azúcar Edición Limitada. Ambas presentan diseños y empaques distintivos, que combinan los elementos icónicos de ambas marcas. La galleta sándwich OREO Coca-Cola combina una base de chocolate con un sabor inspirado en Coca-Cola y crema blanca con purpurina comestible roja, mientras que la Coca-Cola OREO Zero Azúcar ofrece un refrescante sabor a Coca-Cola con toques de OREO. La colaboración busca unir a los fans, crear nuevas experiencias y celebrar la conexión y la unión de una manera divertida e inesperada.
- En abril de 2024, los traviesos SOUR PATCH KIDS se unieron a OREO para una divertida e inesperada colaboración, presentando las galletas OREO SOUR PATCH KIDS de edición limitada. Estas galletas contienen Golden OREO con sabor a SOUR PATCH KIDS, con inclusiones coloridas y un relleno de crema con azúcar ácida multicolor para una experiencia agridulce. Junto con las galletas, las marcas lanzarán una línea de merchandising exclusiva, que incluye una camiseta de cuello redondo, pantalones deportivos, un sombrero de pescador, una bandolera, pinzas para el pelo y calcetines. La colección celebra el espíritu lúdico de ambas marcas, ofreciendo a los fans la oportunidad de disfrutar de la mejor combinación agridulce con artículos de OREO y SOUR PATCH KIDS de edición limitada.
- En febrero de 2023, Mondelēz International dio un paso significativo hacia su objetivo de cero emisiones netas de gases de efecto invernadero para 2050 al anunciar una importante inversión en energía renovable procedente de plantas fotovoltaicas en Polonia. La compañía firmó un Acuerdo de Compra de Energía Virtual (PPA) de 12 años con GoldenPeaks Capital, que suministrará alrededor de 126 gigavatios hora de electricidad renovable al año, procedente de diversas plantas de energía solar en Polonia. Se espera que este acuerdo ahorre más de un millón de toneladas métricas de CO2 y compense la huella de carbono relacionada con la electricidad de ocho plantas de Mondelēz en Polonia. El inicio de la producción de energía está previsto para marzo de 2023, lo que marca un hito importante en el compromiso de Mondelēz con la sostenibilidad y la reducción de su huella de emisiones. Esta colaboración ejemplifica la dedicación de la compañía a construir un futuro más sostenible, a la vez que continúa ofreciendo sus apreciados productos, como Milka, Prince Polo y Delicje.
- En febrero de 2025, Capri Sun lanzó su primera botella resellable en más de 20 años, ofreciendo una nueva y cómoda forma de disfrutar de sus icónicos sabores para llevar a todos los públicos. Las botellas de 355 ml, disponibles en Fruit Punch, Pacific Cooler y Strawberry Kiwi, contienen el equivalente a dos sobres y están elaboradas con ingredientes totalmente naturales, sin colorantes ni edulcorantes artificiales. Este lanzamiento responde a la demanda de porciones más grandes y está diseñado para satisfacer las necesidades de las familias ocupadas, especialmente en tiendas de conveniencia donde Capri Sun tenía una disponibilidad limitada. Esta iniciativa amplía el portafolio de Capri Sun, basándose en el éxito de innovaciones anteriores como las jarras Capri Sun Multi-Serve, y refuerza el compromiso de la marca de evolucionar con las preferencias del consumidor.
SKU-
Obtenga acceso en línea al informe sobre la primera nube de inteligencia de mercado del mundo

- Panel de análisis de datos interactivo
- Panel de análisis de empresas para oportunidades con alto potencial de crecimiento
- Acceso de analista de investigación para personalización y consultas
- Análisis de la competencia con panel interactivo
- Últimas noticias, actualizaciones y análisis de tendencias
- Aproveche el poder del análisis de referencia para un seguimiento integral de la competencia
Tabla de contenido
1 INTRODUCCIÓN
1.1 OBJETIVOS DEL ESTUDIO
1.2 DEFINICIÓN DE MERCADO
1.3 INFORMACIÓN GENERAL
1.4 LIMITACIONES
1.5 MERCADOS CUBIERTOS
2 SEGMENTACIÓN DEL MERCADO
2.1 MERCADOS CUBIERTOS
2.2 ÁMBITO GEOGRÁFICO
2,3 AÑOS CONSIDERADOS PARA EL ESTUDIO
2.4 MONEDA Y PRECIOS
2.5 MODELO DE VALIDACIÓN DE DATOS TRÍPODE DBMR
2.6 MODELADO MULTIVARIADO
2.7 ENTREVISTAS PRINCIPALES CON LÍDERES DE OPINIÓN CLAVE
2.8 CUADRÍCULA DE POSICIÓN DE MERCADO DBMR
2.9 CUADRÍCULA DE COBERTURA DE APLICACIONES DEL MERCADO
2.1 ANÁLISIS DE PARTICIPACIÓN DE PROVEEDORES DE DBMR
2.11 FUENTES SECUNDARIAS
2.12 SUPUESTOS
3 RESUMEN EJECUTIVO
4 INFORMACIÓN PREMIUM
4.1 LAS CINCO FUERZAS DE PORTER
4.1.1 AMENAZA DE NUEVOS ENTRANTES
4.1.2 AMENAZA DE SUSTITUTOS
4.1.3 PODER DE NEGOCIACIÓN DE LOS COMPRADORES
4.1.4 PODER DE NEGOCIACIÓN DE LOS PROVEEDORES
4.1.5 RIVALIDAD COMPETITIVA
4.2 ESCENARIO DE IMPORTACIÓN Y EXPORTACIÓN
4.3 ANÁLISIS DE LA CADENA DE VALOR
4.3.1 ABASTECIMIENTO DE MATERIA PRIMA
4.3.2 PROCESAMIENTO Y FABRICACIÓN DE ALIMENTOS
4.3.3 EMBALAJE Y ALMACENAMIENTO
4.3.4 DISTRIBUCIÓN Y LOGÍSTICA
4.3.5 MARKETING Y VENTA MINORISTA
4.3.6 CONCLUSIÓN
4.4 FACTORES CLAVE QUE INFLUYEN EN LA DECISIÓN DE COMPRA DE LOS USUARIOS FINALES
4.4.1 COMODIDAD Y AHORRO DE TIEMPO
4.4.2 CONCIENCIACIÓN SOBRE SALUD Y NUTRICIÓN
4.4.3 SENSIBILIDAD AL PRECIO Y FACTORES ECONÓMICOS
4.4.4 REPUTACIÓN DE MARCA Y CONFIANZA
4.4.5 EMBALAJE Y PRESENTACIÓN DEL PRODUCTO
4.4.6 INFLUENCIA DIGITAL Y VENTA MINORISTA EN LÍNEA
4.4.7 PREFERENCIAS CULTURALES Y REGIONALES
4.4.8 SOSTENIBILIDAD Y CONSIDERACIONES ÉTICAS
4.5 ESTRATEGIAS DE CRECIMIENTO ADOPTADAS POR LOS ACTORES CLAVE DEL MERCADO
4.5.1 INNOVACIÓN Y DIVERSIFICACIÓN DE PRODUCTOS
4.5.2 ADQUISICIONES ESTRATÉGICAS
4.5.3 EXPANSIÓN INTERNACIONAL
4.5.4 AVANCES TECNOLÓGICOS
4.6 TENDENCIAS DE LA INDUSTRIA Y PERSPECTIVA FUTURA
4.6.1 TENDENCIAS DE LA INDUSTRIA
4.6.1.1 CRECIENTE DEMANDA DE CONVENIENCIA POR PARTE DE LOS CONSUMIDORES
4.6.1.2 AUMENTO DE LA POPULARIDAD DE LOS ALIMENTOS RTE SALUDABLES Y NUTRITIVOS
4.6.1.3 INNOVACIONES EN ENVASES PARA UNA VIDA ÚTIL MÁS LARGA
4.6.1.4 EXPANSIÓN DE LOS SEGMENTOS DE CONGELADOS Y REFRIGERADOS RTE
4.6.1.5 AUGE DE OPCIONES DE PROTEÍNAS VEGETALES Y ALTERNATIVAS
4.6.1.6 DIGITALIZACIÓN Y CRECIMIENTO DEL COMERCIO ELECTRÓNICO
4.6.1.7 ENFOQUE EN LA ETIQUETA LIMPIA Y LA TRANSPARENCIA
4.6.2 PERSPECTIVA FUTURA
4.6.2.1 AVANCES TECNOLÓGICOS EN EL PROCESAMIENTO DE ALIMENTOS
4.6.2.2 OPCIONES ALIMENTARIAS SOSTENIBLES Y ÉTICAS
4.6.2.3 PERSONALIZACIÓN EN COMIDAS RTE
4.6.2.4 DESAFÍOS REGULATORIOS Y DE CUMPLIMIENTO
4.7 PANORAMA GENERAL DE LAS INNOVACIONES TECNOLÓGICAS
4.7.1 TECNOLOGÍAS AVANZADAS DE PROCESAMIENTO DE ALIMENTOS
4.7.2 EMBALAJES INTELIGENTES Y MATERIALES SOSTENIBLES
4.7.3 AUTOMATIZACIÓN Y ROBÓTICA EN LA PRODUCCIÓN DE ALIMENTOS
4.7.4 MEJORA NUTRICIONAL E INGREDIENTES FUNCIONALES
4.7.5 IA Y BIG DATA PARA LA PERSONALIZACIÓN Y LA OPTIMIZACIÓN DE LA CADENA DE SUMINISTRO
4.7.6 IMPRESIÓN Y PERSONALIZACIÓN DE ALIMENTOS EN 3D
4.7.7 COMERCIO ELECTRÓNICO, COCINAS EN LA NUBE E INNOVACIONES EN LA ENTREGA DE ÚLTIMA MILLA
4.7.8 CONCLUSIÓN
4.8 COBERTURA DE MATERIA PRIMA
4.8.1 PROTEÍNAS (CARNE, AVES Y PROTEÍNAS DE ORIGEN VEGETAL)
4.8.2 GRANOS Y CARBOHIDRATOS
4.8.3 VERDURAS Y FRUTAS
4.8.4 CONSERVANTES Y ADITIVOS
4.8.5 TENDENCIAS EMERGENTES Y FUTURAS OPORTUNIDADES DE ABASTECIMIENTO
4.8.6 CONCLUSIÓN
4.9 ANÁLISIS DE LA CADENA DE SUMINISTRO
4.9.1 ABASTECIMIENTO Y ADQUISICIÓN DE MATERIA PRIMA
4.9.2 PROCESAMIENTO Y FABRICACIÓN
4.9.3 GESTIÓN DE ALMACENAMIENTO E INVENTARIO
4.9.4 DISTRIBUCIÓN Y LOGÍSTICA
4.9.5 ACCESO AL POR MENOR Y AL CONSUMIDOR
4.9.6 DESAFÍOS EN LA CADENA DE SUMINISTRO DE ALIMENTOS LISTA PARA COMER
4.9.7 TENDENCIAS E INNOVACIONES FUTURAS
4.9.8 CONCLUSIÓN
4.1 ANÁLISIS DE PRECIOS
4.11 CAPACIDAD DE PRODUCCIÓN DE LOS FABRICANTES CLAVE
4.12 PERSPECTIVA DE LA MARCA
4.12.1 ANÁLISIS COMPARATIVO DE MARCAS
4.12.2 RESUMEN DEL PRODUCTO VS. MARCA
4.12.2.1 DESCRIPCIÓN GENERAL DEL PRODUCTO
4.12.2.2 DESCRIPCIÓN GENERAL DE LA MARCA
4.12.2.3 CONCLUSIÓN
5 MARCO REGULADOR Y DIRECTRICES
6 PANORAMA GENERAL DEL MERCADO
6.1 CONDUCTORES
6.1.1 AUMENTO DE LAS HORAS DE TRABAJO Y ESTILOS DE VIDA ACELERADOS
6.1.2 AUMENTO DE LA RENTA DISPONIBLE DEL CONSUMIDOR Y MAYOR PODER ADQUISITIVO
6.1.3 CANALES DE COMERCIO MINORISTA Y ELECTRÓNICO EN RÁPIDA EXPANSIÓN
6.1.4 AUMENTO DE LA DEMANDA DE ALIMENTOS SALUDABLES, ORGÁNICOS Y ENRIQUECIDOS LISTOS PARA CONSUMIR
6.2 RESTRICCIONES
6.2.1 PREOCUPACIONES DE SALUD RELACIONADAS CON LOS ALIMENTOS PROCESADOS
6.2.2 ALTO COSTO DE LOS ALIMENTOS LISTOS PARA COMER (RTE) EN COMPARACIÓN CON LAS COMIDAS CASERAS
6.3 OPORTUNIDADES
6.3.1 AUMENTO DE LA DEMANDA DE ALIMENTOS LISTOS PARA CONSUMIR, DE ORIGEN VEGETAL Y VEGANOS
6.3.2 AVANCES TECNOLÓGICOS EN EL PROCESAMIENTO Y ENVASADO DE ALIMENTOS
6.3.3 PERSONALIZACIÓN Y PERSONALIZACIÓN DE ALIMENTOS LISTOS PARA CONSUMIR
6.4 DESAFÍOS
6.4.1 INTENSA COMPETENCIA DE MERCADO ENTRE LAS PRINCIPALES MARCAS DE ALIMENTOS Y LOS ACTORES REGIONALES
6.4.2 PERCEPCIÓN DEL CONSUMIDOR DE LOS INGREDIENTES Y SABORES ARTIFICIALES EN ALIMENTOS LISTOS PARA EL CONSUMO
7 MERCADO DE ALIMENTOS LISTOS PARA COMER EN AMÉRICA DEL NORTE, POR TIPO DE PRODUCTO
7.1 INFORMACIÓN GENERAL
7.2 PRODUCTOS CÁRNICOS
7.3 PRODUCTOS A BASE DE CEREALES
7.4 PRODUCTOS LÁCTEOS
7.5 PRODUCTOS DE PANADERÍA
7.6 POSTRES SALADOS
7.7 PRODUCTOS DE CONFITERÍA
7.8 PRODUCTOS A BASE DE VEGETALES
7.9 SOPAS INSTANTÁNEAS
7.1 APERITIVOS SALADOS
7.11 ALIMENTOS REFRIGERADOS
7.12 SNACKS DE CARNE DE ORIGEN VEGETAL
7.13 COMIDAS LISTAS PARA COMER
8 MERCADO DE ALIMENTOS LISTOS PARA COMER DE AMÉRICA DEL NORTE, POR CATEGORÍA
8.1 DESCRIPCIÓN GENERAL
8.2 CONVENCIONAL
8.3 ESPECIALIDAD
9 MERCADO DE ALIMENTOS LISTOS PARA COMER EN AMÉRICA DEL NORTE, POR TIPO DE ENVASE
9.1 INFORMACIÓN GENERAL
9.2 BOLSAS/SOBRES
9.3 LATAS
9.4 FRASCOS Y RECIPIENTES
9.5 BOTELLAS
9.6 CAJAS
9.7 OTROS
10 MERCADO DE ALIMENTOS LISTOS PARA COMER EN AMÉRICA DEL NORTE, POR TAMAÑO DE ENVASE
10.1 INFORMACIÓN GENERAL
10.2 MENOS DE 250 GRAMOS
10.3 251-500 GRAMOS
10.4 501-750 GRAMOS
10.5 751-1000 GRAMOS
10.6 MÁS DE 1000 GRAMOS
11 MERCADO DE ALIMENTOS LISTOS PARA COMER EN AMÉRICA DEL NORTE, MEDIANTE TECNOLOGÍA DE ENVASADO
11.1 INFORMACIÓN GENERAL
11.2 RECOGEDORES DE OXÍGENO
11.3 CONTROL DE HUMEDAD
11.4 ANTIMICROBIANOS
11.5 INDICADORES DE TEMPERATURA Y TIEMPO
11.6 PELÍCULAS COMESTIBLES
12 MERCADO DE ALIMENTOS LISTOS PARA COMER EN AMÉRICA DEL NORTE, POR TIPO DE ALMACENAMIENTO
12.1 DESCRIPCIÓN GENERAL
12.2 CONGELADOS/REFRIGERADOS
12.3 ESTABLE
12.4 ENLATADOS
12.5 OTROS
13 MERCADO DE ALIMENTOS LISTO PARA COMER DE AMÉRICA DEL NORTE, POR CANAL DE DISTRIBUCIÓN
13.1 INFORMACIÓN GENERAL
13.2 BASADO EN TIENDA
13.3 SIN TIENDA
14 MERCADO DE ALIMENTOS LISTOS PARA COMER EN AMÉRICA DEL NORTE, POR USUARIO FINAL
14.1 INFORMACIÓN GENERAL
14.2 SERVICIOS DE LA INDUSTRIA ALIMENTARIA
14.3 HOGARES
14.4 OTROS
15 MERCADO DE ALIMENTOS LISTOS PARA COMER EN AMÉRICA DEL NORTE, POR REGIÓN
15.1 AMÉRICA DEL NORTE
15.1.1 EE. UU.
15.1.2 CANADÁ
15.1.3 MÉXICO
16 MERCADO DE ALIMENTOS LISTOS PARA COMER DE AMÉRICA DEL NORTE: PANORAMA DE LA EMPRESA
16.1 ANÁLISIS DE LAS ACCIONES DE LA EMPRESA: GLOBAL
17 ANÁLISIS FODA
18 PERFILES DE EMPRESAS
18.1 MONDELĒZ INTERNATIONAL, INC.
18.1.1 INSTANTÁNEA DE LA EMPRESA
18.1.2 INFORMACIÓN FINANCIERA RECIENTE
18.1.3 ANÁLISIS DE LAS ACCIONES DE LA EMPRESA
18.1.4 PORTAFOLIO DE PRODUCTOS
18.1.5 DESARROLLO RECIENTE
18.2 LA COMPAÑÍA KRAFT HEINZ
18.2.1 INSTANTÁNEA DE LA EMPRESA
18.2.2 INFORMACIÓN FINANCIERA RECIENTE
18.2.3 ANÁLISIS DE LAS ACCIONES DE LA EMPRESA
18.2.4 PORTAFOLIO DE PRODUCTOS
18.2.5 DESARROLLO RECIENTE
18.3 GENERAL MILLS INC
18.3.1 INSTANTÁNEA DE LA EMPRESA
18.3.2 INFORMACIÓN FINANCIERA RECIENTE
18.3.3 ANÁLISIS DE LAS ACCIONES DE LA EMPRESA
18.3.4 PORTAFOLIO DE PRODUCTOS
18.3.5 DESARROLLO RECIENTE
18.4 NESTLÉ
18.4.1 INSTANTÁNEA DE LA EMPRESA
18.4.2 ANÁLISIS DE INGRESOS
18.4.3 ANÁLISIS DE LAS ACCIONES DE LA EMPRESA
18.4.4 PORTAFOLIO DE PRODUCTOS
18.4.5 DESARROLLOS RECIENTES
18.5 KELLANOVA
18.5.1 INSTANTÁNEA DE LA EMPRESA
18.5.2 ANÁLISIS DE INGRESOS
18.5.3 ANÁLISIS DE LAS ACCIONES DE LA EMPRESA
18.5.4 PORTAFOLIO DE PRODUCTOS
18.5.5 DESARROLLO RECIENTE
18.6 AGRISTO
18.6.1 INSTANTÁNEA DE LA EMPRESA
18.6.2 PORTAFOLIO DE PRODUCTOS
18.6.3 DESARROLLO RECIENTE
18.7 GRUPO DE ALIMENTOS 2 HERMANAS
18.7.1 INSTANTÁNEA DE LA EMPRESA
18.7.2 PORTAFOLIO DE PRODUCTOS
18.7.3 NOTICIAS RECIENTES
18.8 AGRARFROST GMBH
18.8.1 INSTANTÁNEA DE LA EMPRESA
18.8.2 PORTAFOLIO DE PRODUCTOS
18.8.3 DESARROLLO RECIENTE
18.9 GRUPO BAKKAVOR PLC
18.9.1 INSTANTÁNEA DE LA EMPRESA
18.9.2 INFORMACIÓN FINANCIERA RECIENTE
18.9.3 PORTAFOLIO DE PRODUCTOS
18.9.4 DESARROLLO RECIENTE
18.1 CSC BRANDS LP
18.10.1 INSTANTÁNEA DE LA EMPRESA
18.10.2 PORTAFOLIO DE PRODUCTOS
18.10.3 DESARROLLO RECIENTE
18.11 EATEASY NUEVO.
18.11.1 INSTANTÁNEA DE LA EMPRESA
18.11.2 PORTAFOLIO DE PRODUCTOS
18.11.3 DESARROLLO RECIENTE
18.12 PAPAS FRITAS DE GRANJA
18.12.1 INSTANTÁNEA DE LA EMPRESA
18.12.2 PORTAFOLIO DE PRODUCTOS
18.12.3 DESARROLLO RECIENTE
18.13 GRUPO DE ALIMENTOS GENIE
18.13.1 INSTANTÁNEA DE LA EMPRESA
18.13.2 PORTAFOLIO DE PRODUCTOS
18.13.3 DESARROLLO RECIENTE
18.14 GITSFOOD.COM
18.14.1 INSTANTÁNEA DE LA EMPRESA
18.14.2 PORTAFOLIO DE PRODUCTOS
18.14.3 DESARROLLO RECIENTE
18.15 GODREJ AGROVET LIMITADA
18.15.1 INSTANTÁNEA DE LA EMPRESA
18.15.2 ANÁLISIS DE INGRESOS
18.15.3 PORTAFOLIO DE PRODUCTOS
18.15.4 DESARROLLO RECIENTE
18.16 GRUPO GREENCORE PLC
18.16.1 INSTANTÁNEA DE LA EMPRESA
18.16.2 INFORMACIÓN FINANCIERA RECIENTE
18.16.3 PORTAFOLIO DE PRODUCTOS
18.16.4 TIPO DE NOTICIAS
18.17 VERDEO
18.17.1 INSTANTÁNEA DE LA EMPRESA
18.17.2 ANÁLISIS DE INGRESOS
18.17.3 PORTAFOLIO DE PRODUCTOS
18.17.4 DESARROLLO RECIENTE
18.18 HALDIRAM'S
18.18.1 INSTANTÁNEAS DE LA EMPRESA
18.18.2 PORTAFOLIO DE PRODUCTOS
18.18.3 DESARROLLO RECIENTE
18.19 HIMALAYA FOOD INTERNATIONAL LTD.
18.19.1 INSTANTÁNEA DE LA EMPRESA
18.19.2 ANÁLISIS DE INGRESOS
18.19.3 PORTAFOLIO DE PRODUCTOS
18.19.4 DESARROLLO RECIENTE
18.2 CORPORACIÓN HORMEL FOODS.
18.20.1 INSTANTÁNEA DE LA EMPRESA
18.20.2 ANÁLISIS DE INGRESOS
18.20.3 PORTAFOLIO DE PRODUCTOS
18.20.4 DESARROLLO RECIENTE
18.21 ITC LIMITADA
18.21.1 INSTANTÁNEA DE LA EMPRESA
18.21.2 ANÁLISIS DE INGRESOS
18.21.3 PORTAFOLIO DE PRODUCTOS
18.21.4 DESARROLLOS RECIENTES
18.22 ALIMENTOS KOYARA
18.22.1 INSTANTÁNEA DE LA EMPRESA
18.22.2 PORTAFOLIO DE PRODUCTOS
18.22.3 DESARROLLO RECIENTE
18.23 CORDERO WESTON, INC.
18.23.1 INSTANTÁNEA DE LA EMPRESA
18.23.2 ANÁLISIS DE INGRESOS
18.23.3 PORTAFOLIO DE PRODUCTOS
18.23.4 DESARROLLO RECIENTE
18.24 MISA LIGERA
18.24.1 INSTANTÁNEA DE LA EMPRESA
18.24.2 PORTAFOLIO DE PRODUCTOS
18.24.3 DESARROLLO RECIENTE
18.25 MCCAIN FOODS LIMITADA
18.25.1 INSTANTÁNEA DE LA EMPRESA
18.25.2 PORTAFOLIO DE PRODUCTOS
18.25.3 DESARROLLO RECIENTE
18.26 COMIDAS NÓMADAS
18.26.1 INSTANTÁNEA DE LA EMPRESA
18.26.2 INFORMACIÓN FINANCIERA RECIENTE
18.26.3 PORTAFOLIO DE PRODUCTOS
18.26.4 DESARROLLO RECIENTE
18.27 ORKLA
18.27.1 INSTANTÁNEA DE LA EMPRESA
18.27.2 INFORMACIÓN FINANCIERA RECIENTE
18.27.3 PORTAFOLIO DE PRODUCTOS
18.27.4 DESARROLLO RECIENTE
18.28 PREMIER FOODS PLC
18.28.1 INSTANTÁNEA DE LA EMPRESA
18.28.2 INFORMACIÓN FINANCIERA RECIENTE
18.28.3 PORTAFOLIO DE PRODUCTOS
18.28.4 DESARROLLO RECIENTE
18.29 ALIMENTOS PRIYA
18.29.1 INSTANTÁNEA DE LA EMPRESA
18.29.2 PORTAFOLIO DE PRODUCTOS
18.29.3 DESARROLLO RECIENTE
18.3 ALIMENTOS DE COCINA REGAL
18.30.1 INSTANTÁNEA DE LA EMPRESA
18.30.2 PORTAFOLIO DE PRODUCTOS
18.30.3 DESARROLLO RECIENTE
18.31 SANKALPFOODS.COM
18.31.1 INSTANTÁNEA DE LA EMPRESA
18.31.2 PORTAFOLIO DE PRODUCTOS
18.31.3 DESARROLLO RECIENTE/TIPO DE NOTICIAS
18.32 COMPAÑÍA JR SIMPLOT.
18.32.1 INSTANTÁNEA DE LA EMPRESA
18.32.2 PORTAFOLIO DE PRODUCTOS
18.32.3 DESARROLLO RECIENTE
18.33 EL GRUPO CELESTIAL HAIN, INC.
18.33.1 INSTANTÁNEA DE LA EMPRESA
18.33.2 ANÁLISIS DE INGRESOS
18.33.3 PORTAFOLIO DE PRODUCTOS
18.33.4 ACONTECIMIENTOS RECIENTES
18.34 TYSON FOODS, INC.
18.34.1 INSTANTÁNEA DE LA EMPRESA
18.34.2 INFORMACIÓN FINANCIERA RECIENTE
18.34.3 PORTAFOLIO DE PRODUCTOS
18.34.4 DESARROLLO RECIENTE
18.35 UNILEVER
18.35.1 INSTANTÁNEA DE LA EMPRESA
18.35.2 ANÁLISIS DE INGRESOS
18.35.3 PORTAFOLIO DE PRODUCTOS
18.35.4 ACONTECIMIENTOS RECIENTES
18.36 VECHEM ORGANICS (P) LIMITADA
18.36.1 INSTANTÁNEA DE LA EMPRESA
18.36.2 PORTAFOLIO DE PRODUCTOS
18.36.3 DESARROLLO RECIENTE
18.37 PRODUCTOS AGROVIARIOS VIMAL PVT LTD
18.37.1 INSTANTÁNEA DE LA EMPRESA
18.37.2 PORTAFOLIO DE PRODUCTOS
18.37.3 DESARROLLO RECIENTE
19 CUESTIONARIO
20 INFORMES RELACIONADOS
Lista de Tablas
CUADRO 1 CAPACIDAD DE PRODUCCIÓN ESTIMADA DE LOS FABRICANTES CLAVE
CUADRO 2 COBERTURA REGULATORIA
CUADRO 3 AUMENTO DE LOS INGRESOS DISPONIBLES
TABLA 4 AHORROS ESTIMADOS AL USAR ALIMENTOS LISTOS PARA CONSUMIR
TABLA 5 MERCADO DE ALIMENTOS LISTOS PARA CONSUMIR EN AMÉRICA DEL NORTE, POR TIPO DE PRODUCTO, 2018-2032 (MILES DE USD)
TABLA 6 MERCADO DE ALIMENTOS LISTOS PARA CONSUMIR EN AMÉRICA DEL NORTE, POR TIPO DE PRODUCTO, 2018-2032 (TONELADAS)
TABLA 7 MERCADO DE ALIMENTOS LISTOS PARA CONSUMIR EN AMÉRICA DEL NORTE, POR TIPO DE PRODUCTO, 2018-2032 (USD/KG)
TABLA 8 PRODUCTOS CÁRNICOS DE AMÉRICA DEL NORTE EN EL MERCADO DE ALIMENTOS LISTOS PARA CONSUMIR, POR REGIÓN, 2018-2032 (MILES DE USD)
TABLA 9 PRODUCTOS CÁRNICOS DE AMÉRICA DEL NORTE EN EL MERCADO DE ALIMENTOS LISTOS PARA CONSUMIR, POR REGIÓN, 2018-2032, (TONELADAS)
TABLA 10 PRODUCTOS CÁRNICOS DE AMÉRICA DEL NORTE EN EL MERCADO DE ALIMENTOS LISTOS PARA CONSUMIR, POR TIPO, 2018-2032 (MILES DE USD)
TABLA 11 PRODUCTOS CÁRNICOS DE AMÉRICA DEL NORTE EN EL MERCADO DE ALIMENTOS LISTOS PARA CONSUMIR, POR TIPO, 2018-2032 (TONELADAS)
TABLA 12 PRODUCTOS CÁRNICOS DE AMÉRICA DEL NORTE EN EL MERCADO DE ALIMENTOS LISTOS PARA CONSUMIR, POR TIPO, 2018-2032 (USD/KG)
TABLA 13 PRODUCTOS A BASE DE CEREALES EN EL MERCADO DE ALIMENTOS LISTOS PARA CONSUMIR DE AMÉRICA DEL NORTE, POR REGIÓN 2018-2032, (MILES DE USD)
CUADRO 14 PRODUCTOS A BASE DE CEREALES EN EL MERCADO DE ALIMENTOS LISTOS PARA CONSUMIR DE AMÉRICA DEL NORTE, POR REGIÓN, 2018-2032, (TONELADAS)
TABLA 15 PRODUCTOS A BASE DE CEREALES EN EL MERCADO DE ALIMENTOS LISTOS PARA CONSUMIR DE AMÉRICA DEL NORTE, POR TIPO, 2018-2032 (MILES DE USD)
TABLA 16 PRODUCTOS A BASE DE CEREALES EN EL MERCADO DE ALIMENTOS LISTOS PARA CONSUMIR DE AMÉRICA DEL NORTE, POR TIPO, 2018-2032 (TONELADAS)
CUADRO 17 PRODUCTOS A BASE DE CEREALES EN EL MERCADO DE ALIMENTOS LISTOS PARA CONSUMIR DE AMÉRICA DEL NORTE, POR TIPO, 2018-2032 (USD/KG)
TABLA 18 PRODUCTOS LÁCTEOS EN EL MERCADO DE ALIMENTOS LISTOS PARA CONSUMIR DE AMÉRICA DEL NORTE, POR REGIÓN, 2018-2032, (MILES DE USD)
TABLA 19 PRODUCTOS LÁCTEOS EN EL MERCADO DE ALIMENTOS LISTOS PARA CONSUMIR DE AMÉRICA DEL NORTE, REGIÓN, 2018-2032 (TONELADAS)
TABLA 20 PRODUCTOS LÁCTEOS EN EL MERCADO DE ALIMENTOS LISTOS PARA CONSUMIR DE AMÉRICA DEL NORTE, POR TIPO, 2018-2032 (MILES DE USD)
TABLA 21 PRODUCTOS LÁCTEOS EN EL MERCADO DE ALIMENTOS LISTOS PARA CONSUMIR DE AMÉRICA DEL NORTE, POR TIPO, 2018-2032 (TONELADAS)
TABLA 22 PRODUCTOS LÁCTEOS EN EL MERCADO DE ALIMENTOS LISTOS PARA CONSUMIR DE AMÉRICA DEL NORTE, POR TIPO, 2018-2032 (USD/KG)
TABLA 23 QUESO EN EL MERCADO DE ALIMENTOS LISTOS PARA CONSUMIR DE AMÉRICA DEL NORTE, POR FORMA, 2018-2032 (MILES DE USD)
TABLA 24 QUESO EN EL MERCADO DE ALIMENTOS LISTOS PARA CONSUMIR DE AMÉRICA DEL NORTE, POR FORMA, 2018-2032 (TONELADAS)
TABLA 25 QUESO EN EL MERCADO DE ALIMENTOS LISTOS PARA CONSUMIR DE AMÉRICA DEL NORTE, POR FORMA, 2018-2032 (USD/KG)
TABLA 26 QUESO EN EL MERCADO DE ALIMENTOS LISTOS PARA CONSUMIR DE AMÉRICA DEL NORTE, POR TIPO, 2018-2032 (MILES DE USD)
TABLA 27 QUESO EN EL MERCADO DE ALIMENTOS LISTOS PARA CONSUMIR DE AMÉRICA DEL NORTE, POR TIPO, 2018-2032 (TONELADAS)
TABLA 28 QUESO EN EL MERCADO DE ALIMENTOS LISTOS PARA CONSUMIR DE AMÉRICA DEL NORTE, POR TIPO, 2018-2032 (TONELADAS)
TABLA 29 QUESO DE ORIGEN ANIMAL EN EL MERCADO DE ALIMENTOS LISTOS PARA CONSUMIR DE AMÉRICA DEL NORTE, POR TIPO, 2018-2032 (MILES DE USD)
TABLA 30 QUESO DE ORIGEN VEGETAL EN EL MERCADO DE ALIMENTOS LISTOS PARA CONSUMIR DE AMÉRICA DEL NORTE, POR TIPO (MILES DE USD)
TABLA 31 HELADOS EN EL MERCADO DE ALIMENTOS LISTOS PARA CONSUMIR DE AMÉRICA DEL NORTE, POR TIPO, 2018-2032 (MILES DE USD)
TABLA 32 HELADOS EN EL MERCADO DE ALIMENTOS LISTOS PARA CONSUMIR DE AMÉRICA DEL NORTE, POR TIPO, 2018-2032 (TONELADAS)
TABLA 33 HELADOS EN EL MERCADO DE ALIMENTOS LISTOS PARA CONSUMIR DE AMÉRICA DEL NORTE, POR TIPO, 2018-2032 (TONELADAS)
TABLA 34 CUAJADA EN EL MERCADO DE ALIMENTOS LISTOS PARA CONSUMIR DE AMÉRICA DEL NORTE, POR TIPO, 2018-2032 (MILES DE USD)
TABLA 35 CUAJADA DE AMÉRICA DEL NORTE EN EL MERCADO DE ALIMENTOS LISTOS PARA CONSUMIR, POR TIPO, 2018-2032 (TONELADAS)
TABLA 36 CUAJADA EN EL MERCADO DE ALIMENTOS LISTOS PARA CONSUMIR DE AMÉRICA DEL NORTE, POR TIPO, 2018-2032 (USD/KG)
TABLA 37 PANEER EN EL MERCADO DE ALIMENTOS LISTOS PARA CONSUMIR DE AMÉRICA DEL NORTE, POR TIPO, 2018-2032 (TONELADAS)
TABLA 38 PANEER EN EL MERCADO DE ALIMENTOS LISTOS PARA CONSUMIR DE AMÉRICA DEL NORTE, POR TIPO, 2018-2032 (TONELADAS)
TABLA 39 PANEER DE AMÉRICA DEL NORTE EN EL MERCADO DE ALIMENTOS LISTOS PARA CONSUMIR, POR TIPO, 2018-2032 (USD/KG)
TABLA 40 GHEE EN EL MERCADO DE ALIMENTOS LISTOS PARA CONSUMIR DE AMÉRICA DEL NORTE, POR FUENTE, 2018-2032 (MILES DE USD)
TABLA 41 GHEE EN EL MERCADO DE ALIMENTOS LISTOS PARA CONSUMIR DE AMÉRICA DEL NORTE, POR FUENTE, 2018-2032 (TONELADAS)
TABLA 42 GHEE EN EL MERCADO DE ALIMENTOS LISTOS PARA CONSUMIR DE AMÉRICA DEL NORTE, POR FUENTE, 2018-2032 (USD/KG)
TABLA 43 PRODUCTOS DE PANADERÍA EN EL MERCADO DE ALIMENTOS LISTOS PARA CONSUMIR DE AMÉRICA DEL NORTE, POR REGIÓN, 2018-2032, (MILES DE USD)
TABLA 44 PRODUCTOS DE PANADERÍA EN EL MERCADO DE ALIMENTOS LISTOS PARA CONSUMIR DE AMÉRICA DEL NORTE, POR TIPO DE PRODUCTO, 2018-2032, (TONELADAS)
TABLA 45 PRODUCTOS DE PANADERÍA EN EL MERCADO DE ALIMENTOS LISTOS PARA CONSUMIR DE AMÉRICA DEL NORTE, POR TIPO, 2018-2032 (MILES DE USD)
TABLA 46 PRODUCTOS DE PANADERÍA EN EL MERCADO DE ALIMENTOS LISTOS PARA CONSUMIR DE AMÉRICA DEL NORTE, POR TIPO, 2018-2032 (TONELADAS)
TABLA 47 PRODUCTOS DE PANADERÍA EN EL MERCADO DE ALIMENTOS LISTOS PARA CONSUMIR DE AMÉRICA DEL NORTE, POR TIPO, 2018-2032 (USD/KG)
TABLA 48 DULCES SALADOS EN EL MERCADO DE ALIMENTOS LISTOS PARA CONSUMIR DE AMÉRICA DEL NORTE, POR REGIÓN, 2018-2032, (MILES DE USD)
TABLA 49 DULCES SALADOS EN EL MERCADO DE ALIMENTOS LISTOS PARA CONSUMIR DE AMÉRICA DEL NORTE, POR REGIÓN, 2018-2032, (TONELADAS)
TABLA 50 DULCES SALADOS EN EL MERCADO DE ALIMENTOS LISTOS PARA CONSUMIR DE AMÉRICA DEL NORTE, POR TIPO, 2018-2032 (MILES DE USD)
TABLA 51 DULCES SALADOS EN EL MERCADO DE ALIMENTOS LISTOS PARA CONSUMIR DE AMÉRICA DEL NORTE, POR TIPO, 2018-2032 (TONELADAS)
TABLA 52 DULCES SALADOS EN EL MERCADO DE ALIMENTOS LISTOS PARA CONSUMIR DE AMÉRICA DEL NORTE, POR TIPO, 2018-2032 (USD/KG)
TABLA 53 PRODUCTOS DE CONFITERÍA EN EL MERCADO DE ALIMENTOS LISTOS PARA CONSUMIR DE AMÉRICA DEL NORTE, POR TIPO DE REGIÓN, 2018-2032, (MILES DE USD)
TABLA 54 PRODUCTOS DE CONFITERÍA EN EL MERCADO DE ALIMENTOS LISTOS PARA CONSUMIR DE AMÉRICA DEL NORTE, POR REGIÓN, 2018-2032, (TONELADAS)
TABLA 55 PRODUCTOS DE CONFITERÍA EN EL MERCADO DE ALIMENTOS LISTOS PARA CONSUMIR DE AMÉRICA DEL NORTE, POR TIPO, 2018-2032 (MILES DE USD)
TABLA 56 PRODUCTOS DE CONFITERÍA EN EL MERCADO DE ALIMENTOS LISTOS PARA CONSUMIR DE AMÉRICA DEL NORTE, POR TIPO, 2018-2032 (TONELADAS)
TABLA 57 PRODUCTOS DE CONFITERÍA EN EL MERCADO DE ALIMENTOS LISTOS PARA CONSUMIR DE AMÉRICA DEL NORTE, POR TIPO, 2018-2032 (TONELADAS)
TABLA 58 PRODUCTOS A BASE DE VEGETALES EN EL MERCADO DE ALIMENTOS LISTOS PARA CONSUMIR DE AMÉRICA DEL NORTE, POR REGIÓN, 2018-2032, (MILES DE USD)
TABLA 59 PRODUCTOS A BASE DE VEGETALES EN EL MERCADO DE ALIMENTOS LISTOS PARA CONSUMIR DE AMÉRICA DEL NORTE, POR REGIÓN, 2018-2032, (TONELADAS)
TABLA 60 PRODUCTOS A BASE DE VEGETALES EN EL MERCADO DE ALIMENTOS LISTOS PARA CONSUMIR DE AMÉRICA DEL NORTE, POR TIPO, 2018-2032 (MILES DE USD)
TABLA 61 PRODUCTOS A BASE DE VEGETALES EN EL MERCADO DE ALIMENTOS LISTOS PARA CONSUMIR DE AMÉRICA DEL NORTE, POR TIPO, 2018-2032 (TONELADAS)
TABLA 62 PRODUCTOS A BASE DE VEGETALES EN EL MERCADO DE ALIMENTOS LISTOS PARA CONSUMIR DE AMÉRICA DEL NORTE, POR TIPO, 2018-2032 (TONELADAS)
TABLA 63 SOPAS INSTANTÁNEAS EN EL MERCADO DE ALIMENTOS LISTOS PARA CONSUMIR DE AMÉRICA DEL NORTE, POR REGIÓN, 2018-2032, (MILES DE USD)
TABLA 64 SOPAS INSTANTÁNEAS EN EL MERCADO DE ALIMENTOS LISTOS PARA CONSUMIR DE AMÉRICA DEL NORTE, POR REGIÓN, 2018-2032, (TONELADAS)
TABLA 65 SOPAS INSTANTÁNEAS EN EL MERCADO DE ALIMENTOS LISTOS PARA CONSUMIR DE AMÉRICA DEL NORTE, POR TIPO, 2018-2032 (MILES DE USD)
TABLA 66 SOPAS INSTANTÁNEAS EN EL MERCADO DE ALIMENTOS LISTOS PARA CONSUMIR DE AMÉRICA DEL NORTE, POR TIPO, 2018-2032 (TONELADAS)
TABLA 67 SOPAS INSTANTÁNEAS EN EL MERCADO DE ALIMENTOS LISTOS PARA CONSUMIR DE AMÉRICA DEL NORTE, POR TIPO, 2018-2032 (USD/KG)
TABLA 68 APERITIVOS SALADOS EN EL MERCADO DE ALIMENTOS LISTOS PARA CONSUMIR DE AMÉRICA DEL NORTE, POR REGIÓN, 2018-2032, (MILES DE USD)
TABLA 69 APERITIVOS SALADOS EN EL MERCADO DE ALIMENTOS LISTOS PARA CONSUMIR DE AMÉRICA DEL NORTE, POR REGIÓN, 2018-2032, (TONELADAS)
TABLA 70 APERITIVOS SALADOS EN EL MERCADO DE ALIMENTOS LISTOS PARA CONSUMIR DE AMÉRICA DEL NORTE, POR TIPO, 2018-2032 (MILES DE USD)
TABLA 71 APERITIVOS SALADOS EN EL MERCADO DE ALIMENTOS LISTOS PARA CONSUMIR DE AMÉRICA DEL NORTE, POR TIPO, 2018-2032 (TONELADAS)
TABLA 72 APERITIVOS SALADOS EN EL MERCADO DE ALIMENTOS LISTOS PARA CONSUMIR DE AMÉRICA DEL NORTE, POR TIPO, 2018-2032 (USD/KG)
TABLA 73 PAPAS FRITAS EN EL MERCADO DE ALIMENTOS LISTOS PARA CONSUMIR DE AMÉRICA DEL NORTE, POR TIPO, 2018-2032 (MILES DE USD)
TABLA 74 PAPAS FRITAS EN EL MERCADO DE ALIMENTOS LISTOS PARA CONSUMIR DE AMÉRICA DEL NORTE, POR TIPO, 2018-2032 (TONELADAS)
TABLA 75 PAPAS FRITAS EN EL MERCADO DE ALIMENTOS LISTOS PARA CONSUMIR DE AMÉRICA DEL NORTE, POR TIPO, 2018-2032 (TONELADAS)
TABLA 76 OBLEAS EN EL MERCADO DE ALIMENTOS LISTOS PARA CONSUMIR DE AMÉRICA DEL NORTE, POR TIPO, 2018-2032 (MILES DE USD)
TABLA 77 OBLEAS DE AMÉRICA DEL NORTE EN EL MERCADO DE ALIMENTOS LISTOS PARA CONSUMIR, POR TIPO, 2018-2032 (TONELADAS)
TABLA 78 OBLEAS DE AMÉRICA DEL NORTE EN EL MERCADO DE ALIMENTOS LISTOS PARA CONSUMIR, POR TIPO, 2018-2032 (USD/KG)
TABLA 79 NÚMERO DE PARTICIPANTES EN EL MERCADO DE ALIMENTOS LISTOS PARA CONSUMIR DE AMÉRICA DEL NORTE, POR TIPO, 2018-2032 (MILES DE USD)
TABLA 80 NÚMERO DE NOMBRES EN EL MERCADO DE ALIMENTOS LISTOS PARA CONSUMIR DE AMÉRICA DEL NORTE, POR TIPO, 2018-2032 (TONELADAS)
TABLA 81 NÚMERO DE PARTICIPANTES EN EL MERCADO DE ALIMENTOS LISTOS PARA CONSUMIR DE AMÉRICA DEL NORTE, POR TIPO, 2018-2032 (USD/KG)
TABLA 82 GALLETAS Y GALLETAS DE AMÉRICA DEL NORTE EN EL MERCADO DE ALIMENTOS LISTOS PARA CONSUMIR, POR TIPO, 2018-2032 (MILES DE USD)
TABLA 83 GALLETAS Y GALLETAS DE AMÉRICA DEL NORTE EN EL MERCADO DE ALIMENTOS LISTOS PARA CONSUMIR, POR TIPO, 2018-2032 (TONELADAS)
TABLA 84 GALLETAS Y GALLETAS DE AMÉRICA DEL NORTE EN EL MERCADO DE ALIMENTOS LISTOS PARA CONSUMIR, POR TIPO, 2018-2032 (USD/KG)
TABLA 85 ALIMENTOS REFRIGERADOS EN EL MERCADO DE ALIMENTOS LISTOS PARA CONSUMIR DE AMÉRICA DEL NORTE, POR REGIÓN, 2018-2032, (MILES DE USD)
TABLA 86 ALIMENTOS REFRIGERADOS EN EL MERCADO DE ALIMENTOS LISTOS PARA CONSUMIR DE AMÉRICA DEL NORTE, POR REGIÓN, 2018-2032, (TONELADAS)
TABLA 87 ALIMENTOS REFRIGERADOS EN EL MERCADO DE ALIMENTOS LISTOS PARA CONSUMIR DE AMÉRICA DEL NORTE, POR TIPO (MILES DE USD)
TABLA 88 ALIMENTOS REFRIGERADOS EN EL MERCADO DE ALIMENTOS LISTOS PARA CONSUMIR DE AMÉRICA DEL NORTE, POR TIPO (TONELADAS)
TABLA 89 ALIMENTOS REFRIGERADOS EN EL MERCADO DE ALIMENTOS LISTOS PARA CONSUMIR DE AMÉRICA DEL NORTE, POR TIPO (USD/KG)
TABLA 90 SNACKS DE CARNE DE ORIGEN VEGETAL EN EL MERCADO DE ALIMENTOS LISTOS PARA CONSUMIR DE AMÉRICA DEL NORTE, POR REGIÓN, 2018-2032, (MILES DE USD)
TABLA 91 SNACKS DE CARNE DE ORIGEN VEGETAL EN EL MERCADO DE ALIMENTOS LISTOS PARA CONSUMIR DE AMÉRICA DEL NORTE, POR REGIÓN, 2018-2032, (TONELADAS)
TABLA 92 SNACKS DE CARNE DE ORIGEN VEGETAL EN EL MERCADO DE ALIMENTOS LISTOS PARA CONSUMIR DE AMÉRICA DEL NORTE, POR TIPO, 2018-2032 (MILES DE USD)
TABLA 93 SNACKS DE CARNE DE ORIGEN VEGETAL EN EL MERCADO DE ALIMENTOS LISTOS PARA CONSUMIR DE AMÉRICA DEL NORTE, POR TIPO, 2018-2032 (TONELADAS)
TABLA 94 SNACKS DE CARNE DE ORIGEN VEGETAL EN EL MERCADO DE ALIMENTOS LISTOS PARA CONSUMIR DE AMÉRICA DEL NORTE, POR TIPO, 2018-2032 (USD/KG)
TABLA 95 SNACKS DE CARNE DE ORIGEN VEGETAL EN EL MERCADO DE ALIMENTOS LISTOS PARA CONSUMIR DE AMÉRICA DEL NORTE, POR FUENTE, 2018-2032 (MILES DE USD)
TABLA 96 APERITIVOS DE CARNE DE ORIGEN VEGETAL EN EL MERCADO DE ALIMENTOS LISTOS PARA CONSUMIR DE AMÉRICA DEL NORTE, POR FUENTE, 2018-2032 (TONELADAS)
TABLA 97 SNACKS DE CARNE DE ORIGEN VEGETAL EN EL MERCADO DE ALIMENTOS LISTOS PARA CONSUMIR DE AMÉRICA DEL NORTE, POR FUENTE, 2018-2032 (USD/KG)
TABLA 98 COMIDAS LISTAS PARA COMER EN AMÉRICA DEL NORTE EN EL MERCADO DE ALIMENTOS LISTOS PARA COMER, POR REGIÓN, 2018-2032, (MILES DE USD)
TABLA 99 COMIDAS LISTAS PARA COMER EN AMÉRICA DEL NORTE EN EL MERCADO DE ALIMENTOS LISTOS PARA COMER, POR REGIÓN 2018-2032, (TONELADAS)
TABLA 100 COMIDAS LISTAS PARA COMER EN AMÉRICA DEL NORTE EN EL MERCADO DE ALIMENTOS LISTOS PARA COMER, POR TIPO, 2018-2032 (MILES DE USD)
TABLA 101 COMIDAS LISTAS PARA COMER EN AMÉRICA DEL NORTE EN EL MERCADO DE ALIMENTOS LISTOS PARA COMER, POR TIPO, 2018-2032 (TONELADAS)
TABLA 102 COMIDAS LISTAS PARA CONSUMIR EN AMÉRICA DEL NORTE EN EL MERCADO DE ALIMENTOS LISTOS PARA CONSUMIR, POR TIPO, 2018-2032 (USD/KG)
TABLA 103 MERCADO DE ALIMENTOS LISTOS PARA CONSUMIR EN AMÉRICA DEL NORTE, POR CATEGORÍA, 2018-2032 (MILES DE USD)
TABLA 104 MERCADO DE ALIMENTOS LISTOS PARA CONSUMIR CONVENCIONALES DE AMÉRICA DEL NORTE, POR REGIÓN, 2018-2032 (MILES DE USD)
TABLA 105 MERCADO DE ESPECIALIDADES DE AMÉRICA DEL NORTE EN ALIMENTOS LISTOS PARA CONSUMIR, POR REGIÓN, 2018-2032 (MILES DE USD)
TABLA 106 MERCADO DE ALIMENTOS ESPECIALES LISTOS PARA CONSUMIR EN AMÉRICA DEL NORTE, POR TIPO, 2018-2032 (MILES DE USD)
TABLA 107 MERCADO DE ALIMENTOS LISTOS PARA CONSUMIR EN AMÉRICA DEL NORTE, POR TIPO DE ENVASE, 2018-2032 (MILES DE USD)
TABLA 108 BOLSAS/SOBRES DE AMÉRICA DEL NORTE EN EL MERCADO DE ALIMENTOS CONVENCIONALES LISTOS PARA CONSUMIR, POR REGIÓN, 2018-2032 (MILES DE USD)
TABLA 109 ENLATADOS EN EL MERCADO DE ALIMENTOS CONVENCIONALES Y LISTOS PARA CONSUMIR DE AMÉRICA DEL NORTE, POR REGIÓN, 2018-2032 (MILES DE USD)
TABLA 110 FRASCOS Y ENVASES DE AMÉRICA DEL NORTE EN EL MERCADO DE ALIMENTOS LISTOS PARA CONSUMIR CONVENCIONALES, POR REGIÓN, 2018-2032 (MILES DE USD)
TABLA 111 ENVASES DE AMÉRICA DEL NORTE EN EL MERCADO DE ALIMENTOS CONVENCIONALES LISTOS PARA CONSUMIR, POR REGIÓN, 2018-2032 (MILES DE USD)
TABLA 112 ENVASES DE AMÉRICA DEL NORTE EN EL MERCADO DE ALIMENTOS CONVENCIONALES LISTOS PARA CONSUMIR, POR TIPO, 2018-2032 (MILES DE USD)
TABLA 113 CAJAS DE AMÉRICA DEL NORTE EN EL MERCADO DE ALIMENTOS CONVENCIONALES Y LISTOS PARA CONSUMIR, POR REGIÓN, 2018-2032 (MILES DE USD)
TABLA 114 OTROS MERCADOS DE ALIMENTOS LISTOS PARA CONSUMIR EN AMÉRICA DEL NORTE, POR REGIÓN, 2018-2032 (MILES DE USD)
TABLA 115 MERCADO DE ALIMENTOS LISTOS PARA CONSUMIR EN AMÉRICA DEL NORTE, POR TAMAÑO DE ENVASE, 2018-2032 (MILES DE USD)
TABLA 116 MERCADO DE ALIMENTOS LISTOS PARA CONSUMIR CONVENCIONALES DE MENOS DE 250 GRAMOS EN AMÉRICA DEL NORTE, POR REGIÓN, 2018-2032 (MILES DE USD)
TABLA 117 AMÉRICA DEL NORTE 251-500 GRAMOS EN EL MERCADO DE ALIMENTOS CONVENCIONALES LISTOS PARA CONSUMIR, POR REGIÓN, 2018-2032 (MILES DE USD)
TABLA 118 AMÉRICA DEL NORTE 501-750 GRAMOS EN EL MERCADO DE ALIMENTOS CONVENCIONALES LISTOS PARA CONSUMIR, POR REGIÓN, 2018-2032 (MILES DE USD)
TABLA 119 AMÉRICA DEL NORTE 751-1000 GRAMOS EN EL MERCADO DE ALIMENTOS CONVENCIONALES LISTOS PARA CONSUMIR, POR REGIÓN, 2018-2032 (MILES DE USD)
TABLA 120 AMÉRICA DEL NORTE MÁS DE 1000 GRAMOS EN EL MERCADO DE ALIMENTOS CONVENCIONALES LISTOS PARA CONSUMIR, POR REGIÓN, 2018-2032 (MILES DE USD)
TABLA 121 MERCADO DE ALIMENTOS LISTOS PARA CONSUMIR EN AMÉRICA DEL NORTE, POR TECNOLOGÍA DE ENVASE, 2018-2032 (MILES DE USD)
TABLA 122 RECOGEDORES DE OXÍGENO EN EL MERCADO DE ALIMENTOS CONVENCIONALES LISTOS PARA CONSUMIR DE AMÉRICA DEL NORTE, POR REGIÓN, 2018-2032 (MILES DE USD)
TABLA 123 CONTROL DE HUMEDAD EN AMÉRICA DEL NORTE EN EL MERCADO DE ALIMENTOS CONVENCIONALES LISTOS PARA CONSUMIR, POR REGIÓN, 2018-2032 (MILES DE USD)
TABLA 124 ANTIMICROBIANOS EN EL MERCADO DE ALIMENTOS CONVENCIONALES LISTOS PARA CONSUMIR DE AMÉRICA DEL NORTE, POR REGIÓN, 2018-2032 (MILES DE USD)
TABLA 125 INDICADORES DE TIEMPO Y TEMPERATURA EN AMÉRICA DEL NORTE EN EL MERCADO DE ALIMENTOS CONVENCIONALES LISTOS PARA CONSUMIR, POR REGIÓN, 2018-2032 (MILES DE USD)
TABLA 126 PELÍCULAS COMESTIBLES EN EL MERCADO DE ALIMENTOS CONVENCIONALES LISTOS PARA CONSUMIR DE AMÉRICA DEL NORTE, POR REGIÓN, 2018-2032 (MILES DE USD)
TABLA 127 MERCADO DE ALIMENTOS LISTOS PARA CONSUMIR EN AMÉRICA DEL NORTE, POR TIPO DE ALMACENAMIENTO, 2018-2032 (MILES DE USD)
TABLA 128 MERCADO DE ALIMENTOS CONGELADOS/REFRIGERADOS LISTOS PARA CONSUMIR EN AMÉRICA DEL NORTE, POR REGIÓN, 2018-2032 (MILES DE USD)
TABLA 129 MERCADO DE ALIMENTOS LISTOS PARA CONSUMIR CONSERVABLES EN AMÉRICA DEL NORTE, POR REGIÓN, 2018-2032 (MILES DE USD)
TABLA 130 MERCADO DE ALIMENTOS ENLATADOS LISTOS PARA CONSUMIR EN AMÉRICA DEL NORTE, POR REGIÓN, 2018-2032 (MILES DE USD)
TABLA 131 OTROS EN AMÉRICA DEL NORTE EN EL MERCADO DE ALIMENTOS LISTOS PARA CONSUMIR, POR REGIÓN, 2018-2032 (MILES DE USD)
TABLA 132 MERCADO DE ALIMENTOS LISTOS PARA CONSUMIR EN AMÉRICA DEL NORTE, POR CANAL DE DISTRIBUCIÓN, 2018-2032 (MILES DE USD)
TABLA 133 MERCADO DE ALIMENTOS LISTOS PARA CONSUMIR EN TIENDAS DE AMÉRICA DEL NORTE, POR REGIÓN, 2018-2032 (MILES DE USD)
TABLA 134 MERCADO DE ALIMENTOS LISTOS PARA CONSUMIR EN TIENDAS DE AMÉRICA DEL NORTE, POR TIPO, 2018-2032 (MILES DE USD)
TABLA 135 MERCADO DE ALIMENTOS LISTOS PARA CONSUMIR SIN TIENDAS EN AMÉRICA DEL NORTE, POR REGIÓN, 2018-2032 (MILES DE USD)
TABLA 136 MERCADO DE ALIMENTOS LISTOS PARA CONSUMIR SIN TIENDAS EN AMÉRICA DEL NORTE, POR TIPO, 2018-2032 (MILES DE USD)
TABLA 137 MERCADO DE ALIMENTOS LISTOS PARA CONSUMIR EN AMÉRICA DEL NORTE, POR USUARIO FINAL, 2018-2032 (MILES DE USD)
TABLA 138 SERVICIOS DE LA INDUSTRIA ALIMENTARIA DE AMÉRICA DEL NORTE EN EL MERCADO DE ALIMENTOS LISTOS PARA CONSUMIR, POR REGIÓN, 2018-2032 (MILES DE USD)
TABLA 139 SERVICIOS DE LA INDUSTRIA ALIMENTARIA DE AMÉRICA DEL NORTE EN EL MERCADO DE ALIMENTOS LISTOS PARA CONSUMIR, POR TIPO, 2018-2032 (MILES DE USD)
TABLA 140 RESTAURANTES DE AMÉRICA DEL NORTE EN EL MERCADO DE ALIMENTOS LISTO PARA CONSUMIR, POR TIPO, 2018-2032 (MILES DE USD)
TABLA 141 HOGARES DE AMÉRICA DEL NORTE EN EL MERCADO DE ALIMENTOS LISTOS PARA CONSUMIR, POR REGIÓN, 2018-2032 (MILES DE USD)
TABLA 142 OTROS EN AMÉRICA DEL NORTE EN EL MERCADO DE ALIMENTOS LISTOS PARA CONSUMIR, POR REGIÓN, 2018-2032 (MILES DE USD)
TABLA 143 MERCADO DE ALIMENTOS LISTOS PARA CONSUMIR EN AMÉRICA DEL NORTE, POR PAÍS, 2018-2032 (MILES DE USD)
TABLA 144 MERCADO DE ALIMENTOS LISTOS PARA CONSUMIR EN AMÉRICA DEL NORTE, POR PAÍS, 2018-2032 (TONELADAS)
TABLA 145 MERCADO DE ALIMENTOS LISTOS PARA CONSUMIR EN AMÉRICA DEL NORTE, POR PAÍS, 2018-2032 (USD/KG)
TABLA 146 MERCADO DE ALIMENTOS LISTOS PARA CONSUMIR EN AMÉRICA DEL NORTE, POR TIPO DE PRODUCTO, 2018-2032 (MILES DE USD)
TABLA 147 MERCADO DE ALIMENTOS LISTOS PARA CONSUMIR EN AMÉRICA DEL NORTE, POR TIPO DE PRODUCTO, 2018-2032 (TONELADAS)
TABLA 148 MERCADO DE ALIMENTOS LISTOS PARA CONSUMIR EN AMÉRICA DEL NORTE, POR TIPO DE PRODUCTO, 2018-2032 (USD/KG)
TABLA 149 PRODUCTOS CÁRNICOS DE AMÉRICA DEL NORTE EN EL MERCADO DE ALIMENTOS LISTOS PARA CONSUMIR, POR TIPO, 2018-2032 (MILES DE USD)
TABLA 150 PRODUCTOS CÁRNICOS DE AMÉRICA DEL NORTE EN EL MERCADO DE ALIMENTOS LISTOS PARA CONSUMIR, POR TIPO, 2018-2032 (TONELADAS)
TABLA 151 PRODUCTOS CÁRNICOS DE AMÉRICA DEL NORTE EN EL MERCADO DE ALIMENTOS LISTOS PARA CONSUMIR, POR TIPO, 2018-2032 (USD/KG)
TABLA 152 PRODUCTOS A BASE DE CEREALES EN EL MERCADO DE ALIMENTOS LISTOS PARA CONSUMIR DE AMÉRICA DEL NORTE, POR TIPO, 2018-2032 (MILES DE USD)
TABLA 153 PRODUCTOS A BASE DE CEREALES EN EL MERCADO DE ALIMENTOS LISTOS PARA CONSUMIR DE AMÉRICA DEL NORTE, POR TIPO, 2018-2032 (TONELADAS)
CUADRO 154 PRODUCTOS A BASE DE CEREALES EN EL MERCADO DE ALIMENTOS LISTOS PARA CONSUMIR DE AMÉRICA DEL NORTE, POR TIPO, 2018-2032 (USD/KG)
TABLA 155 PRODUCTOS LÁCTEOS EN EL MERCADO DE ALIMENTOS LISTOS PARA CONSUMIR DE AMÉRICA DEL NORTE, POR TIPO, 2018-2032 (MILES DE USD)
TABLA 156 PRODUCTOS LÁCTEOS EN EL MERCADO DE ALIMENTOS LISTOS PARA CONSUMIR DE AMÉRICA DEL NORTE, POR TIPO, 2018-2032 (TONELADAS)
TABLA 157 PRODUCTOS LÁCTEOS EN EL MERCADO DE ALIMENTOS LISTOS PARA CONSUMIR DE AMÉRICA DEL NORTE, POR TIPO, 2018-2032 (USD/KG)
TABLA 158 QUESO EN EL MERCADO DE ALIMENTOS LISTOS PARA CONSUMIR DE AMÉRICA DEL NORTE, POR FORMA, 2018-2032 (MILES DE USD)
TABLA 159 QUESO EN EL MERCADO DE ALIMENTOS LISTOS PARA CONSUMIR DE AMÉRICA DEL NORTE, POR FORMA, 2018-2032 (TONELADAS)
TABLA 160 QUESO EN EL MERCADO DE ALIMENTOS LISTOS PARA CONSUMIR DE AMÉRICA DEL NORTE, POR FORMA, 2018-2032 (USD/KG)
TABLA 161 QUESO EN EL MERCADO DE ALIMENTOS LISTOS PARA CONSUMIR DE AMÉRICA DEL NORTE, POR TIPO, 2018-2032 (MILES DE USD)
TABLA 162 QUESO EN EL MERCADO DE ALIMENTOS LISTOS PARA CONSUMIR DE AMÉRICA DEL NORTE, POR TIPO, 2018-2032 (TONELADAS)
TABLA 163 QUESO DE AMÉRICA DEL NORTE EN EL MERCADO DE ALIMENTOS LISTOS PARA CONSUMIR, POR TIPO, 2018-2032 (USD/KG)
TABLA 164 QUESO DE ORIGEN ANIMAL EN EL MERCADO DE ALIMENTOS LISTOS PARA CONSUMIR DE AMÉRICA DEL NORTE, POR TIPO, 2018-2032 (MILES DE USD)
TABLA 165 QUESO DE ORIGEN VEGETAL EN EL MERCADO DE ALIMENTOS LISTOS PARA CONSUMIR DE AMÉRICA DEL NORTE, POR TIPO, 2018-2032 (MILES DE USD)
TABLA 166 HELADOS EN EL MERCADO DE ALIMENTOS LISTOS PARA CONSUMIR DE AMÉRICA DEL NORTE, POR TIPO, 2018-2032 (MILES DE USD)
TABLA 167 HELADOS EN EL MERCADO DE ALIMENTOS LISTOS PARA CONSUMIR DE AMÉRICA DEL NORTE, POR TIPO, 2018-2032 (TONELADAS)
TABLA 168 HELADOS EN EL MERCADO DE ALIMENTOS LISTOS PARA CONSUMIR DE AMÉRICA DEL NORTE, POR TIPO, 2018-2032 (USD/KG)
TABLA 169 CUAJADA EN EL MERCADO DE ALIMENTOS LISTOS PARA CONSUMIR DE AMÉRICA DEL NORTE, POR TIPO, 2018-2032 (MILES DE USD)
TABLA 170 CUAJADA DE AMÉRICA DEL NORTE EN EL MERCADO DE ALIMENTOS LISTOS PARA CONSUMIR, POR TIPO, 2018-2032 (TONELADAS)
TABLA 171 CUAJADA DE AMÉRICA DEL NORTE EN EL MERCADO DE ALIMENTOS LISTOS PARA CONSUMIR, POR TIPO, 2018-2032 (USD/KG)
TABLA 172 PANEER EN EL MERCADO DE ALIMENTOS LISTOS PARA CONSUMIR DE AMÉRICA DEL NORTE, POR TIPO, 2018-2032 (MILES DE USD)
TABLA 173 PANEER EN EL MERCADO DE ALIMENTOS LISTOS PARA CONSUMIR DE AMÉRICA DEL NORTE, POR TIPO, 2018-2032 (TONELADAS)
TABLA 174 PANEER DE AMÉRICA DEL NORTE EN EL MERCADO DE ALIMENTOS LISTOS PARA CONSUMIR, POR TIPO, 2018-2032 (USD/KG)
TABLA 175 GHEE EN EL MERCADO DE ALIMENTOS LISTOS PARA CONSUMIR DE AMÉRICA DEL NORTE, POR FUENTE, 2018-2032 (MILES DE USD)
TABLA 176 GHEE EN EL MERCADO DE ALIMENTOS LISTOS PARA CONSUMIR DE AMÉRICA DEL NORTE, POR FUENTE, 2018-2032 (TONELADAS)
TABLA 177 GHEE EN EL MERCADO DE ALIMENTOS LISTOS PARA CONSUMIR DE AMÉRICA DEL NORTE, POR FUENTE, 2018-2032 (USD/KG)
TABLA 178 PRODUCTOS DE PANADERÍA EN EL MERCADO DE ALIMENTOS LISTOS PARA CONSUMIR DE AMÉRICA DEL NORTE, POR TIPO, 2018-2032 (MILES DE USD)
TABLA 179 PRODUCTOS DE PANADERÍA EN EL MERCADO DE ALIMENTOS LISTOS PARA CONSUMIR DE AMÉRICA DEL NORTE, POR TIPO, 2018-2032 (TONELADAS)
TABLA 180 PRODUCTOS DE PANADERÍA EN EL MERCADO DE ALIMENTOS LISTOS PARA CONSUMIR DE AMÉRICA DEL NORTE, POR TIPO, 2018-2032 (USD/KG)
TABLA 181 DULCES SALADOS EN EL MERCADO DE ALIMENTOS LISTOS PARA CONSUMIR DE AMÉRICA DEL NORTE, POR TIPO, 2018-2032 (MILES DE USD)
TABLA 182 DULCES SALADOS EN EL MERCADO DE ALIMENTOS LISTOS PARA CONSUMIR DE AMÉRICA DEL NORTE, POR TIPO, 2018-2032 (TONELADAS)
TABLA 183 DULCES SALADOS EN EL MERCADO DE ALIMENTOS LISTOS PARA CONSUMIR DE AMÉRICA DEL NORTE, POR TIPO, 2018-2032 (USD/KG)
TABLA 184 PRODUCTOS DE CONFITERÍA EN EL MERCADO DE ALIMENTOS LISTOS PARA CONSUMIR DE AMÉRICA DEL NORTE, POR TIPO, 2018-2032 (MILES DE USD)
TABLA 185 PRODUCTOS DE CONFITERÍA EN EL MERCADO DE ALIMENTOS LISTOS PARA CONSUMIR DE AMÉRICA DEL NORTE, POR TIPO, 2018-2032 (TONELADAS)
TABLA 186 PRODUCTOS DE CONFITERÍA EN EL MERCADO DE ALIMENTOS LISTOS PARA CONSUMIR DE AMÉRICA DEL NORTE, POR TIPO, 2018-2032 (USD/KG)
TABLA 187 PRODUCTOS A BASE DE VEGETALES EN EL MERCADO DE ALIMENTOS LISTOS PARA CONSUMIR DE AMÉRICA DEL NORTE, POR TIPO, 2018-2032 (MILES DE USD)
TABLA 188 PRODUCTOS A BASE DE VEGETALES EN EL MERCADO DE ALIMENTOS LISTOS PARA CONSUMIR DE AMÉRICA DEL NORTE, POR TIPO, 2018-2032 (TONELADAS)
TABLA 189 PRODUCTOS A BASE DE VEGETALES EN EL MERCADO DE ALIMENTOS LISTOS PARA CONSUMIR DE AMÉRICA DEL NORTE, POR TIPO, 2018-2032 (USD/KG)
TABLA 190 SOPAS INSTANTÁNEAS EN EL MERCADO DE ALIMENTOS LISTOS PARA CONSUMIR DE AMÉRICA DEL NORTE, POR TIPO, 2018-2032 (MILES DE USD)
TABLA 191 SOPAS INSTANTÁNEAS EN EL MERCADO DE ALIMENTOS LISTOS PARA CONSUMIR DE AMÉRICA DEL NORTE, POR TIPO, 2018-2032 (TONELADAS)
TABLA 192 SOPAS INSTANTÁNEAS EN EL MERCADO DE ALIMENTOS LISTOS PARA CONSUMIR DE AMÉRICA DEL NORTE, POR TIPO, 2018-2032 (USD/KG)
TABLA 193 APERITIVOS SALADOS EN EL MERCADO DE ALIMENTOS LISTOS PARA CONSUMIR DE AMÉRICA DEL NORTE, POR TIPO, 2018-2032 (MILES DE USD)
TABLA 194 APERITIVOS SALADOS EN EL MERCADO DE ALIMENTOS LISTOS PARA CONSUMIR DE AMÉRICA DEL NORTE, POR TIPO, 2018-2032 (TONELADAS)
TABLA 195 APERITIVOS SALADOS EN EL MERCADO DE ALIMENTOS LISTOS PARA CONSUMIR DE AMÉRICA DEL NORTE, POR TIPO, 2018-2032 (USD/KG)
TABLA 196 PAPAS FRITAS EN EL MERCADO DE ALIMENTOS LISTOS PARA CONSUMIR DE AMÉRICA DEL NORTE, POR TIPO, 2018-2032 (MILES DE USD)
TABLA 197 PAPAS FRITAS EN EL MERCADO DE ALIMENTOS LISTOS PARA CONSUMIR DE AMÉRICA DEL NORTE, POR TIPO, 2018-2032 (TONELADAS)
TABLA 198 PAPAS FRITAS EN EL MERCADO DE ALIMENTOS LISTOS PARA CONSUMIR DE AMÉRICA DEL NORTE, POR TIPO, 2018-2032 (USD/KG)
TABLA 199 OBLEAS EN EL MERCADO DE ALIMENTOS LISTOS PARA CONSUMIR DE AMÉRICA DEL NORTE, POR TIPO, 2018-2032 (MILES DE USD)
TABLA 200. OBLEAS EN EL MERCADO DE ALIMENTOS LISTOS PARA CONSUMIR DE AMÉRICA DEL NORTE, POR TIPO, 2018-2032 (TONELADAS)
TABLA 201 OBLEAS DE AMÉRICA DEL NORTE EN EL MERCADO DE ALIMENTOS LISTOS PARA CONSUMIR, POR TIPO, 2018-2032 (USD/KG)
TABLA 202 NÚMEROS DE AMÉRICA DEL NORTE EN EL MERCADO DE ALIMENTOS LISTOS PARA CONSUMIR, POR TIPO, 2018-2032 (MILES DE USD)
TABLA 203 NÚMEROS DE AMÉRICA DEL NORTE EN EL MERCADO DE ALIMENTOS LISTOS PARA CONSUMIR, POR TIPO, 2018-2032 (TONELADAS)
TABLA 204 NÚMEROS DE AMÉRICA DEL NORTE EN EL MERCADO DE ALIMENTOS LISTOS PARA CONSUMIR, POR TIPO, 2018-2032 (USD/KG)
TABLA 205 GALLETAS Y GALLETAS DE AMÉRICA DEL NORTE EN EL MERCADO DE ALIMENTOS LISTOS PARA CONSUMIR, POR TIPO, 2018-2032 (MILES DE USD)
TABLA 206 GALLETAS Y GALLETAS DE AMÉRICA DEL NORTE EN EL MERCADO DE ALIMENTOS LISTOS PARA CONSUMIR, POR TIPO, 2018-2032 (TONELADAS)
TABLA 207 GALLETAS Y GALLETAS DE AMÉRICA DEL NORTE EN EL MERCADO DE ALIMENTOS LISTOS PARA CONSUMIR, POR TIPO, 2018-2032 (USD/KG)
TABLA 208 ALIMENTOS REFRIGERADOS EN EL MERCADO DE ALIMENTOS LISTOS PARA CONSUMIR DE AMÉRICA DEL NORTE, POR TIPO, 2018-2032 (MILES DE USD)
TABLA 209 ALIMENTOS REFRIGERADOS EN EL MERCADO DE ALIMENTOS LISTOS PARA CONSUMIR DE AMÉRICA DEL NORTE, POR TIPO, 2018-2032 (TONELADAS)
TABLA 210 ALIMENTOS REFRIGERADOS EN EL MERCADO DE ALIMENTOS LISTOS PARA CONSUMIR DE AMÉRICA DEL NORTE, POR TIPO, 2018-2032 (USD/KG)
TABLA 211 SNACKS DE CARNE DE ORIGEN VEGETAL EN EL MERCADO DE ALIMENTOS LISTOS PARA CONSUMIR DE AMÉRICA DEL NORTE, POR TIPO, 2018-2032 (MILES DE USD)
TABLA 212 APERITIVOS DE CARNE DE ORIGEN VEGETAL EN EL MERCADO DE ALIMENTOS LISTOS PARA CONSUMIR DE AMÉRICA DEL NORTE, POR TIPO, 2018-2032 (TONELADAS)
TABLA 213 APERITIVOS DE CARNE DE ORIGEN VEGETAL EN EL MERCADO DE ALIMENTOS LISTOS PARA CONSUMIR DE AMÉRICA DEL NORTE, POR TIPO, 2018-2032 (USD/KG)
TABLA 214 SNACKS DE CARNE DE ORIGEN VEGETAL EN EL MERCADO DE ALIMENTOS LISTOS PARA CONSUMIR DE AMÉRICA DEL NORTE, POR FUENTE, 2018-2032 (MILES DE USD)
TABLA 215 APERITIVOS DE CARNE DE ORIGEN VEGETAL EN EL MERCADO DE ALIMENTOS LISTOS PARA CONSUMIR DE AMÉRICA DEL NORTE, POR FUENTE, 2018-2032 (TONELADAS)
TABLA 216 APERITIVOS DE CARNE DE ORIGEN VEGETAL EN EL MERCADO DE ALIMENTOS LISTOS PARA CONSUMIR DE AMÉRICA DEL NORTE, POR FUENTE, 2018-2032 (USD/KG)
TABLA 217 COMIDAS LISTAS PARA COMER EN AMÉRICA DEL NORTE EN EL MERCADO DE ALIMENTOS LISTOS PARA COMER, POR TIPO, 2018-2032 (MILES DE USD)
TABLA 218 COMIDAS LISTAS PARA CONSUMIR EN AMÉRICA DEL NORTE EN EL MERCADO DE ALIMENTOS LISTOS PARA CONSUMIR, POR TIPO, 2018-2032 (TONELADAS)
TABLA 219 COMIDAS LISTAS PARA CONSUMIR EN AMÉRICA DEL NORTE EN EL MERCADO DE ALIMENTOS LISTOS PARA CONSUMIR, POR TIPO, 2018-2032 (USD/KG)
TABLA 220 MERCADO DE ALIMENTOS LISTOS PARA CONSUMIR EN AMÉRICA DEL NORTE, POR CATEGORÍA, 2018-2032 (MILES DE USD)
TABLA 221 MERCADO DE ALIMENTOS ESPECIALES LISTOS PARA CONSUMIR EN AMÉRICA DEL NORTE, POR TIPO, 2018-2032 (MILES DE USD)
TABLA 222 MERCADO DE ALIMENTOS LISTOS PARA CONSUMIR EN AMÉRICA DEL NORTE, POR TIPO DE ENVASE, 2018-2032 (MILES DE USD)
TABLA 223 BOTELLAS EN EL MERCADO DE ALIMENTOS LISTOS PARA CONSUMIR DE AMÉRICA DEL NORTE, POR TIPO, 2018-2032 (MILES DE USD)
TABLA 224 MERCADO DE ALIMENTOS LISTOS PARA CONSUMIR EN AMÉRICA DEL NORTE, POR TAMAÑO DE ENVASE, 2018-2032 (MILES DE USD)
TABLA 225 MERCADO DE ALIMENTOS LISTOS PARA CONSUMIR EN AMÉRICA DEL NORTE, POR TECNOLOGÍA DE ENVASE, 2018-2032 (MILES DE USD)
TABLA 226 MERCADO DE ALIMENTOS LISTOS PARA CONSUMIR EN AMÉRICA DEL NORTE, POR TIPO DE ALMACENAMIENTO, 2018-2032 (MILES DE USD)
TABLA 227 MERCADO DE ALIMENTOS LISTOS PARA CONSUMIR EN AMÉRICA DEL NORTE, POR CANAL DE DISTRIBUCIÓN, 2018-2032 (MILES DE USD)
TABLA 228 MERCADO DE ALIMENTOS LISTOS PARA CONSUMIR EN TIENDAS DE AMÉRICA DEL NORTE, POR TIPO, 2018-2032 (MILES DE USD)
TABLA 229 MERCADO DE ALIMENTOS LISTOS PARA CONSUMIR SIN TIENDAS EN AMÉRICA DEL NORTE, POR TIPO, 2018-2032 (MILES DE USD)
TABLA 230 MERCADO DE ALIMENTOS LISTOS PARA CONSUMIR EN AMÉRICA DEL NORTE, POR USUARIO FINAL, 2018-2032 (MILES DE USD)
TABLA 231 SERVICIOS DE LA INDUSTRIA ALIMENTARIA DE AMÉRICA DEL NORTE EN EL MERCADO DE ALIMENTOS LISTOS PARA CONSUMIR, POR TIPO, 2018-2032 (MILES DE USD)
TABLA 232 RESTAURANTES DE AMÉRICA DEL NORTE EN EL MERCADO DE ALIMENTOS LISTO PARA CONSUMIR, POR TIPO, 2018-2032 (MILES DE USD)
TABLA 233 MERCADO DE ALIMENTOS LISTOS PARA CONSUMIR DE EE. UU., POR TIPO DE PRODUCTO, 2018-2032 (MILES DE USD)
TABLA 234 MERCADO DE ALIMENTOS LISTOS PARA CONSUMIR DE EE. UU., POR TIPO DE PRODUCTO, 2018-2032 (TONELADAS)
TABLA 235 MERCADO DE ALIMENTOS LISTOS PARA CONSUMIR DE EE. UU., POR TIPO DE PRODUCTO, 2018-2032 (USD/KG)
TABLA 236 PRODUCTOS CÁRNICOS DE EE. UU. EN EL MERCADO DE ALIMENTOS LISTOS PARA CONSUMIR, POR TIPO, 2018-2032 (MILES DE USD)
TABLA 237 PRODUCTOS CÁRNICOS DE EE. UU. EN EL MERCADO DE ALIMENTOS LISTOS PARA CONSUMIR, POR TIPO, 2018-2032 (TONELADAS)
TABLA 238 PRODUCTOS CÁRNICOS DE EE. UU. EN EL MERCADO DE ALIMENTOS LISTOS PARA CONSUMIR, POR TIPO, 2018-2032 (USD/KG)
TABLA 239 PRODUCTOS A BASE DE CEREALES DE EE. UU. EN EL MERCADO DE ALIMENTOS LISTOS PARA CONSUMIR, POR TIPO, 2018-2032 (MILES DE USD)
TABLA 240 PRODUCTOS A BASE DE CEREALES EN EL MERCADO DE ALIMENTOS LISTOS PARA CONSUMIR DE EE. UU., POR TIPO, 2018-2032 (TONELADAS)
TABLA 241 PRODUCTOS A BASE DE CEREALES DE EE. UU. EN EL MERCADO DE ALIMENTOS LISTOS PARA CONSUMIR, POR TIPO, 2018-2032 (USD/KG)
TABLA 242 PRODUCTOS LÁCTEOS ESTADOUNIDENSES EN EL MERCADO DE ALIMENTOS LISTOS PARA CONSUMIR, POR TIPO, 2018-2032 (MILES DE USD)
TABLA 243 PRODUCTOS LÁCTEOS DE EE. UU. EN EL MERCADO DE ALIMENTOS LISTOS PARA CONSUMIR, POR TIPO, 2018-2032 (TONELADAS)
TABLA 244 PRODUCTOS LÁCTEOS ESTADOUNIDENSES EN EL MERCADO DE ALIMENTOS LISTOS PARA CONSUMIR, POR TIPO, 2018-2032 (USD/KG)
TABLA 245 QUESO ESTADOUNIDENSE EN EL MERCADO DE ALIMENTOS LISTOS PARA CONSUMIR, POR FORMA, 2018-2032 (MILES DE USD)
TABLA 246 QUESO ESTADOUNIDENSE EN EL MERCADO DE ALIMENTOS LISTOS PARA CONSUMIR, POR FORMA, 2018-2032 (TONELADAS)
TABLA 247 QUESO ESTADOUNIDENSE EN EL MERCADO DE ALIMENTOS LISTOS PARA CONSUMIR, POR FORMA, 2018-2032 (USD/KG)
TABLA 248 QUESO ESTADOUNIDENSE EN EL MERCADO DE ALIMENTOS LISTOS PARA CONSUMIR, POR TIPO, 2018-2032 (MILES DE USD)
TABLA 249 QUESO ESTADOUNIDENSE EN EL MERCADO DE ALIMENTOS LISTOS PARA CONSUMIR, POR TIPO, 2018-2032 (TONELADAS)
TABLA 250 QUESO ESTADOUNIDENSE EN EL MERCADO DE ALIMENTOS LISTOS PARA CONSUMIR, POR TIPO, 2018-2032 (USD/KG)
TABLA 251 QUESO DE ORIGEN ANIMAL DE EE. UU. EN EL MERCADO DE ALIMENTOS LISTOS PARA CONSUMIR, POR TIPO, 2018-2032 (MILES DE USD)
TABLA 252 QUESO VEGETAL ESTADOUNIDENSE EN EL MERCADO DE ALIMENTOS LISTOS PARA CONSUMIR, POR TIPO, 2018-2032 (MILES DE USD)
TABLA 253 HELADOS ESTADOUNIDENSES EN EL MERCADO DE ALIMENTOS LISTOS PARA CONSUMIR, POR TIPO, 2018-2032 (MILES DE USD)
TABLA 254 HELADOS DE EE. UU. EN EL MERCADO DE ALIMENTOS LISTOS PARA CONSUMIR, POR TIPO, 2018-2032 (TONELADAS)
TABLA 255 HELADOS ESTADOUNIDENSES EN EL MERCADO DE ALIMENTOS LISTOS PARA CONSUMIR, POR TIPO, 2018-2032 (USD/KG)
TABLA 256 CUAJADA ESTADOUNIDENSE EN EL MERCADO DE ALIMENTOS LISTOS PARA CONSUMIR, POR TIPO, 2018-2032 (MILES DE USD)
TABLA 257 CUAJADA ESTADOUNIDENSE EN EL MERCADO DE ALIMENTOS LISTOS PARA CONSUMIR, POR TIPO, 2018-2032 (TONELADAS)
TABLA 258 CUAJADA ESTADOUNIDENSE EN EL MERCADO DE ALIMENTOS LISTOS PARA CONSUMIR, POR TIPO, 2018-2032 (USD/KG)
TABLA 259 PANEER ESTADOUNIDENSE EN EL MERCADO DE ALIMENTOS LISTOS PARA CONSUMIR, POR TIPO, 2018-2032 (MILES DE USD)
TABLA 260 PANEER ESTADOUNIDENSE EN EL MERCADO DE ALIMENTOS LISTOS PARA CONSUMIR, POR TIPO, 2018-2032 (TONELADAS)
TABLA 261 PANEER ESTADOUNIDENSE EN EL MERCADO DE ALIMENTOS LISTOS PARA CONSUMIR, POR TIPO, 2018-2032 (USD/KG)
TABLA 262 GHEE ESTADOUNIDENSE EN EL MERCADO DE ALIMENTOS LISTOS PARA CONSUMIR, POR FUENTE, 2018-2032 (MILES DE USD)
TABLA 263 GHEE ESTADOUNIDENSE EN EL MERCADO DE ALIMENTOS LISTOS PARA CONSUMIR, POR FUENTE, 2018-2032 (TONELADAS)
TABLA 264 GHEE ESTADOUNIDENSE EN EL MERCADO DE ALIMENTOS LISTOS PARA CONSUMIR, POR FUENTE, 2018-2032 (USD/KG)
TABLA 265 PRODUCTOS DE PANADERÍA DE EE. UU. EN EL MERCADO DE ALIMENTOS LISTOS PARA CONSUMIR, POR TIPO, 2018-2032 (MILES DE USD)
TABLA 266 PRODUCTOS DE PANADERÍA DE EE. UU. EN EL MERCADO DE ALIMENTOS LISTOS PARA CONSUMIR, POR TIPO, 2018-2032 (TONELADAS)
TABLA 267 PRODUCTOS DE PANADERÍA DE EE. UU. EN EL MERCADO DE ALIMENTOS LISTOS PARA CONSUMIR, POR TIPO, 2018-2032 (USD/KG)
TABLA 268 DULCES SALADOS DE EE. UU. EN EL MERCADO DE ALIMENTOS LISTOS PARA CONSUMIR, POR TIPO, 2018-2032 (MILES DE USD)
TABLA 269 DULCES SALADOS DE EE. UU. EN EL MERCADO DE ALIMENTOS LISTOS PARA CONSUMIR, POR TIPO, 2018-2032 (TONELADAS)
TABLA 270 DULCES SALADOS ESTADOUNIDENSES EN EL MERCADO DE ALIMENTOS LISTOS PARA CONSUMIR, POR TIPO, 2018-2032 (USD/KG)
TABLA 271 PRODUCTOS DE CONFITERÍA DE EE. UU. EN EL MERCADO DE ALIMENTOS LISTOS PARA CONSUMIR, POR TIPO, 2018-2032 (MILES DE USD)
TABLA 272 PRODUCTOS DE CONFITERÍA DE EE. UU. EN EL MERCADO DE ALIMENTOS LISTOS PARA CONSUMIR, POR TIPO, 2018-2032 (TONELADAS)
TABLA 273 PRODUCTOS DE CONFITERÍA DE EE. UU. EN EL MERCADO DE ALIMENTOS LISTOS PARA CONSUMIR, POR TIPO, 2018-2032 (USD/KG)
TABLA 274 PRODUCTOS A BASE DE VEGETALES DE EE. UU. EN EL MERCADO DE ALIMENTOS LISTOS PARA CONSUMIR, POR TIPO, 2018-2032 (MILES DE USD)
TABLA 275 PRODUCTOS A BASE DE VEGETALES EN EL MERCADO DE ALIMENTOS LISTOS PARA CONSUMIR DE EE. UU., POR TIPO, 2018-2032 (TONELADAS)
TABLA 276 PRODUCTOS A BASE DE VEGETALES DE EE. UU. EN EL MERCADO DE ALIMENTOS LISTOS PARA CONSUMIR, POR TIPO, 2018-2032 (USD/KG)
TABLA 277 SOPAS INSTANTÁNEAS ESTADOUNIDENSES EN EL MERCADO DE ALIMENTOS LISTOS PARA CONSUMIR, POR TIPO, 2018-2032 (MILES DE USD)
TABLA 278 SOPAS INSTANTÁNEAS ESTADOUNIDENSES EN EL MERCADO DE ALIMENTOS LISTOS PARA CONSUMIR, POR TIPO, 2018-2032 (TONELADAS)
TABLA 279 SOPAS INSTANTÁNEAS ESTADOUNIDENSES EN EL MERCADO DE ALIMENTOS LISTOS PARA CONSUMIR, POR TIPO, 2018-2032 (USD/KG)
TABLA 280 APERITIVOS SALADOS ESTADOUNIDENSES EN EL MERCADO DE ALIMENTOS LISTOS PARA COMER, POR TIPO, 2018-2032 (MILES DE USD)
TABLA 281 APERITIVOS SALADOS DE EE. UU. EN EL MERCADO DE ALIMENTOS LISTOS PARA CONSUMIR, POR TIPO, 2018-2032 (TONELADAS)
TABLA 282 SNACKS SALADOS DE EE. UU. EN EL MERCADO DE ALIMENTOS LISTOS PARA CONSUMIR, POR TIPO, 2018-2032 (USD/KG)
TABLA 283 PAPAS FRITAS ESTADOUNIDENSES EN EL MERCADO DE ALIMENTOS LISTOS PARA CONSUMIR, POR TIPO, 2018-2032 (MILES DE USD)
TABLA 284 PAPAS FRITAS ESTADOUNIDENSES EN EL MERCADO DE ALIMENTOS LISTOS PARA CONSUMIR, POR TIPO, 2018-2032 (TONELADAS)
TABLA 285 PAPAS FRITAS ESTADOUNIDENSES EN EL MERCADO DE ALIMENTOS LISTOS PARA CONSUMIR, POR TIPO, 2018-2032 (USD/KG)
TABLA 286 OBLEAS ESTADOUNIDENSES EN EL MERCADO DE ALIMENTOS LISTOS PARA CONSUMIR, POR TIPO, 2018-2032 (MILES DE USD)
TABLA 287 OBLEAS ESTADOUNIDENSES EN EL MERCADO DE ALIMENTOS LISTOS PARA CONSUMIR, POR TIPO, 2018-2032 (TONELADAS)
TABLA 288 OBLEAS ESTADOUNIDENSES EN EL MERCADO DE ALIMENTOS LISTOS PARA CONSUMIR, POR TIPO, 2018-2032 (USD/KG)
TABLA 289 NÚMEROS ESTADOUNIDENSES EN EL MERCADO DE ALIMENTOS LISTOS PARA CONSUMIR, POR TIPO, 2018-2032 (MILES DE USD)
TABLA 290 NÚMEROS DE REFERENCIA DE EE. UU. EN EL MERCADO DE ALIMENTOS LISTOS PARA CONSUMIR, POR TIPO, 2018-2032 (TONELADAS)
TABLA 291 NÚMEROS ESTADOUNIDENSES EN EL MERCADO DE ALIMENTOS LISTOS PARA CONSUMIR, POR TIPO, 2018-2032 (USD/KG)
TABLA 292 GALLETAS Y GALLETAS ESTADOUNIDENSES EN EL MERCADO DE ALIMENTOS LISTOS PARA CONSUMIR, POR TIPO, 2018-2032 (MILES DE USD)
TABLA 293 GALLETAS Y GALLETAS ESTADOUNIDENSES EN EL MERCADO DE ALIMENTOS LISTOS PARA CONSUMIR, POR TIPO, 2018-2032 (TONELADAS)
TABLA 294 GALLETAS Y GALLETAS ESTADOUNIDENSES EN EL MERCADO DE ALIMENTOS LISTOS PARA CONSUMIR, POR TIPO, 2018-2032 (USD/KG)
TABLA 295 ALIMENTOS REFRIGERADOS DE EE. UU. EN EL MERCADO DE ALIMENTOS LISTOS PARA CONSUMIR, POR TIPO, 2018-2032 (MILES DE USD)
TABLA 296 ALIMENTOS REFRIGERADOS DE EE. UU. EN EL MERCADO DE ALIMENTOS LISTOS PARA CONSUMIR, POR TIPO, 2018-2032 (TONELADAS)
TABLA 297 ALIMENTOS REFRIGERADOS DE EE. UU. EN EL MERCADO DE ALIMENTOS LISTOS PARA CONSUMIR, POR TIPO, 2018-2032 (USD/KG)
TABLA 298 SNACKS DE CARNE DE ORIGEN VEGETAL EN EL MERCADO DE ALIMENTOS LISTOS PARA CONSUMIR DE EE. UU., POR TIPO, 2018-2032 (MILES DE USD)
TABLA 299 SNACKS DE CARNE DE ORIGEN VEGETAL EN EL MERCADO DE ALIMENTOS LISTOS PARA CONSUMIR DE EE. UU., POR TIPO, 2018-2032 (TONELADAS)
TABLA 300 SNACKS DE CARNE DE ORIGEN VEGETAL EN EL MERCADO DE ALIMENTOS LISTOS PARA CONSUMIR DE EE. UU., POR TIPO, 2018-2032 (USD/KG)
TABLA 301 SNACKS DE CARNE DE ORIGEN VEGETAL EN EL MERCADO DE ALIMENTOS LISTOS PARA CONSUMIR DE EE. UU., POR FUENTE, 2018-2032 (MILES DE USD)
TABLA 302 SNACKS DE CARNE DE ORIGEN VEGETAL EN EL MERCADO DE ALIMENTOS LISTOS PARA CONSUMIR DE EE. UU., POR FUENTE, 2018-2032 (TONELADAS)
TABLA 303 SNACKS DE CARNE DE ORIGEN VEGETAL EN EL MERCADO DE ALIMENTOS LISTOS PARA CONSUMIR DE EE. UU., POR FUENTE, 2018-2032 (USD/KG)
TABLA 304 COMIDAS LISTAS PARA COMER EN EL MERCADO DE ALIMENTOS LISTOS PARA COMER DE EE. UU., POR TIPO, 2018-2032 (MILES DE USD)
TABLA 305 COMIDAS LISTAS PARA COMER EN EL MERCADO DE ALIMENTOS LISTOS PARA COMER DE EE. UU., POR TIPO, 2018-2032 (TONELADAS)
TABLA 306 COMIDAS LISTAS PARA COMER EN EL MERCADO DE ALIMENTOS LISTOS PARA COMER DE EE. UU., POR TIPO, 2018-2032 (USD/KG)
TABLA 307 MERCADO DE ALIMENTOS LISTOS PARA CONSUMIR DE EE. UU., POR CATEGORÍA, 2018-2032 (MILES DE USD)
TABLA 308 MERCADO DE ESPECIALIDADES ESTADOUNIDENSES EN ALIMENTOS LISTOS PARA CONSUMIR, POR TIPO, 2018-2032 (MILES DE USD)
TABLA 309 MERCADO DE ALIMENTOS LISTOS PARA CONSUMIR DE EE. UU., POR TIPO DE ENVASE, 2018-2032 (MILES DE USD)
TABLA 310 BOTELLAS ESTADOUNIDENSES EN EL MERCADO DE ALIMENTOS LISTOS PARA CONSUMIR, POR TIPO, 2018-2032 (MILES DE USD)
TABLA 311 MERCADO DE ALIMENTOS LISTOS PARA CONSUMIR DE EE. UU., POR TAMAÑO DE ENVASE, 2018-2032 (MILES DE USD)
TABLA 312 MERCADO DE ALIMENTOS LISTOS PARA CONSUMIR DE EE. UU., POR TECNOLOGÍA DE ENVASE, 2018-2032 (MILES DE USD)
TABLA 313 MERCADO DE ALIMENTOS LISTOS PARA CONSUMIR DE EE. UU., POR TIPO DE ALMACENAMIENTO, 2018-2032 (MILES DE USD)
TABLA 314 MERCADO DE ALIMENTOS LISTOS PARA CONSUMIR DE EE. UU., POR CANAL DE DISTRIBUCIÓN, 2018-2032 (MILES DE USD)
TABLA 315 MERCADO DE ALIMENTOS LISTOS PARA CONSUMIR EN TIENDAS DE EE. UU., POR TIPO, 2018-2032 (MILES DE USD)
TABLA 316 MERCADO DE ALIMENTOS LISTOS PARA CONSUMIR SIN TIENDAS EN EE. UU., POR TIPO, 2018-2032 (MILES DE USD)
TABLA 317 MERCADO DE ALIMENTOS LISTOS PARA CONSUMIR DE EE. UU., POR USUARIO FINAL, 2018-2032 (MILES DE USD)
TABLA 318 SERVICIOS DE LA INDUSTRIA ALIMENTARIA DE EE. UU. EN EL MERCADO DE ALIMENTOS LISTOS PARA CONSUMIR, POR TIPO, 2018-2032 (MILES DE USD)
TABLA 319 RESTAURANTES ESTADOUNIDENSES EN EL MERCADO DE ALIMENTOS LISTO PARA COMER, POR TIPO, 2018-2032 (MILES DE USD)
TABLA 320 MERCADO DE ALIMENTOS LISTOS PARA CONSUMIR DE CANADÁ, POR TIPO DE PRODUCTO, 2018-2032 (MILES DE USD)
TABLA 321 MERCADO DE ALIMENTOS LISTOS PARA CONSUMIR DE CANADÁ, POR TIPO DE PRODUCTO, 2018-2032 (TONELADAS)
TABLA 322 MERCADO DE ALIMENTOS LISTOS PARA CONSUMIR DE CANADÁ, POR TIPO DE PRODUCTO, 2018-2032 (USD/KG)
TABLA 323 PRODUCTOS CÁRNICOS DE CANADÁ EN EL MERCADO DE ALIMENTOS LISTOS PARA CONSUMIR, POR TIPO, 2018-2032 (MILES DE USD)
TABLA 324 PRODUCTOS CÁRNICOS DE CANADÁ EN EL MERCADO DE ALIMENTOS LISTOS PARA CONSUMIR, POR TIPO, 2018-2032 (TONELADAS)
TABLA 325 PRODUCTOS CÁRNICOS DE CANADÁ EN EL MERCADO DE ALIMENTOS LISTOS PARA CONSUMIR, POR TIPO, 2018-2032 (USD/KG)
TABLA 326 PRODUCTOS A BASE DE CEREALES DE CANADÁ EN EL MERCADO DE ALIMENTOS LISTOS PARA CONSUMIR, POR TIPO, 2018-2032 (MILES DE USD)
TABLA 327 PRODUCTOS A BASE DE CEREALES DE CANADÁ EN EL MERCADO DE ALIMENTOS LISTOS PARA CONSUMIR, POR TIPO, 2018-2032 (TONELADAS)
TABLA 328 PRODUCTOS A BASE DE CEREALES EN EL MERCADO DE ALIMENTOS LISTOS PARA CONSUMIR DE CANADÁ, POR TIPO, 2018-2032 (USD/KG)
TABLA 329 PRODUCTOS LÁCTEOS DE CANADÁ EN EL MERCADO DE ALIMENTOS LISTOS PARA CONSUMIR, POR TIPO, 2018-2032 (MILES DE USD)
TABLA 330 PRODUCTOS LÁCTEOS DE CANADÁ EN EL MERCADO DE ALIMENTOS LISTOS PARA CONSUMIR, POR TIPO, 2018-2032 (TONELADAS)
TABLA 331 PRODUCTOS LÁCTEOS DE CANADÁ EN EL MERCADO DE ALIMENTOS LISTOS PARA CONSUMIR, POR TIPO, 2018-2032 (USD/KG)
TABLA 332 QUESO CANADIENSE EN EL MERCADO DE ALIMENTOS LISTOS PARA CONSUMIR, POR FORMA, 2018-2032 (MILES DE USD)
TABLA 333 QUESO CANADIENSE EN EL MERCADO DE ALIMENTOS LISTOS PARA CONSUMIR, POR FORMA, 2018-2032 (TONELADAS)
TABLA 334 QUESO CANADIENSE EN EL MERCADO DE ALIMENTOS LISTOS PARA CONSUMIR, POR FORMA, 2018-2032 (USD/KG)
TABLA 335 QUESO CANADIENSE EN EL MERCADO DE ALIMENTOS LISTOS PARA CONSUMIR, POR TIPO, 2018-2032 (MILES DE USD)
TABLA 336 QUESO CANADIENSE EN EL MERCADO DE ALIMENTOS LISTOS PARA CONSUMIR, POR TIPO, 2018-2032 (TONELADAS)
TABLA 337 QUESO CANADIENSE EN EL MERCADO DE ALIMENTOS LISTOS PARA CONSUMIR, POR TIPO, 2018-2032 (USD/KG)
TABLA 338 QUESO DE ORIGEN ANIMAL EN EL MERCADO DE ALIMENTOS LISTOS PARA CONSUMIR DE CANADÁ, POR TIPO, 2018-2032 (MILES DE USD)
TABLA 339 QUESO DE ORIGEN VEGETAL EN EL MERCADO DE ALIMENTOS LISTOS PARA CONSUMIR DE CANADÁ, POR TIPO, 2018-2032 (MILES DE USD)
TABLA 340 HELADOS DE CANADÁ EN EL MERCADO DE ALIMENTOS LISTOS PARA CONSUMIR, POR TIPO, 2018-2032 (MILES DE USD)
TABLA 341 HELADOS DE CANADÁ EN EL MERCADO DE ALIMENTOS LISTOS PARA CONSUMIR, POR TIPO, 2018-2032 (TONELADAS)
TABLA 342 HELADOS DE CANADÁ EN EL MERCADO DE ALIMENTOS LISTOS PARA CONSUMIR, POR TIPO, 2018-2032 (USD/KG)
TABLA 343 CUAJADA DE CANADÁ EN EL MERCADO DE ALIMENTOS LISTOS PARA CONSUMIR, POR TIPO, 2018-2032 (MILES DE USD)
TABLA 344 CUAJADA DE CANADÁ EN EL MERCADO DE ALIMENTOS LISTOS PARA CONSUMIR, POR TIPO, 2018-2032 (TONELADAS)
TABLA 345 CUAJADA DE CANADÁ EN EL MERCADO DE ALIMENTOS LISTOS PARA CONSUMIR, POR TIPO, 2018-2032 (USD/KG)
TABLA 346 PANEER DE CANADÁ EN EL MERCADO DE ALIMENTOS LISTOS PARA CONSUMIR, POR TIPO, 2018-2032 (MILES DE USD)
TABLA 347 PANEER DE CANADÁ EN EL MERCADO DE ALIMENTOS LISTOS PARA CONSUMIR, POR TIPO, 2018-2032 (TONELADAS)
TABLA 348. PANEER DE CANADÁ EN EL MERCADO DE ALIMENTOS LISTOS PARA CONSUMIR, POR TIPO, 2018-2032 (USD/KG)
TABLA 349 GHEE DE CANADÁ EN EL MERCADO DE ALIMENTOS LISTOS PARA CONSUMIR, POR FUENTE, 2018-2032 (MILES DE USD)
TABLA 350 GHEE DE CANADÁ EN EL MERCADO DE ALIMENTOS LISTOS PARA CONSUMIR, POR FUENTE, 2018-2032 (TONELADAS)
TABLA 351 GHEE EN EL MERCADO DE ALIMENTOS LISTOS PARA CONSUMIR DE CANADÁ, POR FUENTE, 2018-2032 (USD/KG)
TABLA 352 PRODUCTOS DE PANADERÍA EN EL MERCADO DE ALIMENTOS LISTOS PARA CONSUMIR DE CANADÁ, POR TIPO, 2018-2032 (MILES DE USD)
TABLA 353 PRODUCTOS DE PANADERÍA EN EL MERCADO DE ALIMENTOS LISTOS PARA CONSUMIR DE CANADÁ, POR TIPO, 2018-2032 (TONELADAS)
TABLA 354 PRODUCTOS DE PANADERÍA EN EL MERCADO DE ALIMENTOS LISTOS PARA CONSUMIR DE CANADÁ, POR TIPO, 2018-2032 (USD/KG)
TABLA 355 DULCES SALADOS EN EL MERCADO DE ALIMENTOS LISTOS PARA CONSUMIR DE CANADÁ, POR TIPO, 2018-2032 (MILES DE USD)
TABLA 356 DULCES SALADOS DE CANADÁ EN EL MERCADO DE ALIMENTOS LISTOS PARA CONSUMIR, POR TIPO, 2018-2032 (TONELADAS)
TABLA 357 DULCES SALADOS EN EL MERCADO DE ALIMENTOS LISTOS PARA CONSUMIR DE CANADÁ, POR TIPO, 2018-2032 (USD/KG)
TABLA 358 PRODUCTOS DE CONFITERÍA DE CANADÁ EN EL MERCADO DE ALIMENTOS LISTOS PARA CONSUMIR, POR TIPO, 2018-2032 (MILES DE USD)
TABLA 359 PRODUCTOS DE CONFITERÍA DE CANADÁ EN EL MERCADO DE ALIMENTOS LISTOS PARA CONSUMIR, POR TIPO, 2018-2032 (TONELADAS)
TABLA 360 PRODUCTOS DE CONFITERÍA DE CANADÁ EN EL MERCADO DE ALIMENTOS LISTOS PARA CONSUMIR, POR TIPO, 2018-2032 (USD/KG)
TABLA 361 PRODUCTOS A BASE DE VEGETALES EN EL MERCADO DE ALIMENTOS LISTOS PARA CONSUMIR DE CANADÁ, POR TIPO, 2018-2032 (MILES DE USD)
TABLA 362 PRODUCTOS A BASE DE VEGETALES EN EL MERCADO DE ALIMENTOS LISTOS PARA CONSUMIR DE CANADÁ, POR TIPO, 2018-2032 (TONELADAS)
TABLA 363 PRODUCTOS A BASE DE VEGETALES EN EL MERCADO DE ALIMENTOS LISTOS PARA CONSUMIR DE CANADÁ, POR TIPO, 2018-2032 (USD/KG)
TABLA 364 SOPAS INSTANTÁNEAS EN EL MERCADO DE ALIMENTOS LISTOS PARA CONSUMIR DE CANADÁ, POR TIPO, 2018-2032 (MILES DE USD)
Tabla 365 Sopas instantáneas de Canadá en el mercado de alimentos listos para consumir, por tipo, 2018-2032 (toneladas)
TABLA 366 SOPAS INSTANTÁNEAS EN EL MERCADO DE ALIMENTOS LISTOS PARA CONSUMIR DE CANADÁ, POR TIPO, 2018-2032 (USD/KG)
TABLA 367 SNACKS SALADOS EN EL MERCADO DE ALIMENTOS LISTOS PARA CONSUMIR DE CANADÁ, POR TIPO, 2018-2032 (MILES DE USD)
TABLA 368 SNACKS SALADOS DE CANADÁ EN EL MERCADO DE ALIMENTOS LISTOS PARA CONSUMIR, POR TIPO, 2018-2032 (TONELADAS)
TABLA 369 APERITIVOS SALADOS EN EL MERCADO DE ALIMENTOS LISTOS PARA CONSUMIR DE CANADÁ, POR TIPO, 2018-2032 (USD/KG)
TABLA 370 PAPAS FRITAS DE CANADÁ EN EL MERCADO DE ALIMENTOS LISTOS PARA CONSUMIR, POR TIPO, 2018-2032 (MILES DE USD)
TABLA 371 PAPAS FRITAS DE CANADÁ EN EL MERCADO DE ALIMENTOS LISTOS PARA CONSUMIR, POR TIPO, 2018-2032 (TONELADAS)
TABLA 372 PAPAS FRITAS DE CANADÁ EN EL MERCADO DE ALIMENTOS LISTOS PARA CONSUMIR, POR TIPO, 2018-2032 (USD/KG)
TABLA 373 OBLEAS DE CANADÁ EN EL MERCADO DE ALIMENTOS LISTOS PARA CONSUMIR, POR TIPO, 2018-2032 (MILES DE USD)
TABLA 374 OBLEAS DE CANADÁ EN EL MERCADO DE ALIMENTOS LISTOS PARA CONSUMIR, POR TIPO, 2018-2032 (TONELADAS)
TABLA 375 OBLEAS DE CANADÁ EN EL MERCADO DE ALIMENTOS LISTOS PARA CONSUMIR, POR TIPO, 2018-2032 (USD/KG)
TABLA 376 NÚMEROS DE CANADÁ EN EL MERCADO DE ALIMENTOS LISTOS PARA CONSUMIR, POR TIPO, 2018-2032 (MILES DE USD)
TABLA 377 NÚMEROS DE CANADÁ EN EL MERCADO DE ALIMENTOS LISTOS PARA CONSUMIR, POR TIPO, 2018-2032 (TONELADAS)
TABLA 378 NÚMEROS DE CANADÁ EN EL MERCADO DE ALIMENTOS LISTOS PARA CONSUMIR, POR TIPO, 2018-2032 (USD/KG)
TABLA 379 GALLETAS Y GALLETAS DE CANADÁ EN EL MERCADO DE ALIMENTOS LISTOS PARA CONSUMIR, POR TIPO, 2018-2032 (MILES DE USD)
TABLA 380 GALLETAS Y GALLETAS DE CANADÁ EN EL MERCADO DE ALIMENTOS LISTOS PARA CONSUMIR, POR TIPO, 2018-2032 (TONELADAS)
TABLA 381 GALLETAS Y GALLETAS DE CANADÁ EN EL MERCADO DE ALIMENTOS LISTOS PARA CONSUMIR, POR TIPO, 2018-2032 (USD/KG)
TABLA 382 ALIMENTOS REFRIGERADOS EN EL MERCADO DE ALIMENTOS LISTOS PARA CONSUMIR DE CANADÁ, POR TIPO, 2018-2032 (MILES DE USD)
TABLA 383 ALIMENTOS REFRIGERADOS EN EL MERCADO DE ALIMENTOS LISTOS PARA CONSUMIR DE CANADÁ, POR TIPO, 2018-2032 (TONELADAS)
TABLA 384 ALIMENTOS REFRIGERADOS EN EL MERCADO DE ALIMENTOS LISTOS PARA CONSUMIR DE CANADÁ, POR TIPO, 2018-2032 (USD/KG)
TABLA 385 SNACKS DE CARNE DE ORIGEN VEGETAL EN EL MERCADO DE ALIMENTOS LISTOS PARA CONSUMIR DE CANADÁ, POR TIPO, 2018-2032 (MILES DE USD)
TABLA 386 SNACKS DE CARNE DE ORIGEN VEGETAL EN EL MERCADO DE ALIMENTOS LISTOS PARA CONSUMIR DE CANADÁ, POR TIPO, 2018-2032 (TONELADAS)
TABLA 387 SNACKS DE CARNE DE ORIGEN VEGETAL EN EL MERCADO DE ALIMENTOS LISTOS PARA CONSUMIR DE CANADÁ, POR TIPO, 2018-2032 (USD/KG)
TABLA 388 SNACKS DE CARNE DE ORIGEN VEGETAL EN EL MERCADO DE ALIMENTOS LISTOS PARA CONSUMIR DE CANADÁ, POR FUENTE, 2018-2032 (MILES DE USD)
TABLA 389 SNACKS DE CARNE DE ORIGEN VEGETAL EN EL MERCADO DE ALIMENTOS LISTOS PARA CONSUMIR DE CANADÁ, POR FUENTE, 2018-2032 (TONELADAS)
TABLA 390 SNACKS DE CARNE DE ORIGEN VEGETAL EN EL MERCADO DE ALIMENTOS LISTOS PARA CONSUMIR DE CANADÁ, POR FUENTE, 2018-2032 (USD/KG)
TABLA 391 COMIDAS LISTAS PARA COMER EN EL MERCADO DE ALIMENTOS LISTOS PARA COMER DE CANADÁ, POR TIPO, 2018-2032 (MILES DE USD)
TABLA 392 COMIDAS LISTAS PARA COMER EN EL MERCADO DE ALIMENTOS LISTOS PARA COMER DE CANADÁ, POR TIPO, 2018-2032 (TONELADAS)
TABLA 393 COMIDAS LISTAS PARA COMER EN EL MERCADO DE ALIMENTOS LISTOS PARA COMER DE CANADÁ, POR TIPO, 2018-2032 (USD/KG)
TABLA 394 MERCADO DE ALIMENTOS LISTOS PARA CONSUMIR DE CANADÁ, POR CATEGORÍA, 2018-2032 (MILES DE USD)
TABLA 395 MERCADO DE ESPECIALIDADES DE CANADÁ EN ALIMENTOS LISTOS PARA CONSUMIR, POR TIPO, 2018-2032 (MILES DE USD)
TABLA 396 MERCADO DE ALIMENTOS LISTOS PARA CONSUMIR DE CANADÁ, POR TIPO DE ENVASE, 2018-2032 (MILES DE USD)
TABLA 397 BOTELLAS DE CANADÁ EN EL MERCADO DE ALIMENTOS LISTOS PARA CONSUMIR, POR TIPO, 2018-2032 (MILES DE USD)
TABLA 398 MERCADO DE ALIMENTOS LISTOS PARA CONSUMIR DE CANADÁ, POR TAMAÑO DE ENVASE, 2018-2032 (MILES DE USD)
TABLA 399 MERCADO DE ALIMENTOS LISTOS PARA CONSUMIR EN CANADÁ, POR TECNOLOGÍA DE ENVASE, 2018-2032 (MILES DE USD)
TABLA 400 MERCADO DE ALIMENTOS LISTOS PARA CONSUMIR DE CANADÁ, POR TIPO DE ALMACENAMIENTO, 2018-2032 (MILES DE USD)
TABLA 401 MERCADO DE ALIMENTOS LISTOS PARA CONSUMIR EN CANADÁ, POR CANAL DE DISTRIBUCIÓN, 2018-2032 (MILES DE USD)
TABLA 402 MERCADO DE ALIMENTOS LISTOS PARA CONSUMIR EN TIENDAS DE CANADÁ, POR TIPO, 2018-2032 (MILES DE USD)
TABLA 403 MERCADO DE ALIMENTOS LISTOS PARA CONSUMIR SIN TIENDAS DE CANADÁ, POR TIPO, 2018-2032 (MILES DE USD)
TABLA 404 MERCADO DE ALIMENTOS LISTOS PARA CONSUMIR EN CANADÁ, POR USUARIO FINAL, 2018-2032 (MILES DE USD)
TABLA 405 SERVICIOS DE LA INDUSTRIA ALIMENTARIA DE CANADÁ EN EL MERCADO DE ALIMENTOS LISTOS PARA CONSUMIR, POR TIPO, 2018-2032 (MILES DE USD)
TABLA 406 RESTAURANTES DE CANADÁ EN EL MERCADO DE ALIMENTOS LISTO PARA CONSUMIR, POR TIPO, 2018-2032 (MILES DE USD)
TABLA 407 MERCADO DE ALIMENTOS LISTOS PARA CONSUMIR EN MÉXICO, POR TIPO DE PRODUCTO, 2018-2032 (MILES DE USD)
TABLA 408 MERCADO DE ALIMENTOS LISTOS PARA CONSUMIR EN MÉXICO, POR TIPO DE PRODUCTO, 2018-2032 (TONELADAS)
TABLA 409 MERCADO DE ALIMENTOS LISTOS PARA CONSUMIR EN MÉXICO, POR TIPO DE PRODUCTO, 2018-2032 (USD/KG)
TABLA 410 PRODUCTOS CÁRNICOS DE MÉXICO EN EL MERCADO DE ALIMENTOS LISTOS PARA CONSUMIR, POR TIPO, 2018-2032 (MILES DE USD)
TABLA 411 PRODUCTOS CÁRNICOS DE MÉXICO EN EL MERCADO DE ALIMENTOS LISTOS PARA CONSUMIR, POR TIPO, 2018-2032 (TONELADAS)
TABLA 412 PRODUCTOS CÁRNICOS DE MÉXICO EN EL MERCADO DE ALIMENTOS LISTOS PARA CONSUMIR, POR TIPO, 2018-2032 (USD/KG)
TABLA 413 PRODUCTOS A BASE DE CEREALES EN EL MERCADO DE ALIMENTOS LISTOS PARA CONSUMIR DE MÉXICO, POR TIPO, 2018-2032 (MILES DE USD)
TABLA 414 PRODUCTOS A BASE DE CEREALES EN EL MERCADO DE ALIMENTOS LISTOS PARA CONSUMIR DE MÉXICO, POR TIPO, 2018-2032 (TONELADAS)
TABLA 415 PRODUCTOS A BASE DE CEREALES EN EL MERCADO DE ALIMENTOS LISTOS PARA CONSUMIR DE MÉXICO, POR TIPO, 2018-2032 (USD/KG)
TABLA 416 PRODUCTOS LÁCTEOS EN EL MERCADO DE ALIMENTOS LISTOS PARA CONSUMIR DE MÉXICO, POR TIPO, 2018-2032 (MILES DE USD)
TABLA 417 PRODUCTOS LÁCTEOS EN EL MERCADO DE ALIMENTOS LISTOS PARA CONSUMIR DE MÉXICO, POR TIPO, 2018-2032 (TONELADAS)
TABLA 418 PRODUCTOS LÁCTEOS EN EL MERCADO DE ALIMENTOS LISTOS PARA CONSUMIR DE MÉXICO, POR TIPO, 2018-2032 (USD/KG)
TABLA 419 QUESO MÉXICO EN EL MERCADO DE ALIMENTOS LISTOS PARA CONSUMIR, POR FORMA, 2018-2032 (MILES DE USD)
TABLA 420 QUESO MÉXICO EN EL MERCADO DE ALIMENTOS LISTOS PARA CONSUMIR, POR FORMA, 2018-2032 (TONELADAS)
TABLA 421 QUESO MÉXICO EN EL MERCADO DE ALIMENTOS LISTOS PARA CONSUMIR, POR FORMA, 2018-2032 (USD/KG)
TABLA 422 QUESO MÉXICO EN EL MERCADO DE ALIMENTOS LISTOS PARA CONSUMIR, POR TIPO, 2018-2032 (MILES DE USD)
TABLA 423 QUESO MÉXICO EN EL MERCADO DE ALIMENTOS LISTOS PARA CONSUMIR, POR TIPO, 2018-2032 (TONELADAS)
TABLA 424 QUESO MÉXICO EN EL MERCADO DE ALIMENTOS LISTOS PARA CONSUMIR, POR TIPO, 2018-2032 (USD/KG)
TABLA 425 QUESO DE ORIGEN ANIMAL EN EL MERCADO DE ALIMENTOS LISTOS PARA CONSUMIR DE MÉXICO, POR TIPO, 2018-2032 (MILES DE USD)
TABLA 426 QUESO VEGETAL EN EL MERCADO DE ALIMENTOS LISTOS PARA CONSUMIR DE MÉXICO, POR TIPO, 2018-2032 (MILES DE USD)
TABLA 427 HELADOS EN EL MERCADO DE ALIMENTOS LISTOS PARA CONSUMIR DE MÉXICO, POR TIPO, 2018-2032 (MILES DE USD)
TABLA 428 HELADOS EN EL MERCADO DE ALIMENTOS LISTOS PARA CONSUMIR DE MÉXICO, POR TIPO, 2018-2032 (TONELADAS)
TABLA 429 HELADOS DE MÉXICO EN EL MERCADO DE ALIMENTOS LISTOS PARA CONSUMIR, POR TIPO, 2018-2032 (USD/KG)
TABLA 430 CUAJADA DE MÉXICO EN EL MERCADO DE ALIMENTOS LISTOS PARA CONSUMIR, POR TIPO, 2018-2032 (MILES DE USD)
TABLA 431 CUAJADA DE MÉXICO EN EL MERCADO DE ALIMENTOS LISTOS PARA CONSUMIR, POR TIPO, 2018-2032 (TONELADAS)
TABLA 432 CUAJADA DE MÉXICO EN EL MERCADO DE ALIMENTOS LISTOS PARA CONSUMIR, POR TIPO, 2018-2032 (USD/KG)
TABLA 433 PANEER DE MÉXICO EN EL MERCADO DE ALIMENTOS LISTOS PARA CONSUMIR, POR TIPO, 2018-2032 (MILES DE USD)
TABLA 434 PANEER DE MÉXICO EN EL MERCADO DE ALIMENTOS LISTOS PARA CONSUMIR, POR TIPO, 2018-2032 (TONELADAS)
TABLA 435 PANEER DE MÉXICO EN EL MERCADO DE ALIMENTOS LISTOS PARA CONSUMIR, POR TIPO, 2018-2032 (USD/KG)
TABLA 436 GHEE DE MÉXICO EN EL MERCADO DE ALIMENTOS LISTOS PARA CONSUMIR, POR FUENTE, 2018-2032 (MILES DE USD)
TABLA 437 GHEE DE MÉXICO EN EL MERCADO DE ALIMENTOS LISTOS PARA CONSUMIR, POR FUENTE, 2018-2032 (TONELADAS)
TABLA 438 GHEE DE MÉXICO EN EL MERCADO DE ALIMENTOS LISTOS PARA CONSUMIR, POR FUENTE, 2018-2032 (USD/KG)
TABLA 439 PRODUCTOS DE PANADERÍA EN EL MERCADO DE ALIMENTOS LISTOS PARA CONSUMIR DE MÉXICO, POR TIPO, 2018-2032 (MILES DE USD)
TABLA 440 PRODUCTOS DE PANADERÍA EN EL MERCADO DE ALIMENTOS LISTOS PARA CONSUMIR DE MÉXICO, POR TIPO, 2018-2032 (TONELADAS)
TABLA 441 PRODUCTOS DE PANADERÍA EN EL MERCADO DE ALIMENTOS LISTOS PARA CONSUMIR DE MÉXICO, POR TIPO, 2018-2032 (USD/KG)
TABLA 442 DULCES SALADOS EN EL MERCADO DE ALIMENTOS LISTOS PARA CONSUMIR DE MÉXICO, POR TIPO, 2018-2032 (MILES DE USD)
TABLA 443 DULCES SALADOS DE MÉXICO EN EL MERCADO DE ALIMENTOS LISTOS PARA CONSUMIR, POR TIPO, 2018-2032 (TONELADAS)
TABLA 444 DULCES SALADOS DE MÉXICO EN EL MERCADO DE ALIMENTOS LISTOS PARA CONSUMIR, POR TIPO, 2018-2032 (USD/KG)
TABLA 445 PRODUCTOS DE CONFITERÍA EN EL MERCADO DE ALIMENTOS LISTOS PARA CONSUMIR DE MÉXICO, POR TIPO, 2018-2032 (MILES DE USD)
TABLA 446 PRODUCTOS DE CONFITERÍA EN EL MERCADO DE ALIMENTOS LISTOS PARA CONSUMIR DE MÉXICO, POR TIPO, 2018-2032 (TONELADAS)
TABLA 447 PRODUCTOS DE CONFITERÍA EN EL MERCADO DE ALIMENTOS LISTOS PARA CONSUMIR DE MÉXICO, POR TIPO, 2018-2032 (USD/KG)
TABLA 448 PRODUCTOS A BASE DE VEGETALES EN EL MERCADO DE ALIMENTOS LISTOS PARA CONSUMIR DE MÉXICO, POR TIPO, 2018-2032 (MILES DE USD)
TABLA 449 PRODUCTOS A BASE DE VEGETALES EN EL MERCADO DE ALIMENTOS LISTOS PARA CONSUMIR DE MÉXICO, POR TIPO, 2018-2032 (TONELADAS)
TABLA 450 PRODUCTOS A BASE DE VEGETALES EN EL MERCADO DE ALIMENTOS LISTOS PARA CONSUMIR DE MÉXICO, POR TIPO, 2018-2032 (USD/KG)
TABLA 451 SOPAS INSTANTÁNEAS EN EL MERCADO DE ALIMENTOS LISTOS PARA CONSUMIR DE MÉXICO, POR TIPO, 2018-2032 (MILES DE USD)
TABLA 452 SOPAS INSTANTÁNEAS EN EL MERCADO DE ALIMENTOS LISTOS PARA CONSUMIR DE MÉXICO, POR TIPO, 2018-2032 (TONELADAS)
TABLA 453 SOPAS INSTANTÁNEAS EN EL MERCADO DE ALIMENTOS LISTOS PARA CONSUMIR DE MÉXICO, POR TIPO, 2018-2032 (USD/KG)
TABLA 454 BOCADILLOS SALADOS EN EL MERCADO DE ALIMENTOS LISTOS PARA CONSUMIR DE MÉXICO, POR TIPO, 2018-2032 (MILES DE USD)
TABLA 455 BOCADILLOS SALADOS DE MÉXICO EN EL MERCADO DE ALIMENTOS LISTOS PARA CONSUMIR, POR TIPO, 2018-2032 (TONELADAS)
TABLA 456 BOCADILLOS SALADOS EN EL MERCADO DE ALIMENTOS LISTOS PARA CONSUMIR DE MÉXICO, POR TIPO, 2018-2032 (USD/KG)
TABLA 457 PAPAS FRITAS DE MÉXICO EN EL MERCADO DE ALIMENTOS LISTOS PARA CONSUMIR, POR TIPO, 2018-2032 (MILES DE USD)
TABLA 458 PAPAS FRITAS DE MÉXICO EN EL MERCADO DE ALIMENTOS LISTOS PARA CONSUMIR, POR TIPO, 2018-2032 (TONELADAS)
TABLA 459 PAPAS FRITAS DE MÉXICO EN EL MERCADO DE ALIMENTOS LISTOS PARA CONSUMIR, POR TIPO, 2018-2032 (USD/KG)
TABLA 460 OBLEAS DE MÉXICO EN EL MERCADO DE ALIMENTOS LISTOS PARA CONSUMIR, POR TIPO, 2018-2032 (MILES DE USD)
TABLA 461 OBLEAS DE MÉXICO EN EL MERCADO DE ALIMENTOS LISTOS PARA CONSUMIR, POR TIPO, 2018-2032 (TONELADAS)
TABLA 462 OBLEAS DE MÉXICO EN EL MERCADO DE ALIMENTOS LISTOS PARA CONSUMIR, POR TIPO, 2018-2032 (USD/KG)
TABLA 463 NÚMEROS DE MÉXICO EN EL MERCADO DE ALIMENTOS LISTOS PARA CONSUMIR, POR TIPO, 2018-2032 (MILES DE USD)
TABLA 464 NÚMEROS DE MÉXICO EN EL MERCADO DE ALIMENTOS LISTOS PARA CONSUMIR, POR TIPO, 2018-2032 (TONELADAS)
TABLA 465 NÚMEROS DE MÉXICO EN EL MERCADO DE ALIMENTOS LISTOS PARA CONSUMIR, POR TIPO, 2018-2032 (USD/KG)
TABLA 466 GALLETAS Y GALLETAS DE MÉXICO EN EL MERCADO DE ALIMENTOS LISTOS PARA CONSUMIR, POR TIPO, 2018-2032 (MILES DE USD)
TABLA 467 GALLETAS Y GALLETAS DE MÉXICO EN EL MERCADO DE ALIMENTOS LISTOS PARA CONSUMIR, POR TIPO, 2018-2032 (TONELADAS)
TABLA 468 GALLETAS Y GALLETAS DE MÉXICO EN EL MERCADO DE ALIMENTOS LISTOS PARA CONSUMIR, POR TIPO, 2018-2032 (USD/KG)
TABLA 469 ALIMENTOS REFRIGERADOS EN EL MERCADO DE ALIMENTOS LISTOS PARA CONSUMIR DE MÉXICO, POR TIPO, 2018-2032 (MILES DE USD)
TABLA 470 ALIMENTOS REFRIGERADOS EN EL MERCADO DE ALIMENTOS LISTOS PARA CONSUMIR DE MÉXICO, POR TIPO, 2018-2032 (TONELADAS)
TABLA 471 ALIMENTOS REFRIGERADOS EN EL MERCADO DE ALIMENTOS LISTOS PARA CONSUMIR DE MÉXICO, POR TIPO, 2018-2032 (USD/KG)
TABLA 472 BOCADILLOS DE CARNE DE ORIGEN VEGETAL EN EL MERCADO DE ALIMENTOS LISTOS PARA CONSUMIR DE MÉXICO, POR TIPO, 2018-2032 (MILES DE USD)
TABLA 473 BOCADILLOS DE CARNE DE ORIGEN VEGETAL EN EL MERCADO DE ALIMENTOS LISTOS PARA CONSUMIR DE MÉXICO, POR TIPO, 2018-2032 (TONELADAS)
TABLA 474 BOCADILLOS DE CARNE DE ORIGEN VEGETAL EN EL MERCADO DE ALIMENTOS LISTOS PARA CONSUMIR DE MÉXICO, POR TIPO, 2018-2032 (USD/KG)
TABLA 475 BOCADILLOS DE CARNE DE ORIGEN VEGETAL EN EL MERCADO DE ALIMENTOS LISTOS PARA CONSUMIR DE MÉXICO, POR FUENTE, 2018-2032 (MILES DE USD)
TABLA 476 BOCADILLOS DE CARNE DE ORIGEN VEGETAL EN EL MERCADO DE ALIMENTOS LISTOS PARA CONSUMIR DE MÉXICO, POR FUENTE, 2018-2032 (TONELADAS)
TABLA 477 BOCADILLOS DE CARNE DE ORIGEN VEGETAL EN EL MERCADO DE ALIMENTOS LISTOS PARA CONSUMIR DE MÉXICO, POR FUENTE, 2018-2032 (USD/KG)
TABLA 478 COMIDAS LISTAS PARA COMER EN EL MERCADO DE ALIMENTOS LISTOS PARA COMER DE MÉXICO, POR TIPO, 2018-2032 (MILES DE USD)
TABLA 479 COMIDAS LISTAS PARA CONSUMIR EN EL MERCADO DE ALIMENTOS LISTOS PARA CONSUMIR DE MÉXICO, POR TIPO, 2018-2032 (TONELADAS)
TABLA 480 COMIDAS LISTAS PARA CONSUMIR EN EL MERCADO DE ALIMENTOS LISTOS PARA CONSUMIR DE MÉXICO, POR TIPO, 2018-2032 (USD/KG)
TABLA 481 MERCADO DE ALIMENTOS LISTOS PARA CONSUMIR EN MÉXICO, POR CATEGORÍA, 2018-2032 (MILES DE USD)
TABLA 482 MERCADO DE ESPECIALIDADES DE MÉXICO EN ALIMENTOS LISTOS PARA CONSUMIR, POR TIPO, 2018-2032 (MILES DE USD)
TABLA 483 MERCADO DE ALIMENTOS LISTOS PARA CONSUMIR EN MÉXICO, POR TIPO DE ENVASE, 2018-2032 (MILES DE USD)
TABLA 484 ENVASES DE MÉXICO EN EL MERCADO DE ALIMENTOS LISTOS PARA CONSUMIR, POR TIPO, 2018-2032 (MILES DE USD)
TABLA 485 MERCADO DE ALIMENTOS LISTOS PARA CONSUMIR EN MÉXICO, POR TAMAÑO DE ENVASE, 2018-2032 (MILES DE USD)
TABLA 486 MERCADO DE ALIMENTOS LISTOS PARA CONSUMIR EN MÉXICO, POR TECNOLOGÍA DE ENVASE, 2018-2032 (MILES DE USD)
TABLA 487 MERCADO DE ALIMENTOS LISTOS PARA CONSUMIR EN MÉXICO, POR TIPO DE ALMACENAMIENTO, 2018-2032 (MILES DE USD)
TABLA 488 MERCADO DE ALIMENTOS LISTO PARA CONSUMIR EN MÉXICO, POR CANAL DE DISTRIBUCIÓN, 2018-2032 (MILES DE USD)
TABLA 489 MERCADO DE ALIMENTOS LISTOS PARA CONSUMIR EN TIENDAS DE MÉXICO, POR TIPO, 2018-2032 (MILES DE USD)
TABLA 490 MERCADO DE ALIMENTOS LISTOS PARA CONSUMIR SIN TIENDAS EN MÉXICO, POR TIPO, 2018-2032 (MILES DE USD)
TABLA 491 MERCADO DE ALIMENTOS LISTOS PARA CONSUMIR EN MÉXICO, POR USUARIO FINAL, 2018-2032 (MILES DE USD)
TABLA 492 SERVICIOS DE LA INDUSTRIA ALIMENTARIA EN EL MERCADO DE ALIMENTOS LISTOS PARA CONSUMIR, POR TIPO, 2018-2032 (MILES DE USD)
TABLA 493 RESTAURANTES DE MÉXICO EN EL MERCADO DE COMIDA LISTA PARA CONSUMIR, POR TIPO, 2018-2032 (MILES DE USD)
Lista de figuras
FIGURA 1 MERCADO DE ALIMENTOS LISTOS PARA COMER EN AMÉRICA DEL NORTE
FIGURA 2 MERCADO DE ALIMENTOS LISTOS PARA COMER EN AMÉRICA DEL NORTE: TRIANGULACIÓN DE DATOS
FIGURA 3 MERCADO DE ALIMENTOS LISTOS PARA CONSUMIR EN AMÉRICA DEL NORTE: ANÁLISIS DROC
FIGURA 4 MERCADO DE ALIMENTOS LISTOS PARA COMER EN AMÉRICA DEL NORTE: ANÁLISIS DEL MERCADO DE AMÉRICA DEL NORTE VS. REGIONAL
FIGURA 5 MERCADO DE ALIMENTOS LISTOS PARA COMER EN AMÉRICA DEL NORTE: ANÁLISIS DE INVESTIGACIÓN DE EMPRESAS
FIGURA 6 MERCADO DE ALIMENTOS LISTOS PARA CONSUMIR DE AMÉRICA DEL NORTE: MODELADO MULTIVARIADO
FIGURA 7 MERCADO DE ALIMENTOS LISTOS PARA COMER EN AMÉRICA DEL NORTE: DATOS DEMOGRÁFICOS DE LAS ENTREVISTAS
FIGURA 8 MERCADO DE ALIMENTOS LISTOS PARA CONSUMIR DE AMÉRICA DEL NORTE: CUADRÍCULA DE POSICIÓN DE MERCADO DBMR
FIGURA 9 MERCADO DE ALIMENTOS LISTOS PARA CONSUMIR DE AMÉRICA DEL NORTE: CUADRÍCULA DE COBERTURA DE APLICACIONES DEL MERCADO
FIGURA 10 MERCADO DE ALIMENTOS LISTOS PARA COMER EN AMÉRICA DEL NORTE: ANÁLISIS DE LA PARTICIPACIÓN DE LOS PROVEEDORES
FIGURA 11 MERCADO DE ALIMENTOS LISTOS PARA COMER EN AMÉRICA DEL NORTE: SEGMENTACIÓN
FIGURA 12 RESUMEN EJECUTIVO DE AMÉRICA DEL NORTE
FIGURA 13 DOCE SEGMENTOS COMPRENDEN EL MERCADO DE ALIMENTOS LISTOS PARA CONSUMIR DE AMÉRICA DEL NORTE, POR TIPO DE PRODUCTO
FIGURA 14 DECISIONES ESTRATÉGICAS
FIGURA 15 SE ESPERA QUE EL AUMENTO DE LAS HORAS DE TRABAJO Y LOS ESTILOS DE VIDA ACELERADOS IMPULSEN EL MERCADO DE ALIMENTOS LISTOS PARA COMER EN AMÉRICA DEL NORTE EN EL PERÍODO DE PRONÓSTICO
FIGURA 16 SE ESPERA QUE EL SEGMENTO DE PRODUCTOS DE CARNE REPRESENTE LA MAYOR PARTICIPACIÓN DEL MERCADO DE ALIMENTOS LISTOS PARA CONSUMIR DE AMÉRICA DEL NORTE EN 2025 Y 2032
FIGURA 17 LAS CINCO FUERZAS DE PORTER
FIGURA 18 ESCENARIO DE IMPORTACIÓN Y EXPORTACIÓN (MILES DE USD)
FIGURA 19 ANÁLISIS DE LA CADENA DE VALOR
FIGURA 20 MERCADO DE ALIMENTOS LISTOS PARA CONSUMIR EN AMÉRICA DEL NORTE, 2024-2032, PRECIO DE VENTA PROMEDIO (USD/KG)
FIGURA 21 IMPULSORES, RESTRICCIONES, OPORTUNIDADES Y DESAFÍOS PARA AMÉRICA DEL NORTE LISTO PARA EL MERCADO DE ALIMENTOS DEL ESTE
FIGURA 22 HORAS DE TRABAJO ANUALES
FIGURA 23 INGRESOS PERSONALES DISPONIBLES EN CHINA
FIGURA 24 MERCADO DE ALIMENTOS LISTOS PARA CONSUMIR EN AMÉRICA DEL NORTE: POR TIPO DE PRODUCTO, 2018-2032
FIGURA 25 MERCADO DE ALIMENTOS LISTOS PARA CONSUMIR EN AMÉRICA DEL NORTE: POR CATEGORÍA, 2018-2032
FIGURA 26 MERCADO DE ALIMENTOS LISTOS PARA CONSUMIR EN AMÉRICA DEL NORTE: POR TIPO DE ENVASE, 2024
FIGURA 27 MERCADO DE ALIMENTOS LISTOS PARA CONSUMIR EN AMÉRICA DEL NORTE: POR TAMAÑO DE ENVASE, 2024
FIGURA 28 MERCADO DE ALIMENTOS LISTOS PARA CONSUMIR EN AMÉRICA DEL NORTE: POR TECNOLOGÍA DE ENVASE, 2024
FIGURA 29 MERCADO DE ALIMENTOS LISTOS PARA CONSUMIR EN AMÉRICA DEL NORTE: POR TIPO DE ALMACENAMIENTO, 2018-2032
FIGURA 30 MERCADO DE ALIMENTOS LISTOS PARA CONSUMIR EN AMÉRICA DEL NORTE: POR CANAL DE DISTRIBUCIÓN, 2024
FIGURA 31 MERCADO DE ALIMENTOS LISTOS PARA CONSUMIR EN AMÉRICA DEL NORTE: POR USUARIO FINAL, 2024
FIGURA 32 MERCADO DE ALIMENTOS LISTOS PARA COMER EN AMÉRICA DEL NORTE: INSTANTÁNEA (2024)
FIGURA 33 MERCADO DE ALIMENTOS LISTOS PARA CONSUMIR EN AMÉRICA DEL NORTE: PARTICIPACIÓN DE LA EMPRESA 2024 (%)
Metodología de investigación
La recopilación de datos y el análisis del año base se realizan utilizando módulos de recopilación de datos con muestras de gran tamaño. La etapa incluye la obtención de información de mercado o datos relacionados a través de varias fuentes y estrategias. Incluye el examen y la planificación de todos los datos adquiridos del pasado con antelación. Asimismo, abarca el examen de las inconsistencias de información observadas en diferentes fuentes de información. Los datos de mercado se analizan y estiman utilizando modelos estadísticos y coherentes de mercado. Además, el análisis de la participación de mercado y el análisis de tendencias clave son los principales factores de éxito en el informe de mercado. Para obtener más información, solicite una llamada de un analista o envíe su consulta.
La metodología de investigación clave utilizada por el equipo de investigación de DBMR es la triangulación de datos, que implica la extracción de datos, el análisis del impacto de las variables de datos en el mercado y la validación primaria (experto en la industria). Los modelos de datos incluyen cuadrícula de posicionamiento de proveedores, análisis de línea de tiempo de mercado, descripción general y guía del mercado, cuadrícula de posicionamiento de la empresa, análisis de patentes, análisis de precios, análisis de participación de mercado de la empresa, estándares de medición, análisis global versus regional y de participación de proveedores. Para obtener más información sobre la metodología de investigación, envíe una consulta para hablar con nuestros expertos de la industria.
Personalización disponible
Data Bridge Market Research es líder en investigación formativa avanzada. Nos enorgullecemos de brindar servicios a nuestros clientes existentes y nuevos con datos y análisis que coinciden y se adaptan a sus objetivos. El informe se puede personalizar para incluir análisis de tendencias de precios de marcas objetivo, comprensión del mercado de países adicionales (solicite la lista de países), datos de resultados de ensayos clínicos, revisión de literatura, análisis de mercado renovado y base de productos. El análisis de mercado de competidores objetivo se puede analizar desde análisis basados en tecnología hasta estrategias de cartera de mercado. Podemos agregar tantos competidores sobre los que necesite datos en el formato y estilo de datos que esté buscando. Nuestro equipo de analistas también puede proporcionarle datos en archivos de Excel sin procesar, tablas dinámicas (libro de datos) o puede ayudarlo a crear presentaciones a partir de los conjuntos de datos disponibles en el informe.

