Us Spain The Uk France Germany And Italy Nut Market
Tamaño del mercado en miles de millones de dólares
Tasa de crecimiento anual compuesta (CAGR) :
% 
 USD
22.92 Billion
USD
31.35 Billion
2024
2032
USD
22.92 Billion
USD
31.35 Billion
2024
2032
| 2025 –2032 | |
| USD 22.92 Billion | |
| USD 31.35 Billion | |
| % | |
|
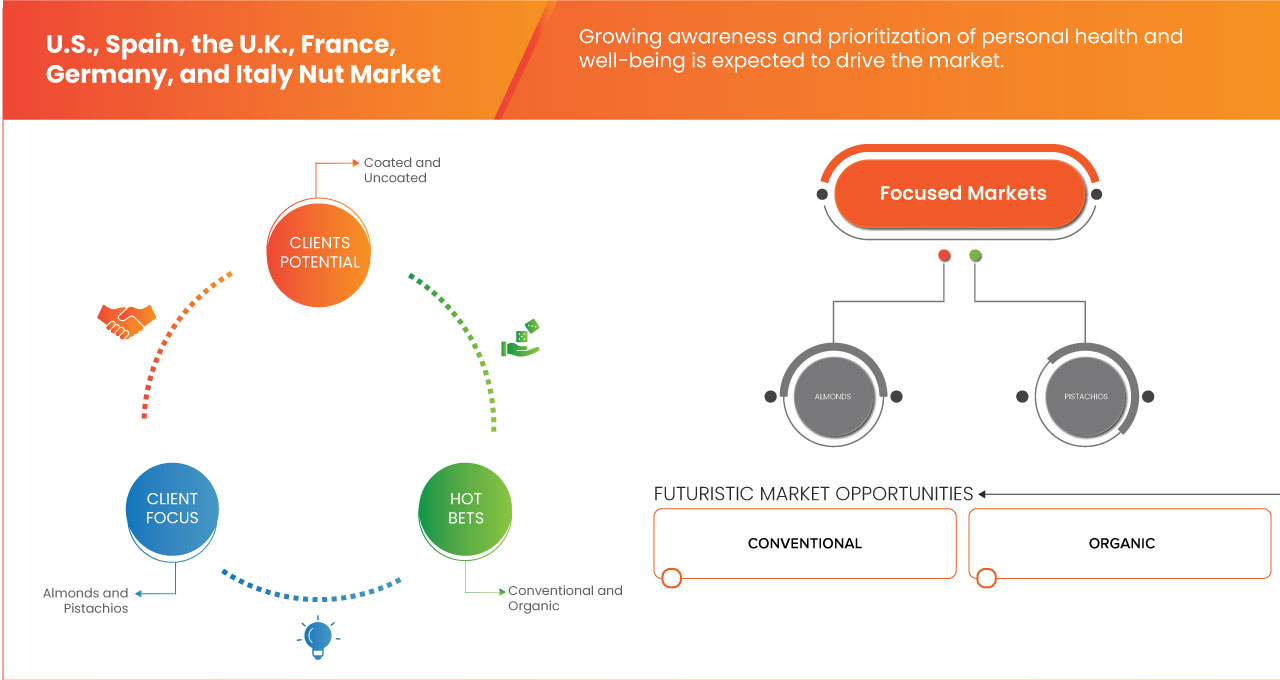
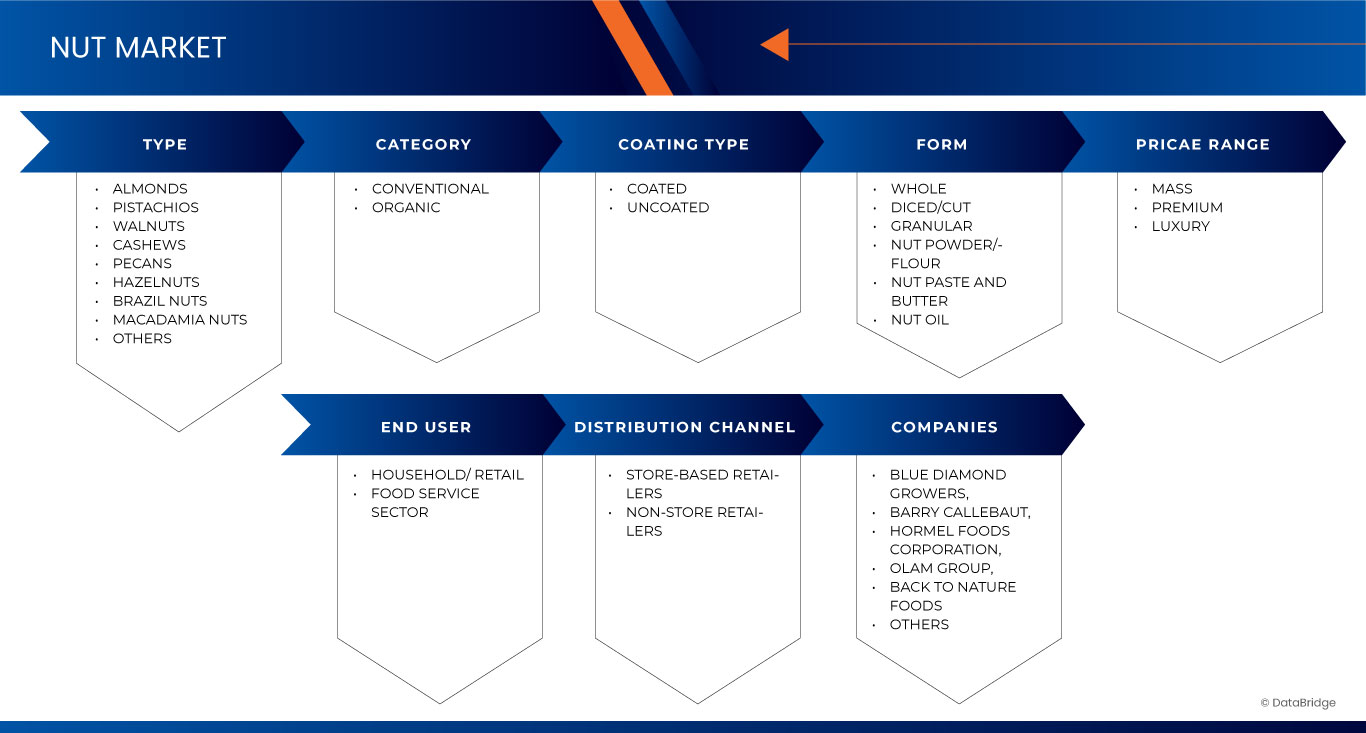
Segmentación del mercado de frutos secos en EE. UU., España, Reino Unido, Francia, Alemania e Italia: tipo (almendras, pistachos, nueces, anacardos, nueces pecanas, avellanas, nueces de Brasil, nueces de macadamia y otros), categoría (convencional y orgánico), tipo de recubrimiento (recubierto y sin recubrir), presentación (entero, en cubos/cortado, granulado, polvo/harina de frutos secos, pasta y mantequilla de frutos secos, y aceite de frutos secos), rango de precios (al por mayor, premium y de lujo), usuario final (hogar/minorista y sector de la restauración), canal de distribución (minoristas con y sin tienda física): tendencias del sector y pronóstico hasta 2032.
Tamaño del mercado de frutos secos
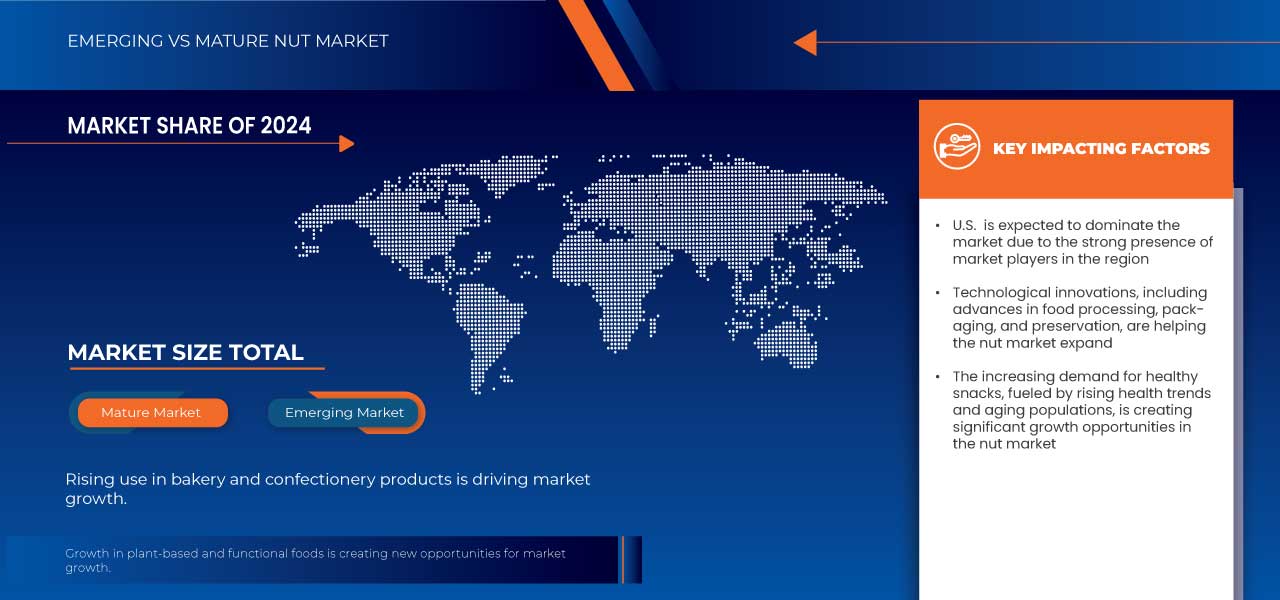
- El tamaño del mercado de frutos secos de EE. UU., España, Reino Unido, Francia, Alemania e Italia se valoró en USD 22,92 mil millones en 2024 y se espera que alcance los USD 31,35 mil millones para 2032 , con una CAGR del 4,1% durante el período de pronóstico.
- Este crecimiento está impulsado por factores como la creciente conciencia sobre la salud, la creciente demanda de fuentes de proteínas de origen vegetal y la creciente preferencia de los consumidores por opciones de refrigerios convenientes y ricos en nutrientes.
Análisis del mercado de frutos secos de EE. UU., España, Reino Unido, Francia, Alemania e Italia
- El mercado de frutos secos en Estados Unidos, España, Reino Unido, Francia, Alemania e Italia es un sector diverso y dinámico que se caracteriza por una sólida demanda de diversos tipos de frutos secos, incluidas almendras, nueces, avellanas y pistachos, impulsada por una creciente conciencia de la salud entre los consumidores y una creciente preferencia por los snacks de origen vegetal.
- En estos países, los factores importantes incluyen la creciente popularidad de los frutos secos como fuente saludable de proteínas y nutrientes esenciales, la expansión de canales de distribución como los supermercados y las ventas minoristas en línea, y ofertas de productos innovadores, incluidos formatos de bocadillos saborizados y convenientes.
- Se espera que Estados Unidos domine el mercado con una participación del 42,72%, debido a su gran base de consumidores, altos ingresos disponibles y creciente conciencia sobre la salud.
- Se espera que EE. UU. sea la región de más rápido crecimiento en el mercado durante el período de pronóstico debido a la creciente conciencia de los consumidores sobre los beneficios para la salud y la creciente demanda de refrigerios nutritivos.
- Se espera que el segmento de almendras domine el mercado con una participación de mercado del 34,5% debido a su amplia adopción clínica, rentabilidad y familiaridad procedimental entre radiólogos y cirujanos.
Alcance del informe y segmentación del mercado de frutos secos en EE. UU., España, Reino Unido, Francia, Alemania e Italia
|
Atributos |
EE. UU., España, Reino Unido, Francia, Alemania e Italia: Perspectivas clave del mercado |
|
Segmentos cubiertos |
|
|
Países cubiertos |
|
|
Actores clave del mercado |
|
|
Oportunidades de mercado |
|
|
Conjuntos de información de datos de valor añadido |
Además de los conocimientos sobre escenarios de mercado como valor de mercado, tasa de crecimiento, segmentación, cobertura geográfica y actores principales, los informes de mercado seleccionados por Data Bridge Market Research también incluyen análisis de importación y exportación, descripción general de la capacidad de producción, análisis del consumo de producción, análisis de tendencias de precios, escenario de cambio climático, análisis de la cadena de suministro, análisis de la cadena de valor, descripción general de materias primas/consumibles, criterios de selección de proveedores, análisis PESTLE, análisis de Porter y marco regulatorio. |
Tendencias del mercado de frutos secos en EE. UU., España, Reino Unido, Francia, Alemania e Italia
Creciente demanda de alternativas de refrigerios más saludables
- Una tendencia notable en el mercado de frutos secos en Estados Unidos, España, Reino Unido, Francia, Alemania e Italia es la creciente demanda de alternativas de refrigerios más saludables, lo que ha impulsado significativamente la popularidad de los frutos secos como una opción preferida.
- Este cambio se ve impulsado por una creciente conciencia sobre la salud y el bienestar, lo que lleva a los consumidores a buscar refrigerios vegetales ricos en nutrientes, con alto contenido de proteínas, fibra y grasas saludables. En EE. UU., la tendencia se inclina hacia el consumo de almendras y nueces, impulsada por sus supuestos beneficios para la salud.
- Por ejemplo, en 2024, Blue Diamond Growers lanzó una nueva línea de almendras saborizadas y bajas en sodio dirigida a consumidores preocupados por la salud y con hábitos de snacks para llevar.
- Mientras tanto, en España, el consumo de snacks tradicionales como los frutos secos tostados está en auge, sobre todo en entornos sociales. El Reino Unido, Francia, Alemania e Italia están experimentando un aumento de productos de frutos secos premium y orgánicos, dirigidos al consumidor consciente de su salud.
- Además, las innovaciones en sabores, envases y variedad de productos, incluidas las mezclas de frutos secos y los snacks a base de frutos secos, mejoran aún más el crecimiento del mercado en estas regiones.
Dinámica del mercado de frutos secos en EE. UU., España, Reino Unido, Francia, Alemania e Italia
Conductor
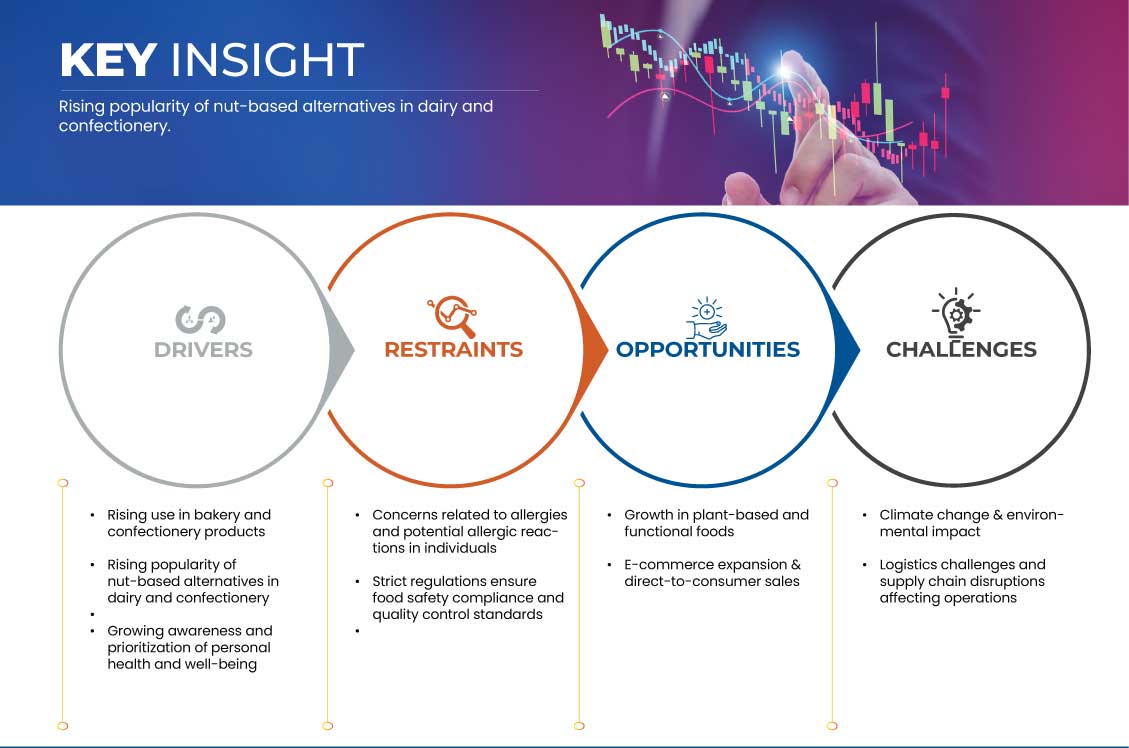
Uso creciente en productos de panadería y confitería
- A medida que las preferencias de los consumidores cambian hacia ingredientes premium, naturales y ricos en nutrientes, los frutos secos se han convertido en un componente integral para mejorar el sabor, la textura y el valor nutricional de los productos horneados y la confitería.
- El creciente énfasis en los productos de panadería artesanales y de alta calidad ha animado a los panaderos y pasteleros a incorporar una variedad de frutos secos, como almendras, nueces, avellanas y pistachos, en sus recetas.
- Estos ingredientes aportan un toque crujiente, un sabor intenso y un toque de exquisitez a pasteles, tartas, galletas y pan. En toda Europa, los frutos secos han sido un ingrediente básico en la repostería tradicional, como los croissants franceses de almendra, el panettone italiano y los panes alemanes con frutos secos. Mientras tanto, en EE. UU., la creciente demanda de productos horneados sin gluten y keto ha posicionado a los frutos secos como un ingrediente funcional clave.
Por ejemplo,
- En mayo de 2023, según un artículo publicado por ROHA Group, los frutos secos premium desempeñan un papel crucial en los productos de panadería y repostería, satisfaciendo la creciente demanda de ingredientes naturales y saludables. Las tecnologías avanzadas de secado, como la liofilización y el secado al aire, ayudan a preservar su rico sabor, textura y valor nutricional, garantizando una larga vida útil e innovación, y manteniendo a las empresas competitivas en la industria alimentaria en constante evolución.
- Según un artículo publicado por BC Campus, el creciente uso de frutos secos en panadería y repostería refleja la creciente demanda de ingredientes naturales y nutritivos por parte de los consumidores. Las almendras, las nueces, las pecanas y los pistachos realzan el sabor, la textura y los beneficios para la salud de pasteles, repostería y galletas.
- A medida que las tendencias cambian hacia la repostería saludable, los frutos secos siguen siendo esenciales tanto para las recetas clásicas como para las innovaciones modernas.
Oportunidad
Crecimiento de alimentos vegetales y funcionales
- La demanda de alimentos funcionales y de origen vegetal está creciendo rápidamente a medida que más personas buscan opciones más saludables y sostenibles.
- Los consumidores eligen productos de origen vegetal porque quieren mejorar su salud, contribuir al medio ambiente y evitar los productos animales. Los frutos secos son un ingrediente clave en muchos alimentos de origen vegetal, ya que aportan proteínas naturales, grasas saludables y nutrientes esenciales.
Por ejemplo,
- En febrero de 2025, un artículo publicado por NYP Holdings, Inc. destacó un estudio reciente que demuestra que las nueces, ricas en omega-3, mejoran la función cerebral y la memoria. A medida que los consumidores buscan alimentos funcionales para una mejor salud, frutos secos como las nueces y las almendras se están convirtiendo en ingredientes clave en productos vegetales, impulsando el crecimiento del mercado y satisfaciendo la demanda de opciones nutritivas y sostenibles.
- En enero de 2020, según un estudio de Healthline Media LLC, los cereales fortificados son un ejemplo de alimentos funcionales que aportan beneficios adicionales para la salud. A medida que los consumidores buscan opciones ricas en nutrientes, los productos vegetales enriquecidos con vitaminas, minerales y antioxidantes, como los snacks a base de frutos secos y las alternativas lácteas, impulsan el crecimiento del mercado y promueven hábitos alimenticios más saludables y sostenibles.
- Esta tendencia destaca la creciente demanda de opciones de alimentos innovadoras y orientadas a la salud que satisfagan las preferencias de los consumidores en cuanto a bienestar y sostenibilidad.
Restricción/Desafío
Cambio climático e impacto ambiental
- El cambio climático representa un gran desafío para la industria de los frutos secos. El aumento de las temperaturas, el clima impredecible y las sequías pueden dañar los árboles de frutos secos, dificultando que los agricultores produzcan cultivos saludables. Por ejemplo, las almendras necesitan mucha agua para crecer, por lo que las sequías pueden reducir la producción y aumentar los costos.
- Los fenómenos meteorológicos extremos, como tormentas y olas de calor, pueden dañar los cultivos y reducir el rendimiento. Las plagas y enfermedades también pueden propagarse con mayor facilidad en climas cambiantes, lo que aumenta la presión sobre los nogales. Todo esto reduce la fiabilidad de la producción de nueces y puede provocar un aumento de los precios.
- El cultivo de frutos secos también impacta el medio ambiente. Algunos cultivos, como las almendras, consumen grandes cantidades de agua, mientras que otros pueden provocar deforestación si no se gestionan de forma sostenible. Los consumidores prestan más atención a cómo se producen sus alimentos y eligen marcas que protegen el medio ambiente y utilizan prácticas agrícolas sostenibles.
Por ejemplo,
- En octubre de 2024, según un artículo publicado por Reuters, la cosecha de castañas de Grecia podría disminuir hasta en un 90 % debido a la sequía y el calor extremos. Esto pone de manifiesto cómo el cambio climático perjudica la producción de nueces, reduciendo el rendimiento y aumentando los precios. Los productores deben adaptarse con prácticas sostenibles para fortalecer su resiliencia ante las condiciones climáticas impredecibles.
- En noviembre de 2022, según un estudio publicado por arXiv, el cultivo de almendras requiere un alto consumo de agua, especialmente en regiones propensas a la sequía como California. Las prácticas insostenibles pueden agotar los recursos y dañar los ecosistemas. A medida que los consumidores buscan opciones ecológicas, los productores de frutos secos deben adoptar técnicas agrícolas sostenibles para equilibrar la producción con la responsabilidad ambiental.
- Por lo tanto, adoptar prácticas sostenibles es esencial para la viabilidad a largo plazo de la industria de los frutos secos, garantizando la conservación del medio ambiente y satisfaciendo al mismo tiempo la creciente demanda de los consumidores de productos ecológicos.
Análisis del mercado de frutos secos de EE. UU., España, Reino Unido, Francia, Alemania e Italia
El mercado está segmentado según tipo, categoría, tipo de recubrimiento, forma, rango de precios, uso final y canal de distribución.
|
Segmentación |
Subsegmentación |
|
Por tipo |
|
|
Por categoría |
|
|
Por tipo de recubrimiento |
|
|
Por formulario |
|
|
POR rango de precios |
|
|
Por uso final |
|
|
Por canal de distribución |
|
Se proyecta que en 2025 las almendras dominarán el mercado con la mayor participación en el segmento de tipo
Se prevé que el segmento de las almendras domine el mercado de frutos secos con la mayor cuota de mercado, un 42,09%, en 2025, gracias a su amplia popularidad como snack versátil y nutritivo. Las almendras son ricas en proteínas, fibra, grasas saludables y vitaminas esenciales, lo que las convierte en la opción preferida de los consumidores preocupados por su salud en regiones como Estados Unidos, España, Reino Unido, Francia, Alemania e Italia. Sus beneficios percibidos para la salud cardiovascular, el control de peso y el bienestar general han impulsado aún más la demanda. Además, su adaptabilidad a una variedad de productos, desde snacks crudos y tostados hasta bebidas y productos horneados a base de almendras, ha impulsado el crecimiento. La innovación continua en saborizantes, envases y formatos prácticos también contribuye a ampliar la base de consumidores y a mantener el liderazgo de las almendras en el mercado.
Se espera que el conjunto represente la mayor participación durante el período de pronóstico en el segmento Formulario
En 2025, se prevé que todo el segmento domine el mercado debido a la creciente preferencia de los consumidores por productos naturales, sin procesar y mínimamente manipulados. Además, la creciente concienciación sobre los beneficios para la salud asociados a los frutos secos enteros está impulsando su crecimiento.
Análisis regional del mercado de frutos secos en EE. UU., España, Reino Unido, Francia, Alemania e Italia
Estados Unidos tiene la mayor participación en el mercado de frutos secos
- Estados Unidos domina el mercado de frutos secos con una participación del 42,72% , impulsado por el alto consumo de almendras y nueces, las tendencias de snacks saludables y una fuerte producción nacional.
- La presencia de procesadores de frutos secos líderes y marcas como Blue Diamond Growers, Wonderful Pistachios & Almonds y Planters, junto con innovaciones en envases y productos de frutos secos saborizados, continúa impulsando la expansión del mercado.
- La creciente demanda de proteínas vegetales y snacks prácticos y nutritivos impulsa un mayor consumo en todos los grupos de edad y estilos de vida. A medida que aumenta la concienciación del consumidor sobre la salud y el bienestar, el mercado estadounidense continúa liderando tanto en producción como en innovación, consolidando su posición dominante.
Se proyecta que EE. UU. registre la CAGR más alta en el mercado de frutos secos
- Se espera que Estados Unidos sea testigo de la tasa de crecimiento más alta en el mercado de nueces , impulsada por la rápida expansión en la infraestructura de atención médica, la creciente conciencia sobre el cáncer de mama y los crecientes volúmenes de procedimientos.
- La creciente conciencia de los beneficios para la salud asociados con el consumo de frutos secos (como la salud cardíaca y el control del peso), combinada con una fuerte producción nacional y una creciente presencia minorista, está acelerando aún más el crecimiento del mercado.
- La tendencia hacia productos de etiqueta limpia, sin OGM y orgánicos también está impulsando la demanda, posicionando a Estados Unidos como un importante consumidor e innovador en la industria mundial de los frutos secos.
Cuota de mercado de frutos secos en EE. UU., España, Reino Unido, Francia, Alemania e Italia
El panorama competitivo del mercado ofrece detalles por competidor. Se incluye información general de la empresa, sus estados financieros, ingresos generados, potencial de mercado, inversión en investigación y desarrollo, nuevas iniciativas de mercado, presencia global, plantas de producción, capacidad de producción, fortalezas y debilidades de la empresa, lanzamiento de productos, alcance y variedad de productos, y dominio de las aplicaciones. Los datos anteriores se refieren únicamente al enfoque de mercado de las empresas.
Los principales líderes del mercado que operan en el mercado son:
- Blue Diamond Grower (EE. UU.)
- Barry Callebaut (Suiza)
- Hormel Foods, LLC (EE. UU.)
- Olam International (Singapur)
- Mariani Nut Company (EE. UU.)
- Back To Nature Foods Company Llc (EE. UU.)
- King Nut Company (EE. UU.)
- Nueces Grau (España)
- Terri Lynn (Estados Unidos)
- Tierra Farm (EE. UU.)
- Sun Organic Farms (EE. UU.)
- Century Snacks (EE. UU.)
- HBS Foods Ltd (Reino Unido)
- Fresh Nuts GmbH (EAU)
- Nueces de Andalucía (EE. UU.)
- Almendras Francisco Morales SA (España)
- Almendra Ibérica (España)
- Peyman (Turquía)
- Great Nuts (EE. UU.)
- Nueces del árbol Bapu (EE. UU.)
- Kariba Farms Inc. (EE. UU.)
- Sunburst Snacks (Reino Unido)
- Mis productos orgánicos (Australia)
- Lone Tree Nut Company, Inc. (EE. UU.)
- Sun Valley Nut, Llc (Reino Unido)
Últimos avances en el mercado de frutos secos de EE. UU., España, Reino Unido, Francia, Alemania e Italia
- En junio de 2024, Barry Callebaut obtuvo una inversión de 700 millones de euros para combatir el alza de los precios del cacao y garantizar así la estabilidad financiera. El aumento de los costes supone un reto para las pymes, aunque los fondos de la UE apoyan la innovación y la sostenibilidad. La financiación impulsa la I+D, las iniciativas ecológicas y una confitería más saludable. La industria se adapta a la volatilidad mientras se prepara para el crecimiento y la competencia futuros en un mercado global en evolución.
- En julio de 2024, Hormel Foods Corporation (NYSE: HRL) anunció que sus marcas de chile SPAM y STAGG ganaron premios por categoría en los premios Most Trusted Awards de 2024, otorgados por BrandSpark International. SPAM® obtuvo el primer puesto en fiambres enlatados, mientras que el chile STAGG ganó en la categoría de chile enlatado, lo que destaca la popularidad y la confianza de las marcas en Canadá.
- En mayo de 2023, The Kanan Enterprises, empresa matriz de King Nut y Peterson Nut Companies, obtuvo la certificación SQF nivel 2 de NSF International para su Planta n.º 1. Esta auditoría se realizó sin previo aviso. SQF significa Alimentos Seguros y de Calidad y certifica el sistema de gestión de calidad de King Nut. Esta auditoría se basa en Planes de Seguridad Alimentaria HACCP acreditados. SQF nivel 2 es una de las calificaciones más altas que una empresa de alimentos y panadería puede obtener en cuanto a calidad en esta prestigiosa auditoría.
- En octubre de 2024, SkinnyDipped lanzó sus tazas de mantequilla de cacahuete sin tapa, con un centro cremoso de mantequilla de cacahuete envuelto en una rica capa de chocolate negro. Con solo 3 g de azúcar por taza, estas delicias saludables ofrecen un capricho sin remordimientos.
SKU-
Obtenga acceso en línea al informe sobre la primera nube de inteligencia de mercado del mundo

- Panel de análisis de datos interactivo
- Panel de análisis de empresas para oportunidades con alto potencial de crecimiento
- Acceso de analista de investigación para personalización y consultas
- Análisis de la competencia con panel interactivo
- Últimas noticias, actualizaciones y análisis de tendencias
- Aproveche el poder del análisis de referencia para un seguimiento integral de la competencia
Tabla de contenido
1 INTRODUCCIÓN
1.1 OBJETIVOS DEL ESTUDIO
1.2 DEFINICIÓN DE MERCADO
1.3 INFORMACIÓN GENERAL
1.4 LIMITACIONES
1.5 MERCADOS CUBIERTOS
2 SEGMENTACIÓN DEL MERCADO
2.1 MERCADOS CUBIERTOS
2.2 ÁMBITO GEOGRÁFICO
2,3 AÑOS CONSIDERADOS PARA EL ESTUDIO
2.4 MONEDA Y PRECIOS
2.5 MODELO DE VALIDACIÓN DE DATOS TRÍPODE DBMR
2.6 MODELADO MULTIVARIADO
2.7 ENTREVISTAS PRINCIPALES CON LÍDERES DE OPINIÓN CLAVE
2.8 CUADRÍCULA DE POSICIÓN DE MERCADO DBMR
2.9 CUADRÍCULA DE COBERTURA DEL USUARIO FINAL
2.1 FUENTES SECUNDARIAS
2.11 SUPUESTOS
3 RESUMEN EJECUTIVO
4 INFORMACIÓN PREMIUM
4.1 ESCENARIO DE IMPORTACIÓN Y EXPORTACIÓN
4.2 APARIENCIA DE LA MARCA
4.3 ESCENARIO DE CAMBIO CLIMÁTICO
4.3.1 PREOCUPACIONES AMBIENTALES
4.3.2 RESPUESTA DE LA INDUSTRIA
4.3.3 EL PAPEL DEL GOBIERNO
4.3.4 SOLUCIONES ESTRATÉGICAS PARA UN MERCADO DE FRUTOS SECOS RESILIENTE
4.4 FACTORES QUE INFLUYEN EN LAS DECISIONES DE COMPRA DE FRUTOS SECOS DE LOS CLIENTES
4.4.1 BENEFICIOS PARA LA SALUD Y LA NUTRICIÓN:
4.4.2 CALIDAD Y FRESCURA DEL PRODUCTO:
4.4.3 PRECIO Y PERCEPCIÓN DEL VALOR:
4.4.4 REPUTACIÓN DE LA MARCA Y CONFIANZA:
4.4.5 CONVENIENCIA Y DISPONIBILIDAD:
4.4.6 EMBALAJE Y ATRACTIVO ESTÉTICO:
4.4.7 SOSTENIBILIDAD Y CONSIDERACIONES ÉTICAS:
4.4.8 PREFERENCIAS CULTURALES Y REGIONALES:
4.4.9 MARKETING Y PROMOCIONES:
4.4.10 EXPERIENCIA SENSORIAL E INNOVACIÓN GUSTATIVA:
4.5 IMPACTO DE LA DESACELERACIÓN ECONÓMICA EN EL MERCADO DE FRUTOS SECOS
4.5.1 IMPACTO EN EL PRECIO:
4.5.2 IMPACTO EN LA CADENA DE SUMINISTRO:
4.5.3 IMPACTO EN EL ENVÍO:
4.5.4 IMPACTO EN LAS DECISIONES ESTRATÉGICAS DE LA EMPRESA:
4.5.5 CONCLUSIÓN:
4.6 ESTRATEGIAS DE MARKETING ADOPTADAS POR LOS ACTORES CLAVE DEL MERCADO EN LA INDUSTRIA DE LOS FRUTOS SECOS
4.6.1 MARCA Y NARRACIÓN CENTRADAS EN LA SALUD:
4.6.2 INNOVACIÓN Y DIVERSIFICACIÓN DE PRODUCTOS:
4.6.3 MARKETING DIGITAL Y PARTICIPACIÓN EN REDES SOCIALES:
4.6.4 MODELOS DE COMERCIO ELECTRÓNICO Y DE VENTA DIRECTA AL CONSUMIDOR (DTC):
4.6.5 ASOCIACIONES MINORISTAS Y PROMOCIONES EN TIENDA:
4.6.6 CAMPAÑAS DE SOSTENIBILIDAD Y ABASTECIMIENTO ÉTICO:
4.6.7 PERSONALIZACIÓN BASADA EN DATOS Y CONOCIMIENTO DEL CONSUMIDOR:
4.6.8 EXPANSIÓN CON ESTRATEGIAS LOCALIZADAS:
4.6.9 MARKETING DE CAUSA Y PARTICIPACIÓN COMUNITARIA:
4.6.10 MARKETING DE CONTENIDOS Y CAMPAÑAS EDUCATIVAS:
4.7 ESTRATEGIA DE LANZAMIENTO DE NUEVOS PRODUCTOS
4.7.1 NÚMERO DE LANZAMIENTOS DE NUEVOS PRODUCTOS
4.7.2 EXTENSIÓN DE LÍNEA
4.7.3 EMBALAJE NUEVO
4.7.4 PRODUCTOS RELANZADOS
4.7.5 NUEVA FORMULACIÓN
4.7.6 CONCLUSIÓN
4.8 ANÁLISIS DE MARCA PRIVADA VS. MARCA
4.8.1 CUOTA DE MERCADO Y CRECIMIENTO
4.8.2 PERCEPCIONES Y COMPORTAMIENTO DEL CONSUMIDOR
4.8.3 ESTRATEGIAS E INNOVACIONES DE LOS MINORISTAS
4.8.4 RETOS Y DINÁMICAS COMPETITIVAS
4.8.5 PERSPECTIVAS FUTURAS
4.9 ANÁLISIS DE PRECIOS
4.9.1 RESUMEN DE LOS PRECIOS DE LOS FRUTOS SECOS
4.9.2 FACTORES QUE INFLUYEN EN LAS TENDENCIAS DE PRECIOS
4.9.3 VOLATILIDAD DE PRECIOS Y PERSPECTIVAS DEL MERCADO
4.9.4 CONCLUSIÓN
4.9.5 CAPACIDAD DE PRODUCCIÓN PARA LOS MEJORES FABRICANTES
4.1 RESUMEN DEL PRODUCTO VS. LA MARCA
4.11 ACTIVIDADES PROMOCIONALES
4.11.1 CAMPAÑAS DE MARKETING DIGITAL Y REDES SOCIALES
4.11.2 PROMOCIONES MINORISTAS Y ACTIVACIONES EN TIENDA
4.11.3 INICIATIVAS DE SALUD Y SOSTENIBILIDAD
4.11.4 INNOVACIÓN DE PRODUCTOS Y OFERTAS POR TIEMPO LIMITADO
4.11.5 CONCLUSIÓN
4.12 COMPORTAMIENTO Y DINÁMICA DE COMPRA
4.12.1 RECOMENDACIÓN DE FAMILIARES Y AMIGOS
4.12.2 INVESTIGACIÓN
4.12.3 COMPRAS IMPULSIVAS
4.12.4 PUBLICIDAD
4.12.5 PUBLICIDAD EN LÍNEA
4.12.6 PUBLICIDAD EN TIENDA
4.12.7 PUBLICIDAD EXTERIOR
4.13 ANÁLISIS DE LA CADENA DE SUMINISTRO PARA LA INDUSTRIA DE LOS FRUTOS SECOS
4.13.1 ESCENARIO DE COSTOS LOGÍSTICOS
4.13.2 IMPORTANCIA DE LOS PROVEEDORES DE SERVICIOS LOGÍSTICOS
4.13.3 CONCLUSIÓN
5 COBERTURA REGLAMENTARIA
6 PANORAMA GENERAL DEL MERCADO
6.1 CONDUCTORES
6.1.1 AUMENTO DEL USO EN PRODUCTOS DE PANADERÍA Y CONFITERÍA
6.1.2 AUMENTO DE LA POPULARIDAD DE LAS ALTERNATIVAS A BASE DE FRUTOS SECOS EN LÁCTEOS Y CONFITERÍA
6.1.3 CRECIENTE CONCIENCIA Y PRIORIZACIÓN DE LA SALUD Y EL BIENESTAR PERSONAL
6.2 RESTRICCIONES
6.2.1 PREOCUPACIONES RELACIONADAS CON LAS ALERGIAS Y POSIBLES REACCIONES ALÉRGICAS EN INDIVIDUOS
6.2.2 REGULACIONES ESTRICTAS GARANTIZAN EL CUMPLIMIENTO DE LA SEGURIDAD ALIMENTARIA Y LOS ESTÁNDARES DE CONTROL DE CALIDAD
6.3 OPORTUNIDADES
6.3.1 CRECIMIENTO EN ALIMENTOS DE ORIGEN VEGETAL Y FUNCIONALES
6.3.2 EXPANSIÓN DEL COMERCIO ELECTRÓNICO Y VENTAS DIRECTAS AL CONSUMIDOR
6.4 DESAFÍOS
6.4.1 CAMBIO CLIMÁTICO E IMPACTO AMBIENTAL
6.4.2 DESAFÍOS LOGÍSTICOS E INTERRUPCIONES DE LA CADENA DE SUMINISTRO QUE AFECTAN LAS OPERACIONES
7 MERCADO DE FRUTOS SECOS DE EE. UU., REINO UNIDO, ALEMANIA, FRANCIA, ESPAÑA E ITALIA, POR TIPO
7.1 INFORMACIÓN GENERAL
7.2 ALMENDRAS
7.3 CACAHUETES
7.4 NUEZ PECAN
7.5 ANACARDOS
7.6 PISTACHO
7.7 NUECES
7.8 MACADAMIA
7.9 AVELLANAS
7.1 NUECES DE BRASIL
7.11 OTROS
8 MERCADO DE FRUTOS SECOS EN EE. UU., REINO UNIDO, ALEMANIA, FRANCIA, ESPAÑA E ITALIA, POR CATEGORÍA
8.1 DESCRIPCIÓN GENERAL
8.2 CONVENCIONAL
8.2.1 ALMENDRAS
8.2.2 CACAHUETES
8.2.3 NUEZ PECAN
8.2.4 ANACARDOS
8.2.5 PISTACHO
8.2.6 NUECES
8.2.7 MACADAMIA
8.2.8 AVELLANAS
8.2.9 NUECES DE BRASIL
8.2.10 OTROS
8.3 ORGÁNICO
8.3.1 ALMENDRAS
8.3.2 CACAHUETES
8.3.3 NUEZ PECAN
8.3.4 ANACARDOS
8.3.5 PISTACHO
8.3.6 NUECES
8.3.7 MACADAMIA
8.3.8 AVELLANAS
8.3.9 NUEZ DE BRASIL
8.3.10 OTROS
9 MERCADO DE FRUTOS SECOS EN EE. UU., REINO UNIDO, ALEMANIA, FRANCIA, ESPAÑA E ITALIA, POR TIPO DE RECUBRIMIENTO
9.1 INFORMACIÓN GENERAL
9.2 RECUBIERTO
9.3 SIN RECUBRIMIENTO
10 MERCADO DE FRUTOS SECOS DE EE. UU., ESPAÑA, REINO UNIDO, FRANCIA, ALEMANIA E ITALIA, POR RANGO DE PRECIOS
10.1 INFORMACIÓN GENERAL
10.2 MASA
10.3 PREMIUM
10.4 LUJO
11 MERCADO DE FRUTOS SECOS DE EE. UU., ESPAÑA, REINO UNIDO, FRANCIA, ALEMANIA E ITALIA, POR FORMA
11.1 INFORMACIÓN GENERAL
11.2 ENTERO
11.3 CORTADO EN CUBITOS
11.4 GRANULAR
11.5 POLVO/HARINA DE FRUTOS SECOS
11.6 PASTA DE FRUTOS SECOS Y MANTEQUILLA
11.7 ACEITE DE NUEZ
12 MERCADO DE FRUTOS SECOS DE EE. UU., ESPAÑA, REINO UNIDO, FRANCIA, ALEMANIA E ITALIA, POR CANAL DE DISTRIBUCIÓN
12.1 INFORMACIÓN GENERAL
12.2 MINORISTAS CON TIENDAS
12.3 MINORISTAS SIN TIENDAS
13 MERCADO DE FRUTOS SECOS DE EE. UU., REINO UNIDO, ALEMANIA, FRANCIA, ESPAÑA E ITALIA, POR USO FINAL
13.1 INFORMACIÓN GENERAL
13.2 HOGAR/VENTA AL POR MENOR
13.3 SECTOR DE SERVICIOS DE ALIMENTOS
14. MERCADO DE FRUTOS SECOS DE EE. UU., ESPAÑA, REINO UNIDO, FRANCIA, ALEMANIA E ITALIA: PANORAMA EMPRESARIAL
14.1 ANÁLISIS DE ACCIONES DE LA EMPRESA: EE. UU.
14.2 ANÁLISIS DE ACCIONES DE EMPRESAS: ALEMANIA
14.3 ANÁLISIS DE ACCIONES DE EMPRESAS: ITALIA
14.4 ANÁLISIS DE LAS ACCIONES DE LA EMPRESA: FRANCIA
14.5 ANÁLISIS DE ACCIONES DE LA EMPRESA: REINO UNIDO
14.6 ANÁLISIS DE ACCIONES DE EMPRESAS: ESPAÑA
15 ANÁLISIS FODA
16 PERFIL DE LA EMPRESA
16.1 CULTIVADORES DE DIAMANTES AZULES
16.1.1 INSTANTÁNEA DE LA EMPRESA
16.1.2 PORTAFOLIO DE PRODUCTOS
16.1.3 DESARROLLO RECIENTE
16.2 BERRY CALLEBAUT.
16.2.1 INSTANTÁNEA DE LA EMPRESA
16.2.2 ANÁLISIS DE INGRESOS
16.2.3 PORTAFOLIO DE PRODUCTOS
16.2.4 DESARROLLO RECIENTE
16.3 CORPORACIÓN DE ALIMENTOS HORMEL
16.3.1 INSTANTÁNEA DE LA EMPRESA
16.3.2 ANÁLISIS DE INGRESOS
16.3.3 PORTAFOLIO DE PRODUCTOS
16.3.4 DESARROLLO RECIENTE
16.4 GRUPO OLAM
16.4.1 INSTANTÁNEA DE LA EMPRESA
16.4.2 ANÁLISIS DE INGRESOS
16.4.3 PORTAFOLIO DE PRODUCTOS
16.4.4 DESARROLLO RECIENTE
16.5 MARIANI NUT COMPANY
16.5.1 INSTANTÁNEA DE LA EMPRESA
16.5.2 PORTAFOLIO DE PRODUCTOS
16.5.3 DESARROLLO RECIENTE
16.6 ALIMENTOS DE REGRESO A LA NATURALEZA
16.6.1 INSTANTÁNEA DE LA EMPRESA
16.6.2 PORTAFOLIO DE PRODUCTOS
16.6.3 DESARROLLO RECIENTE
16.7 ALMENDRAS FRANCISCO MORALES SA
16.7.1 INSTANTÁNEA DE LA EMPRESA
16.7.2 PORTAFOLIO DE PRODUCTOS
16.7.3 DESARROLLO RECIENTE
16.8 NUECES DE ANDALUCÍA
16.8.1 INSTANTÁNEA DE LA EMPRESA
16.8.2 PORTAFOLIO DE PRODUCTOS
16.8.3 DESARROLLO RECIENTE
16.9 ALMENDRAS BAPU
16.9.1 INSTANTÁNEA DE LA EMPRESA
16.9.2 PORTAFOLIO DE PRODUCTOS
16.9.3 DESARROLLO RECIENTE
16.1 BOCADILLOS DEL SIGLO
16.10.1 INSTANTÁNEA DE LA EMPRESA
16.10.2 PORTAFOLIO DE PRODUCTOS
16.10.3 DESARROLLO RECIENTE
16.11 NUECES FRESCAS
16.11.1 INSTANTÁNEA DE LA EMPRESA
16.11.2 PORTAFOLIO DE PRODUCTOS
16.11.3 DESARROLLO RECIENTE
16.12 TUERCAS GRAU
16.12.1 INSTANTÁNEA DE LA EMPRESA
16.12.2 PORTAFOLIO DE PRODUCTOS
16.12.3 ACTUALIZACIONES RECIENTES
16.13 GRANDES NUECES
16.13.1 INSTANTÁNEA DE LA EMPRESA
16.13.2 PORTAFOLIO DE PRODUCTOS
16.13.3 DESARROLLO RECIENTE
16.14 HBS ALIMENTOS LTD.
16.14.1 INSTANTÁNEA DE LA EMPRESA
16.14.2 PORTAFOLIO DE PRODUCTOS
16.14.3 DESARROLLO RECIENTE
16.15 ALMENDRA IBÉRICA
16.15.1 INSTANTÁNEA DE LA EMPRESA
16.15.2 PORTAFOLIO DE PRODUCTOS
16.15.3 DESARROLLO RECIENTE
16.16 GRANJAS KARIBA INC.
16.16.1 INSTANTÁNEA DE LA EMPRESA
16.16.2 PORTAFOLIO DE PRODUCTOS
16.16.3 DESARROLLO RECIENTE
16.17 REY NUT
16.17.1 INSTANTÁNEA DE LA EMPRESA
16.17.2 PORTAFOLIO DE PRODUCTOS
16.17.3 DESARROLLO RECIENTE
16.18 Compañía de frutos secos Lone Tree, Inc.
16.18.1 INSTANTÁNEA DE LA EMPRESA
16.18.2 PORTAFOLIO DE PRODUCTOS
16.18.3 ACTUALIZACIONES RECIENTES
16.19 MIS ORGÁNICOS
16.19.1 INSTANTÁNEA DE LA EMPRESA
16.19.2 PORTAFOLIO DE PRODUCTOS
16.19.3 DESARROLLO RECIENTE
16.2 PEYMAN
16.20.1 INSTANTÁNEA DE LA EMPRESA
16.20.2 PRODUCT PORTFOLIO
16.20.3 RECENT DEVELOPMENT
16.21 SKINNYDIPPED.
16.21.1 COMPANY SNAPSHOT
16.21.2 PRODUCT PORTFOLIO
16.21.3 RECENT DEVELOPMENT
16.22 SUN ORGANIC FARM
16.22.1 COMPANY SNAPSHOT
16.22.2 PRODUCT PORTFOLIO
16.22.3 RECENT UPDATES
16.23 SUN VALLEY
16.23.1 COMPANY SNAPSHOT
16.23.2 PRODUCT PORTFOLIO
16.23.3 RECENT UPDATES
16.24 SUNBURST SNACKS
16.24.1 COMPANY SNAPSHOT
16.24.2 PRODUCT PORTFOLIO
16.24.3 RECENT DEVELOPMENT
16.25 TERRI LYNN
16.25.1 COMPANY SNAPSHOT
16.25.2 PRODUCT PORTFOLIO
16.25.3 RECENT UPDATES
16.26 TIERRA FARM
16.26.1 COMPANY SNAPSHOT
16.26.2 PRODUCT PORTFOLIO
16.26.3 RECENT UPDATES
17 QUESTIONNAIRE
18 RELATED REPORTS
Lista de Tablas
TABLA 1 ANÁLISIS COMPARATIVO DE MARCAS
TABLA 2 CAPACIDAD DE PRODUCCIÓN DE LOS PRINCIPALES FABRICANTES DE EE. UU.
TABLA 3 CAPACIDAD DE PRODUCCIÓN DE LOS PRINCIPALES FABRICANTES DE ALEMANIA
TABLA 4 CAPACIDAD DE PRODUCCIÓN DE LOS PRINCIPALES FABRICANTES EN ITALIA
TABLA 5 CAPACIDAD DE PRODUCCIÓN DE LOS PRINCIPALES FABRICANTES EN FRANCIA
TABLA 6 CAPACIDAD DE PRODUCCIÓN DE LOS PRINCIPALES FABRICANTES DEL REINO UNIDO
TABLA 7 CAPACIDAD DE PRODUCCIÓN DE LOS PRINCIPALES FABRICANTES EN ESPAÑA
CUADRO 8 COBERTURA REGULATORIA
TABLA 9 MERCADO DE FRUTOS SECOS DE EE. UU., POR TIPO, 2018-2032 (MILES DE USD)
TABLA 10 MERCADO DE FRUTOS SECOS DE EE. UU., POR TIPO, 2018-2032 (TONELADAS)
TABLA 11 MERCADO DE FRUTOS SECOS DE ALEMANIA, POR TIPO, 2018-2032 (MILES DE USD)
TABLA 12 MERCADO DE FRUTOS SECOS DE ALEMANIA, POR TIPO, 2018-2032 (TONELADAS)
TABLA 13 MERCADO DE FRUTOS SECOS DE ITALIA, POR TIPO, 2018-2032 (MILES DE USD)
TABLA 14 MERCADO DE FRUTOS SECOS DE ITALIA, POR TIPO, 2018-2032 (TONELADAS)
TABLA 15 MERCADO DE FRUTOS SECOS DE FRANCIA, POR TIPO, 2018-2032 (MILES DE USD)
CUADRO 16 MERCADO DE FRUTOS SECOS EN FRANCIA, POR TIPO, 2018-2032 (TONELADAS)
TABLA 17 MERCADO DE FRUTOS SECOS DEL REINO UNIDO, POR TIPO, 2018-2032 (MILES DE USD)
TABLA 18 MERCADO DE FRUTOS SECOS DEL REINO UNIDO, POR TIPO, 2018-2032 (TONELADAS)
TABLA 19 MERCADO DE FRUTOS SECOS, POR TIPO, 2018-2032 (MILES DE USD)
TABLA 20 MERCADO DE FRUTOS SECOS DE ESPAÑA, POR TIPO, 2018-2032 (TONELADAS)
TABLA 21 MERCADO DE FRUTOS SECOS DE EE. UU., POR CATEGORÍA, 2018-2032 (MILES DE USD)
TABLA 22 MERCADO DE FRUTOS SECOS DE EE. UU., POR CATEGORÍA, 2018-2032 (TONELADAS)
TABLA 23 MERCADO DE FRUTOS SECOS DE ALEMANIA, POR CATEGORÍA, 2018-2032 (MILES DE USD)
TABLA 24 MERCADO DE FRUTOS SECOS DE ALEMANIA, POR CATEGORÍA, 2018-2032 (TONELADAS)
TABLA 25 MERCADO DE FRUTOS SECOS DE ITALIA, POR CATEGORÍA, 2018-2032 (MILES DE USD)
TABLA 26 MERCADO DE FRUTOS SECOS DE ITALIA, POR CATEGORÍA, 2018-2032 (TONELADAS)
TABLA 27 MERCADO DE FRUTOS SECOS DE FRANCIA, POR CATEGORÍA, 2018-2032 (MILES DE USD)
CUADRO 28 MERCADO DE FRUTOS SECOS EN FRANCIA, POR CATEGORÍA, 2018-2032 (TONELADAS)
TABLA 29 MERCADO DE FRUTOS SECOS DEL REINO UNIDO, POR CATEGORÍA, 2018-2032 (MILES DE USD)
TABLA 30 MERCADO DE FRUTOS SECOS DEL REINO UNIDO, POR CATEGORÍA, 2018-2032 (TONELADAS)
TABLA 31 MERCADO DE FRUTOS SECOS DE ESPAÑA, POR CATEGORÍA, 2018-2032 (MILES DE USD)
TABLA 32 MERCADO DE FRUTOS SECOS DE ESPAÑA, POR CATEGORÍA, 20218-2032 (TONELADAS)
TABLA 33 MERCADO DE FRUTOS SECOS CONVENCIONALES DE EE. UU., POR TIPO DE FRUTO SECO, 2018-2032 (MILES DE USD)
TABLA 34 MERCADO DE FRUTOS SECOS CONVENCIONALES DE ALEMANIA, POR TIPO DE FRUTO SECO, 2018-2032 (MILES DE USD)
TABLA 35 MERCADO DE FRUTOS SECOS CONVENCIONALES DE ITALIA, POR TIPO DE FRUTO SECO, 2018-2032 (MILES DE USD)
CUADRO 36 MERCADO DE FRUTOS SECOS CONVENCIONALES DE FRANCIA, POR TIPO DE FRUTO SECO, 2018-2032 (MILES DE USD)
TABLA 37 MERCADO DE FRUTOS SECOS CONVENCIONALES DEL REINO UNIDO, POR TIPO DE FRUTO SECO, 2018-2032 (MILES DE USD)
TABLA 38 MERCADO DE FRUTOS SECOS CONVENCIONALES EN ESPAÑA, POR TIPO DE FRUTO SECO, 2018-2032 (MILES DE USD)
TABLA 39 MERCADO DE FRUTOS SECOS ORGÁNICOS DE EE. UU., POR TIPO DE FRUTO SECO, 2018-2032 (MILES DE USD)
TABLA 40 MERCADO DE FRUTOS SECOS ORGÁNICOS DE ALEMANIA, POR TIPO DE FRUTO SECO, 2018-2032 (MILES DE USD)
TABLA 41 MERCADO DE FRUTOS SECOS ORGÁNICOS DE ITALIA, POR TIPO DE FRUTO SECO, 2018-2032 (MILES DE USD)
TABLA 42 MERCADO DE FRUTOS SECOS ORGÁNICOS EN FRANCIA, POR TIPO DE FRUTO SECO, 2018-2032 (MILES DE USD)
TABLA 43 MERCADO DE FRUTOS SECOS ORGÁNICOS DEL REINO UNIDO, POR TIPO DE FRUTO SECO, 2018-2032 (MILES DE USD)
TABLA 44 MERCADO DE FRUTOS SECOS ORGÁNICOS EN ESPAÑA, POR TIPO DE FRUTO SECO, 2018-2032 (MILES DE USD)
TABLA 45 MERCADO DE FRUTOS SECOS DE EE. UU., POR TIPO DE RECUBRIMIENTO, 2018-2032 (MILES DE USD)
TABLA 46 MERCADO DE FRUTOS SECOS DE EE. UU., POR TIPO DE RECUBRIMIENTO, 2018-2032 (TONELADAS)
TABLA 47 MERCADO DE FRUTOS SECOS DE ALEMANIA, POR TIPO DE RECUBRIMIENTO, 2018-2032 (MILES DE USD)
TABLA 48 MERCADO DE FRUTOS SECOS DE ALEMANIA, POR TIPO DE RECUBRIMIENTO, 2018-2032 (TONELADAS)
TABLA 49 MERCADO DE FRUTOS SECOS DE ITALIA, POR TIPO DE RECUBRIMIENTO, 2018-2032 (MILES DE USD)
TABLA 50 MERCADO DE FRUTOS SECOS EN ITALIA, POR TIPO DE RECUBRIMIENTO, 2018-2032 (TONELADAS)
TABLA 51 MERCADO DE FRUTOS SECOS DE FRANCIA, POR TIPO DE RECUBRIMIENTO, 2018-2032 (MILES DE USD)
TABLA 52 MERCADO DE FRUTOS SECOS DE FRANCIA, POR TIPO DE RECUBRIMIENTO, 2018-2032 (TONELADAS)
TABLA 53 MERCADO DE FRUTOS SECOS DEL REINO UNIDO, POR TIPO DE RECUBRIMIENTO, 2018-2032 (MILES DE USD)
TABLA 54 MERCADO DE FRUTOS SECOS DEL REINO UNIDO, POR TIPO DE RECUBRIMIENTO, 2018-2032 (TONELADAS)
TABLA 55 MERCADO DE FRUTOS SECOS DE ESPAÑA, POR TIPO DE RECUBRIMIENTO, 2018-2032 (MILES DE USD)
TABLA 56 MERCADO DE FRUTOS SECOS DE ESPAÑA, POR TIPO DE RECUBRIMIENTO, 2018-2032 (TONELADAS)
TABLA 57 MERCADO DE FRUTOS SECOS RECUBIERTOS DE EE. UU., POR TIPO DE RECUBRIMIENTO, 2018-2032 (MILES DE USD)
TABLA 58 MERCADO DE FRUTOS SECOS RECUBIERTOS EN ALEMANIA, POR TIPO DE RECUBRIMIENTO, 2018-2032 (MILES DE USD)
TABLA 59 MERCADO DE FRUTOS SECOS RECUBIERTOS EN ITALIA, POR TIPO DE RECUBRIMIENTO, 2018-2032 (MILES DE USD)
TABLA 60 MERCADO DE FRUTOS SECOS RECUBIERTOS EN FRANCIA POR TIPO DE RECUBRIMIENTO, 2018-2032 (MILES DE USD)
TABLA 61 MERCADO DE FRUTOS SECOS RECUBIERTOS EN EL REINO UNIDO, POR TIPO DE RECUBRIMIENTO, 2018-2032 (MILES DE USD)
TABLA 62 MERCADO ESPAÑOL DE FRUTOS SECOS RECUBIERTOS, POR TIPO DE RECUBRIMIENTO, 2018-2032 (MILES DE USD)
TABLA 63 MERCADO DE AZÚCAR EN FRUTOS SECOS DE EE. UU., POR CONTENIDO DE AZÚCAR, 2018-2032 (MILES DE USD)
TABLA 64 MERCADO DE AZÚCAR EN FRUTOS SECOS DE ALEMANIA, POR CONTENIDO DE AZÚCAR, 2018-2032 (MILES DE USD)
TABLA 65 MERCADO DE AZÚCAR EN FRUTOS SECOS DE ITALIA, POR CONTENIDO DE AZÚCAR, 2018-2032 (MILES DE USD)
TABLA 66 MERCADO DE AZÚCAR EN FRUTOS SECOS DE FRANCIA, POR CONTENIDO DE AZÚCAR, 2018-2032 (MILES DE USD)
TABLA 67 MERCADO DE AZÚCAR EN FRUTOS SECOS DEL REINO UNIDO, POR CONTENIDO DE AZÚCAR, 2018-2032 (MILES DE USD)
TABLA 68 MERCADO ESPAÑOL DE AZÚCAR EN FRUTOS SECOS, POR CONTENIDO DE AZÚCAR, 2018-2032 (MILES DE USD)
TABLA 69 MERCADO DE FRUTOS SECOS RECUBIERTOS DE EE. UU., POR TIPO DE FRUTO SECO, 2018-2032 (MILES DE USD)
TABLA 70 MERCADO DE FRUTOS SECOS RECUBIERTOS EN ALEMANIA, POR TIPO DE FRUTO SECO, 2018-2032 (MILES DE USD)
TABLA 71 MERCADO DE FRUTOS SECOS RECUBIERTOS EN ITALIA, POR TIPO DE FRUTO SECO, 2018-2032 (MILES DE USD)
TABLA 72 MERCADO DE FRUTOS SECOS RECUBIERTOS EN FRANCIA, POR TIPO DE FRUTO SECO, 2018-2032 (MILES DE USD)
TABLA 73 MERCADO DE FRUTOS SECOS RECUBIERTOS EN EL REINO UNIDO, POR TIPO DE FRUTO SECO, 2018-2032 (MILES DE USD)
TABLA 74 MERCADO ESPAÑOL DE FRUTOS SECOS RECUBIERTOS, POR TIPO DE FRUTO SECO, 2018-2032 (MILES DE USD)
TABLA 75 MERCADO DE FRUTOS SECOS SIN RECUBRIMIENTO DE EE. UU., POR TIPO DE FRUTO SECO, 2018-2032 (MILES DE USD)
TABLA 76 MERCADO DE FRUTOS SECOS SIN RECUBRIMIENTO EN ALEMANIA, POR TIPO DE FRUTO SECO, 2018-2032 (MILES DE USD)
TABLA 77 MERCADO DE FRUTOS SECOS SIN RECUBRIMIENTO EN ITALIA, POR TIPO DE FRUTO SECO, 2018-2032 (MILES DE USD)
TABLA 78 MERCADO DE FRUTOS SECOS SIN RECUBRIMIENTO EN FRANCIA, POR TIPO DE FRUTO SECO, 2018-2032 (MILES DE USD)
TABLA 79 MERCADO DE FRUTOS SECOS SIN RECUBRIMIENTO DEL REINO UNIDO, POR TIPO DE FRUTO SECO, 2018-2032 (MILES DE USD)
TABLA 80 MERCADO DE FRUTOS SECOS SIN RECUBRIMIENTO EN ESPAÑA, POR TIPO DE FRUTO SECO, 2018-2032 (MILES DE USD)
TABLA 81 MERCADO DE FRUTOS SECOS DE EE. UU., POR RANGO DE PRECIOS, 2018-2032 (MILES DE USD)
TABLA 82 MERCADO DE FRUTOS SECOS DE EE. UU., POR RANGO DE PRECIOS, 2018-2032 (TONELADAS)
TABLA 83 MERCADO DE FRUTOS SECOS DE ALEMANIA, POR RANGO DE PRECIOS, 2018-2032 (MILES DE USD)
TABLA 84 MERCADO DE FRUTOS SECOS DE ALEMANIA, POR RANGO DE PRECIOS, 2018-2032 (TONELADAS)
TABLA 85 MERCADO DE FRUTOS SECOS DE ITALIA, POR RANGO DE PRECIOS, 2018-2032 (MILES DE USD)
TABLA 86 MERCADO DE FRUTOS SECOS EN ITALIA, POR RANGO DE PRECIOS, 2018-2032 (TONELADAS)
TABLA 87 MERCADO DE FRUTOS SECOS EN FRANCIA, POR RANGO DE PRECIOS, 2018-2032 (MILES DE USD)
CUADRO 88 MERCADO DE FRUTOS SECOS EN FRANCIA, POR RANGO DE PRECIOS, 2018-2032 (TONELADAS)
TABLA 89 MERCADO DE FRUTOS SECOS DEL REINO UNIDO, POR RANGO DE PRECIOS, 2018-2032 (MILES DE USD)
TABLA 90 MERCADO DE FRUTOS SECOS DEL REINO UNIDO, POR RANGO DE PRECIOS, 2018-2032 (TONELADAS)
TABLA 91 MERCADO DE FRUTOS SECOS DE ESPAÑA, POR RANGO DE PRECIOS, 2018-2032 (MILES DE USD)
TABLA 92 MERCADO DE FRUTOS SECOS, POR RANGO DE PRECIOS, 2018-2032 (TONELADAS)
TABLA 93 MERCADO DE FRUTOS SECOS DE EE. UU., POR FORMA, 2018-2032 (MILES DE USD)
TABLA 94 MERCADO DE FRUTOS SECOS DE EE. UU., POR FORMA, 2018-2032 (TONELADAS)
TABLA 95 MERCADO DE FRUTOS SECOS DE ALEMANIA, POR FORMA, 2018-2032 (MILES DE USD)
TABLA 96 MERCADO DE FRUTOS SECOS DE ALEMANIA, POR FORMA, 2018-2032 (TONELADAS)
TABLA 97 MERCADO DE FRUTOS SECOS DE ITALIA, POR FORMA, 2018-2032 (MILES DE USD)
TABLA 98 MERCADO DE FRUTOS SECOS DE ITALIA, POR FORMA, 2018-2032 (TONELADAS)
TABLA 99 MERCADO DE FRUTOS SECOS DE FRANCIA, POR FORMA, 2018-2032 (MILES DE USD)
CUADRO 100 MERCADO DE FRUTOS SECOS DE FRANCIA, POR FORMA, 2018-2032 (TONELADAS)
TABLA 101 MERCADO DE FRUTOS SECOS DEL REINO UNIDO, POR FORMA, 2018-2032 (MILES DE USD)
TABLA 102 MERCADO DE FRUTOS SECOS DEL REINO UNIDO, POR FORMA, 2018-2032 (TONELADAS)
TABLA 103 MERCADO DE FRUTOS SECOS, POR FORMA, 2018-2032 (MILES DE USD)
TABLA 104 MERCADO DE FRUTOS SECOS, POR FORMA, 2018-2032 (TONELADAS)
TABLA 105 MERCADO DE FRUTOS SECOS EN TOTAL EN EE. UU., POR TIPO DE FRUTO SECO, 2018-2032 (MILES DE USD)
TABLA 106 MERCADO DE FRUTOS SECOS EN ALEMANIA, POR TIPO DE FRUTO SECO, 2018-2032 (MILES DE USD)
TABLA 107 MERCADO DE FRUTOS SECOS EN ITALIA, POR TIPO DE FRUTO SECO, 2018-2032 (MILES DE USD)
TABLA 108 MERCADO DE FRUTOS SECOS EN FRANCIA, POR TIPO DE FRUTO SECO, 2018-2032 (MILES DE USD)
TABLA 109 MERCADO DE FRUTOS SECOS EN TODO EL REINO UNIDO, POR TIPO DE FRUTO SECO, 2018-2032 (MILES DE USD)
TABLA 110 MERCADO DE FRUTOS SECOS EN ESPAÑA, POR TIPO DE FRUTO SECO, 2018-2032 (MILES DE USD)
TABLA 111 MERCADO DE FRUTOS SECOS CORTADOS EN CUBITOS/CORTES DE EE. UU., POR TIPO DE FRUTO SECO, 2018-2032 (MILES DE USD)
TABLA 112 MERCADO DE FRUTOS SECOS EN CUBITOS/CORTEADOS DE ALEMANIA, POR TIPO DE FRUTO SECO, 2018-2032 (MILES DE USD)
TABLA 113 MERCADO DE FRUTOS SECOS EN CUBITOS/CORTEADOS DE ITALIA, POR TIPO DE FRUTO SECO, 2018-2032 (MILES DE USD)
TABLA 114 MERCADO DE FRUTOS SECOS EN CUBITOS/CORTES EN FRANCIA, POR TIPO DE FRUTO SECO, 2018-2032 (MILES DE USD)
TABLA 115 MERCADO DE FRUTOS SECOS CORTADOS EN CUBITOS/CORTES DEL REINO UNIDO, POR TIPO DE FRUTO SECO, 2018-2032 (MILES DE USD)
TABLA 116 MERCADO ESPAÑOL DE FRUTOS SECOS EN CUBITOS/TROZADOS, POR TIPO DE FRUTO SECO, 2018-2032 (MILES DE USD)
TABLA 117 MERCADO DE FRUTOS SECOS GRANULARES DE EE. UU., POR TIPO DE FRUTO SECO, 2018-2032 (MILES DE USD)
TABLA 118 MERCADO DE FRUTOS SECOS GRANULARES DE ALEMANIA, POR TIPO DE FRUTO SECO, 2018-2032 (MILES DE USD)
TABLA 119 MERCADO DE FRUTOS SECOS GRANULARES DE ITALIA, POR TIPO DE FRUTO SECO, 2018-2032 (MILES DE USD)
TABLA 120 MERCADO DE FRUTOS SECOS GRANULARES EN FRANCIA, POR TIPO DE FRUTO SECO, 2018-2032 (MILES DE USD)
TABLA 121 MERCADO DE FRUTOS SECOS GRANULARES DEL REINO UNIDO, POR TIPO DE FRUTO SECO, 2018-2032 (MILES DE USD)
TABLA 122 MERCADO DE FRUTOS SECOS GRANULARES EN ESPAÑA, POR TIPO DE FRUTO SECO, 2018-2032 (MILES DE USD)
TABLA 123 POLVO/HARINA DE FRUTOS SECOS EN EL MERCADO DE FRUTOS SECOS DE EE. UU., POR TIPO DE FRUTO SECO, 2018-2032 (MILES DE USD)
TABLA 124 POLVO/HARINA DE FRUTOS SECOS EN EL MERCADO DE FRUTOS SECOS DE ALEMANIA, POR TIPO DE FRUTO SECO, 2018-2032 (MILES DE USD)
TABLA 125 POLVO/HARINA DE FRUTOS SECOS DE ITALIA EN EL MERCADO DE FRUTOS SECOS, POR TIPO DE FRUTO SECO, 2018-2032 (MILES DE USD)
TABLA 126 POLVO/HARINA DE FRUTOS SECOS EN FRANCIA EN EL MERCADO DE FRUTOS SECOS, POR TIPO DE FRUTO SECO, 2018-2032 (MILES DE USD)
TABLA 127 POLVO/HARINA DE FRUTOS SECOS EN EL MERCADO DE FRUTOS SECOS DEL REINO UNIDO, POR TIPO DE FRUTO SECO, 2018-2032 (MILES DE USD)
TABLA 128 POLVO/HARINA DE NUEZ DE ESPAÑA EN EL MERCADO DE FRUTOS SECOS, POR TIPO DE FRUTO SECO, 2018-2032 (MILES DE USD)
TABLA 129 PASTA Y MANTEQUILLA DE FRUTOS SECOS EN EL MERCADO DE FRUTOS SECOS DE EE. UU., POR TIPO DE FRUTO SECO, 2018-2032 (MILES DE USD)
TABLA 130 PASTA Y MANTEQUILLA DE FRUTOS SECOS EN EL MERCADO DE FRUTOS SECOS DE ALEMANIA, POR TIPO DE FRUTO SECO, 2018-2032 (MILES DE USD)
TABLA 131 PASTA Y MANTEQUILLA DE FRUTOS SECOS DE ITALIA EN EL MERCADO DE FRUTOS SECOS, POR TIPO DE FRUTO SECO, 2018-2032 (MILES DE USD)
TABLA 132 PASTA Y MANTEQUILLA DE FRUTOS SECOS EN EL MERCADO DE FRUTOS SECOS DE FRANCIA, POR TIPO DE FRUTO SECO, 2018-2032 (MILES DE USD)
TABLA 133 PASTA Y MANTEQUILLA DE FRUTOS SECOS EN EL MERCADO DE FRUTOS SECOS DEL REINO UNIDO, POR TIPO DE FRUTO SECO, 2018-2032 (MILES DE USD)
TABLA 134 PASTA Y MANTEQUILLA DE CACAHUATE EN EL MERCADO DE FRUTOS SECOS, POR TIPO DE FRUTO SECO, 2018-2032 (MILES DE USD)
TABLA 135 ACEITE DE FRUTOS SECOS DE EE. UU. EN EL MERCADO DE FRUTOS SECOS, POR TIPO DE FRUTO SECO, 2018-2032 (MILES DE USD)
TABLA 136 ACEITE DE FRUTOS SECOS EN EL MERCADO DE FRUTOS SECOS DE ALEMANIA, POR TIPO DE FRUTO SECO, 2018-2032 (MILES DE USD)
TABLA 137 ACEITE DE FRUTOS SECOS DE ITALIA EN EL MERCADO DE FRUTOS SECOS, POR TIPO DE FRUTO SECO, 2018-2032 (MILES DE USD)
TABLA 138 ACEITE DE FRUTA EN EL MERCADO DE FRUTOS SECOS DE FRANCIA, POR TIPO DE FRUTO SECO, 2018-2032 (MILES DE USD)
TABLA 139 ACEITE DE FRUTOS SECOS EN EL MERCADO DE FRUTOS SECOS DEL REINO UNIDO, POR TIPO DE FRUTO SECO, 2018-2032 (MILES DE USD)
TABLA 140 ACEITE DE FRUTO SECO EN EL MERCADO DE FRUTOS SECOS, POR TIPO DE FRUTO SECO, 2018-2032 (MILES DE USD)
TABLA 141 MERCADO DE FRUTOS SECOS DE EE. UU., POR CANAL DE DISTRIBUCIÓN, 2018-2032 (MILES DE USD)
TABLA 142 MERCADO DE FRUTOS SECOS DE EE. UU., POR CANAL DE DISTRIBUCIÓN, 2018-2032 (TONELADAS)
TABLA 143 MERCADO DE FRUTOS SECOS DE ALEMANIA, POR CANAL DE DISTRIBUCIÓN, 2018-2032 (MILES DE USD)
TABLA 144 MERCADO DE FRUTOS SECOS DE ALEMANIA, POR CANAL DE DISTRIBUCIÓN, 2018-2032 (TONELADAS)
TABLA 145 MERCADO DE FRUTOS SECOS DE ITALIA, POR CANAL DE DISTRIBUCIÓN, 2018-2032 (MILES DE USD)
TABLA 146 MERCADO DE FRUTOS SECOS EN ITALIA, POR CANAL DE DISTRIBUCIÓN, 2018-2032 (TONELADAS)
TABLA 147 MERCADO DE FRUTOS SECOS EN FRANCIA, POR CANAL DE DISTRIBUCIÓN, 2018-2032 (MILES DE USD)
TABLA 148 MERCADO DE FRUTOS SECOS EN FRANCIA, POR CANAL DE DISTRIBUCIÓN, 2018-2032 (TONELADAS)
TABLA 149 MERCADO DE FRUTOS SECOS DEL REINO UNIDO, POR CANAL DE DISTRIBUCIÓN, 2018-2032 (MILES DE USD)
TABLA 150 MERCADO DE FRUTOS SECOS DEL REINO UNIDO, POR CANAL DE DISTRIBUCIÓN, 2018-2032 (TONELADAS)
TABLA 151 MERCADO DE FRUTOS SECOS DE ESPAÑA, POR CANAL DE DISTRIBUCIÓN, 2018-2032 (MILES DE USD)
TABLA 152 MERCADO DE FRUTOS SECOS DE ESPAÑA, POR CANAL DE DISTRIBUCIÓN, 2018-2032 (TONELADAS)
TABLA 153 MINORISTAS ESTADOUNIDENSES EN TIENDAS DEL MERCADO DE FRUTOS SECOS, POR TIPO, 2018-2032 (MILES DE USD)
TABLA 154 MINORISTAS EN TIENDAS DE ALEMANIA EN EL MERCADO DE FRUTOS SECOS, POR TIPO, 2018-2032 (MILES DE USD)
TABLA 155 MINORISTAS DE ITALIA EN TIENDAS DEL MERCADO DE FRUTOS SECOS, POR TIPO, 2018-2032 (MILES DE USD)
TABLA 156 MINORISTAS EN TIENDAS DE FRANCIA EN EL MERCADO DE FRUTOS SECOS, POR TIPO, 2018-2032 (MILES DE USD)
TABLA 157 MINORISTAS DEL REINO UNIDO EN EL MERCADO DE FRUTOS SECOS, POR TIPO, 2018-2032 (MILES DE USD)
TABLA 158 MINORISTAS EN TIENDAS FRUCTÍFERAS EN ESPAÑA, POR TIPO, 2018-2032 (MILES DE USD)
TABLA 159 TIENDAS DE COMESTIBLES TRADICIONALES DE EE. UU. EN EL MERCADO DE FRUTOS SECOS, POR TIPO, 2018-2032 (MILES DE USD)
TABLA 160 TIENDAS DE COMESTIBLES TRADICIONALES DE ALEMANIA EN EL MERCADO DE FRUTOS SECOS, POR TIPO, 2018-2032 (MILES DE USD)
TABLA 161 ITALIA TIENDAS DE COMESTIBLES TRADICIONALES EN EL MERCADO DE FRUTOS SECOS, POR TIPO, 2018-2032 (MILES DE USD)
TABLA 162 TIENDAS DE COMESTIBLES TRADICIONALES EN EL MERCADO DE FRUTOS SECOS DE FRANCIA, POR TIPO, 2018-2032 (MILES DE USD)
TABLA 163 TIENDAS DE COMESTIBLES TRADICIONALES DEL REINO UNIDO EN EL MERCADO DE FRUTOS SECOS, POR TIPO, 2018-2032 (MILES DE USD)
TABLA 164 ESPAÑA TIENDAS DE COMESTIBLES TRADICIONALES EN EL MERCADO DE FRUTOS SECOS, POR TIPO, 2018-2032 (MILES DE USD)
TABLA 165 MINORISTAS DE COMESTIBLES MODERNOS DE EE. UU. EN EL MERCADO DE FRUTOS SECOS, POR TIPO, 2018-2032 (MILES DE USD)
TABLA 166 ALEMANIA: MINORISTAS MODERNOS DE COMESTIBLES EN EL MERCADO DE FRUTOS SECOS, POR TIPO, 2018-2032 (MILES DE USD)
TABLA 167 MINORISTAS MODERNOS DE COMESTIBLES EN ITALIA EN EL MERCADO DE FRUTOS SECOS, POR TIPO, 2018-2032 (MILES DE USD)
TABLA 168 FRANCIA: MINORISTAS MODERNOS DE COMESTIBLES EN EL MERCADO DE FRUTOS SECOS, POR TIPO, 2018-2032 (MILES DE USD)
TABLA 169 MINORISTAS MODERNOS DE COMESTIBLES DEL REINO UNIDO EN EL MERCADO DE FRUTOS SECOS, POR TIPO, 2018-2032 (MILES DE USD)
TABLA 170. MINORISTAS MODERNOS DE COMESTIBLES EN EL MERCADO DE FRUTOS SECOS DE ESPAÑA, POR TIPO, 2018-2032 (MILES DE USD)
TABLA 171 MINORISTAS ESTADOUNIDENSES SIN TIENDAS EN EL MERCADO DE FRUTOS SECOS, POR TIPO, 2018-2032 (MILES DE USD)
TABLA 172 ALEMANIA: MINORISTAS SIN TIENDAS EN EL MERCADO DE FRUTOS SECOS, POR TIPO, 2018-2032 (MILES DE USD)
TABLA 173 ITALIA MINORISTAS SIN TIENDAS EN EL MERCADO DE FRUTOS SECOS, POR TIPO, 2018-2032 (MILES DE USD)
TABLA 174 FRANCIA MINORISTAS SIN TIENDAS EN EL MERCADO DE FRUTOS SECOS, POR TIPO, 2018-2032 (MILES DE USD)
TABLA 175 MINORISTAS DEL REINO UNIDO SIN TIENDAS EN EL MERCADO DE FRUTOS SECOS, POR TIPO, 2018-2032 (MILES DE USD)
TABLA 176 EMPRESAS MINORISTAS SIN TIENDA EN ESPAÑA EN EL MERCADO DE FRUTOS SECOS, POR TIPO, 2018-2032 (MILES DE USD)
TABLA 177 MERCADO DE FRUTOS SECOS DE EE. UU., POR USO FINAL, 2018-2032 (MILES DE USD)
TABLA 178 MERCADO DE FRUTOS SECOS DE EE. UU., POR USO FINAL, 2018-2032 (TONELADAS)
TABLA 179 MERCADO DE FRUTOS SECOS DE ALEMANIA, POR USO FINAL, 2018-2032 (MILES DE USD)
TABLA 180 MERCADO DE FRUTOS SECOS DE ALEMANIA, POR USO FINAL, 2018-2032 (TONELADAS)
TABLA 181 MERCADO DE FRUTOS SECOS DE ITALIA, POR USO FINAL, 2018-2032 (MILES DE USD)
TABLA 182 MERCADO DE FRUTOS SECOS DE ITALIA, POR USO FINAL, 2018-2032 (TONELADAS)
CUADRO 183 MERCADO DE FRUTOS SECOS DE FRANCIA, POR USO FINAL, 2018-2032 (MILES DE USD)
CUADRO 184 MERCADO DE FRUTOS SECOS DE FRANCIA, POR USO FINAL, 2018-2032 (TONELADAS)
TABLA 185 MERCADO DE FRUTOS SECOS DEL REINO UNIDO, POR USO FINAL, 2018-2032 (MILES DE USD)
TABLA 186 MERCADO DE FRUTOS SECOS DEL REINO UNIDO, POR USO FINAL, 2018-2032 (TONELADAS)
TABLA 187 MERCADO DE FRUTOS SECOS DE ESPAÑA, POR USO FINAL, 2018-2032 (MILES DE USD)
TABLA 188 MERCADO DE FRUTOS SECOS DE ESPAÑA, POR USO FINAL, 2018-2032 (TONELADAS)
TABLA 189 MERCADO DE FRUTOS SECOS EN HOGARES DE EE. UU./VENTA MINORISTA, POR TIPO DE FRUTOS SECOS, 2018-2032 (MILES DE USD)
TABLA 190 HOGARES ALEMANES/VENTA MINORISTA EN EL MERCADO DE FRUTOS SECOS, POR TIPO DE FRUTO SECO, 2018-2032 (MILES DE USD)
TABLA 191 ITALIA HOGARES/VENTA MINORISTA EN EL MERCADO DE FRUTOS SECOS, POR TIPO DE FRUTO SECO, 2018-2032 (MILES DE USD)
TABLA 192 FRANCIA HOGARES/VENTA AL POR MENOR EN EL MERCADO DE FRUTOS SECOS, POR TIPO DE FRUTO SECO, 2018-2032 (MILES DE USD)
TABLA 193 MERCADO DE FRUTOS SECOS EN EL REINO UNIDO, POR TIPO DE FRUTO SECO, 2018-2032 (MILES DE USD)
TABLA 194 HOGARES/VENTA AL POR MENOR EN EL MERCADO DE FRUTOS SECOS EN ESPAÑA, POR TIPO DE FRUTO SECO, 2018-2032 (MILES DE USD)
TABLA 195 MERCADO DE FRUTOS SECOS EN HOGARES DE EE. UU., POR TIPO DE ENVASE, 2018-2032 (MILES DE USD)
TABLA 196 MERCADO DE FRUTOS SECOS ALEMANIA, POR TIPO DE ENVASE, 2018-2032 (MILES DE USD)
TABLA 197 ITALIA HOGAR/VENTA MINORISTA EN EL MERCADO DE FRUTOS SECOS, POR TIPO DE ENVASE, 2018-2032 (MILES DE USD)
TABLA 198 FRANCIA HOGARES/VENTA AL POR MENOR EN EL MERCADO DE FRUTOS SECOS, POR TIPO DE ENVASE, 2018-2032 (MILES DE USD)
TABLA 199 MERCADO DE FRUTOS SECOS EN EL REINO UNIDO, POR TIPO DE ENVASE, 2018-2032 (MILES DE USD)
TABLA 200 MERCADO DE FRUTOS SECOS EN ESPAÑA, POR TIPO DE ENVASE, 2018-2032 (MILES DE USD)
TABLA 201 BOLSAS ESTADOUNIDENSES EN EL MERCADO DE FRUTOS SECOS, POR TIPO, 2018-2032 (MILES DE USD)
TABLA 202 BOLSAS DE ALEMANIA EN EL MERCADO DE FRUTOS SECOS, POR TIPO, 2018-2032 (MILES DE USD)
TABLA 203 BOLSAS DE ITALIA EN EL MERCADO DE FRUTOS SECOS, POR TIPO, 2018-2032 (MILES DE USD)
TABLA 204 BOLSAS DE FRANCIA EN EL MERCADO DE FRUTOS SECOS, POR TIPO, 2018-2032 (MILES DE USD)
TABLA 205 BOLSAS DE FRUTOS SECOS EN EL REINO UNIDO, POR TIPO, 2018-2032 (MILES DE USD)
TABLA 206 BOLSAS DE ESPAÑA EN EL MERCADO DE FRUTOS SECOS, POR TIPO, 2018-2032 (MILES DE USD)
TABLA 207 BOLSAS ESTADOUNIDENSES EN EL MERCADO DE FRUTOS SECOS, POR TIPO, 2018-2032 (MILES DE USD)
TABLA 208 BOLSAS DE ALEMANIA EN EL MERCADO DE FRUTOS SECOS, POR TIPO, 2018-2032 (MILES DE USD)
TABLA 209 BOLSAS DE ITALIA EN EL MERCADO DE FRUTOS SECOS, POR TIPO, 2018-2032 (MILES DE USD)
TABLA 210 BOLSAS DE FRANCIA EN EL MERCADO DE FRUTOS SECOS, POR TIPO, 2018-2032 (MILES DE USD)
TABLA 211 BOLSAS DE FRUTOS SECOS EN EL MERCADO DEL REINO UNIDO, POR TIPO, 2018-2032 (MILES DE USD)
TABLA 212 BOLSAS DE ESPAÑA EN EL MERCADO DE FRUTOS SECOS, POR TIPO, 2018-2032 (MILES DE USD)
TABLA 213 MERCADO DE FRUTOS SECOS EN HOGARES DE EE. UU./VENTA MINORISTA, POR TAMAÑO DE ENVASE, 2018-2032 (MILES DE USD)
TABLA 214 MERCADO DE FRUTOS SECOS ALEMANIA, POR TAMAÑO DE ENVASE, 2018-2032 (MILES DE USD)
TABLA 215 ITALIA HOGAR/VENTA MINORISTA EN EL MERCADO DE FRUTOS SECOS, POR TAMAÑO DE ENVASE, 2018-2032 (MILES DE USD)
TABLA 216 FRANCIA HOGARES/VENTA AL POR MENOR EN EL MERCADO DE FRUTOS SECOS, POR TAMAÑO DE ENVASE, 2018-2032 (MILES DE USD)
TABLA 217 MERCADO DE FRUTOS SECOS EN EL REINO UNIDO, POR TAMAÑO DE ENVASE, 2018-2032 (MILES DE USD)
TABLA 218 MERCADO DE FRUTOS SECOS EN ESPAÑA, POR TAMAÑO DE ENVASE, 2018-2032 (MILES DE USD)
TABLA 219 SECTOR DE SERVICIOS DE ALIMENTOS DE EE. UU. EN EL MERCADO DE FRUTOS SECOS, POR TIPO, 2018-2032 (MILES DE USD)
TABLA 220 SECTOR DE SERVICIOS DE ALIMENTACIÓN EN ALEMANIA EN EL MERCADO DE FRUTOS SECOS, POR TIPO, 2018-2032 (MILES DE USD)
TABLA 221 SECTOR DE SERVICIOS DE ALIMENTACIÓN EN ITALIA EN EL MERCADO DE FRUTOS SECOS, POR TIPO, 2018-2032 (MILES DE USD)
TABLA 222 SECTOR DE SERVICIOS DE ALIMENTACIÓN EN FRANCIA EN EL MERCADO DE FRUTOS SECOS, POR TIPO, 2018-2032 (MILES DE USD)
TABLA 223 SECTOR DE SERVICIOS DE ALIMENTACIÓN DEL REINO UNIDO EN EL MERCADO DE FRUTOS SECOS, POR TIPO, 2018-2032 (MILES DE USD)
TABLA 224 SECTOR DE SERVICIOS DE ALIMENTACIÓN EN ESPAÑA EN EL MERCADO DE FRUTOS SECOS, POR TIPO, 2018-2032 (MILES DE USD)
TABLA 225 SECTOR DE SERVICIOS DE ALIMENTOS DE EE. UU. EN EL MERCADO DE FRUTOS SECOS, POR TIPO DE FRUTO SECO, 2018-2032 (MILES DE USD)
TABLA 226 SECTOR DE SERVICIOS DE ALIMENTACIÓN DE ALEMANIA EN EL MERCADO DE FRUTOS SECOS, POR TIPO DE FRUTO SECO, 2018-2032 (MILES DE USD)
TABLA 227 SECTOR DE SERVICIOS DE ALIMENTACIÓN EN ITALIA EN EL MERCADO DE FRUTOS SECOS, POR TIPO DE FRUTO SECO, 2018-2032 (MILES DE USD)
TABLA 228 SECTOR DE SERVICIOS DE ALIMENTACIÓN EN FRANCIA EN EL MERCADO DE FRUTOS SECOS, POR TIPO DE FRUTO SECO, 2018-2032 (MILES DE USD)
TABLA 229 SECTOR DE SERVICIOS DE ALIMENTACIÓN DEL REINO UNIDO EN EL MERCADO DE FRUTOS SECOS, POR TIPO DE FRUTO SECO, 2018-2032 (MILES DE USD)
TABLA 230 SECTOR DE SERVICIOS DE ALIMENTACIÓN EN ESPAÑA EN EL MERCADO DE FRUTOS SECOS, POR TIPO DE FRUTO SECO, 2018-2032 (MILES DE USD)
Lista de figuras
FIGURA 1 MERCADO DE FRUTOS SECOS DE EE. UU., ESPAÑA, REINO UNIDO, FRANCIA, ALEMANIA E ITALIA
FIGURA 2 MERCADO DE FRUTOS SECOS DE EE. UU., ESPAÑA, REINO UNIDO, FRANCIA, ALEMANIA E ITALIA: TRIANGULACIÓN DE DATOS
FIGURA 3 MERCADO DE FRUTOS SECOS DE EE. UU., ESPAÑA, REINO UNIDO, FRANCIA, ALEMANIA E ITALIA: ANÁLISIS DROC
FIGURA 4 MERCADO DE FRUTOS SECOS DE EE. UU.: ANÁLISIS DEL MERCADO REGIONAL
FIGURA 5 MERCADO DE FRUTOS SECOS DE ALEMANIA: ANÁLISIS DEL MERCADO REGIONAL
FIGURA 6 MERCADO DE FRUTOS SECOS EN ITALIA: ANÁLISIS DEL MERCADO REGIONAL
FIGURA 7 MERCADO DE FRUTOS SECOS EN FRANCIA: ANÁLISIS DEL MERCADO REGIONAL
FIGURA 8 MERCADO DE FRUTOS SECOS DEL REINO UNIDO: ANÁLISIS DEL MERCADO REGIONAL
FIGURA 9 MERCADO DE LA CASETA DE ESPAÑA: ANÁLISIS DEL MERCADO REGIONAL
FIGURA 10 MERCADO DE FRUTOS SECOS DE EE. UU., ESPAÑA, REINO UNIDO, FRANCIA, ALEMANIA E ITALIA: ANÁLISIS DE INVESTIGACIÓN DE EMPRESAS
FIGURA 11 MERCADO DE FRUTOS SECOS DE EE. UU., ESPAÑA, REINO UNIDO, FRANCIA, ALEMANIA E ITALIA: MODELADO MULTIVARIADO
FIGURA 12 MERCADO DE FRUTOS SECOS DE EE. UU., ESPAÑA, REINO UNIDO, FRANCIA, ALEMANIA E ITALIA: DATOS DEMOGRÁFICOS DE LAS ENTREVISTAS
FIGURA 13 MERCADO DE FRUTOS SECOS DE EE. UU., ESPAÑA, REINO UNIDO, FRANCIA, ALEMANIA E ITALIA: CUADRÍCULA DE POSICIÓN DE MERCADO DBMR
FIGURA 14 CUADRÍCULA DE COBERTURA DEL MERCADO DE FRUTOS SECOS DE EE. UU., ESPAÑA, REINO UNIDO, FRANCIA, ALEMANIA E ITALIA
FIGURA 15 MERCADO DE FRUTOS SECOS DE EE. UU., ESPAÑA, REINO UNIDO, FRANCIA, ALEMANIA E ITALIA: SEGMENTACIÓN
FIGURA 16 DIEZ SEGMENTOS COMPONEN EL MERCADO DE FRUTOS SECOS DE EE. UU., POR TIPO (2025)
FIGURA 17 DIEZ SEGMENTOS COMPONEN EL MERCADO DE FRUTOS SECOS DE ALEMANIA, POR TIPO (2025)
FIGURA 18 DIEZ SEGMENTOS COMPONEN EL MERCADO DE FRUTOS SECOS DE ITALIA, POR TIPO (2025)
FIGURA 19 DIEZ SEGMENTOS COMPONEN EL MERCADO DE FRUTOS SECOS DE FRANCIA, POR TIPO (2025)
FIGURA 20 DIEZ SEGMENTOS COMPONEN EL MERCADO DE FRUTOS SECOS DEL REINO UNIDO, POR TIPO (2025)
FIGURA 21 DIEZ SEGMENTOS COMPONEN EL MERCADO DE LAS FRUTAS DE ESPAÑA, POR TIPO (2025)
FIGURA 22 RESUMEN EJECUTIVO DEL MERCADO DE FRUTOS SECOS DE EE. UU., ESPAÑA, REINO UNIDO, FRANCIA, ALEMANIA E ITALIA
FIGURA 23 DECISIONES ESTRATÉGICAS
FIGURA 24 SE ESPERA QUE EL AUMENTO DEL USO DE PRODUCTOS DE PANADERÍA Y CONFITERÍA IMPULSE EL MERCADO DE FRUTOS SECOS DE EE. UU. EN EL PERÍODO DE PRONÓSTICO (2025-2032)
FIGURA 25 SE ESPERA QUE EL AUMENTO DEL USO DE PRODUCTOS DE PANADERÍA Y CONFITERÍA IMPULSE EL MERCADO DE FRUTOS SECOS DE ALEMANIA EN EL PERÍODO DE PRONÓSTICO (2025-2032)
FIGURA 26 SE ESPERA QUE EL AUMENTO DEL USO DE PRODUCTOS DE PANADERÍA Y CONFITERÍA IMPULSE EL MERCADO DE FRUTOS SECOS EN ITALIA EN EL PERÍODO DE PRONÓSTICO (2025-2032)
FIGURA 27 SE ESPERA QUE EL AUMENTO DEL USO DE PRODUCTOS DE PANADERÍA Y CONFITERÍA IMPULSE EL MERCADO DE FRUTOS SECOS DE FRANCIA EN EL PERÍODO DE PRONÓSTICO (2025-2032)
FIGURA 28 SE ESPERA QUE EL AUMENTO DEL USO DE PRODUCTOS DE PANADERÍA Y CONFITERÍA IMPULSE EL MERCADO DE FRUTOS SECOS DEL REINO UNIDO EN EL PERÍODO DE PRONÓSTICO (2025-2032)
FIGURA 29 SE ESPERA QUE EL AUMENTO DEL USO DE PRODUCTOS DE PANADERÍA Y CONFITERÍA IMPULSE EL MERCADO DE FRUTOS SECOS EN EL PERÍODO DE PREVISIÓN (2025-2032)
FIGURA 30 SE ESPERA QUE EL SEGMENTO DE ALMENDRAS REPRESENTE LA MAYOR PARTICIPACIÓN DEL MERCADO DE FRUTOS SECOS DEL REINO UNIDO EN 2025 Y 2032
FIGURA 31 SE ESPERA QUE EL SEGMENTO DE ALMENDRAS REPRESENTE LA MAYOR PARTICIPACIÓN DEL MERCADO DE FRUTOS SECOS DE ALEMANIA EN 2025 Y 2032
FIGURA 32 SE ESPERA QUE EL SEGMENTO DE ALMENDRAS REPRESENTE LA MAYOR PARTICIPACIÓN DEL MERCADO DE FRUTOS SECOS DE ITALIA EN 2025 Y 2032
FIGURA 33 SE ESPERA QUE EL SEGMENTO DE ALMENDRAS REPRESENTE LA MAYOR PARTICIPACIÓN DEL MERCADO DE FRUTOS SECOS DE FRANCIA EN 2025 Y 2032
FIGURA 34 SE ESPERA QUE EL SEGMENTO DE ALMENDRAS REPRESENTE LA MAYOR PARTICIPACIÓN DEL MERCADO DE FRUTOS SECOS DE EE. UU. EN 2025 Y 2032
FIGURA 35 SE ESPERA QUE EL SEGMENTO DE ALMENDRAS REPRESENTE LA MAYOR PARTICIPACIÓN DEL MERCADO DE FRUTOS SECOS DE ESPAÑA EN 2025 Y 2032
FIGURA 36 ESCENARIO DE IMPORTACIÓN Y EXPORTACIÓN (MILES DE USD)
FIGURA 37 MERCADO DE FRUTOS SECOS DE EE. UU., ESPAÑA, REINO UNIDO, FRANCIA, ALEMANIA E ITALIA, 2024-2032, PRECIO DE VENTA MEDIO (USD/KG)
FIGURA 38 IMPULSORES, RESTRICCIONES, OPORTUNIDADES Y DESAFÍOS PARA EE. UU., ESPAÑA, REINO UNIDO, FRANCIA, ALEMANIA E ITALIA NUTS MARK
FIGURA 39 MERCADO DE FRUTOS SECOS DE EE. UU.: POR TIPO, 2024
FIGURA 40 MERCADO DE FRUTOS SECOS EN ALEMANIA: POR TIPO, 2024
FIGURA 41 MERCADO DE FRUTOS SECOS EN ITALIA: POR TIPO, 2024
FIGURA 42 MERCADO DE FRUTOS SECOS EN FRANCIA: POR TIPO, 2024
FIGURA 43 MERCADO DE FRUTOS SECOS DEL REINO UNIDO: POR TIPO, 2024
FIGURA 44 MERCADO DE NUECES DE SAPIN: POR TIPO, 2024
FIGURA 45 MERCADO DE FRUTOS SECOS DE EE. UU.: POR CATEGORÍA, 2024
FIGURA 46 MERCADO DE FRUTOS SECOS EN ALEMANIA: POR CATEGORÍA, 2024
FIGURA 47 MERCADO DE FRUTOS SECOS EN ITALIA: POR CATEGORÍA, 2024
FIGURA 48 MERCADO DE FRUTOS SECOS EN FRANCIA: POR CATEGORÍA, 2024
FIGURA 49 MERCADO DE FRUTOS SECOS DEL REINO UNIDO: POR CATEGORÍA, 2024
FIGURA 50 MERCADO DE FRUTOS SECOS DE ESPAÑA: POR CATEGORÍA, 2024
FIGURA 51 MERCADO DE FRUTOS SECOS DE EE. UU.: POR TIPO DE RECUBRIMIENTO, 2024
FIGURA 52 MERCADO DE FRUTOS SECOS EN ALEMANIA: POR TIPO DE RECUBRIMIENTO, 2024
FIGURA 53 MERCADO DE FRUTOS SECOS EN ITALIA: POR TIPO DE RECUBRIMIENTO, 2024
FIGURA 54 MERCADO DE FRUTOS SECOS EN FRANCIA: POR TIPO DE RECUBRIMIENTO, 2024
FIGURA 55 MERCADO DE FRUTOS SECOS DEL REINO UNIDO: POR TIPO DE RECUBRIMIENTO, 2024
FIGURA 56 MERCADO DE FRUTOS SECOS DE ESPAÑA: POR TIPO DE RECUBRIMIENTO, 2024
FIGURA 57 MERCADO DE FRUTOS SECOS DE EE. UU.: POR RANGO DE PRECIOS, 2024
FIGURA 58 MERCADO DE FRUTOS SECOS DE ALEMANIA: POR RANGO DE PRECIOS, 2024
FIGURA 59 MERCADO DE FRUTOS SECOS EN ITALIA: POR RANGO DE PRECIOS, 2024
FIGURA 60 MERCADO DE FRUTOS SECOS EN FRANCIA: POR RANGO DE PRECIOS, 2024
FIGURA 61 MERCADO DE FRUTOS SECOS DEL REINO UNIDO: POR RANGO DE PRECIOS, 2024
FIGURA 62 MERCADO DE NUECES DE SAPIN: POR RANGO DE PRECIOS, 2024
FIGURA 63 MERCADO DE FRUTOS SECOS DE EE. UU.: POR FORMA, 2024
FIGURA 64 MERCADO DE FRUTOS SECOS DE ALEMANIA: POR FORMA, 2024
FIGURA 65 MERCADO DE FRUTOS SECOS EN ITALIA: POR FORMA, 2024
FIGURA 66 MERCADO DE FRUTOS SECOS DE FRANCIA: POR FORMA, 2024
FIGURA 67 MERCADO DE FRUTOS SECOS DEL REINO UNIDO: POR FORMA, 2024
FIGURA 68 MERCADO DE FRUTOS SECOS: POR FORMA, 2024
FIGURA 69 MERCADO DE FRUTOS SECOS DE EE. UU.: POR CANAL DE DISTRIBUCIÓN, 2024
FIGURA 70 MERCADO DE FRUTOS SECOS EN ALEMANIA: POR CANAL DE DISTRIBUCIÓN, 2024
FIGURA 71 MERCADO DE FRUTOS SECOS EN ITALIA: POR CANAL DE DISTRIBUCIÓN, 2024
FIGURA 72 MERCADO DE FRUTOS SECOS EN FRANCIA: POR CANAL DE DISTRIBUCIÓN, 2024
FIGURA 73 MERCADO DE FRUTOS SECOS DEL REINO UNIDO: POR CANAL DE DISTRIBUCIÓN, 2024
FIGURA 74 MERCADO DE FRUTOS SECOS DE ESPAÑA: POR CANAL DE DISTRIBUCIÓN, 2024
FIGURA 75 MERCADO DE FRUTOS SECOS DE EE. UU.: POR USO FINAL, 2024
FIGURA 76 MERCADO DE FRUTOS SECOS DE ALEMANIA: POR USO FINAL, 2024
FIGURA 77 MERCADO DE FRUTOS SECOS EN ITALIA: POR USO FINAL, 2024
FIGURA 78 MERCADO DE FRUTOS SECOS DE FRANCIA: POR USO FINAL, 2024
FIGURA 79 MERCADO DE FRUTOS SECOS DEL REINO UNIDO: POR USO FINAL, 2024
FIGURA 80 MERCADO DE FRUTOS SECOS: POR USO FINAL, 2024
FIGURA 81 MERCADO DE FRUTOS SECOS DE EE. UU.: PARTICIPACIÓN DE LA EMPRESA 2024 (%)
FIGURA 82 MERCADO DE FRUTOS SECOS DE ALEMANIA: PARTICIPACIÓN DE LA EMPRESA 2024 (%)
FIGURA 83 MERCADO DE FRUTOS SECOS EN ITALIA: PARTICIPACIÓN DE LA EMPRESA 2024 (%)
FIGURA 84 MERCADO DE FRUTOS SECOS EN FRANCIA: PARTICIPACIÓN DE LA EMPRESA 2024 (%)
FIGURA 85 MERCADO DE FRUTOS SECOS DEL REINO UNIDO: PARTICIPACIÓN DE LA EMPRESA 2024 (%)
FIGURA 86 MERCADO DE CASETA: CUOTA DE LA EMPRESA 2024 (%)
Metodología de investigación
La recopilación de datos y el análisis del año base se realizan utilizando módulos de recopilación de datos con muestras de gran tamaño. La etapa incluye la obtención de información de mercado o datos relacionados a través de varias fuentes y estrategias. Incluye el examen y la planificación de todos los datos adquiridos del pasado con antelación. Asimismo, abarca el examen de las inconsistencias de información observadas en diferentes fuentes de información. Los datos de mercado se analizan y estiman utilizando modelos estadísticos y coherentes de mercado. Además, el análisis de la participación de mercado y el análisis de tendencias clave son los principales factores de éxito en el informe de mercado. Para obtener más información, solicite una llamada de un analista o envíe su consulta.
La metodología de investigación clave utilizada por el equipo de investigación de DBMR es la triangulación de datos, que implica la extracción de datos, el análisis del impacto de las variables de datos en el mercado y la validación primaria (experto en la industria). Los modelos de datos incluyen cuadrícula de posicionamiento de proveedores, análisis de línea de tiempo de mercado, descripción general y guía del mercado, cuadrícula de posicionamiento de la empresa, análisis de patentes, análisis de precios, análisis de participación de mercado de la empresa, estándares de medición, análisis global versus regional y de participación de proveedores. Para obtener más información sobre la metodología de investigación, envíe una consulta para hablar con nuestros expertos de la industria.
Personalización disponible
Data Bridge Market Research es líder en investigación formativa avanzada. Nos enorgullecemos de brindar servicios a nuestros clientes existentes y nuevos con datos y análisis que coinciden y se adaptan a sus objetivos. El informe se puede personalizar para incluir análisis de tendencias de precios de marcas objetivo, comprensión del mercado de países adicionales (solicite la lista de países), datos de resultados de ensayos clínicos, revisión de literatura, análisis de mercado renovado y base de productos. El análisis de mercado de competidores objetivo se puede analizar desde análisis basados en tecnología hasta estrategias de cartera de mercado. Podemos agregar tantos competidores sobre los que necesite datos en el formato y estilo de datos que esté buscando. Nuestro equipo de analistas también puede proporcionarle datos en archivos de Excel sin procesar, tablas dinámicas (libro de datos) o puede ayudarlo a crear presentaciones a partir de los conjuntos de datos disponibles en el informe.

