
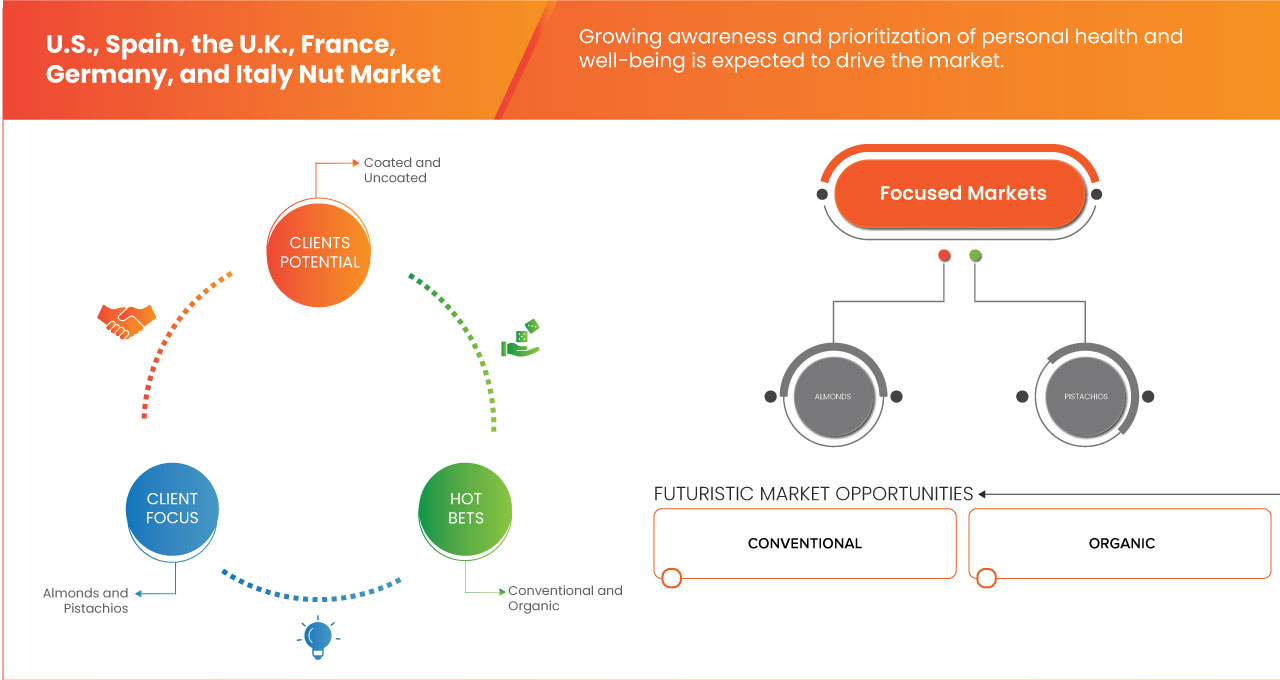
Us Spain The Uk France Germany And Italy Nut Market
Market Size in USD Billion
 USD
22.92 Billion
USD
31.35 Billion
2024
2032
USD
22.92 Billion
USD
31.35 Billion
2024
2032
| 2025 - 2032 | |
| USD 22.92 Billion | |
| USD 31.35 Billion | |
| % | |
|
Nut Market Size
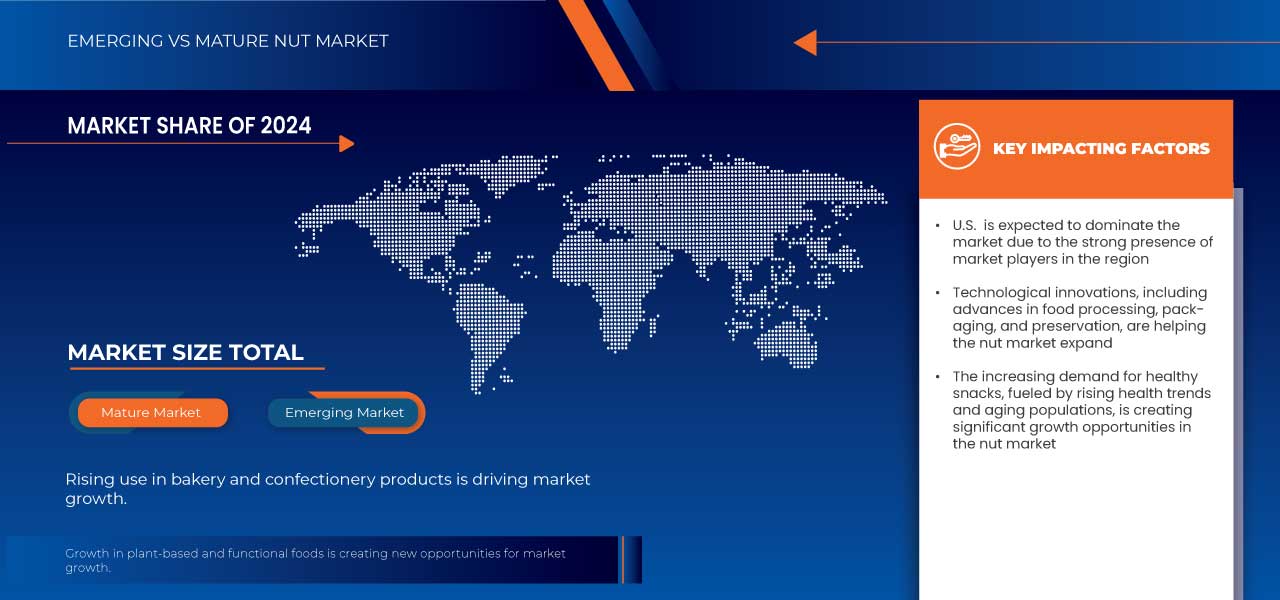
- U.S., Spain, U.K., France, Germany, and Italy nut market size was valued at USD 22.92 billion in 2024 and is expected to reach USD 31.35 billion by 2032, at a CAGR of 4.1% during the forecast period
- This growth is driven by factors such as increasing health consciousness, rising demand for plant-based protein sources, and growing consumer preference for convenient, nutrient-dense snack options
U.S., Spain, U.K., France, Germany, and Italy Nut Market Analysis
- The nut market in the U.S., Spain, U.K., France, Germany, and Italy is a diverse and dynamic sector characterized by a robust demand for various types of nuts, including almonds, walnuts, hazelnuts, and pistachios, driven by increasing health consciousness among consumers and a growing preference for plant-based snacks.
- In these countries, significant factors include the rising popularity of nuts as a healthy source of protein and essential nutrients, the expansion of distribution channels such as supermarkets and online retail, and innovative product offerings, including flavored and convenient snack formats.
- U.S. is expected to dominate the market with a share of 42.72%, due to its large consumer base, high disposable income, and growing health consciousness
- U.S. is expected to be the fastest growing region in the market during the forecast period due to increasing consumer awareness of health benefits and rising demand for nutritious snacks
- Almonds segment is expected to dominate the market with a market share of 34.5% due to its widespread clinical adoption, cost-effectiveness, and procedural familiarity among radiologists and surgeons
Report Scope and U.S., Spain, U.K., France, Germany, and Italy Nut Market Segmentation
|
Attributes |
U.S., Spain, U.K., France, Germany, and Italy Nut Key Market Insights |
|
Segments Covered |
|
|
Countries Covered |
|
|
Key Market Players |
|
|
Market Opportunities |
|
|
Value Added Data Infosets |
In addition to the insights on market scenarios such as market value, growth rate, segmentation, geographical coverage, and major players, the market reports curated by the Data Bridge Market Research also include import export analysis, production capacity overview, production consumption analysis, price trend analysis, climate change scenario, supply chain analysis, value chain analysis, raw material/consumables overview, vendor selection criteria, PESTLE Analysis, Porter Analysis, and regulatory framework. |
U.S., Spain, U.K., France, Germany, and Italy Nut Market Trends
Increasing Demand for Healthier Snack Alternatives
- A notable trend in the nut market across the U.S., Spain, U.K., France, Germany, and Italy is the increasing demand for healthier snack alternatives, which has significantly driven the popularity of nuts as a go-to option
- This shift is fueled by a growing awareness of health and wellness, leading consumers to seek out nutrient-rich, plant-based snacks high in protein, fiber, and healthy fats. In the U.S., trends lean towards the consumption of almonds and walnuts, driven by their perceived health benefits
- For instance, in 2024, Blue Diamond Growers launched a new line of low-sodium, flavored almonds targeting health-conscious consumers and on-the-go snacking habits
- Meanwhile, in Spain, the consumption of traditional snacks like roasted nuts is on the rise, particularly in social settings. The U.K., France, Germany, and Italy are witnessing an increase in premium and organic nut products, catering to the health-conscious shopper
- In addition, innovations in flavors, packaging, and product variety, including nut mixes and nut-based snacks, further enhance market growth across these regions
U.S., Spain, U.K., France, Germany, and Italy Nut Market Dynamics
Driver
Rising Use in Bakery and Confectionery Products
- As consumer preferences shift toward premium, natural, and nutrient-rich ingredients, nuts have become an integral component in enhancing the taste, texture, and nutritional value of baked goods and confectionery
- The growing emphasis on high-quality and artisanal bakery products has encouraged bakers and patisseries to incorporate a variety of nuts, such as almonds, walnuts, hazelnuts, and pistachios, into their recipes.
- These ingredients add crunch, depth of flavor, and a touch of indulgence to pastries, cakes, cookies, and bread. Across Europe, nuts have been a staple in traditional baked goods, including French almond croissants, Italian panettone, and German nut-studded breads. Meanwhile, in the U.S., the increasing demand for gluten-free and keto-friendly baked goods has positioned nuts as a key functional ingredient
For instance,
- In May 2023, according to an article published by ROHA Group., premium dried nuts play a crucial role in bakery and confectionery products, meeting the rising demand for natural and healthy ingredients. Advanced drying technologies like freeze drying and air drying help preserve rich flavor, crunch, and nutritional value, ensuring extended shelf life and innovation, keeping businesses competitive in the evolving food industry
- According to an article published by BC Campus, the rising use of nuts in bakery and confectionery reflects growing consumer demand for natural, nutritious ingredients. Almonds, walnuts, pecans, and pistachios enhance flavor, texture, and health benefits in cakes, pastries, and cookies.
- As trends shift towards wholesome baking, nuts remain essential for both classic recipes and modern innovations

Opportunity
Growth in Plant-Based and Functional Foods
- The demand for plant-based and functional foods is growing quickly as more people look for healthier and sustainable options
- Consumers are choosing plant-based products because they want to improve their health, help the environment, and avoid animal products. Nuts are a key ingredient in many plant-based foods, as they provide natural protein, healthy fats, and essential nutrients
For instance,
- In February 2025, an article published by NYP Holdings, Inc. highlighted a recent study showing that walnuts, rich in omega-3s, enhance brain function and memory. As consumers seek functional foods for better health, nuts like walnuts and almonds are becoming key ingredients in plant-based products, driving market growth and meeting the demand for nutritious, sustainable options
- In January 2020, according to a study by Healthline Media LLC, fortified cereals are an example of functional foods that provide added health benefits. As consumers seek nutrient-dense options, plant-based products enriched with vitamins, minerals, and antioxidants — like nut-based snacks and dairy alternatives — are driving market growth and supporting healthier, more sustainable eating habits
- This trend highlights the increasing demand for innovative, health-oriented food options that cater to consumer preferences for wellness and sustainability
Restraint/Challenge
Climate Change & Environmental Impact
- Climate change is a big challenge for the nut industry. Rising temperatures, unpredictable weather, and droughts can harm nut trees, making it harder for farmers to grow healthy crops. For instance, almonds need a lot of water to grow, so droughts can lower production and increase costs
- Extreme weather events, like storms and heatwaves, can damage crops and reduce yields. Pests and diseases may also spread more easily in changing climates, putting more stress on nut trees. All of this makes nut production less reliable and can cause prices to go up
- Growing nuts also impacts the environment. Some crops, like almonds, use large amounts of water, while others may lead to deforestation if not managed sustainably. Consumers are paying more attention to how their food is produced, choosing brands that protect the environment and use sustainable farming practices
For instance,
- In October 2024, according to an article published by Reuters, Greece’s chestnut harvest could drop by up to 90% due to extreme drought and heat. This highlights how climate change harms nut production, reducing yields and increasing prices. Producers must adapt with sustainable practices to build resilience against unpredictable weather
- In November 2022, according to a study published by arXiv, almond farming demands high water usage, especially in drought-prone regions like California. Unsustainable practices can strain resources and harm ecosystems. As consumers seek eco-friendly options, nut producers must adopt sustainable farming techniques to balance production with environmental responsibility
- Therefore, embracing sustainable practices is essential for the long-term viability of the nut industry, ensuring environmental conservation while meeting growing consumer demand for eco-conscious products
U.S., Spain, U.K., France, Germany, and Italy Nut Market Scope
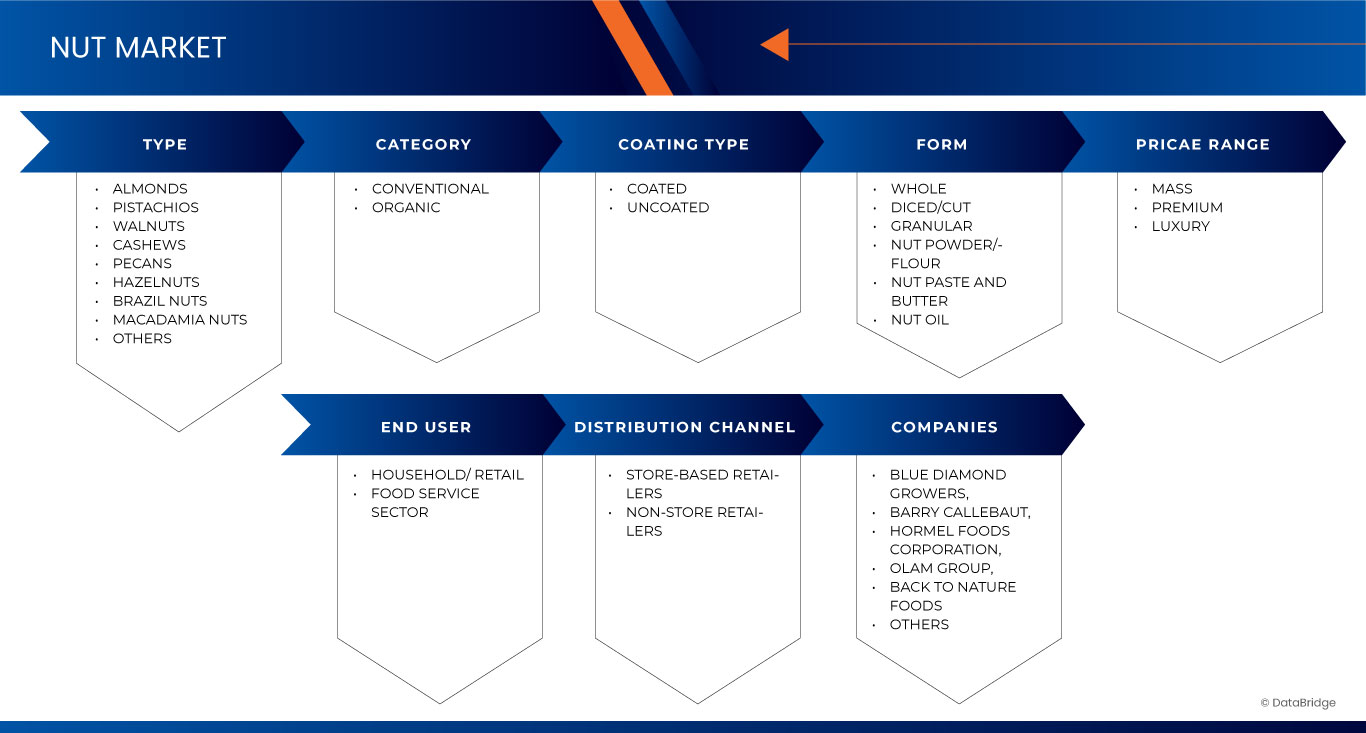
The market is segmented on the basis of type, category, coating type, form, price rage, end use, and distribution channel.
|
Segmentation |
Sub-Segmentation |
|
By Type |
|
|
By Category |
|
|
By Coating Type |
|
|
By Form |
|
|
BY Price Range |
|
|
By End Use |
|
|
By Distribution Channel |
|
In 2025, the almonds is projected to dominate the market with a largest share in type segment
The almonds segment is expected to dominate the Nut market with the largest share of 42.09% in 2025 due to its widespread popularity as a versatile and nutrient-dense snack. Almonds are rich in protein, fiber, healthy fats, and essential vitamins, making them a preferred choice among health-conscious consumers across regions like the U.S., Spain, U.K., France, Germany, and Italy. Their perceived benefits in supporting heart health, weight management, and overall wellness have further strengthened demand. In addition, their adaptability in a variety of products—from raw and roasted snacks to almond-based beverages and baked goods—has fueled growth. Continuous innovation in flavoring, packaging, and convenient formats is also helping expand the consumer base and maintain almonds’ leading market position.
The whole is expected to account for the largest share during the forecast period in Form segment
In 2025, the whole segment is expected to dominate the market due to increasing consumer preference for natural, unprocessed, and minimally handled products. In addition, rising awareness of health benefits associated with whole nuts is driving its market growth.
U.S., Spain, U.K., France, Germany, and Italy Nut Market Regional Analysis
U.S. Holds the Largest Share in the Nut Market
- U.S. dominates the nut market with a share of 42.72%, driven by high consumption of almonds and walnuts, health-conscious snacking trends, and strong domestic production
- The presence of leading nut processors and brands such as Blue Diamond Growers, Wonderful Pistachios & Almonds, and Planters, alongside innovations in packaging and flavored nut products, continues to drive market expansion
- The growing demand for plant-based protein and convenient, nutrient-rich snacks supports increased consumption across age groups and lifestyle segments. As consumer awareness of health and wellness rises, the U.S. market continues to lead in both production and innovation, solidifying its dominant position
U.S. is Projected to Register the Highest CAGR in the Nut Market
- The U.S. is expected to witness the highest growth rate in the Nut market, driven by rapid expansion in healthcare infrastructure, increasing awareness about breast cancer, and growing procedure volumes
- Growing awareness of the health benefits associated with nut consumption—such as heart health and weight management—combined with strong domestic production and expanding retail presence, is further accelerating market growth
- The trend toward clean-label, non-GMO, and organic offerings is also fueling demand, positioning the U.S. as both a major consumer and innovator in the global nut industry
U.S., Spain, U.K., France, Germany, and Italy Nut Market Share
The market competitive landscape provides details by competitor. Details included are company overview, company financials, revenue generated, market potential, investment in research and development, new market initiatives, global presence, production sites and facilities, production capacities, company strengths and weaknesses, product launch, product width and breadth, application dominance. The above data points provided are only related to the companies' focus related to market.
The Major Market Leaders Operating in the Market Are:
- Blue Diamond Grower (U.S.)
- Barry Callebaut (Switzerland)
- Hormel Foods, LLC (U.S.)
- Olam International (Singapore)
- Mariani Nut Company (U.S.)
- Back To Nature Foods Company Llc (U.S.)
- King Nut Company (U.S.)
- Grau Nuts (Spain)
- Terri Lynn (U.S.)
- Tierra Farm (U.S.)
- Sun Organic Farms (U.S.)
- Century Snacks (U.S.)
- H.B.S. Foods Ltd (U.K.)
- Fresh Nuts Gmbh (U.A.E.)
- Andalucia Nuts (U.S.)
- Almendras Francisco Morales S.A. (Spain)
- Iberian Almond (Spain)
- Peyman (Turkey)
- Great Nuts (U.S.)
- Bapu Tree Nuts (U.S.)
- Kariba Farms Inc. (U.S.)
- Sunburst Snacks (U.K.)
- My Organics (Australia)
- Lone Tree Nut Company, Inc. (U.S.)
- Sun Valley Nut, Llc (U.K.)
Latest Developments in U.S., Spain, U.K., France, Germany, and Italy Nut Market
- In June 2024, Barry Callebaut secured a EUR 700 million investment to combat soaring cocoa prices, ensuring financial stability. Rising costs pose challenges for SMEs, though EU funds support innovation and sustainability. Funding aids R&D, eco-friendly initiatives, and healthier confectionery. The industry adapts to volatility while preparing for future growth and competition in an evolving global market
- In July 2024, Hormel Foods Corporation (NYSE: HRL) announced that its SPAM and STAGG chili brands won category awards in the 2024 Most Trusted Awards by BrandSpark International. SPAM® took first in canned luncheon meat, while STAGG chili won in the canned chili category, highlighting the brands' popularity and trust in Canada
- In May 2023, The Kanan Enterprises, parent company of King Nut and Peterson Nut Companies, was certified a SQF level 2 by NSF International for their Plant #1. Which was an unannounced audit. SQF stands for Safe Quality Food and it certifies the quality management system of King Nut. This audit is based on accredited HACCP Food Safety Plans. SQF Level 2 is one of the highest ratings a food/baking company can achieve with regard to quality under this prestigious audit
- In October 2024, SkinnyDipped has launched topless peanut butter cups, featuring a creamy peanut butter center encased in a rich dark chocolate shell. With only 3g of sugar per cup, these better-for-you treats offer indulgence without the guilt
SKU-

- Interactive Data Analysis Dashboard
- Company Analysis Dashboard for high growth potential opportunities
- Research Analyst Access for customization & queries
- Competitor Analysis with Interactive dashboard
- Latest News, Updates & Trend analysis
- Harness the Power of Benchmark Analysis for Comprehensive Competitor Tracking
Table of Content
1 INTRODUCTION
1.1 OBJECTIVES OF THE STUDY
1.2 MARKET DEFINITION
1.3 OVERVIEW
1.4 LIMITATIONS
1.5 MARKETS COVERED
2 MARKET SEGMENTATION
2.1 MARKETS COVERED
2.2 GEOGRAPHICAL SCOPE
2.3 YEARS CONSIDERED FOR THE STUDY
2.4 CURRENCY AND PRICING
2.5 DBMR TRIPOD DATA VALIDATION MODEL
2.6 MULTIVARIATE MODELING
2.7 PRIMARY INTERVIEWS WITH KEY OPINION LEADERS
2.8 DBMR MARKET POSITION GRID
2.9 END USER COVERAGE GRID
2.1 SECONDARY SOURCES
2.11 ASSUMPTIONS
3 EXECUTIVE SUMMARY
4 PREMIUM INSIGHTS
4.1 IMPORT EXPORT SCENARIO
4.2 BRAND LOOK
4.3 CLIMATE CHANGE SCENARIO
4.3.1 ENVIRONMENTAL CONCERNS
4.3.2 INDUSTRY RESPONSE
4.3.3 GOVERNMENT’S ROLE
4.3.4 STRATEGIC SOLUTIONS FOR A RESILIENT NUT MARKET
4.4 FACTORS INFLUENCING PURCHASING DECISIONS OF CUSTOMERS FOR NUTS
4.4.1 HEALTH AND NUTRITIONAL BENEFITS:
4.4.2 PRODUCT QUALITY AND FRESHNESS:
4.4.3 PRICE AND VALUE PERCEPTION:
4.4.4 BRAND REPUTATION AND TRUST:
4.4.5 CONVENIENCE AND AVAILABILITY:
4.4.6 PACKAGING AND AESTHETIC APPEAL:
4.4.7 SUSTAINABILITY AND ETHICAL CONSIDERATIONS:
4.4.8 CULTURAL AND REGIONAL PREFERENCES:
4.4.9 MARKETING AND PROMOTIONS:
4.4.10 SENSORY EXPERIENCE AND TASTE INNOVATION:
4.5 IMPACT OF ECONOMIC SLOWDOWN ON THE NUT MARKET
4.5.1 IMPACT ON PRICE:
4.5.2 IMPACT ON SUPPLY CHAIN:
4.5.3 IMPACT ON SHIPMENT:
4.5.4 IMPACT ON COMPANY’S STRATEGIC DECISIONS:
4.5.5 CONCLUSION:
4.6 MARKETING STRATEGIES ADOPTED BY KEY MARKET PLAYERS IN THE NUT INDUSTRY
4.6.1 HEALTH-CENTRIC BRANDING AND STORYTELLING:
4.6.2 PRODUCT INNOVATION AND DIVERSIFICATION:
4.6.3 DIGITAL MARKETING AND SOCIAL MEDIA ENGAGEMENT:
4.6.4 E-COMMERCE AND DIRECT-TO-CONSUMER (DTC) MODELS:
4.6.5 RETAIL PARTNERSHIPS AND IN-STORE PROMOTIONS:
4.6.6 SUSTAINABILITY AND ETHICAL SOURCING CAMPAIGNS:
4.6.7 DATA-DRIVEN PERSONALIZATION AND CONSUMER INSIGHTS:
4.6.8 EXPANSION WITH LOCALIZED STRATEGIES:
4.6.9 CAUSE MARKETING AND COMMUNITY INVOLVEMENT:
4.6.10 CONTENT MARKETING AND EDUCATIONAL CAMPAIGNS:
4.7 NEW PRODUCT LAUNCH STRATEGY
4.7.1 NUMBER OF NEW PRODUCT LAUNCHES
4.7.2 LINE EXTENSION
4.7.3 NEW PACKAGING
4.7.4 RE-LAUNCHED PRODUCTS
4.7.5 NEW FORMULATION
4.7.6 CONCLUSION
4.8 PRIVATE LABEL VS. BRAND ANALYSIS
4.8.1 MARKET SHARE AND GROWTH
4.8.2 CONSUMER PERCEPTIONS AND BEHAVIOR
4.8.3 RETAILER STRATEGIES AND INNOVATIONS
4.8.4 CHALLENGES AND COMPETITIVE DYNAMICS
4.8.5 FUTURE OUTLOOK
4.9 PRICING ANALYSIS
4.9.1 OVERVIEW OF TREE NUT PRICES
4.9.2 FACTORS INFLUENCING PRICING TRENDS
4.9.3 PRICE VOLATILITY AND MARKET OUTLOOK
4.9.4 CONCLUSION
4.9.5 PRODUCTION CAPACITY FOR TOP MANUFACTURERS
4.1 PRODUCT VS BRAND OVERVIEW
4.11 PROMOTIONAL ACTIVITIES
4.11.1 DIGITAL MARKETING AND SOCIAL MEDIA CAMPAIGNS
4.11.2 RETAIL PROMOTIONS AND IN-STORE ACTIVATIONS
4.11.3 HEALTH AND SUSTAINABILITY INITIATIVES
4.11.4 PRODUCT INNOVATION AND LIMITED-TIME OFFERINGS
4.11.5 CONCLUSION
4.12 SHOPPING BEHAVIOUR AND DYNAMICS
4.12.1 RECOMMENDATION FROM FAMILY & FRIENDS
4.12.2 RESEARCH
4.12.3 IMPULSIVE PURCHASES
4.12.4 ADVERTISEMENT
4.12.5 ONLINE ADVERTISEMENT
4.12.6 IN-STORE ADVERTISEMENT
4.12.7 OUTDOOR ADVERTISEMENT
4.13 SUPPLY CHAIN ANALYSIS FOR THE NUT INDUSTRY
4.13.1 LOGISTICS COST SCENARIO
4.13.2 IMPORTANCE OF LOGISTICS SERVICE PROVIDERS
4.13.3 CONCLUSION
5 REGULATION COVERAGE
6 MARKET OVERVIEW
6.1 DRIVERS
6.1.1 RISING USE IN BAKERY AND CONFECTIONERY PRODUCTS
6.1.2 RISING POPULARITY OF NUT-BASED ALTERNATIVES IN DAIRY AND CONFECTIONERY
6.1.3 GROWING AWARENESS AND PRIORITIZATION OF PERSONAL HEALTH AND WELL-BEING
6.2 RESTRAINTS
6.2.1 CONCERNS RELATED TO ALLERGIES AND POTENTIAL ALLERGIC REACTIONS IN INDIVIDUALS
6.2.2 STRICT REGULATIONS ENSURE FOOD SAFETY COMPLIANCE AND QUALITY CONTROL STANDARDS
6.3 OPPORTUNITIES
6.3.1 GROWTH IN PLANT-BASED AND FUNCTIONAL FOODS
6.3.2 E-COMMERCE EXPANSION & DIRECT-TO-CONSUMER SALES
6.4 CHALLENGES
6.4.1 CLIMATE CHANGE & ENVIRONMENTAL IMPACT
6.4.2 LOGISTICS CHALLENGES AND SUPPLY CHAIN DISRUPTIONS AFFECTING OPERATIONS
7 U.S., U.K., GERMANY, FRANCE, SPAIN, ITALY NUTS MARKET, BY TYPE
7.1 OVERVIEW
7.2 ALMONDS
7.3 PEANUTS
7.4 PECAN
7.5 CASHEWS
7.6 PISTACHIO
7.7 WALNUTS
7.8 MACADAMIA
7.9 HAZELNUTS
7.1 BRAZIL NUTS
7.11 OTHERS
8 U.S., U.K., GERMANY, FRANCE, SPAIN, ITALY NUTS MARKET, BY CATEGORY
8.1 OVERVIEW
8.2 CONVENTIONAL
8.2.1 ALMONDS
8.2.2 PEANUTS
8.2.3 PECAN
8.2.4 CASHEWS
8.2.5 PISTACHIO
8.2.6 WALNUTS
8.2.7 MACADAMIA
8.2.8 HAZELNUTS
8.2.9 BRAZIL NUTS
8.2.10 OTHERS
8.3 ORGANIC
8.3.1 ALMONDS
8.3.2 PEANUTS
8.3.3 PECAN
8.3.4 CASHEWS
8.3.5 PISTACHIO
8.3.6 WALNUTS
8.3.7 MACADAMIA
8.3.8 HAZELNUTS
8.3.9 BRAZIL NUT
8.3.10 OTHERS
9 U.S., U.K., GERMANY, FRANCE, SPAIN, ITALY NUTS MARKET, BY COATING TYPE
9.1 OVERVIEW
9.2 COATED
9.3 UNCOATED
10 U.S., SPAIN, THE U.K., FRANCE, GERMANY, AND ITALY NUTS MARKET, BY PRICE RANGE
10.1 OVERVIEW
10.2 MASS
10.3 PREMIUM
10.4 LUXURY
11 U.S., SPAIN, THE U.K., FRANCE, GERMANY, AND ITALY NUT MARKET, BY FORM
11.1 OVERVIEW
11.2 WHOLE
11.3 DICED/CUT
11.4 GRANULAR
11.5 NUT POWDER/FLOUR
11.6 NUT PASTE AND BUTTER
11.7 NUT OIL
12 U.S., SPAIN, THE U.K., FRANCE, GERMANY, AND ITALY NUT MARKET, BY DISTRIBUTION CHANNEL
12.1 OVERVIEW
12.2 STORE-BASED RETAILERS
12.3 NON-STORE RETAILERS
13 U.S., U.K., GERMANY, FRANCE, SPAIN, ITALY NUTS MARKET, BY END USE
13.1 OVERVIEW
13.2 HOUSEHOLD/ RETAIL
13.3 FOOD SERVICE SECTOR
14 U.S., SPAIN, THE U.K., FRANCE, GERMANY, AND ITALY NUT MARKET: COMPANY LANDSCAPE
14.1 COMPANY SHARE ANALYSIS: U.S.
14.2 COMPANY SHARE ANALYSIS: GERMANY
14.3 COMPANY SHARE ANALYSIS: ITALY
14.4 COMPANY SHARE ANALYSIS: FRANCE
14.5 COMPANY SHARE ANALYSIS: UK
14.6 COMPANY SHARE ANALYSIS: SPAIN
15 SWOT ANALYSIS
16 COMPANY PROFILE
16.1 BLUE DIAMOND GROWERS
16.1.1 COMPANY SNAPSHOT
16.1.2 PRODUCT PORTFOLIO
16.1.3 RECENT DEVELOPMENT
16.2 BERRY CALLEBAUT.
16.2.1 COMPANY SNAPSHOT
16.2.2 REVENUE ANALYSIS
16.2.3 PRODUCT PORTFOLIO
16.2.4 RECENT DEVELOPMENT
16.3 HORMEL FOODS CORPORATION
16.3.1 COMPANY SNAPSHOT
16.3.2 REVENUE ANALYSIS
16.3.3 PRODUCT PORTFOLIO
16.3.4 RECENT DEVELOPMENT
16.4 OLAM GROUP
16.4.1 COMPANY SNAPSHOT
16.4.2 REVENUE ANALYSIS
16.4.3 PRODUCT PORTFOLIO
16.4.4 RECENT DEVELOPMENT
16.5 MARIANI NUT COMPANY
16.5.1 COMPANY SNAPSHOT
16.5.2 PRODUCT PORTFOLIO
16.5.3 RECENT DEVELOPMENT
16.6 BACK TO NATURE FOODS
16.6.1 COMPANY SNAPSHOT
16.6.2 PRODUCT PORTFOLIO
16.6.3 RECENT DEVELOPMENT
16.7 ALMENDRAS FRANCISCO MORALES S.A.
16.7.1 COMPANY SNAPSHOT
16.7.2 PRODUCT PORTFOLIO
16.7.3 RECENT DEVELOPMENT
16.8 ANDALUCIA NUTS
16.8.1 COMPANY SNAPSHOT
16.8.2 PRODUCT PORTFOLIO
16.8.3 RECENT DEVELOPMENT
16.9 BAPU ALMONDS
16.9.1 COMPANY SNAPSHOT
16.9.2 PRODUCT PORTFOLIO
16.9.3 RECENT DEVELOPMENT
16.1 CENTURY SNACKS
16.10.1 COMPANY SNAPSHOT
16.10.2 PRODUCT PORTFOLIO
16.10.3 RECENT DEVELOPMENT
16.11 FRESHNUTS
16.11.1 COMPANY SNAPSHOT
16.11.2 PRODUCT PORTFOLIO
16.11.3 RECENT DEVELOPMENT
16.12 GRAU NUTS
16.12.1 COMPANY SNAPSHOT
16.12.2 PRODUCT PORTFOLIO
16.12.3 RECENT UPDATES
16.13 GREATNUTS
16.13.1 COMPANY SNAPSHOT
16.13.2 PRODUCT PORTFOLIO
16.13.3 RECENT DEVELOPMENT
16.14 HBS FOODS LTD.
16.14.1 COMPANY SNAPSHOT
16.14.2 PRODUCT PORTFOLIO
16.14.3 RECENT DEVELOPMENT
16.15 IBERIAN ALMOND
16.15.1 COMPANY SNAPSHOT
16.15.2 PRODUCT PORTFOLIO
16.15.3 RECENT DEVELOPMENT
16.16 KARIBA FARMS INC.
16.16.1 COMPANY SNAPSHOT
16.16.2 PRODUCT PORTFOLIO
16.16.3 RECENT DEVELOPMENT
16.17 KING NUT
16.17.1 COMPANY SNAPSHOT
16.17.2 PRODUCT PORTFOLIO
16.17.3 RECENT DEVELOPMENT
16.18 LONE TREE NUT COMPANY, INC.
16.18.1 COMPANY SNAPSHOT
16.18.2 PRODUCT PORTFOLIO
16.18.3 RECENT UPDATES
16.19 MY ORGANICS
16.19.1 COMPANY SNAPSHOT
16.19.2 PRODUCT PORTFOLIO
16.19.3 RECENT DEVELOPMENT
16.2 PEYMAN
16.20.1 COMPANY SNAPSHOT
16.20.2 PRODUCT PORTFOLIO
16.20.3 RECENT DEVELOPMENT
16.21 SKINNYDIPPED.
16.21.1 COMPANY SNAPSHOT
16.21.2 PRODUCT PORTFOLIO
16.21.3 RECENT DEVELOPMENT
16.22 SUN ORGANIC FARM
16.22.1 COMPANY SNAPSHOT
16.22.2 PRODUCT PORTFOLIO
16.22.3 RECENT UPDATES
16.23 SUN VALLEY
16.23.1 COMPANY SNAPSHOT
16.23.2 PRODUCT PORTFOLIO
16.23.3 RECENT UPDATES
16.24 SUNBURST SNACKS
16.24.1 COMPANY SNAPSHOT
16.24.2 PRODUCT PORTFOLIO
16.24.3 RECENT DEVELOPMENT
16.25 TERRI LYNN
16.25.1 COMPANY SNAPSHOT
16.25.2 PRODUCT PORTFOLIO
16.25.3 RECENT UPDATES
16.26 TIERRA FARM
16.26.1 COMPANY SNAPSHOT
16.26.2 PRODUCT PORTFOLIO
16.26.3 RECENT UPDATES
17 QUESTIONNAIRE
18 RELATED REPORTS
List of Table
TABLE 1 COMPARATIVE BRAND ANALYSIS
TABLE 2 U.S. PRODUCTION CAPACITY FOR TOP MANUFACTURERS
TABLE 3 GERMANY PRODUCTION CAPACITY FOR TOP MANUFACTURERS
TABLE 4 ITALY PRODUCTION CAPACITY FOR TOP MANUFACTURERS
TABLE 5 FRANCE PRODUCTION CAPACITY FOR TOP MANUFACTURERS
TABLE 6 UK PRODUCTION CAPACITY FOR TOP MANUFACTURERS
TABLE 7 SPAIN PRODUCTION CAPACITY FOR TOP MANUFACTURERS
TABLE 8 REGULATORY COVERAGE
TABLE 9 U.S. NUTS MARKET, BY TYPE, 2018-2032 (USD THOUSAND)
TABLE 10 U.S. NUTS MARKET, BY TYPE, 2018-2032 (TONS)
TABLE 11 GERMANY NUTS MARKET, BY TYPE, 2018-2032 (USD THOUSAND)
TABLE 12 GERMANY NUTS MARKET, BY TYPE, 2018-2032 (TONS)
TABLE 13 ITALY NUTS MARKET, BY TYPE, 2018-2032 (USD THOUSAND)
TABLE 14 ITALY NUTS MARKET, BY TYPE, 2018-2032 (TONS)
TABLE 15 FRANCE NUTS MARKET, BY TYPE, 2018-2032 (USD THOUSAND)
TABLE 16 FRANCE NUTS MARKET, BY TYPE, 2018-2032 (TONS)
TABLE 17 U.K. NUTS MARKET, BY TYPE, 2018-2032 (USD THOUSAND)
TABLE 18 U.K. NUTS MARKET, BY TYPE, 2018-2032 TONS)
TABLE 19 SPAIN NUTS MARKET, BY TYPE, 2018-2032 (USD THOUSAND)
TABLE 20 SPAIN NUTS MARKET, BY TYPE, 2018-2032 (TONS)
TABLE 21 U.S. NUTS MARKET, BY CATEGORY, 2018-2032 (USD THOUSAND)
TABLE 22 U.S. NUTS MARKET, BY CATEGORY, 2018-2032 (TONS)
TABLE 23 GERMANY NUTS MARKET, BY CATEGORY, 2018-2032 (USD THOUSAND)
TABLE 24 GERMANY NUTS MARKET, BY CATEGORY, 2018-2032 (TONS)
TABLE 25 ITALY NUTS MARKET, BY CATEGORY, 2018-2032 (USD THOUSAND)
TABLE 26 ITALY NUTS MARKET, BY CATEGORY, 2018-2032 (TONS)
TABLE 27 FRANCE NUTS MARKET, BY CATEGORY, 2018-2032 (USD THOUSAND)
TABLE 28 FRANCE NUTS MARKET, BY CATEGORY, 2018-2032 (TONS)
TABLE 29 U.K. NUTS MARKET, BY CATEGORY, 2018-2032 (USD THOUSAND)
TABLE 30 U.K. NUTS MARKET, BY CATEGORY, 2018-2032 (TONS)
TABLE 31 SPAIN NUTS MARKET, BY CATEGORY, 2018-2032 (USD THOUSAND)
TABLE 32 SPAIN NUTS MARKET, BY CATEGORY, 20218-2032 (TONS)
TABLE 33 U.S. CONVENTIONAL IN NUTS MARKET, BY NUT TYPE, 2018-2032 (USD THOUSAND)
TABLE 34 GERMANY CONVENTIONAL IN NUTS MARKET, BY NUT TYPE, 2018-2032 (USD THOUSAND)
TABLE 35 ITALY CONVENTIONAL IN NUTS MARKET, BY NUT TYPE, 2018-2032 (USD THOUSAND)
TABLE 36 FRANCE CONVENTIONAL IN NUTS MARKET, BY NUT TYPE, 2018-2032 (USD THOUSAND)
TABLE 37 U.K. CONVENTIONAL IN NUTS MARKET, BY NUT TYPE, 2018-2032 (USD THOUSAND)
TABLE 38 SPAIN CONVENTIONAL IN NUTS MARKET, BY NUT TYPE, 2018-2032 (USD THOUSAND)
TABLE 39 U.S. ORGANIC IN NUTS MARKET, BY NUT TYPE, 2018-2032 (USD THOUSAND)
TABLE 40 GERMANY ORGANIC IN NUTS MARKET, BY NUT TYPE, 2018-2032 (USD THOUSAND)
TABLE 41 ITALY ORGANIC IN NUTS MARKET, BY NUT TYPE, 2018-2032 (USD THOUSAND)
TABLE 42 FRANCE ORGANIC IN NUTS MARKET, BY NUT TYPE, 2018-2032 (USD THOUSAND)
TABLE 43 U.K. ORGANIC IN NUTS MARKET, BY NUT TYPE, 2018-2032 (USD THOUSAND)
TABLE 44 SPAIN ORGANIC IN NUTS MARKET, BY NUT TYPE, 2018-2032 (USD THOUSAND)
TABLE 45 U.S. NUTS MARKET, BY COATING TYPE, 2018-2032 (USD THOUSAND)
TABLE 46 U.S. NUTS MARKET, BY COATING TYPE, 2018-2032 (TONS)
TABLE 47 GERMANY NUTS MARKET, BY COATING TYPE, 2018-2032 (USD THOUSAND)
TABLE 48 GERMANY NUTS MARKET, BY COATING TYPE, 2018-2032 (TONS)
TABLE 49 ITALY NUTS MARKET, BY COATING TYPE, 2018-2032 (USD THOUSAND)
TABLE 50 ITALY NUTS MARKET, BY COATING TYPE, 2018-2032 (TONS)
TABLE 51 FRANCE NUTS MARKET, BY COATING TYPE, 2018-2032 (USD THOUSAND)
TABLE 52 FRANCE NUTS MARKET, BY COATING TYPE, 2018-2032 (TONS)
TABLE 53 U.K. NUTS MARKET, BY COATING TYPE, 2018-2032 (USD THOUSAND)
TABLE 54 U.K. NUTS MARKET, BY COATING TYPE, 2018-2032 (TONS)
TABLE 55 SPAIN NUTS MARKET, BY COATING TYPE, 2018-2032 (USD THOUSAND)
TABLE 56 SPAIN NUTS MARKET, BY COATING TYPE, 2018-2032 (TONS)
TABLE 57 U.S. COATED IN NUTS MARKET, BY COATING TYPE, 2018-2032 (USD THOUSAND)
TABLE 58 GERMANY COATED IN NUTS MARKET, BY COATING TYPE, 2018-2032 (USD THOUSAND)
TABLE 59 ITALY COATED NUTS MARKET, BY COATING TYPE, 2018-2032 (USD THOUSAND)
TABLE 60 FRANCE COATED IN NUTS MARKET BY COATING TYPE, 2018-2032 (USD THOUSAND)
TABLE 61 U.K. COATED IN NUTS MARKET, BY COATING TYPE, 2018-2032 (USD THOUSAND)
TABLE 62 SPAIN COATED IN NUTS MARKET, BY COATING TYPE, 2018-2032 (USD THOUSAND)
TABLE 63 U.S. SUGAR IN NUTS MARKET, BY SUGAR CONTENT, 2018-2032 (USD THOUSAND)
TABLE 64 GERMANY SUGAR IN NUTS MARKET, BY SUGAR CONTENT, 2018-2032 (USD THOUSAND)
TABLE 65 ITALY SUGAR IN NUTS MARKET, BY SUGAR CONTENT, 2018-2032 (USD THOUSAND)
TABLE 66 FRANCE SUGAR IN NUTS MARKET, BY SUGAR CONTENT, 2018-2032 (USD THOUSAND)
TABLE 67 U.K. SUGAR IN NUTS MARKET, BY SUGAR CONTENT, 2018-2032 (USD THOUSAND)
TABLE 68 SPAIN SUGAR IN NUTS MARKET, BY SUGAR CONTENT, 2018-2032 (USD THOUSAND)
TABLE 69 U.S. COATED IN NUTS MARKET, BY NUT TYPE, 2018-2032 (USD THOUSAND)
TABLE 70 GERMANY COATED IN NUTS MARKET, BY NUT TYPE, 2018-2032 (USD THOUSAND)
TABLE 71 ITALY COATED IN NUTS MARKET, BY NUT TYPE, 2018-2032 (USD THOUSAND)
TABLE 72 FRANCE COATED IN NUTS MARKET, BY NUT TYPE, 2018-2032 (USD THOUSAND)
TABLE 73 U.K. COATED IN NUTS MARKET, BY NUT TYPE, 2018-2032 (USD THOUSAND)
TABLE 74 SPAIN COATED IN NUTS MARKET, BY NUT TYPE, 2018-2032 (USD THOUSAND)
TABLE 75 U.S. UNCOATED IN NUTS MARKET, BY NUT TYPE, 2018-2032 (USD THOUSAND)
TABLE 76 GERMANY UNCOATED IN NUTS MARKET, BY NUT TYPE, 2018-2032 (USD THOUSAND)
TABLE 77 ITALY UNCOATED IN NUTS MARKET, BY NUT TYPE, 2018-2032 (USD THOUSAND)
TABLE 78 FRANCE UNCOATED IN NUTS MARKET, BY NUT TYPE, 2018-2032 (USD THOUSAND)
TABLE 79 U.K. UNCOATED IN NUTS MARKET, BY NUT TYPE, 2018-2032 (USD THOUSAND)
TABLE 80 SPAIN UNCOATED IN NUTS MARKET, BY NUT TYPE, 2018-2032 (USD THOUSAND)
TABLE 81 U.S. NUTS MARKET, BY PRICE RANGE, 2018-2032 (USD THOUSAND)
TABLE 82 U.S. NUTS MARKET, BY PRICE RANGE, 2018-2032 (TONS)
TABLE 83 GERMANY NUTS MARKET, BY PRICE RANGE, 2018-2032 (USD THOUSAND)
TABLE 84 GERMANY NUTS MARKET, BY PRICE RANGE, 2018-2032 (TONS)
TABLE 85 ITALY NUTS MARKET, BY PRICE RANGE, 2018-2032 (USD THOUSAND)
TABLE 86 ITALY NUTS MARKET, BY PRICE RANGE, 2018-2032 (TONS)
TABLE 87 FRANCE NUTS MARKET, BY PRICE RANGE, 2018-2032 (USD THOUSAND)
TABLE 88 FRANCE NUTS MARKET, BY PRICE RANGE, 2018-2032 (TONS)
TABLE 89 UK NUTS MARKET, BY PRICE RANGE, 2018-2032 (USD THOUSAND)
TABLE 90 UK NUTS MARKET, BY PRICE RANGE, 2018-2032 (TONS)
TABLE 91 SPAIN NUTS MARKET, BY PRICE RANGE, 2018-2032 (USD THOUSAND)
TABLE 92 SPAIN NUTS MARKET, BY PRICE RANGE, 2018-2032 (TONS)
TABLE 93 U.S. NUTS MARKET, BY FORM, 2018-2032 (USD THOUSAND)
TABLE 94 U.S. NUTS MARKET, BY FORM, 2018-2032 (TONS)
TABLE 95 GERMANY NUTS MARKET, BY FORM, 2018-2032 (USD THOUSAND)
TABLE 96 GERMANY NUTS MARKET, BY FORM, 2018-2032 (TONS)
TABLE 97 ITALY NUTS MARKET, BY FORM, 2018-2032 (USD THOUSAND)
TABLE 98 ITALY NUTS MARKET, BY FORM, 2018-2032 (TONS)
TABLE 99 FRANCE NUTS MARKET, BY FORM, 2018-2032 (USD THOUSAND)
TABLE 100 FRANCE NUTS MARKET, BY FORM, 2018-2032 (TONS)
TABLE 101 UK NUTS MARKET, BY FORM, 2018-2032 (USD THOUSAND)
TABLE 102 UK NUTS MARKET, BY FORM, 2018-2032 (TONS)
TABLE 103 SPAIN NUTS MARKET, BY FORM, 2018-2032 (USD THOUSAND)
TABLE 104 SPAIN NUTS MARKET, BY FORM, 2018-2032 (TONS)
TABLE 105 U.S. WHOLE IN NUTS MARKET, BY NUT TYPE, 2018-2032 (USD THOUSAND)
TABLE 106 GERMANY WHOLE IN NUTS MARKET, BY NUT TYPE, 2018-2032 (USD THOUSAND)
TABLE 107 ITALY WHOLE IN NUTS MARKET, BY NUT TYPE, 2018-2032 (USD THOUSAND)
TABLE 108 FRANCE WHOLE IN NUTS MARKET, BY NUT TYPE, 2018-2032 (USD THOUSAND)
TABLE 109 UK WHOLE IN NUTS MARKET, BY NUT TYPE, 2018-2032 (USD THOUSAND)
TABLE 110 SPAIN WHOLE IN NUTS MARKET, BY NUT TYPE, 2018-2032 (USD THOUSAND)
TABLE 111 U.S. DICED/CUT IN NUTS MARKET, BY NUT TYPE, 2018-2032 (USD THOUSAND)
TABLE 112 GERMANY DICED/CUT IN NUTS MARKET, BY NUT TYPE, 2018-2032 (USD THOUSAND)
TABLE 113 ITALY DICED/CUT IN NUTS MARKET, BY NUT TYPE, 2018-2032 (USD THOUSAND)
TABLE 114 FRANCE DICED/CUT IN NUTS MARKET, BY NUT TYPE, 2018-2032 (USD THOUSAND)
TABLE 115 UK DICED/CUT IN NUTS MARKET, BY NUT TYPE, 2018-2032 (USD THOUSAND)
TABLE 116 SPAIN DICED/CUT IN NUTS MARKET, BY NUT TYPE, 2018-2032 (USD THOUSAND)
TABLE 117 U.S. GRANULAR IN NUTS MARKET, BY NUT TYPE, 2018-2032 (USD THOUSAND)
TABLE 118 GERMANY GRANULAR IN NUTS MARKET, BY NUT TYPE, 2018-2032 (USD THOUSAND)
TABLE 119 ITALY GRANULAR IN NUTS MARKET, BY NUT TYPE, 2018-2032 (USD THOUSAND)
TABLE 120 FRANCE GRANULAR IN NUTS MARKET, BY NUT TYPE, 2018-2032 (USD THOUSAND)
TABLE 121 UK GRANULAR IN NUTS MARKET, BY NUT TYPE, 2018-2032 (USD THOUSAND)
TABLE 122 SPAIN GRANULAR IN NUTS MARKET, BY NUT TYPE, 2018-2032 (USD THOUSAND)
TABLE 123 U.S. NUT POWDER/FLOUR IN NUTS MARKET, BY NUT TYPE, 2018-2032 (USD THOUSAND)
TABLE 124 GERMANY NUT POWDER/FLOUR IN NUTS MARKET, BY NUT TYPE, 2018-2032 (USD THOUSAND)
TABLE 125 ITALY NUT POWDER/FLOUR IN NUTS MARKET, BY NUT TYPE, 2018-2032 (USD THOUSAND)
TABLE 126 FRANCE NUT POWDER/FLOUR IN NUTS MARKET, BY NUT TYPE, 2018-2032 (USD THOUSAND)
TABLE 127 UK NUT POWDER/FLOUR IN NUTS MARKET, BY NUT TYPE, 2018-2032 (USD THOUSAND)
TABLE 128 SPAIN NUT POWDER/FLOUR IN NUTS MARKET, BY NUT TYPE, 2018-2032 (USD THOUSAND)
TABLE 129 U.S. NUT PASTE AND BUTTER IN NUTS MARKET, BY NUT TYPE, 2018-2032 (USD THOUSAND)
TABLE 130 GERMANY NUT PASTE AND BUTTER IN NUTS MARKET, BY NUT TYPE, 2018-2032 (USD THOUSAND)
TABLE 131 ITALY NUT PASTE AND BUTTER IN NUTS MARKET, BY NUT TYPE, 2018-2032 (USD THOUSAND)
TABLE 132 FRANCE NUT PASTE AND BUTTER IN NUTS MARKET, BY NUT TYPE, 2018-2032 (USD THOUSAND)
TABLE 133 UK NUT PASTE AND BUTTER IN NUTS MARKET, BY NUT TYPE, 2018-2032 (USD THOUSAND)
TABLE 134 SPAIN NUT PASTE AND BUTTER IN NUTS MARKET, BY NUT TYPE, 2018-2032 (USD THOUSAND)
TABLE 135 U.S. NUT OIL IN NUTS MARKET, BY NUT TYPE, 2018-2032 (USD THOUSAND)
TABLE 136 GERMANY NUT OIL IN NUTS MARKET, BY NUT TYPE, 2018-2032 (USD THOUSAND)
TABLE 137 ITALY NUT OIL IN NUTS MARKET, BY NUT TYPE, 2018-2032 (USD THOUSAND)
TABLE 138 FRANCE NUT OIL IN NUTS MARKET, BY NUT TYPE, 2018-2032 (USD THOUSAND)
TABLE 139 UK NUT OIL IN NUTS MARKET, BY NUT TYPE, 2018-2032 (USD THOUSAND)
TABLE 140 SPAIN NUT OIL IN NUTS MARKET, BY NUT TYPE, 2018-2032 (USD THOUSAND)
TABLE 141 U.S. NUTS MARKET, BY DISTRIBUTION CHANNEL, 2018-2032 (USD THOUSAND)
TABLE 142 U.S. NUTS MARKET, BY DISTRIBUTION CHANNEL, 2018-2032 (TONS)
TABLE 143 GERMANY NUTS MARKET, BY DISTRIBUTION CHANNEL, 2018-2032 (USD THOUSAND)
TABLE 144 GERMANY NUTS MARKET, BY DISTRIBUTION CHANNEL, 2018-2032 (TONS)
TABLE 145 ITALY NUTS MARKET, BY DISTRIBUTION CHANNEL, 2018-2032 (USD THOUSAND)
TABLE 146 ITALY NUTS MARKET, BY DISTRIBUTION CHANNEL, 2018-2032 (TONS)
TABLE 147 FRANCE NUTS MARKET, BY DISTRIBUTION CHANNEL, 2018-2032 (USD THOUSAND)
TABLE 148 FRANCE NUTS MARKET, BY DISTRIBUTION CHANNEL, 2018-2032 (TONS)
TABLE 149 U.K. NUTS MARKET, BY DISTRIBUTION CHANNEL, 2018-2032 (USD THOUSAND)
TABLE 150 U.K. NUTS MARKET, BY DISTRIBUTION CHANNEL, 2018-2032 (TONS)
TABLE 151 SPAIN NUTS MARKET, BY DISTRIBUTION CHANNEL, 2018-2032 (USD THOUSAND)
TABLE 152 SPAIN NUTS MARKET, BY DISTRIBUTION CHANNEL, 2018-2032 (TONS)
TABLE 153 U.S. STORE-BASED RETAILERS IN NUTS MARKET, BY TYPE, 2018-2032 (USD THOUSAND)
TABLE 154 GERMANY STORE-BASED RETAILERS IN NUTS MARKET, BY TYPE, 2018-2032 (USD THOUSAND))
TABLE 155 ITALY STORE-BASED RETAILERS IN NUTS MARKET, BY TYPE, 2018-2032 (USD THOUSAND))
TABLE 156 FRANCE STORE-BASED RETAILERS IN NUTS MARKET, BY TYPE, 2018-2032 (USD THOUSAND))
TABLE 157 U.K. STORE-BASED RETAILERS IN NUTS MARKET, BY TYPE, 2018-2032 (USD THOUSAND))
TABLE 158 SPAIN STORE-BASED RETAILERS IN NUTS MARKET, BY TYPE, 2018-2032 (USD THOUSAND))
TABLE 159 U.S. TRADITIONAL GROCERY STORES IN NUTS MARKET, BY TYPE, 2018-2032 (USD THOUSAND)
TABLE 160 GERMANY TRADITIONAL GROCERY STORES IN NUTS MARKET, BY TYPE, 2018-2032 (USD THOUSAND)
TABLE 161 ITALY TRADITIONAL GROCERY STORES IN NUTS MARKET, BY TYPE, 2018-2032 (USD THOUSAND)
TABLE 162 FRANCE TRADITIONAL GROCERY STORES IN NUTS MARKET, BY TYPE, 2018-2032 (USD THOUSAND)
TABLE 163 U.K. TRADITIONAL GROCERY STORES IN NUTS MARKET, BY TYPE, 2018-2032 (USD THOUSAND)
TABLE 164 SPAIN TRADITIONAL GROCERY STORES IN NUTS MARKET, BY TYPE, 2018-2032 (USD THOUSAND)
TABLE 165 U.S. MODERN GROCERY RETAILERS IN NUTS MARKET, BY TYPE, 2018-2032 (USD THOUSAND)
TABLE 166 GERMANY MODERN GROCERY RETAILERS IN NUTS MARKET, BY TYPE, 2018-2032 (USD THOUSAND)
TABLE 167 ITALY MODERN GROCERY RETAILERS IN NUTS MARKET, BY TYPE, 2018-2032 (USD THOUSAND)
TABLE 168 FRANCE MODERN GROCERY RETAILERS IN NUTS MARKET, BY TYPE, 2018-2032 (USD THOUSAND)
TABLE 169 U.K. MODERN GROCERY RETAILERS IN NUTS MARKET, BY TYPE, 2018-2032 (USD THOUSAND)
TABLE 170 SPAIN MODERN GROCERY RETAILERS IN NUTS MARKET, BY TYPE, 2018-2032 (USD THOUSAND)
TABLE 171 U.S. NON-STORE RETAILERS IN NUTS MARKET, BY TYPE, 2018-2032 (USD THOUSAND)
TABLE 172 GERMANY NON-STORE RETAILERS IN NUTS MARKET, BY TYPE, 2018-2032 (USD THOUSAND)
TABLE 173 ITALY NON-STORE RETAILERS IN NUTS MARKET, BY TYPE, 2018-2032 (USD THOUSAND)
TABLE 174 FRANCE NON-STORE RETAILERS IN NUTS MARKET, BY TYPE, 2018-2032 (USD THOUSAND)
TABLE 175 U.K. NON-STORE RETAILERS IN NUTS MARKET, BY TYPE, 2018-2032 (USD THOUSAND)
TABLE 176 SPAIN NON-STORE RETAILERS IN NUTS MARKET, BY TYPE, 2018-2032 (USD THOUSAND)
TABLE 177 U.S. NUTS MARKET, BY END USE, 2018-2032 (USD THOUSAND)
TABLE 178 U.S. NUTS MARKET, BY END USE, 2018-2032 (TONS)
TABLE 179 GERMANY NUTS MARKET, BY END USE, 2018-2032 (USD THOUSAND)
TABLE 180 GERMANY NUTS MARKET, BY END USE, 2018-2032 (TONS)
TABLE 181 ITALY NUTS MARKET, BY END USE, 2018-2032 (USD THOUSAND)
TABLE 182 ITALY NUTS MARKET, BY END USE, 2018-2032 (TONS)
TABLE 183 FRANCE NUTS MARKET, BY END USE, 2018-2032 (USD THOUSAND)
TABLE 184 FRANCE NUTS MARKET, BY END USE, 2018-2032 (TONS)
TABLE 185 U.K. NUTS MARKET, BY END USE, 2018-2032 (USD THOUSAND)
TABLE 186 U.K. NUTS MARKET, BY END USE, 2018-2032 (TONS)
TABLE 187 SPAIN NUTS MARKET, BY END USE, 2018-2032 (USD THOUSAND)
TABLE 188 SPAIN NUTS MARKET, BY END USE, 2018-2032 (TONS)
TABLE 189 U.S. HOUSEHOLD/ RETAIL IN NUTS MARKET, BY NU TYPE, 2018-2032 (USD THOUSAND)
TABLE 190 GERMANY HOUSEHOLD/ RETAIL IN NUTS MARKET, BY NUT TYPE, 2018-2032 (USD THOUSAND)
TABLE 191 ITALY HOUSEHOLD/ RETAIL IN NUTS MARKET, BY NUT TYPE, 2018-2032 (USD THOUSAND)
TABLE 192 FRANCE HOUSEHOLD/ RETAIL IN NUTS MARKET, BY NUT TYPE, 2018-2032 (USD THOUSAND)
TABLE 193 U.K. HOUSEHOLD/ RETAIL IN NUTS MARKET, BY NUT TYPE, 2018-2032 (USD THOUSAND)
TABLE 194 SPAIN HOUSEHOLD/ RETAIL IN NUTS MARKET, BY NUT TYPE, 2018-2032 (USD THOUSAND)
TABLE 195 U.S. HOUSEHOLD/ RETAIL IN NUTS MARKET, BY PACKAGING TYPE, 2018-2032 (USD THOUSAND)
TABLE 196 GERMANY HOUSEHOLD/ RETAIL IN NUTS MARKET, BY PACKAGING TYPE, 2018-2032 (USD THOUSAND)
TABLE 197 ITALY HOUSEHOLD/ RETAIL IN NUTS MARKET, BY PACKAGING TYPE, 2018-2032 (USD THOUSAND)
TABLE 198 FRANCE HOUSEHOLD/ RETAIL IN NUTS MARKET, BY PACKAGING TYPE, 2018-2032 (USD THOUSAND)
TABLE 199 U.K. HOUSEHOLD/ RETAIL IN NUTS MARKET, BY PACKAGING TYPE, 2018-2032 (USD THOUSAND)
TABLE 200 SPAIN HOUSEHOLD/ RETAIL IN NUTS MARKET, BY PACKAGING TYPE, 2018-2032 (USD THOUSAND)
TABLE 201 U.S. POUCHES IN NUTS MARKET, BY TYPE, 2018-2032 (USD THOUSAND)
TABLE 202 GERMANY POUCHES IN NUTS MARKET, BY TYPE, 2018-2032 (USD THOUSAND)
TABLE 203 ITALY POUCHES IN NUTS MARKET, BY TYPE, 2018-2032 (USD THOUSAND)
TABLE 204 FRANCE POUCHES IN NUTS MARKET, BY TYPE, 2018-2032 (USD THOUSAND)
TABLE 205 U.K. POUCHES IN NUTS MARKET, BY TYPE, 2018-2032 (USD THOUSAND)
TABLE 206 SPAIN POUCHES IN NUTS MARKET, BY TYPE, 2018-2032 (USD THOUSAND)
TABLE 207 U.S. BAGS IN NUTS MARKET, BY TYPE, 2018-2032 (USD THOUSAND)
TABLE 208 GERMANY BAGS IN NUTS MARKET, BY TYPE, 2018-2032 (USD THOUSAND)
TABLE 209 ITALY BAGS IN NUTS MARKET, BY TYPE, 2018-2032 (USD THOUSAND)
TABLE 210 FRANCE BAGS IN NUTS MARKET, BY TYPE, 2018-2032 (USD THOUSAND)
TABLE 211 U.K. BAGS IN NUTS MARKET, BY TYPE, 2018-2032 (USD THOUSAND)
TABLE 212 SPAIN BAGS IN NUTS MARKET, BY TYPE, 2018-2032 (USD THOUSAND)
TABLE 213 U.S. HOUSEHOLD/ RETAIL IN NUTS MARKET, BY PACKAGING SIZE, 2018-2032 (USD THOUSAND)
TABLE 214 GERMANY HOUSEHOLD/ RETAIL IN NUTS MARKET, BY PACKAGING SIZE, 2018-2032 (USD THOUSAND)
TABLE 215 ITALY HOUSEHOLD/ RETAIL IN NUTS MARKET, BY PACKAGING SIZE, 2018-2032 (USD THOUSAND)
TABLE 216 FRANCE HOUSEHOLD/ RETAIL IN NUTS MARKET, BY PACKAGING SIZE, 2018-2032 (USD THOUSAND)
TABLE 217 U.K. HOUSEHOLD/ RETAIL IN NUTS MARKET, BY PACKAGING SIZE, 2018-2032 (USD THOUSAND)
TABLE 218 SPAIN HOUSEHOLD/ RETAIL IN NUTS MARKET, BY PACKAGING SIZE, 2018-2032 (USD THOUSAND)
TABLE 219 U.S. FOOD SERVICE SECTOR IN NUTS MARKET, BY TYPE, 2018-2032 (USD THOUSAND)
TABLE 220 GERMANY FOOD SERVICE SECTOR IN NUTS MARKET, BY TYPE, 2018-2032 (USD THOUSAND)
TABLE 221 ITALY FOOD SERVICE SECTOR IN NUTS MARKET, BY TYPE, 2018-2032 (USD THOUSAND)
TABLE 222 FRANCE FOOD SERVICE SECTOR IN NUTS MARKET, BY TYPE, 2018-2032 (USD THOUSAND)
TABLE 223 U.K. FOOD SERVICE SECTOR IN NUTS MARKET, BY TYPE, 2018-2032 (USD THOUSAND)
TABLE 224 SPAIN FOOD SERVICE SECTOR IN NUTS MARKET, BY TYPE, 2018-2032 (USD THOUSAND)
TABLE 225 U.S. FOOD SERVICE SECTOR IN NUTS MARKET, BY NUT TYPE, 2018-2032 (USD THOUSAND)
TABLE 226 GERMANY FOOD SERVICE SECTOR IN NUTS MARKET, BY NUT TYPE, 2018-2032 (USD THOUSAND)
TABLE 227 ITALY FOOD SERVICE SECTOR IN NUTS MARKET, BY NUT TYPE, 2018-2032 (USD THOUSAND)
TABLE 228 FRANCE FOOD SERVICE SECTOR IN NUTS MARKET, BY NUT TYPE, 2018-2032 (USD THOUSAND)
TABLE 229 U.K. FOOD SERVICE SECTOR IN NUTS MARKET, BY NUT TYPE, 2018-2032 (USD THOUSAND)
TABLE 230 SPAIN FOOD SERVICE SECTOR IN NUTS MARKET, BY NUT TYPE, 2018-2032 (USD THOUSAND)
List of Figure
FIGURE 1 U.S., SPAIN, U.S., SPAIN, THE U.K., FRANCE, GERMANY, AND ITALY NUT MARKET
FIGURE 2 U.S., SPAIN, THE U.K., FRANCE, GERMANY, AND ITALY NUT MARKET: DATA TRIANGULATION
FIGURE 3 U.S., SPAIN, THE U.K., FRANCE, GERMANY, AND ITALY NUT MARKET: DROC ANALYSIS
FIGURE 4 U.S. NUT MARKET: REGIONAL MARKET ANALYSIS
FIGURE 5 GERMANY NUT MARKET: REGIONAL MARKET ANALYSIS
FIGURE 6 ITALY NUT MARKET: REGIONAL MARKET ANALYSIS
FIGURE 7 FRANCE NUT MARKET: REGIONAL MARKET ANALYSIS
FIGURE 8 U.K. NUT MARKET: REGIONAL MARKET ANALYSIS
FIGURE 9 SPAIN NUT MARKET: REGIONAL MARKET ANALYSIS
FIGURE 10 U.S., SPAIN, THE U.K., FRANCE, GERMANY, AND ITALY NUT MARKET: COMPANY RESEARCH ANALYSIS
FIGURE 11 U.S., SPAIN, THE U.K., FRANCE, GERMANY, AND ITALY NUT MARKET: MULTIVARIATE MODELLING
FIGURE 12 U.S., SPAIN, THE U.K., FRANCE, GERMANY, AND ITALY NUT MARKET: INTERVIEW DEMOGRAPHICS
FIGURE 13 U.S., SPAIN, THE U.K., FRANCE, GERMANY, AND ITALY NUT MARKET: DBMR MARKET POSITION GRID
FIGURE 14 U.S., SPAIN, THE U.K., FRANCE, GERMANY, AND ITALY NUT MARKET, END USER COVERAGE GRID
FIGURE 15 U.S., SPAIN, THE U.K., FRANCE, GERMANY, AND ITALY NUTS MARKET: SEGMENTATION
FIGURE 16 TEN SEGMENTS COMPRISE THE U.S. NUTS MARKET, BY TYPE (2025)
FIGURE 17 TEN SEGMENTS COMPRISE THE GERMANY NUTS MARKET, BY TYPE (2025)
FIGURE 18 TEN SEGMENTS COMPRISE THE ITALY NUTS MARKET, BY TYPE (2025)
FIGURE 19 TEN SEGMENTS COMPRISE THE FRANCE NUTS MARKET, BY TYPE (2025)
FIGURE 20 TEN SEGMENTS COMPRISE THE U.K. NUTS MARKET, BY TYPE (2025)
FIGURE 21 TEN SEGMENTS COMPRISE THE SPAIN NUTS MARKET, BY TYPE (2025)
FIGURE 22 U.S., SPAIN, THE U.K., FRANCE, GERMANY, AND ITALY NUTS MARKET EXECUTIVE SUMMARY
FIGURE 23 STRATEGIC DECISIONS
FIGURE 24 RISING USE OF BAKERY AND CONFECTIONERY PRODUCTS IS EXPECTED TO DRIVE THE U.S. NUTS MARKET IN THE FORECAST PERIOD (2025-2032)
FIGURE 25 RISING USE OF BAKERY AND CONFECTIONERY PRODUCTS IS EXPECTED TO DRIVE THE GERMANY NUTS MARKET IN THE FORECAST PERIOD (2025-2032)
FIGURE 26 RISING USE OF BAKERY AND CONFECTIONERY PRODUCTS IS EXPECTED TO DRIVE THE ITALY NUTS MARKET IN THE FORECAST PERIOD (2025-2032)
FIGURE 27 RISING USE OF BAKERY AND CONFECTIONERY PRODUCTS IS EXPECTED TO DRIVE THE FRANCE NUTS MARKET IN THE FORECAST PERIOD (2025-2032)
FIGURE 28 RISING USE OF BAKERY AND CONFECTIONERY PRODUCTS IS EXPECTED TO DRIVE THE U.K. NUTS MARKET IN THE FORECAST PERIOD (2025-2032)
FIGURE 29 RISING USE OF BAKERY AND CONFECTIONERY PRODUCTS IS EXPECTED TO DRIVE THE SPAIN NUTS MARKET IN THE FORECAST PERIOD (2025-2032)
FIGURE 30 THE ALMONDS SEGMENT IS EXPECTED TO ACCOUNT FOR THE LARGEST SHARE OF THE U.K. NUTS MARKET IN 2025 AND 2032
FIGURE 31 ALMONDS SEGMENT IS EXPECTED TO ACCOUNT FOR THE LARGEST SHARE OF THE GERMANY NUTS MARKET IN 2025 AND 2032
FIGURE 32 ALMONDS SEGMENT IS EXPECTED TO ACCOUNT FOR THE LARGEST SHARE OF THE ITALY NUTS MARKET IN 2025 AND 2032
FIGURE 33 ALMONDS SEGMENT IS EXPECTED TO ACCOUNT FOR THE LARGEST SHARE OF THE FRANCE NUTS MARKET IN 2025 AND 2032
FIGURE 34 ALMONDS SEGMENT IS EXPECTED TO ACCOUNT FOR THE LARGEST SHARE OF THE U.S. NUTS MARKET IN 2025 AND 2032
FIGURE 35 ALMONDS SEGMENT IS EXPECTED TO ACCOUNT FOR THE LARGEST SHARE OF THE SPAIN NUTS MARKET IN 2025 AND 2032
FIGURE 36 IMPORT EXPORT SCENARIO (USD THOUSAND)
FIGURE 37 U.S., SPAIN, THE U.K., FRANCE, GERMANY, AND ITALY NUTS MARKET, 2024-2032, AVERAGE SELLING PRICE (USD/KG)
FIGURE 38 DRIVERS, RESTRAINTS, OPPORTUNITIES, AND CHALLENGES FOR U.S., SPAIN, U.S., SPAIN, THE U.K., FRANCE, GERMANY, AND ITALY NUTS MARK
FIGURE 39 U.S. NUTS MARKET: BY TYPE, 2024
FIGURE 40 GERMANY NUTS MARKET: BY TYPE, 2024
FIGURE 41 ITALY NUTS MARKET: BY TYPE, 2024
FIGURE 42 FRANCE NUTS MARKET: BY TYPE, 2024
FIGURE 43 U.K. NUTS MARKET: BY TYPE, 2024
FIGURE 44 SAPIN NUTS MARKET: BY TYPE, 2024
FIGURE 45 U.S. NUTS MARKET: BY CATEGORY, 2024
FIGURE 46 GERMANY NUTS MARKET: BY CATEGORY, 2024
FIGURE 47 ITALY NUTS MARKET: BY CATEGORY, 2024
FIGURE 48 FRANCE NUTS MARKET: BY CATEGORY, 2024
FIGURE 49 U.K. NUTS MARKET: BY CATEGORY, 2024
FIGURE 50 SPAIN NUTS MARKET: BY CATEGORY, 2024
FIGURE 51 U.S. NUTS MARKET: BY COATING TYPE, 2024
FIGURE 52 GERMANY NUTS MARKET: BY COATING TYPE, 2024
FIGURE 53 ITALY NUTS MARKET: BY COATING TYPE, 2024
FIGURE 54 FRANCE NUTS MARKET: BY COATING TYPE, 2024
FIGURE 55 U.K. NUTS MARKET: BY COATING TYPE, 2024
FIGURE 56 SPAIN NUTS MARKET: BY COATING TYPE, 2024
FIGURE 57 U.S. NUTS MARKET: BY PRICE RANGE, 2024
FIGURE 58 GERMANY NUTS MARKET: BY PRICE RANGE, 2024
FIGURE 59 ITALY NUTS MARKET: BY PRICE RANGE, 2024
FIGURE 60 FRANCE NUTS MARKET: BY PRICE RANGE, 2024
FIGURE 61 UK NUTS MARKET: BY PRICE RANGE, 2024
FIGURE 62 SAPIN NUTS MARKET: BY PRICE RANGE, 2024
FIGURE 63 U.S. NUTS MARKET: BY FORM, 2024
FIGURE 64 GERMANY NUTS MARKET: BY FORM, 2024
FIGURE 65 ITALY NUTS MARKET: BY FORM, 2024
FIGURE 66 FRANCE NUTS MARKET: BY FORM, 2024
FIGURE 67 U.K. NUTS MARKET: BY FORM, 2024
FIGURE 68 SPAIN NUTS MARKET: BY FORM, 2024
FIGURE 69 U.S. NUTS MARKET: BY DISTRIBUTION CHANNEL, 2024
FIGURE 70 GERMANY NUTS MARKET: BY DISTRIBUTION CHANNEL, 2024
FIGURE 71 ITALY NUTS MARKET: BY DISTRIBUTION CHANNEL, 2024
FIGURE 72 FRANCE NUTS MARKET: BY DISTRIBUTION CHANNEL, 2024
FIGURE 73 U.K. NUTS MARKET: BY DISTRIBUTION CHANNEL, 2024
FIGURE 74 SPAIN NUTS MARKET: BY DISTRIBUTION CHANNEL, 2024
FIGURE 75 U.S. NUTS MARKET: BY END USE, 2024
FIGURE 76 GERMANY NUTS MARKET: BY END USE, 2024
FIGURE 77 ITALY NUTS MARKET: BY END USE, 2024
FIGURE 78 FRANCE NUTS MARKET: BY END USE, 2024
FIGURE 79 U.K. NUTS MARKET: BY END USE, 2024
FIGURE 80 SPAIN NUTS MARKET: BY END USE, 2024
FIGURE 81 U.S. NUT MARKET: COMPANY SHARE 2024 (%)
FIGURE 82 GERMANY NUT MARKET: COMPANY SHARE 2024 (%)
FIGURE 83 ITALY NUT MARKET: COMPANY SHARE 2024 (%)
FIGURE 84 FRANCE NUT MARKET: COMPANY SHARE 2024 (%)
FIGURE 85 UK NUT MARKET: COMPANY SHARE 2024 (%)
FIGURE 86 SPAIN NUT MARKET: COMPANY SHARE 2024 (%)
Us Spain The Uk France Germany And Italy Nut Market, Supply Chain Analysis and Ecosystem Framework
To support market growth and help clients navigate the impact of geopolitical shifts, DBMR has integrated in-depth supply chain analysis into its Us Spain The Uk France Germany And Italy Nut Market research reports. This addition empowers clients to respond effectively to global changes affecting their industries. The supply chain analysis section includes detailed insights such as Us Spain The Uk France Germany And Italy Nut Market consumption and production by country, price trend analysis, the impact of tariffs and geopolitical developments, and import and export trends by country and HSN code. It also highlights major suppliers with data on production capacity and company profiles, as well as key importers and exporters. In addition to research, DBMR offers specialized supply chain consulting services backed by over a decade of experience, providing solutions like supplier discovery, supplier risk assessment, price trend analysis, impact evaluation of inflation and trade route changes, and comprehensive market trend analysis.
Data collection and base year analysis are done using data collection modules with large sample sizes. The stage includes obtaining market information or related data through various sources and strategies. It includes examining and planning all the data acquired from the past in advance. It likewise envelops the examination of information inconsistencies seen across different information sources. The market data is analysed and estimated using market statistical and coherent models. Also, market share analysis and key trend analysis are the major success factors in the market report. To know more, please request an analyst call or drop down your inquiry.
The key research methodology used by DBMR research team is data triangulation which involves data mining, analysis of the impact of data variables on the market and primary (industry expert) validation. Data models include Vendor Positioning Grid, Market Time Line Analysis, Market Overview and Guide, Company Positioning Grid, Patent Analysis, Pricing Analysis, Company Market Share Analysis, Standards of Measurement, Global versus Regional and Vendor Share Analysis. To know more about the research methodology, drop in an inquiry to speak to our industry experts.
Data Bridge Market Research is a leader in advanced formative research. We take pride in servicing our existing and new customers with data and analysis that match and suits their goal. The report can be customized to include price trend analysis of target brands understanding the market for additional countries (ask for the list of countries), clinical trial results data, literature review, refurbished market and product base analysis. Market analysis of target competitors can be analyzed from technology-based analysis to market portfolio strategies. We can add as many competitors that you require data about in the format and data style you are looking for. Our team of analysts can also provide you data in crude raw excel files pivot tables (Fact book) or can assist you in creating presentations from the data sets available in the report.


