Asia Pacific Orthodontic Supplies Market
Taille du marché en milliards USD
TCAC :
% 
 USD
1.98 Billion
USD
4.52 Billion
2024
2032
USD
1.98 Billion
USD
4.52 Billion
2024
2032
| 2025 –2032 | |
| USD 1.98 Billion | |
| USD 4.52 Billion | |
| % | |
|
Marché des fournitures d'orthodontie en Asie-Pacifique, selon le type de produit (appareils d'orthodontie amovibles, appareils d'orthodontie fixes, adhésifs et accessoires), le type de patient (enfants et adolescents et adultes), le type de matériel (filets, fil d'arc, aligneur et contenants), l'application (traitement de malocclusion, orthodontie correcteur et orthodontie préventive), l'utilisateur final (cliniques dentaires, hôpitaux, instituts universitaires et de recherche), la chaîne de distribution (appels d'offres directs, ventes au détail, etc.) - Tendances et prévisions de l'industrie jusqu'en 2032
Asia-Pacific Orthodontic Supplies Market Analysis
Asia-Pacific orthodontic supplies market is a rapidly growing sector within the dental industry, focused on products used to correct teeth misalignments and jaw issues. Key products in this market include traditional braces, clear aligners, brackets, wires, bands, and adhesives. Growth is driven by factors like increased awareness of dental health, rising demand for aesthetic treatments, and advancements in orthodontic technology, such as 3D printing and custom-made aligners. North America and Europe dominate the market due to high disposable incomes and widespread access to orthodontic care. However, emerging markets in Asia-Pacific and Latin America are seeing significant growth, fueled by rising dental care accessibility and a growing middle class. The increasing preference for less visible treatments, such as clear aligners, is reshaping the market dynamics. As dental aesthetics and health become a priority Asia-Pacificly, the orthodontic supplies market is poised for continued expansion with ongoing technological innovations.
Asia-Pacific Orthodontic Supplies Market Size
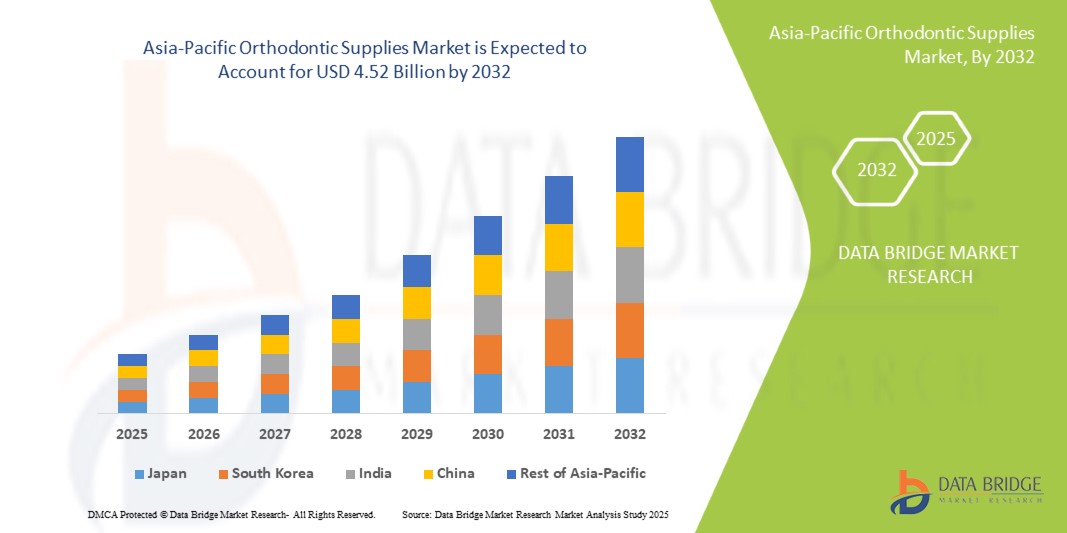
Asia-Pacific orthodontic supplies market size was valued at USD 1.98 billion 2024 and is projected to reach USD 4.52 billion by 2032, with a CAGR of 10.9% during the forecast period of 2025 to 2032. In addition to the insights on market scenarios such as market value, growth rate, segmentation, geographical coverage, and major players, the market reports curated by the Data Bridge Market Research also include import export analysis, production capacity overview, production consumption analysis, price trend analysis, climate change scenario, supply chain analysis, value chain analysis, raw material/consumables overview, vendor selection criteria, PESTLE Analysis, Porter Analysis, and regulatory framework.
Asia-Pacific Orthodontic Supplies Market Trends
“Rising Demand for Aesthetic Treatments”
The Asia-Pacific orthodontics supply market is experiencing robust growth, driven by technological advancements, increasing demand for aesthetic dental solutions, and expanding awareness of oral health. The market is projected to grow at a significant rate, with innovations such as clear aligners, self-ligating braces, and AI-driven treatment planning gaining popularity. These advancements are improving treatment outcomes and enhancing patient satisfaction, particularly among adults seeking discreet options. Regionally, Asia-Pacific is witnessing strong growth, with policy changes in countries like China boosting market demand. In addition, North America continues to be a key player, benefiting from a steady increase in patient traffic and advancements in orthodontic materials. However, challenges like high treatment costs, unfavorable reimbursement policies, and the need for continuous innovation remain. Despite these hurdles, the market’s overall outlook remains positive as more consumers and practitioners embrace modern orthodontic solutions.
Report Scope and Asia-Pacific Orthodontic Supplies Market Segmentation
|
Attributes |
Asia-Pacific Orthodontic Supplies MarketInsights |
|
Segments Covered |
|
|
Region Covered |
Japan, China, India, South Korea, Australia, Singapore, Thailand, Malaysia, Indonesia, Vietnam, Philippines, Taiwan, New Zealand, and Rest of Asia-Pacific |
|
Key Market Players |
Ormco Corporation (U.S.), 3M (U.S.), American Orthodontics (U.S.), Dentsply Sirona (U.S.), Institut Straumann AG (Switzerland), Aditek do Brasil S.A. (Brazil), DENTAURUM GmbH & Co. KG (Germany), FORESTADENT - Bernhard Foerster GmbH (Germany), G&H Orthodontics (U.S.), Gestenco International AB (Sweden), Great Lakes Dental Technologies (U.S.), Henry Schein, Inc. (U.S.), Leone S.p.A. (Italy), LightForce (U.S.), Modern Orthodontics (India), OrthoAmerica Holdings LLC. (U.S.), Shinye Orthodontic Products Co., Ltd. (China), and TP Orthodontics, Inc (U.S.) |
|
Market Opportunities |
|
|
Value Added Data Infosets |
In addition to the insights on market scenarios such as market value, growth rate, segmentation, geographical coverage, and major players, the market reports curated by the Data Bridge Market Research also include import export analysis, production capacity overview, production consumption analysis, price trend analysis, climate change scenario, supply chain analysis, value chain analysis, raw material/consumables overview, vendor selection criteria, PESTLE Analysis, Porter Analysis, and regulatory framework. |
Asia-Pacific Orthodontic Supplies Market Definition
The Asia-Pacific orthodontic supplies refer to the range of dental products and equipment specifically designed for orthodontic treatments in the Asia-Pacific region. These supplies include braces, aligners, retainers, wires, brackets, elastics, and other related materials used by orthodontists to correct dental misalignments and improve patients' oral health. The region, which includes countries like Japan, China, India, and Australia, has seen significant demand for advanced orthodontic products due to increasing awareness of dental health, rising disposable incomes, and technological advancements in orthodontics. Market trends focus on innovation, comfort, aesthetics, and cost-effective solutions for both patients and practitioners.
Asia-Pacific Orthodontic Supplies MarketDynamics
Drivers
- Rising Incidence of Malocclusion
The Asia-Pacific rise in malocclusion, a dental condition where teeth are misaligned, is significantly driving the demand for orthodontic treatments, including dental braces and clear aligners. According to a recent report from Fact.MR, the increasing prevalence of malocclusion is one of the primary factors fueling the growth of the orthodontics market.
As more people, especially children and young adults, are diagnosed with malocclusion, there is a growing awareness of its impact on both oral health and aesthetic appearance. The condition, which can cause difficulty in biting, chewing, and speaking, also leads to long-term dental issues like tooth decay and gum disease if untreated. These complications, along with the increasing importance placed on a perfect smile, are propelling more individuals toward seeking orthodontic treatments.
In recent years, there has been a significant shift in consumer preferences, with a growing inclination toward more discreet orthodontic solutions such as clear aligners and ceramic braces. As technological advancements have made treatments faster, more effective, and less visible, the accessibility of orthodontic care has increased, further fueling the demand.
Furthermore, rising disposable incomes, particularly in emerging economies, have made orthodontic treatments more accessible to a broader demographic. This has been accompanied by an increase in oral health awareness campaigns across various countries, emphasizing the importance of early diagnosis and treatment of malocclusion.
Industry experts also point to innovations in orthodontic technology, such as 3D printing and AI-powered diagnostic tools, as factors enhancing the efficiency and affordability of orthodontic treatments. As orthodontic care becomes increasingly accessible and appealing, the demand for braces and aligners is set to continue its upward trajectory.
For instance,
- In July 2022, according to the article published by BioSpace, a rising incidence of malocclusion, contributing to higher demand for dental braces. As more individuals seek treatments to address misaligned teeth, this trend drives the orthodontic market, boosting the need for innovative dental braces and related products. Increased awareness and demand for corrective treatments support market growth
- In December 2024, according to the article published by MDPI, advancements in orthodontic treatments, particularly focusing on innovative approaches to improving patient care and outcomes. It highlights the role of new materials, technologies like 3D printing, and digital tools in enhancing the effectiveness of treatments. These innovations are expected to drive growth in the orthodontic market
The rising incidence of malocclusion is shaping the orthodontic market, driving demand for corrective treatments such as braces and clear aligners. With a growing focus on both health and aesthetics, this trend highlights a substantial opportunity for the Asia-Pacific dental industry, making orthodontic care more accessible to a wider population.
- Increasing Aesthetic Preferences
The growing focus on aesthetics, particularly among adults and adolescents, has significantly boosted the demand for orthodontic products. As societal norms continue to emphasize appearance, more individuals are seeking orthodontic treatments to achieve a more aesthetically pleasing smile. This heightened awareness has led to a surge in popularity for clear aligners, lingual braces, and ceramic options, all of which offer discreet and effective alternatives to traditional metal braces. Consumers are increasingly prioritizing treatments that are less visible and more aligned with their aesthetic preferences, prompting orthodontic manufacturers to innovate and expand their product offerings. This shift towards more visually appealing orthodontic solutions is reshaping the market, with greater emphasis on customization, comfort, and aesthetics. As a result, the demand for clear aligners and other cosmetic orthodontic products has escalated, creating new growth opportunities within the dental industry. Furthermore, the increasing availability of these options, alongside their effectiveness in providing optimal dental alignment, continues to drive the market forward, making orthodontic care more accessible and desirable for a broader range of individuals. This transformation is not only benefiting orthodontic practices but also accelerating the development of new technologies and materials, contributing to the overall expansion of the orthodontic products market.
For instance,
- In January 2023, according to the article published by BDJ, the growing awareness of aesthetics, especially among adults and adolescents, has led to an increased demand for orthodontic treatments. This shift is driving innovation in orthodontic supplies, particularly clear aligners and cosmetic braces, resulting in greater market diversification and expanding opportunities for dental professionals worldwide
- In August 2024, according to the article published by MDPI, the use of artificial intelligence (AI) to automate the aesthetic component (AC) of the Index of Orthodontic Treatment Need (IOTN). Analyzing 1,009 pre-treatment intraoral photos, the AI demonstrated 77% sensitivity and 82% accuracy in predicting treatment needs, indicating its potential to support clinical evaluations of dental aesthetics
The growing emphasis on aesthetics, particularly among adults and adolescents, has significantly influenced the demand for orthodontic treatments. As consumers prioritize appearance and seek more discreet and effective solutions, innovations in orthodontic products like clear aligners and cosmetic braces are becoming increasingly popular. This shift in consumer preferences not only shapes the development of new orthodontic technologies but also opens up opportunities for dental professionals to offer a wider range of personalized, aesthetically appealing treatments. The trend towards more visually acceptable options is expected to continue driving advancements in the orthodontic field
- Technological Advancements in Orthodontic Care
Recent innovations in orthodontic technologies are significantly reshaping the landscape of dental care, especially in the orthodontic sector. Technologies such as 3D printing, digital scanning, and improved materials have not only enhanced the accuracy and customization of treatments but also streamlined the entire process, making it more efficient. 3D printing allows for the precise creation of orthodontic appliances tailored to individual needs, reducing the time and cost involved in the production of traditional braces and aligners. Digital scanning has largely replaced traditional impressions, making the process more comfortable and accurate, while also providing faster results for treatment planning. Moreover, the development of advanced materials, such as high-performance ceramic brackets and more durable, flexible wires, has made treatments less visible, more comfortable, and quicker, ultimately improving the patient experience. These technological advancements are driving a surge in the demand for orthodontic care, as patients are increasingly attracted to the benefits of faster treatments, reduced discomfort, and more aesthetically pleasing options. The growing reliance on these innovations is not only attracting a wider audience, particularly among adults seeking cosmetic improvements, but also encouraging orthodontic professionals to adopt these technologies to remain competitive and provide optimal patient outcomes.
For instance,
- In February 2024, according to the article published by Momentum, article highlights five key advancements in dental technology for 2024, including AI-powered diagnostics, 3D printing, and innovative smart dental tools. It also discusses new product launches, such as advanced intraoral scanners and AI-based treatment planning systems, which are enhancing patient care by improving accuracy and overall dental experiences
- In January 2024, according to the article published by MDPI, 3D printing has become a key driver in clear aligner fabrication by enabling faster production, enhanced customization, and reduced costs. It allows for precise patient-specific aligners, improving comfort and treatment efficiency. This technology’s ability to streamline manufacturing and reduce material waste accelerates the growth of the orthodontics market
Technological innovations are playing a pivotal role in the evolution of orthodontic care. From enhanced treatment precision to reduced treatment time, advancements like 3D printing, digital scanning, and superior materials are elevating the quality and accessibility of orthodontic treatments. As these technologies continue to evolve, they are expected to further drive the demand for orthodontic services, making them more efficient, personalized, and appealing to a broader range of patients. This trend highlights the increasing importance of staying at the forefront of technological developments in the orthodontic industry.
Opportunity
- Growing Demand for Clear Aligners
The growing demand for clear aligners presents a substantial opportunity in the Asia-Pacific orthodontic supplies market, as these innovative devices continue to reshape the way orthodontic treatments are approached. Clear aligners, such as Invisalign, have witnessed a significant surge in popularity due to their aesthetic, comfort, and convenience advantages over traditional metal braces. The shift toward clear aligners is driven largely by patient preference for discreet, nearly invisible orthodontic solutions, particularly among adults and image-conscious teenagers who wish to undergo treatment without the visibility of metal brackets and wires. As a result, the market for clear aligners has expanded rapidly, creating a lucrative opportunity for manufacturers, suppliers, and orthodontic professionals to meet the increasing demand for these customized, transparent devices. Advancements in technology, particularly 3D scanning and digital treatment planning, have further fueled this growth, allowing for the creation of highly precise, personalized aligners that improve the overall treatment experience. The ability of clear aligners to be removed for eating, drinking, and oral hygiene is another key factor driving their popularity, as it provides patients with greater flexibility and convenience compared to traditional braces. In addition, as clear aligner technology evolves, it is becoming increasingly effective in treating a broader range of orthodontic issues, from mild to complex misalignments, which has expanded the target demographic and opened new avenues for growth. Clear aligners also offer the appeal of faster treatment times compared to traditional methods, another selling point for patients looking for quicker results. As the market for clear aligners continues to grow, there is a corresponding surge in demand for the supporting products and services that enable their successful use—such as 3D scanning devices, aligner production materials, treatment management software, and patient monitoring tools. This creates a robust market opportunity for orthodontic suppliers to not only focus on the aligners themselves but also develop and distribute complementary technologies and accessories that support clear aligner treatments. The rising popularity of direct-to-consumer clear aligner brands, alongside increasing awareness of the benefits of clear aligners, further strengthens the market, pushing for more investment in research, development, and distribution channels. The growing Asia-Pacific preference for clear aligners marks a dynamic shift in the orthodontic industry, positioning it for sustained growth, where innovative product offerings and advancements in treatment technology present substantial opportunities for key stakeholders in the Asia-Pacific orthodontic supplies market.
For instance,
- In April 2023, according to the article published by science direct the growing demand for clear aligners (CAT) in orthodontics stems from advancements in biomaterials, CAD/CAM technologies, and aggressive marketing strategies. Direct-to-consumer advertising and social media have raised awareness, particularly among adult patients seeking aesthetic alternatives to traditional fixed appliances, contributing to CAT's increasing popularity over the past decade
- In June 2020, according to the article published by ResearchGate, the growing demand for clear aligners is driven by advancements that enhance comfort and aesthetics in orthodontic treatment. As more manufacturers enter the market, patient interest in clear aligners rises. Success depends on clinicians' expertise, proper case selection, and patient adherence, creating an expanding opportunity in orthodontics
In conclusion, the growing demand for clear aligners presents a significant opportunity in the Asia-Pacific orthodontic supplies market. As patients seek discreet, comfortable, and effective treatments, clear aligners are increasingly favored over traditional braces. Technological advancements have expanded their applicability and appeal, driving further market growth. This trend creates opportunities for orthodontic suppliers to innovate and offer complementary products, positioning them to meet the rising Asia-Pacific demand for clear aligners and related technologies.
Increased Insurance Coverage for Orthodontics
Increased insurance coverage for orthodontics represents a significant opportunity for the Asia-Pacific orthodontic supplies market, as it opens the door to a larger, more diverse patient base who can now access orthodontic treatments they may have otherwise been unable to afford. In recent years, there has been a growing trend among insurance providers to expand their coverage for orthodontic treatments, including both traditional braces and newer options like clear aligners. This shift is largely driven by an increased awareness of the long-term health benefits of orthodontics, such as improved oral hygiene, prevention of tooth decay, and better overall dental function. As a result, more patients are now able to seek treatment, leading to a surge in demand for orthodontic appliances, tools, and products. The expanded insurance coverage not only lowers the financial barrier for patients but also boosts the number of people willing to undergo orthodontic care, creating a broader market for orthodontic suppliers. This trend is especially prominent in regions where orthodontic treatments were previously considered a luxury or were out of reach for many. With insurance providers increasingly covering a portion or even the full cost of orthodontic treatments, more people are likely to opt for advanced solutions like clear aligners, ceramic braces, and other innovative orthodontic technologies. This growing accessibility is a prime opportunity for manufacturers and suppliers to expand their product offerings and cater to a broader, more diverse consumer demographic. In addition, as the demand for orthodontic treatments rises, orthodontic practices and suppliers will need to adapt by offering more affordable, insurance-compatible solutions to meet the needs of insured patients. The expansion of insurance coverage for orthodontics, therefore, represents a key factor driving growth in the Asia-Pacific orthodontic supplies market, making it a critical area for investment and innovation.
For instance,
- In August 2022, according to the article published by NCBI, facilitating access and encouraging higher expenditure. Studies reveal that insurance, such as Medicaid, enhances the likelihood of dental visits, particularly among low-income individuals. Expanding coverage could lead to greater utilization of orthodontic services and improved oral health outcomes
- In May 2021, according to the article published by NCBI, the for orthodontics presents an opportunity to improve accessibility to care. While private insurance plans vary, offering higher coverage can encourage more visits and higher expenditures. Plans like Delta Dental, with options ranging from co-pays to partial coverage, provide flexibility, enhancing treatment opportunities for individuals seeking orthodontic services
In conclusion, increased insurance coverage for orthodontics creates significant growth opportunities in the Asia-Pacific orthodontic supplies market. As more patients gain access to affordable treatments, demand for advanced orthodontic solutions, including clear aligners and custom appliances, is rising. This trend encourages innovation and expansion, benefiting both suppliers and patients worldwide.
Restraints/Challenge
- Regulatory Requirements in Orthodontics
Regulatory requirements in orthodontics play a critical role in ensuring patient safety and the effectiveness of treatments, but they also present significant challenges for manufacturers. Compliance with these standards often requires substantial investments in product testing, quality assurance processes, certifications, and regular audits. These compliance measures can be time-consuming and expensive, especially for small and medium-sized companies, as they may need to allocate resources for updating product designs, conducting trials, and meeting specific safety protocols. Moreover, manufacturers must also adapt to changing regulations, which can involve costly adjustments to manufacturing processes and product lines. These stringent standards can also slow down the speed at which new technologies, such as innovative materials or treatment devices, are brought to market. In some cases, regulatory delays can hinder the adoption of cutting-edge treatments, affecting both patients and orthodontic practitioners who seek the latest solutions to meet their needs. As such, while these regulatory requirements are crucial for ensuring the highest standards of care, they also act as a barrier to market growth and innovation in the field.
For instance,
- In June 2024, according to the article published by Scientific Research, Regulatory requirements in orthodontics can delay market growth due to lengthy approval processes, safety assessments, and high compliance costs. Regional variations in regulations also create challenges for manufacturers. These hurdles can slow innovation and limit access to advanced orthodontic products, despite ensuring patient safety and treatment efficacy
- In July 2023, according to the article published by ResearchGate, the study highlights that regulatory requirements in orthodontics often create barriers for orthodontists in adopting innovative technologies. These challenges include time-consuming approval processes, compliance with stringent safety standards, and the complexity of navigating local and international regulations. Such hurdles can delay the availability of new treatments and increase costs for practitioners and patients alike
In conclusion, regulatory compliance, although essential for maintaining safety and efficacy, creates significant challenges for manufacturers in the orthodontic sector. The costs and delays associated with meeting regulatory standards can inhibit innovation, increase the cost of treatment, and ultimately limit accessibility to the latest orthodontic technologies for both patients and providers.
- Lack of Awareness about Orthodontic Supplies
In various regions, the adoption of orthodontic supplies and treatments can be significantly hindered due to a lack of awareness. Many people are unaware of the advantages orthodontic treatments offer, such as enhancing oral health, improving self-esteem, and preventing more severe dental issues in the future. In addition, the understanding of modern orthodontic technologies, such as clear aligners, temporary skeletal anchorage devices (TSADs), and advanced braces, is often limited to only a few professionals and patients who are already involved in orthodontic care. Without widespread knowledge, potential patients may not recognize the need for orthodontic intervention, especially if they don't experience obvious dental problems. This can be compounded by misconceptions or misinformation about the treatment process, costs, or perceived discomfort, leading individuals to overlook orthodontic care altogether.
Furthermore, regions with less access to dental professionals or specialized care are more likely to face this awareness gap. In these areas, dental care may focus more on urgent, immediate needs rather than preventive or elective treatments like orthodontics. In addition, cultural factors and financial constraints can contribute to low demand for such services, as individuals may prioritize other health concerns over orthodontic procedures. The lack of widespread education on the long-term benefits of orthodontics, such as preventing tooth decay, gum disease, and other bite-related issues, also plays a significant role. As a result, potential patients in these areas are less likely to seek out orthodontic consultations or invest in orthodontic products.
The absence of awareness can also affect market growth by limiting the demand for orthodontic products and services. Companies that provide orthodontic supplies may struggle to expand in regions where demand is low, and they may face difficulties in educating both the public and dental professionals about the importance of investing in orthodontic care. This can reduce the overall sales potential of orthodontic supplies, as people may not realize the value these products provide in achieving better oral health and aesthetics. This lack of awareness ultimately hampers the ability of the orthodontic market to grow and thrive, especially in areas where the benefits of orthodontic care are not widely recognized.
For instance,
- In June 2024, according to the article published by ResearchGate, The study highlights that limited awareness of smartphone orthodontic apps among patients acts as a restraint in their adoption. Many individuals are unfamiliar with the availability and benefits of these apps, which can offer convenience and efficiency in orthodontic care. This knowledge gap reduces the potential market and usage
- In September 2024, according to the article published by BDJ, discusses challenges in orthodontic care, emphasizing that limited knowledge of advanced techniques and technologies can act as a restraint. Lack of awareness among patients and practitioners about newer treatment options or benefits can hinder their adoption, ultimately limiting the progress and growth of the orthodontic field
In conclusion, the lack of awareness about the benefits and importance of orthodontic supplies significantly limits the market's growth potential, especially in under-informed regions. By addressing this awareness gap through education, outreach programs, and community-based initiatives, it is possible to increase demand for orthodontic care, thereby boosting both market adoption and growth. Increasing public understanding of the long-term benefits of orthodontics is crucial to driving market expansion and ensuring that individuals in all regions have access to the care they need.
Asia-Pacific Orthodontic Supplies Market Market Scope
Asia-Pacific orthodontic supplies market is segmented into six notable segments based on product type, patient type, material type, application, end user, and distribution channel.The growth amongst these segments will help you analyze meagre growth segments in the industries and provide the users with a valuable market overview and market insights to help them make strategic decisions for identifying core market applications.
Product Type
- Removable Orthodontic Appliances
- Clear Aligners
- Retainers
- Vacuum-Formed Retainers
- Hawley Retainers
- Fixed Orthodontic Appliances
- Brackets
- By Type
- Metal Brackets
- Ceramic Brackets
- Self-Ligating Brackets
- Lingual Brackets
- By Type
- Brackets
- By Type
- Bands And Buccal Tubes
- Miniscrews
- By Type
- Archwires
- Stainless Steel Archwires
- Beta Titanium Archwires
- Nickel Titanium Archwires
- Anchorage Appliances
- Brackets
- Adhesives And Accessories
- Elastomeric Products
- By Product Type
- Elastomeric Ligatures
- Elastomeric Chains
- By Product Type
- Orthodontic Adhesives
- Others
- Elastomeric Products
Patient Type
- Children And Teenagers
- Adults
Material Type
- Brackets
- Metal
- Ceramic
- Plastic
- Composite
- Archwire
- Stainless Steel Archwires
- Beta Titanium Archwires
- Nickel Titanium Archwires
- Aligner And Retainers
- Thermoplastics
- Polyurethane
- Polyethylene Terephthalate Glycol
- Others
Application
- Malocclusion Treatment
- Class I Malocclusion
- Class Ii Malocclusion
- Class Iii Malocclusion
- Corrective Orthodontics
- Preventive Orthodontics
End User
- Dental Clinics
- Hospitals
- Academic And Research Institutes
Distribution Channel
- Direct Tenders
- Retail Sales
- Others
Asia-Pacific Orthodontic Supplies Market Regional Analysis
The market is analyzed and market size insights and trends are provided country, product type, patient type, material type, application, end user, and distribution channel as referenced above.
The countries covered in the market are Japan, China, India, South Korea, Australia, Singapore, Thailand, Malaysia, Indonesia, Vietnam, Philippines, Taiwan, New Zealand, and rest of Asia-Pacific.
China is expected to dominate the orthodontic supplies market due to its large population, growing dental awareness, rising disposable incomes, and expanding healthcare infrastructure, driving demand for orthodontic treatments and products.
India is the fastest-growing country in the Asia-Pacific orthodontic supplies market due to its large youth population, increasing awareness of dental health, rising disposable incomes, and expanding urban healthcare infrastructure.
The country section of the report also provides individual market impacting factors and changes in regulation in the market domestically that impacts the current and future trends of the market. Data points like down-stream and upstream value chain analysis, technical trends and porter's five forces analysis, case studies are some of the pointers used to forecast the market scenario for individual countries. Also, the presence and availability of Asia-Pacific brands and their challenges faced due to large or scarce competition from local and domestic brands, impact of domestic tariffs and trade routes are considered while providing forecast analysis of the country data.
Asia-Pacific Orthodontic Supplies Market Share
The market competitive landscape provides details by competitor. Details included are company overview, company financials, revenue generated, market potential, investment in research and development, new market initiatives, Asia-Pacific presence, production sites and facilities, production capacities, company strengths and weaknesses, product launch, product width and breadth, application dominance. The above data points provided are only related to the companies' focus related to market.
Asia-Pacific Orthodontic Supplies Market Leaders Operating in the Market Are:
- Ormco Corporation (U.S.)
- 3M (U.S.)
- American Orthodontics (U.S.)
- Dentsply Sirona (U.S.)
- Institut Straumann AG (Switzerland)
- Aditek do Brasil S.A. (Brazil)
- DENTAURUM GmbH & Co. KG (Germany)
- FORESTADENT - Bernhard Foerster GmbH (Germany)
- G&H Orthodontics (U.S.)
- Gestenco International AB (Sweden)
- Great Lakes Dental Technologies (U.S.)
Latest Developments Asia-Pacific Orthodontic Supplies Market
- In May 2022, the Straumann Group entered into an agreement to acquire PlusDental, a provider of orthodontic treatment solutions in Europe. This acquisition will enhance the Group's consumer expertise and unlock new growth opportunities. PlusDental has established an extensive network of clinics across Europe, which will help accelerate the Group’s expansion, particularly in the Netherlands, Sweden, and the UK
- In August 2022, Dentsply Sirona introduced the X-Smart Pro+ endodontic motor and Reciproc Blue file in the United States, offering a streamlined one-file endodontic solution. The X-Smart Pro+ motor delivers up to 7.5 N·cm torque and 3,000 rpm speed, featuring an integrated apex locator with Dynamic Accuracy technology for precise length measurement during active shaping. The Reciproc Blue file is designed for universal use, enabling root canal preparation without the need for an initial glide path in most cases. This combination simplifies endodontic procedures, enhancing efficiency and patient outcomes
- In August 2023, Ormco Corporation introduced Spark Clear Aligners Release 14, enhancing flexibility for orthodontists with the launch of Spark Approver Web and seamless DEXIS IOS integration, along with clinical and workflow updates. Spark Approver Web offers increased convenience, allowing orthodontists to access cases at any time, saving valuable time and improving workflow efficiency
- In March 2023, FORESTADENT partnered with Graphy Inc. to distribute their innovative Tera Harz TC-85 resin for direct aligner printing. This collaboration enables the creation of precisely tailored aligners with shape memory properties, improving treatment results with consistent light forces. The partnership also includes UNIZ Technology for compatible 3D printers, advancing digital orthodontics Asia-Pacificly
- In August 2024, Henry Schein Orthodontics launched the Carrierer Motion Pro Bite appliance, designed to enhance orthodontic treatments by improving bite correction and tooth movement efficiency. This innovative device provides more predictable outcomes by delivering optimal force to correct bite misalignments. Its unique design helps shorten treatment time, reduce discomfort, and improve patient compliance. The Carrierer Motion Pro Bite is a valuable tool for orthodontists, offering enhanced precision and effectiveness. It also benefits patients by offering faster, more comfortable treatments, ultimately contributing to better orthodontic care and a higher rate of treatment success
SKU-
Accédez en ligne au rapport sur le premier cloud mondial de veille économique

- Tableau de bord d'analyse de données interactif
- Tableau de bord d'analyse d'entreprise pour les opportunités à fort potentiel de croissance
- Accès d'analyste de recherche pour la personnalisation et les requêtes
- Analyse de la concurrence avec tableau de bord interactif
- Dernières actualités, mises à jour et analyse des tendances
- Exploitez la puissance de l'analyse comparative pour un suivi complet de la concurrence
Table des matières
1 INTRODUCTION
1.1 OBJECTIVES OF THE STUDY
1.2 MARKET DEFINITION
1.3 OVERVIEW OF THE ASIA-PACIFIC ORTHODONTIC SUPPLIES MARKET
1.4 CURRENCY AND PRICING
1.5 LIMITATIONS
1.6 MARKETS COVERED
2 MARKET SEGMENTATION
2.1 MARKETS COVERED
2.2 GEOGRAPHICAL SCOPE
2.3 YEARS CONSIDERED FOR THE STUDY
2.4 DBMR TRIPOD DATA VALIDATION MODEL
2.5 MULTIVARIATE MODELLING
2.6 LIFELINE CURVE
2.7 PRIMARY INTERVIEWS WITH KEY OPINION LEADERS
2.8 DBMR MARKET POSITION GRID
2.9 DBMR MARKET POSITION END USER COVERAGE
2.1 VENDOR SHARE ANALYSIS
2.11 SECONDARY SOURCES
2.12 ASSUMPTIONS
3 EXECUTIVE SUMMARY
4 PREMIUM INSIGHTS
4.1 PORTER’S FIVE FORCES
4.2 PESTEL ANALYSIS
4.3 VALUE CHAIN ANALYSIS
4.4 COMPANY COMPARATIVE ANALYSIS
4.5 EVALUATION OF RETAIL VS. DISTRIBUTOR SALES MODELS AND DIRECT SALES STRATEGIES
5 ASIA-PACIFIC ORTHODONTIC SUPPLIES MARKET: REGULATIONS
5.1.1 NORTH AMERICA (USA AND CANADA)
5.1.2 EUROPEAN UNION (EU)
5.1.3 ASIA-PACIFIC
5.1.4 LATIN AMERICA
5.1.5 MIDDLE EAST AND AFRICA
5.2 REGULATORY CHALLENGES AND STRATEGIES
6 MARKET OVERVIEW
6.1 DRIVERS
6.1.1 RISING INCIDENCE OF MALOCCLUSION DRIVING SURGE IN DENTAL BRACES DEMAND
6.1.2 INCREASING AESTHETIC PREFERENCES BOOST DEMAND FOR ORTHODONTIC PRODUCTS
6.1.3 TECHNOLOGICAL ADVANCEMENTS FUEL GROWTH IN ORTHODONTIC CARE
6.1.4 INCREASE IN DENTAL CARE EXPENDITURE
6.2 RESTRAINTS
6.2.1 REGULATORY REQUIREMENTS IN ORTHODONTICS
6.2.2 LACK OF AWARENESS ABOUT ORTHODONTIC SUPPLIES
6.3 OPPORTUNITIES
6.3.1 GROWING DEMAND FOR CLEAR ALIGNERS DRIVES GROWTH IN ORTHODONTIC SUPPLIES
6.3.2 INCREASED INSURANCE COVERAGE FOR ORTHODONTICS EXPANDS OPPORTUNITIES IN ORTHODONTIC SUPPLIES
6.3.3 CUSTOMIZATION AND PERSONALIZATION OF TREATMENTS ENHANCE ORTHODONTIC SUPPLIES MARKET DEMAND
6.4 CHALLENGES
6.4.1 ADVERSE EFFECTS FROM POOR TREATMENT HINDER PROGRESS IN ORTHODONTICS
6.4.2 SHORTAGE OF SKILLED PROFESSIONALS LIMITS ADVANCEMENTS IN ORTHODONTIC FIELD
7 ASIA-PACIFIC ORTHODONTIC SUPPLIES MARKET, BY PRODUCT TYPE
7.1 OVERVIEW
7.2 REMOVABLE ORTHODONTIC APPLIANCES
7.2.1 CLEAR ALIGNERS
7.2.2 RETAINERS
7.2.2.1 VACUUM-FORMED RETAINERS AND
7.2.2.2 HAWLEY RETAINERS
7.3 FIXED ORTHODONTIC APPLIANCES
7.3.1 BRACKETS
7.3.1.1 METAL BRACKETS
7.3.1.2 CERAMIC BRACKETS
7.3.1.3 SELF-LIGATING BRACKETS
7.3.1.4 LINGUAL BRACKETS
7.3.1.4.1 BANDS AND BUCCAL TUBES
7.3.1.4.2 MINISCREWS
7.3.2 ARCHWIRES
7.3.2.1 STAINLESS STEEL ARCHWIRES
7.3.2.2 BETA TITANIUM ARCHWIRES
7.3.2.3 NICKEL TITANIUM ARCHWIRES
7.3.3 ANCHORAGE APPLIANCES
7.3.4 OTHERS
7.4 ADHESIVES AND ACCESSORIES
7.4.1 ELASTOMERIC PRODUCTS
7.4.1.1 ELASTOMERIC LIGATURES
7.4.1.2 ELASTOMERIC CHAINS
7.4.2 ORTHODONTIC ADHESIVES
7.4.3 OTHERS
8 ASIA-PACIFIC ORTHODONTIC SUPPLIES MARKET, BY PATIENT TYPE
8.1 OVERVIEW
8.2 CHILDREN AND TEENAGERS
8.3 ADULTS
9 ASIA-PACIFIC ORTHODONTIC SUPPLIES MARKET, BY MATERIAL TYPE
9.1 OVERVIEW
9.2 BRACKETS
9.2.1 METAL
9.2.2 CERAMIC
9.2.3 PLASTIC
9.2.4 COMPOSITE
9.3 ARCHWIRE
9.3.1 STAINLESS STEEL ARCHWIRES
9.3.2 BETA TITANIUM ARCHWIRES
9.3.3 NICKEL TITANIUM ARCHWIRES
9.4 ALIGNER AND RETAINERS
9.4.1 THERMOPLASTICS
9.4.2 POLYURETHANE
9.4.3 POLYETHYLENE TEREPHTHALATE GLYCOL
9.4.4 OTHERS
10 ASIA-PACIFIC ORTHODONTIC SUPPLIES MARKET, BY APPLICATION
10.1 OVERVIEW
10.2 MALOCCLUSION TREATMENT
10.2.1 CLASS I MALOCCLUSION
10.2.2 CLASS II MALOCCLUSION
10.2.3 CLASS III MALOCCLUSION
10.3 CORRECTIVE ORTHODONTICS
10.4 PREVENTIVE ORTHODONTICS
11 ASIA-PACIFIC ORTHODONTIC SUPPLIES MARKET, BY END USER
11.1 OVERVIEW
11.2 DENTAL CLINICS
11.3 HOSPITALS
11.4 ACADEMIC AND RESEARCH INSTITUTES
12 ASIA-PACIFIC ORTHODONTIC SUPPLIES MARKET, BY DISTRIBUTION CHANNEL
12.1 OVERVIEW
12.2 DIRECT TENDERS
12.3 RETAIL SALES
12.4 OTHERS
13 ASIA-PACIFIC ORTHODONTIC SUPPLIES MARKET, BY REGION
13.1 ASIA-PACIFIC
13.1.1 CHINA
13.1.2 JAPAN
13.1.3 INDIA
13.1.4 SOUTH KOREA
13.1.5 AUSTRALIA
13.1.6 TAIWAN
13.1.7 SINGAPORE
13.1.8 THAILAND
13.1.9 MALAYSIA
13.1.10 INDONESIA
13.1.11 PHILIPPINES
13.1.12 NEW ZEALAND
13.1.13 VIETNAM
13.1.14 REST OF ASIA-PACIFIC
14 ASIA-PACIFIC ORTHODONTIC SUPPLIES MARKET: COMPANY LANDSCAPE
14.1 COMPANY SHARE ANALYSIS: ASIA-PACIFIC
15 SWOT ANALYSIS
16 COMPANY PROFILE
16.1 INSTITUT STRAUMANN AG
16.1.1 COMPANY SNAPSHOT
16.1.2 REVENUE ANALYSIS
16.1.3 COMPANY SHARE ANALYSIS
16.1.4 PRODUCT PORTFOLIO
16.1.5 RECENT DEVELOPMENTS
16.2 3M
16.2.1 COMPANY SNAPSHOT
16.2.2 REVENUE ANALYSIS
16.2.3 COMPANY SHARE ANALYSIS
16.2.4 PRODUCT PORTFOLIO
16.2.5 RECENT DEVELOPMENT
16.3 DENTSPLY SIRONA
16.3.1 COMPANY SNAPSHOT
16.3.2 REVENUE ANALYSIS
16.3.3 COMPANY SHARE ANALYSIS
16.3.4 PRODUCT PORTFOLIO
16.3.5 RECENT DEVELOPMENT
16.4 ORMCO CORPORATION
16.4.1 COMPANY SNAPSHOT
16.4.2 COMPANY SHARE ANALYSIS
16.4.3 PRODUCT PORTFOLIO
16.4.4 RECENT DEVELOPMENTS
16.5 AMERICAN ORTHODONTICS
16.5.1 COMPANY SNAPSHOT
16.5.2 COMPANY SHARE ANALYSIS
16.5.3 PRODUCT PORTFOLIO
16.5.4 RECENT DEVELOPMENTS
16.6 ADITEK DO BRASIL S.A.
16.6.1 COMPANY SNAPSHOT
16.6.2 PRODUCT PORTFOLIO
16.6.3 RECENT DEVELOPMENT
16.7 DENTAURUM GMBH & CO. KG
16.7.1 COMPANY SNAPSHOT
16.7.2 PRODUCT PORTFOLIO
16.7.3 RECENT DEVELOPMENT
16.8 FORESTADENT BERNHARD FÖRSTER GM
16.8.1 COMPANY SNAPSHOT
16.8.2 PRODUCT PORTFOLIO
16.8.3 RECENT DEVELOPMENT
16.9 GESTENCO INTERNATIONAL AB
16.9.1 COMPANY SNAPSHOT
16.9.2 PRODUCT PORTFOLIO
16.9.3 RECENT DEVELOPMENT
16.1 G&H ORTHODONTICS
16.10.1 COMPANY SNAPSHOT
16.10.2 PRODUCT PORTFOLIO
16.10.3 RECENT DEVELOPMENT
16.11 GREAT LAKES DENTAL TECHNOLOGIES
16.11.1 COMPANY SNAPSHOT
16.11.2 PRODUCT PORTFOLIO
16.11.3 RECENT DEVELOPMENT
16.12 HENRY SCHEIN, INC
16.12.1 COMPANY SNAPSHOT
16.12.2 REVENUE ANALYSIS
16.12.3 PRODUCT PORTFOLIO
16.12.4 RECENT DEVELOPMENT
16.13 LEONE S.P.A
16.13.1 COMPANY SNAPSHOT
16.13.2 PRODUCT PORTFOLIO
16.13.3 RECENT DEVELOPMENT
16.14 LIGHTFORCE
16.14.1 COMPANY SNAPSHOT
16.14.2 PRODUCT PORTFOLIO
16.14.3 RECENT DEVELOPMENT
16.15 MODERN ORTHODONTICS
16.15.1 COMPANY SNAPSHOT
16.15.2 PRODUCT PORTFOLIO
16.15.3 RECENT DEVELOPMENT
16.16 ORTHOAMERICA HOLDINGS LLC
16.16.1 COMPANY SNAPSHOT
16.16.2 PRODUCT PORTFOLIO
16.16.3 RECENT DEVELOPMENT
16.17 SHINYE ORTHODONTIC PRODUCTS CO.,LTD.
16.17.1 COMPANY SNAPSHOT
16.17.2 PRODUCT PORTFOLIO
16.17.3 RECENT DEVELOPMENT
16.18 TP ORTHODONTICS, INC.
16.18.1 COMPANY SNAPSHOT
16.18.2 PRODUCT PORTFOLIO
16.18.3 RECENT DEVELOPMENT
17 QUESTIONNAIRE
18 RELATED REPORTS
Liste des tableaux
TABLEAU 1 INNOVATION TECHNOLOGIQUE ET DOUANISATION
TABLEAU 2 RENFORCEMENTS COMPÉTITIFS ET FAIBLES
TABLEAU 3 CHANGEMENTS DE CROISSANCE PAR SOCIÉTÉ
TABLEAU 4 PAR CATÉGORIE DE PRODUITS
TABLEAU 5 COMPARAISON COMPÉTITIVE DE PRICTION (ALIGNEURS CLÉS VS. BRACCES)
TABLEAU 6 COMPARAISON DES MODÈLES DE VENTES DIRECTES
TABLEAU 7 MARCHÉ DES COMPLÉMENTS ORTHODONTIQUES ASIE-PACIFIQUE, PAR TYPE DE PRODUITS, 2018-2032 (MILLIERS USD)
TABLEAU 8 APPLICABLES ORTHODONTIQUES EN ASIE-PACIFIQUE SUR LE MARCHÉ DES COMPLÉMENTS ORTHODONTIQUES, PAR RÉGION, 2018-2032 (en millions de dollars)
TABLEAU 9 APPLICABLES ORTHODONTIQUES EN ASIE-PACIFIQUE SUR LE MARCHÉ DES COMPLÉMENTS ORTHODONTIQUES, PAR TYPE DE PRODUITS, 2018-2032 (MILLIERS DE USD)
TABLEAU 10 RETENEURS ASIE-PACIFIQUES SUR LE MARCHÉ DES COMPLÉMENTS ORTHODONTIQUES, PAR TYPE DE PRODUITS, 2018-2032 (MILLIERS USD)
TABLEAU 11 APPLICABLES ORTHODONTIQUES FIXES ASIE-PACIFIQUE SUR LE MARCHÉ DES COMPLÉMENTS ORTHODONTIQUES, PAR RÉGION, 2018-2032 (en millions de dollars)
TABLEAU 12 APPLICABLES ORTHODONTIQUES FIXES ASIE-PACIFIQUE SUR LE MARCHÉ DES COMPLÉMENTS ORTHODONTIQUES, PAR TYPE DE PRODUITS, 2018-2032 (MILLIERS USD)
TABLEAU 13 BRACKETS ASIE-PACIFIQUES SUR LE MARCHÉ DES COMPLÉMENTS ORTHODONTIQUES, PAR TYPE, 2018-2032 (en MILLE USD)
TABLEAU 14 BRACKETS ASIE-PACIFIQUES SUR LE MARCHÉ DES COMPLÉMENTS ORTHODONTIQUES, PAR COMPOSANT, 2018-2032 (en milliers de dollars)
TABLEAU 15 ARCHWIRES ASIE-PACIFIQUES SUR LE MARCHÉ DES COMPLÉMENTS ORTHODONTIQUES, PAR TYPE, 2018-2032 (en milliers de dollars)
TABLEAU 16 ADHÉSIFS ET ACCESSOIRES ASIE-PACIFIQUES SUR LE MARCHÉ DES COMPLÉMENTS ORTHODONTIQUES, PAR RÉGION, 2018-2032 (MILLIERS DE USD)
TABLEAU 17 ADHÉSIFS ET ACCESSOIRES ASIE-PACIFIQUES SUR LE MARCHÉ DES COMPLÉMENTS ORTHODONTIQUES, PAR PRODUITS, 2018-2032 (MILLIERS USD)
TABLEAU 18 ADHÉSIFS ET ACCESSOIRES ASIE-PACIFIQUES SUR LE MARCHÉ DES COMPLÉMENTS ORTHODONTIQUES, PAR PRODUITS, 2018-2032 (MILLIERS USD)
TABLEAU 19 MARCHÉ DES COMPLÉMENTS ORTHODONTIQUES ASIE-PACIFIQUE, PAR TYPE DE PATIENTS, 2018-2032 (MILLIERS USD)
TABLEAU 20 ENFANTS ET ENSEIGNANTS ASIE-PACIFIQUES SUR LE MARCHÉ DES COMPLÉMENTS ORTHODONTIQUES, PAR RÉGION, 2018-2032 (en milliers de dollars)
TABLEAU 21 ADAPTATIONS ASIE-PACIFIQUES DU MARCHÉ DES COMPLÉMENTS ORTHODONTIQUES, PAR RÉGION, 2018-2032 (MILLIERS USD)
TABLEAU 22 MARCHÉ DES COMPLÉMENTS ORTHODONTIQUES ASIE-PACIFIQUE, PAR TYPE DE MATÉRIAUX, 2018-2032 (MILLIERS USD)
TABLEAU 23 BRACLES ASIE-PACIFIQUES SUR LE MARCHÉ DES COMPLÉMENTS ORTHODONTIQUES, PAR RÉGION, 2018-2032 (en MILLE USD)
TABLEAU 24 BRACETTES ASIE-PACIFIQUES SUR LE MARCHÉ DES COMPLÉMENTS ORTHODONTIQUES, PAR TYPE, 2018-2032 (en MILLE USD)
TABLEAU 25 ARCHWIRE ASIE-PACIFIQUE SUR LE MARCHÉ DES COMPLÉMENTS ORTHODONTIQUES, PAR RÉGION, 2018-2032 (MILLIERS USD)
TABLEAU 26 ARCHWIRE ASIE-PACIFIQUE SUR LE MARCHÉ DES COMPLÉMENTS ORTHODONTIQUES, PAR TYPE, 2018-2032 (MILLIERS USD)
TABLEAU 27 ALIGNEUR ET RETENEURS ASIE-PACIFIQUES SUR LE MARCHÉ DES COMPLÉMENTS ORTHODONTIQUES, PAR RÉGION, 2018-2032 (MILLIERS USD)
TABLEAU 28 ALIGNEUR ET RETENEURS ASIE-PACIFIQUES SUR LE MARCHÉ DES COMPLÉMENTS ORTHODONTIQUES, PAR TYPE, 2018-2032 (en milliers de dollars)
TABLEAU 29 MARCHÉ DES COMPLÉMENTS ORTHODONTIQUES ASIE-PACIFIQUE, PAR DEMANDE, 2018-2032 (en MILLIERS)
TABLEAU 30 TRAITEMENT DE LA MALOCCLUSION ASIE-PACIFIQUE SUR LE MARCHÉ DES COMPLÉMENTS ORTHODONTIQUES, PAR RÉGION, 2018-2032 (MILLIERS DE USD)
TABLEAU 31 TRAITEMENT DE LA MALOCCLUSION ASIE-PACIFIQUE SUR LE MARCHÉ DES COMPLÉMENTS ORTHODONTIQUES, PAR APPLICATION, 2018-2032 (MILLIERS USD)
TABLEAU 32 ORTHODONTIQUES CORRECTIVES ASIE-PACIFIQUES SUR LE MARCHÉ DES COMPLÉMENTS ORTHODONTIQUES, PAR RÉGION, 2018-2032 (en millions de dollars)
TABLEAU 33 ORTHODONTIQUES PRÉVENTIVES ASIE-PACIFIQUES SUR LE MARCHÉ DES COMPLÉMENTS ORTHODONTIQUES, PAR RÉGION, 2018-2032 (en milliers de dollars)
TABLEAU 34 MARCHÉ DES COMPLÉMENTS ORTHODONTIQUES ASIE-PACIFIQUE, PAR UTILISATEUR FINAL, 2018-2032 (MILLIERS USD)
TABLEAU 35 CLINIQUES DENTALES ASIE-PACIFIQUES SUR LE MARCHÉ DES COMPLÉMENTS ORTHODONTIQUES, PAR RÉGION, 2018-2032 (MILLIERS DE USD)
TABLEAU 36 HÔPITALS ASIE-PACIFIQUES SUR LE MARCHÉ DES COMPLÉMENTS ORTHODONTIQUES, PAR RÉGION, 2018-2032 (MILLIERS USD)
TABLEAU 37 INSTITUTS ACADÉMIQUES ET DE RECHERCHE ASIE-PACIFIQUE SUR LE MARCHÉ DES COMPLÉMENTS ORTHODONTIQUES, PAR RÉGION, 2018-2032 (en millions de dollars)
TABLEAU 38 MARCHÉ DES COMPLÉMENTS ORTHODONTIQUES ASIE-PACIFIQUE, PAR CHANEAU DE DISTRIBUTION, 2018-2032 (en milliers de dollars)
TABLEAU 39 INDICATEURS DIRECTS ASIE-PACIFIQUES DU MARCHÉ DES COMPLÉMENTS ORTHODONTIQUES, PAR RÉGION, 2018-2032 (en milliers de dollars É.-U.)
TABLEAU 40 VENTES DE DÉTAILLAGE ASIE-PACIFIQUE SUR LE MARCHÉ DES COMPLÉMENTS ORTHODONTIQUES, PAR RÉGION, 2018-2032 (en MILLOIS USD)
TABLEAU 41 AUTRES AIDE-PACIFIQUES SUR LE MARCHÉ DES COMPLÉMENTS ORTHODONTIQUES, PAR RÉGION, 2018-2032 (MILLIERS USD)
TABLEAU 42 MARCHÉ DES COMPLÉMENTS ORTHODONTIQUES ASIE-PACIFIQUE, PAR PAYS, 2018-2032 (en milliers de dollars)
TABLEAU 43 MARCHÉ DES COMPLÉMENTS ORTHODONTIQUES ASIE-PACIFIQUE, PAR TYPE DE PRODUITS, 2018-2032 (MILLIERS USD)
TABLEAU 44 APPLICABLES ORTHODONTIQUES EN ASIE-PACIFIQUE SUR LE MARCHÉ DES COMPLÉMENTS ORTHODONTIQUES, PAR TYPE DE PRODUITS, 2018-2032 (en milliers de dollars américains)
TABLEAU 45 RETENEURS ASIE-PACIFIQUES SUR LE MARCHÉ DES COMPLÉMENTS ORTHODONTIQUES, PAR TYPE DE PRODUITS, 2018-2032 (MILLIERS USD)
TABLEAU 46 APPLICABLES ORTHODONTIQUES FIXES ASIE-PACIFIQUE SUR LE MARCHÉ DES COMPLÉMENTS ORTHODONTIQUES, PAR TYPE DE PRODUITS, 2018-2032 (en milliers de dollars américains)
TABLEAU 47 BRACLES ASIE-PACIFIQUES SUR LE MARCHÉ DES COMPLÉMENTS ORTHODONTIQUES, PAR TYPE, 2018-2032 (MILLIERS USD)
TABLEAU 48 BRACLES ASIE-PACIFIQUES SUR LE MARCHÉ DES COMPLÉMENTS ORTHODONTIQUES, PAR COMPOSANT, 2018-2032 (MILLIERS USD)
TABLEAU 49 ARCHWIRS ASIE-PACIFIQUES SUR LE MARCHÉ DES COMPLÉMENTS ORTHODONTIQUES, PAR TYPE, 2018-2032 (en MILLIERS USD)
TABLEAU 50 ADHÉSIFS ET ACCESSOIRES ASIE-PACIFIQUES SUR LE MARCHÉ DES COMPLÉMENTS ORTHODONTIQUES, PAR PRODUITS, 2018-2032 (MILLIERS USD)
TABLEAU 51 PRODUITS ÉLASTOMÉRIQUES ASIE-PACIFIQUES SUR LE MARCHÉ DES COMPLÉMENTS ORTHODONTIQUES, PAR TYPE DE PRODUITS, 2018-2032 (en milliers de dollars américains)
TABLEAU 52 MARCHÉ DES COMPLÉMENTS ORTHODONTIQUES ASIE-PACIFIQUE, PAR TYPE DE PATIENTS, 2018-2032 (MILLIERS USD)
TABLEAU 53 MARCHÉ DES COMPLÉMENTS ORTHODONTIQUES ASIE-PACIFIQUE, PAR TYPE DE MATÉRIAUX, 2018-2032
TABLEAU 54 BRACLES ASIE-PACIFIQUES SUR LE MARCHÉ DES COMPLÉMENTS ORTHODONTIQUES, PAR TYPE, 2018-2032 (en MILLE USD)
TABLEAU 55 ARCHWIRE ASIE-PACIFIQUE SUR LE MARCHÉ DES COMPLÉMENTS ORTHODONTIQUES, PAR TYPE, 2018-2032 (en milliers de dollars)
TABLEAU 56 ALIGNEUR ET RETENEURS ASIE-PACIFIQUES SUR LE MARCHÉ DES COMPLÉMENTS ORTHODONTIQUES, PAR TYPE, 2018-2032 (en milliers de dollars)
TABLEAU 57 MARCHÉ DES COMPLÉMENTS ORTHODONTIQUES ASIE-PACIFIQUE, PAR DEMANDE, 2018-2032 (en MILLIERS USD)
TABLEAU 58 TRAITEMENT DE LA MALOCCLUSION ASIE-PACIFIQUE SUR LE MARCHÉ DES COMPLÉMENTS ORTHODONTIQUES, PAR DEMANDE, 2018-2032 (en MILLIERS DE USD)
TABLEAU 59 MARCHÉ DES COMPLÉMENTS ORTHODONTIQUES ASIE-PACIFIQUE, PAR UTILISATEUR DE FIN 2018-2032
TABLEAU 60 MARCHÉ DES COMPLÉMENTS ORTHODONTIQUES ASIE-PACIFIQUE, PAR CHANEAU DE DISTRIBUTION, 2018-2032 (en milliers de dollars)
TABLEAU 61 MARCHÉ DES COMPLÉMENTS ORTHODONTIQUES DE LA CHINE, PAR TYPE DE PRODUITS, 2018-2032 (MILLIERS USD)
TABLEAU 62 APPLICABLES ORTHODONTIQUES À LA CHINE SUR LE MARCHÉ DES COMPLÉMENTS ORTHODONTIQUES, PAR TYPE DE PRODUITS, 2018-2032 (MILLIERS USD)
TABLEAU 63 RÉTABLISSEURS DE CHINE SUR LE MARCHÉ DES COMPLÉMENTS ORTHODONTIQUES, PAR TYPE DE PRODUITS, 2018-2032 (MILLIERS USD)
TABLEAU 64 APPLICABLES ORTHODONTIQUES FIXES À LA CHINE SUR LE MARCHÉ DES COMPLÉMENTS ORTHODONTIQUES, PAR TYPE DE PRODUITS, 2018-2032 (en MILLIERS USD)
TABLEAU 65 BRACKETS DE CHINE SUR LE MARCHÉ DES COMPLÉMENTS ORTHODONTIQUES, PAR TYPE, 2018-2032 (MILLIERS USD)
TABLEAU 66 BRACKES DE CHINE SUR LE MARCHÉ DES COMPLÉMENTS ORTHODONTIQUES, PAR COMPOSANT, 2018-2032 (MILLIERS DE USD)
TABLEAU 67 ARCHWIRS DE CHINE SUR LE MARCHÉ DES COMPLÉMENTS ORTHODONTIQUES, PAR TYPE, 2018-2032 (en milliers d'USD)
TABLEAU 68 ADHÉSIFS ET ACCESSOIRES DE LA CHINE SUR LE MARCHÉ DES COMPLÉMENTS ORTHODONTIQUES, PAR PRODUITS, 2018-2032
TABLEAU 69 PRODUITS ÉLASTOMÉRIQUES DE LA CHINE SUR LE MARCHÉ DES COMPLÉMENTS ORTHODONTIQUES, PAR TYPE DE PRODUITS, 2018-2032 (MILLIERS USD)
TABLEAU 70 MARCHÉ DES COMPLÉMENTS ORTHODONTIQUES DE LA CHINE, PAR TYPE DE PATIENTS, 2018-2032 (en milliers de dollars)
TABLEAU 71 MARCHÉ DES COMPLÉMENTS ORTHODONTIQUES DE LA CHINE, PAR TYPE DE MATÉRIAUX, 2018-2032 (MILLIERS USD)
TABLEAU 72 BRACKETS DE CHINE SUR LE MARCHÉ DES COMPLÉMENTS ORTHODONTIQUES, PAR TYPE, 2018-2032 (MILLIERS USD)
TABLEAU 73 ARCHWIRE DE CHINE SUR LE MARCHÉ DES COMPLÉMENTS ORTHODONTIQUES, PAR TYPE, 2018-2032 (en milliers d'USD)
TABLEAU 74 ALIGNEUR DE CHINE ET RETENEURS SUR LE MARCHÉ DES COMPLÉMENTS ORTHODONTIQUES, PAR TYPE, 2018-2032 (MILLIERS USD)
TABLEAU 75 MARCHÉ DES COMPLÉMENTS ORTHODONTIQUES DE LA CHINE, PAR DEMANDE, 2018-2032 (en MILLEUR)
TABLEAU 76 TRAITEMENT DE LA MALOCCLUSION DE LA CHINE SUR LE MARCHÉ DES COMPLÉMENTS ORTHODONTIQUES, PAR DEMANDE, 2018-2032 (en MILLE USD)
TABLEAU 77 MARCHÉ DES COMPLÉMENTS ORTHODONTIQUES DE LA CHINE, PAR UTILISATEUR FINAL, 2018-2032 (MILLIERS USD)
TABLEAU 78 MARCHÉ DES COMPLÉMENTS ORTHODONTIQUES DE LA CHINE, PAR CHANEAU DE DISTRIBUTION, 2018-2032 (MILLIERS USD)
TABLEAU 79 MARCHÉ DES COMPLÉMENTS ORTHODONTIQUES DU JAPON, PAR TYPE DE PRODUITS, 2018-2032 (en milliers de dollars américains)
TABLEAU 80 APPLICABLES ORTHODONTIQUES AU JAPON SUR LE MARCHÉ DES COMPLÉMENTS ORTHODONTIQUES, PAR TYPE DE PRODUITS, 2018-2032 (en MILLIERS USD)
TABLEAU 81 RETENEURS DU JAPON SUR LE MARCHÉ DES COMPLÉMENTS ORTHODONTIQUES, PAR TYPE DE PRODUITS, 2018-2032 (MILLIERS USD)
TABLEAU 82 APPLICABLES ORTHODONTIQUES FIXES DU JAPON SUR LE MARCHÉ DES COMPLÉMENTS ORTHODONTIQUES, PAR TYPE DE PRODUITS, 2018-2032 (en MILLIERS USD)
TABLEAU 83 BRACKETS JAPON SUR LE MARCHÉ DES COMPLÉMENTS ORTHODONTIQUES, PAR TYPE, 2018-2032 (en milliers d'USD)
TABLEAU 84 BRACKETS DU JAPON SUR LE MARCHÉ DES COMPLÉMENTS ORTHODONTIQUES, PAR COMPOSANT, 2018-2032 (MILLIERS USD)
TABLEAU 85 ARCHWIRS DU JAPON SUR LE MARCHÉ DES COMPLÉMENTS ORTHODONTIQUES, PAR TYPE, 2018-2032 (MILLIERS USD)
TABLEAU 86 ADHÉSIFS ET ACCESSOIRES DU JAPON SUR LE MARCHÉ DES COMPLÉMENTS ORTHODONTIQUES, PAR PRODUITS, 2018-2032
TABLEAU 87 PRODUITS ÉLASTOMÉRIQUES DU JAPON SUR LE MARCHÉ DES COMPLÉMENTS ORTHODONTIQUES, PAR TYPE DE PRODUITS, 2018-2032 (MILLIERS USD)
TABLEAU 88 MARCHÉ DES COMPLÉMENTS ORTHODONTIQUES DU JAPON, PAR TYPE DE PATIENTS, 2018-2032 (en milliers de dollars)
TABLEAU 89 MARCHÉ DES COMPLÉMENTS ORTHODONTIQUES DU JAPON, PAR TYPE DE MATÉRIAUX, 2018-2032
TABLEAU 90 BRACKETS JAPON SUR LE MARCHÉ DES COMPLÉMENTS ORTHODONTIQUES, PAR TYPE, 2018-2032 (en milliers de dollars)
TABLEAU 91 ARCHWIRE JAPON SUR LE MARCHÉ DES COMPLÉMENTS ORTHODONTIQUES, PAR TYPE, 2018-2032 (en milliers de dollars)
TABLEAU 92 ALIGNEUR JAPON ET RETENEURS SUR LE MARCHÉ DES COMPLÉMENTS ORTHODONTIQUES, PAR TYPE, 2018-2032 (en MILLE USD)
TABLEAU 93 MARCHÉ DES COMPLÉMENTS ORTHODONTIQUES DU JAPON, PAR DEMANDE, 2018-2032 (en milliers de dollars)
TABLEAU 94 TRAITEMENT DE LA MALOCCLUSION DU JAPON SUR LE MARCHÉ DES COMPLÉMENTS ORTHODONTIQUES, PAR DEMANDE, 2018-2032 (en MILLEUR)
TABLEAU 95 MARCHÉ DES COMPLÉMENTS ORTHODONTIQUES DU JAPON, PAR UTILISATEUR FINAL, 2018-2032 (MILLIERS USD)
TABLEAU 96 MARCHÉ DES COMPLÉMENTS ORTHODONTIQUES DU JAPON, PAR CHANEAU DE DISTRIBUTION, 2018-2032 (MILLIERS USD)
TABLEAU 97 MARCHÉ DES COMPLÉMENTS ORTHODONTIQUES DE L'INDE, PAR TYPE DE PRODUITS, 2018-2032
TABLEAU 98 APPLICABLES ORTHODONTIQUES DE L'INDE SUR LE MARCHÉ DES COMPLÉMENTS ORTHODONTIQUES, PAR TYPE DE PRODUITS, 2018-2032 (en millions de dollars américains)
TABLEAU 99 RETENEURS DE L'INDE SUR LE MARCHÉ DES COMPLÉMENTS ORTHODONTIQUES, PAR TYPE DE PRODUITS, 2018-2032 (MILLIERS USD)
TABLEAU 100 APPLICABLES ORTHODONTIQUES FIXES DE L'INDIA SUR LE MARCHÉ DES COMPLÉMENTS ORTHODONTIQUES, PAR TYPE DE PRODUITS, 2018-2032 (en millions de dollars américains)
TABLEAU 101 BRACLES INDÉSIRABLES SUR LE MARCHÉ DES COMPLÉMENTS ORTHODONTIQUES, PAR TYPE, 2018-2032
TABLEAU 102 BRACLES INDÉSIRABLES SUR LE MARCHÉ DES COMPLÉMENTS ORTHODONTIQUES, PAR COMPOSANT, 2018-2032 (en milliers de dollars)
TABLEAU 103 ARCHWIRES INDIENNES SUR LE MARCHÉ DES COMPLÉMENTS ORTHODONTIQUES, PAR TYPE, 2018-2032 (en milliers de dollars)
TABLEAU 104 ADHÉSIFS ET ACCESSOIRES DE L'INDIA SUR LE MARCHÉ DES COMPLÉMENTS ORTHODONTIQUES, PAR PRODUITS, 2018-2032 (en milliers de dollars)
TABLEAU 105 PRODUITS ÉLASTOMÉRIQUES INDIQUÉS SUR LE MARCHÉ DES COMPLÉMENTS ORTHODONTIQUES, PAR TYPE DE PRODUITS, 2018-2032 (MILLIERS USD)
TABLEAU 106 MARCHÉ DES COMPLÉMENTS ORTHODONTIQUES DE L'INDE, PAR TYPE DE PATIENTS, 2018-2032
TABLEAU 107 MARCHÉ DES COMPLÉMENTS ORTHODONTIQUES DE L'INDE, PAR TYPE DE MATÉRIEL, 2018-2032 (MILLIERS USD)
TABLEAU 108 BRACLES INDÉSIRABLES SUR LE MARCHÉ DES COMPLÉMENTS ORTHODONTIQUES, PAR TYPE, 2018-2032
TABLEAU 109 ARCHWIRE DE L'INDIA SUR LE MARCHÉ DES COMPLÉMENTS ORTHODONTIQUES, PAR TYPE, 2018-2032 (en milliers de dollars)
TABLEAU 110 ALIGNEUR DE L'INDE ET RETENEURS SUR LE MARCHÉ DES COMPLÉMENTS ORTHODONTIQUES, PAR TYPE, 2018-2032 (en milliers de dollars)
TABLEAU 111 MARCHÉ DES COMPLÉMENTS ORTHODONTIQUES DE L'INDE, PAR DEMANDE, 2018-2032 (en MILLIERS)
TABLEAU 112 TRAITEMENT DE LA MALOCCLUSION DE L'INDE SUR LE MARCHÉ DES COMPLÉMENTS ORTHODONTIQUES, PAR DEMANDE, 2018-2032 (en milliers de dollars)
TABLEAU 113 MARCHÉ DES COMPLÉMENTS ORTHODONTIQUES DE L'INDE, PAR UTILISATEUR DE FIN, 2018-2032 (MILLIERS USD)
TABLEAU 114 MARCHÉ DES COMPLÉMENTS ORTHODONTIQUES DE L'INDE, PAR CHANEAU DE DISTRIBUTION, 2018-2032 (MILLIERS USD)
TABLEAU 115 MARCHÉ DES COMPLÉMENTS ORTHODONTIQUES DE LA CORÉE DU SUD, PAR TYPE DE PRODUITS, 2018-2032 (MILLIERS USD)
TABLEAU 116 CORÉE DU SUD APPLICABLES ORTHODONTIQUES SUR LE MARCHÉ DES COMPLÉMENTS ORTHODONTIQUES, PAR TYPE DE PRODUIT, 2018-2032 (MILLIERS USD)
TABLEAU 117 RETENEURS DE LA CORÉE DU SUD SUR LE MARCHÉ DES COMPLÉMENTS ORTHODONTIQUES, PAR TYPE DE PRODUITS, 2018-2032 (MILLIERS USD)
TABLEAU 118 CORÉE DU SUD APPLICABLES ORTHODONTIQUES FIXES SUR LE MARCHÉ DES COMPLÉMENTS ORTHODONTIQUES, PAR TYPE DE PRODUITS, 2018-2032 (en milliers de dollars)
TABLEAU 119 BRACKETS DE CORÉE DU SUD SUR LE MARCHÉ DES COMPLÉMENTS ORTHODONTIQUES, PAR TYPE, 2018-2032 (en MILLE USD)
TABLEAU 120 BRACKES DE CORÉE DU SUD SUR LE MARCHÉ DES COMPLÉMENTS ORTHODONTIQUES, PAR COMPOSANT, 2018-2032 (MILLIERS DE USD)
TABLEAU 121 ARCHWIRS DE LA CORÉE DU SUD SUR LE MARCHÉ DES COMPLÉMENTS ORTHODONTIQUES, PAR TYPE, 2018-2032 (MILLIERS USD)
TABLEAU 122 ADHÉSIFS ET ACCESSOIRES DE LA CORÉE DU SUD SUR LE MARCHÉ DES COMPLÉMENTS ORTHODONTIQUES, PAR PRODUITS, 2018-2032 (MILLIERS USD)
TABLEAU 123 PRODUITS ÉLASTOMÉRIQUES DE LA CORÉE DU SUD SUR LE MARCHÉ DES COMPLÉMENTS ORTHODONTIQUES, PAR TYPE DE PRODUITS, 2018-2032 (MILLIERS USD)
TABLEAU 124 MARCHÉ DES COMPLÉMENTS ORTHODONTIQUES DE LA CORÉE DU SUD, PAR TYPE DE PATIENTS, 2018-2032 (MILLIERS USD)
TABLEAU 125 MARCHÉ DES COMPLÉMENTS ORTHODONTIQUES DE LA CORÉE DU SUD, PAR TYPE DE MATÉRIEL, 2018-2032 (MILLIERS USD)
TABLEAU 126 BRACLES DE CORÉE DU SUD SUR LE MARCHÉ DES COMPLÉMENTS ORTHODONTIQUES, PAR TYPE, 2018-2032 (MILLIERS USD)
TABLEAU 127 ARCHWIRE DE LA CORÉE DU SUD SUR LE MARCHÉ DES COMPLÉMENTS ORTHODONTIQUES, PAR TYPE, 2018-2032 (en milliers de dollars)
TABLEAU 128 ALIGNEUR ET RETENEURS DE LA CORÉE DU SUD SUR LE MARCHÉ DES COMPLÉMENTS ORTHODONTIQUES, PAR TYPE, 2018-2032 (en milliers d'USD)
TABLEAU 129 MARCHÉ DES COMPLÉMENTS ORTHODONTIQUES DE LA CORÉE DU SUD, PAR DEMANDE, 2018-2032 (en MILLIERS USD)
TABLEAU 130 TRAITEMENT DE LA MALOCCLUSION DE LA CORÉE DU SUD SUR LE MARCHÉ DES COMPLÉMENTS ORTHODONTIQUES, PAR APPLICATION, 2018-2032 (en MILLEUR)
TABLEAU 131 MARCHÉ DES COMPLÉMENTS ORTHODONTIQUES DE LA CORÉE DU SUD, PAR UTILISATEUR FINAL, 2018-2032 (MILLIERS USD)
TABLEAU 132 MARCHÉ DES COMPLÉMENTS ORTHODONTIQUES DE LA CORÉE DU SUD, PAR CHANEAU DE DISTRIBUTION, 2018-2032 (MILLIERS USD)
TABLEAU 133 MARCHÉ DES COMPLÉMENTS ORTHODONTIQUES DE L'AUSTRALIE, PAR TYPE DE PRODUITS, 2018-2032 (en milliers de dollars US)
TABLEAU 134 APPLICABLES ORTHODONTIQUES EN AUSTRALIE SUR LE MARCHÉ DES COMPLÉMENTS ORTHODONTIQUES, PAR TYPE DE PRODUITS, 2018-2032 (MILLIERS USD)
TABLEAU 135 RETENEURS DE L'AUSTRALIE SUR LE MARCHÉ DES COMPLÉMENTS ORTHODONTIQUES, PAR TYPE DE PRODUITS, 2018-2032 (MILLIERS USD)
TABLEAU 136 APPLICABLES ORTHODONTIQUES FIXES D'AUSTRALIE SUR LE MARCHÉ DES COMPLÉMENTS ORTHODONTIQUES, PAR TYPE DE PRODUITS, 2018-2032 (en millions de dollars)
TABLEAU 137 BRACKES D'AUSTRALIE SUR LE MARCHÉ DES COMPLÉMENTS ORTHODONTIQUES, PAR TYPE, 2018-2032 (en MILLE USD)
TABLEAU 138 BRACLES D'AUSTRALIE SUR LE MARCHÉ DES COMPLÉMENTS ORTHODONTIQUES, PAR COMPOSANT, 2018-2032 (en MILLE USD)
TABLEAU 139 ARCHWIRES D'AUSTRALIE SUR LE MARCHÉ DES COMPLÉMENTS ORTHODONTIQUES, PAR TYPE, 2018-2032 (en MILLE USD)
TABLEAU 140 ADHÉSIVES ET ACCESSOIRES D'AUSTRALIE SUR LE MARCHÉ DES COMPLÉMENTS ORTHODONTIQUES, PAR PRODUITS, 2018-2032 (en milliers de dollars)
TABLEAU 141 PRODUITS ÉLASTOMÉRIQUES D'AUSTRALIE SUR LE MARCHÉ DES COMPLÉMENTS ORTHODONTIQUES, PAR TYPE DE PRODUITS, 2018-2032 (MILLIERS USD)
TABLEAU 142 MARCHÉ DES COMPLÉMENTS ORTHODONTIQUES DE L'AUSTRALIE, PAR TYPE DE PATIENTS, 2018-2032 (MILLIERS USD)
TABLEAU 143 MARCHÉ DES COMPLÉMENTS ORTHODONTIQUES D'AUSTRALIE, PAR TYPE DE MATÉRIEL, 2018-2032
TABLEAU 144 BRACKES D'AUSTRALIE SUR LE MARCHÉ DES COMPLÉMENTS ORTHODONTIQUES, PAR TYPE, 2018-2032 (MILLIERS USD)
TABLEAU 145 ARCHWIRE D'AUSTRALIE SUR LE MARCHÉ DES COMPLÉMENTS ORTHODONTIQUES, PAR TYPE, 2018-2032 (en MILLOIS USD)
TABLEAU 146 ALIGNEUR ET RETENEURS DE L'AUSTRALIE SUR LE MARCHÉ DES COMPLÉMENTS ORTHODONTIQUES, PAR TYPE, 2018-2032 (en milliers de dollars)
TABLEAU 147 MARCHÉ DES COMPLÉMENTS ORTHODONTIQUES D'AUSTRALIE, PAR DEMANDE, 2018-2032 (en MILLIERS USD)
TABLEAU 148 TRAITEMENT DE LA MALOCCLUSION DE L'AUSTRALIE SUR LE MARCHÉ DES COMPLÉMENTS ORTHODONTIQUES, PAR APPLICATION, 2018-2032 (en milliers de dollars)
TABLEAU 149 MARCHÉ DES COMPLÉMENTS ORTHODONTIQUES DE L'AUSTRALIE, PAR UTILISATEUR DE FIN, 2018-2032 (MILLIERS USD)
TABLEAU 150 MARCHÉ DES COMPLÉMENTS ORTHODONTIQUES DE L'AUSTRALIE, PAR CHANEAU DE DISTRIBUTION, 2018-2032 (MILLIERS USD)
TABLEAU 151 MARCHÉ DES COMPLÉMENTS DE TAIWAN ORTHODONTIQUES, PAR TYPE DE PRODUITS, 2018-2032 (MILLIERS USD)
TABLEAU 152 APPLICABLES ORTHODONTIQUES À TAIWAN SUR LE MARCHÉ DES COMPLÉMENTS ORTHODONTIQUES, PAR TYPE DE PRODUITS, 2018-2032 (MILLIERS USD)
TABLEAU 153 RETENEURS DE TAIWAN SUR LE MARCHÉ DES COMPLÉMENTS ORTHODONTIQUES, PAR TYPE DE PRODUITS, 2018-2032 (MILLIERS USD)
TABLEAU 154 APPLICABLES ORTHODONTIQUES FIXES DE TAIWAN SUR LE MARCHÉ DES COMPLÉMENTS ORTHODONTIQUES, PAR TYPE DE PRODUITS, 2018-2032 (MILLIERS USD)
TABLEAU 155 BRACKETS DE TAIWAN SUR LE MARCHÉ DES COMPLÉMENTS ORTHODONTIQUES, PAR TYPE, 2018-2032 (en milliers de dollars)
TABLEAU 156 BRACKETS DE TAIWAN SUR LE MARCHÉ DES COMPLÉMENTS ORTHODONTIQUES, PAR COMPOSANT, 2018-2032 (en milliers de dollars)
TABLEAU 157 ARCHWIRES TAIWAN SUR LE MARCHÉ DES COMPLÉMENTS ORTHODONTIQUES, PAR TYPE, 2018-2032 (en milliers de dollars)
TABLEAU 158 ADHÉSIFS ET ACCESSOIRES DE TAIWAN SUR LE MARCHÉ DES COMPLÉMENTS ORTHODONTIQUES, PAR PRODUITS, 2018-2032 (en MILLE USD)
TABLEAU 159 PRODUITS ÉLASTOMÉRIQUES TAIWAN SUR LE MARCHÉ DES COMPLÉMENTS ORTHODONTIQUES, PAR TYPE DE PRODUITS, 2018-2032 (MILLIERS USD)
TABLEAU 160 MARCHÉ DES COMPLÉMENTS DE TAIWAN ORTHODONTIQUES, PAR TYPE DE PATIENTS, 2018-2032 (en milliers de dollars)
TABLEAU 161 MARCHÉ DES COMPLÉMENTS DE TAIWAN ORTHODONTIQUES, PAR TYPE DE MATÉRIEL, 2018-2032 (MILLIERS USD)
TABLEAU 162 BRACKETS DE TAIWAN SUR LE MARCHÉ DES COMPLÉMENTS ORTHODONTIQUES, PAR TYPE, 2018-2032 (en milliers de dollars)
TABLEAU 163 ARCHWIRE DE TAIWAN SUR LE MARCHÉ DES COMPLÉMENTS ORTHODONTIQUES, PAR TYPE, 2018-2032 (en milliers de dollars)
TABLEAU 164 ALIGNEUR TAIWAN ET RETENEURS SUR LE MARCHÉ DES COMPLÉMENTS ORTHODONTIQUES, PAR TYPE, 2018-2032 (en milliers de dollars)
TABLEAU 165 MARCHÉ DES COMPLÉMENTS TAIWAN ORTHODONTIQUES, PAR DEMANDE, 2018-2032 (en MILLIERS USD)
TABLEAU 166 TRAITEMENT DE LA MALOCCLUSION TAIWAN SUR LE MARCHÉ DES COMPLÉMENTS ORTHODONTIQUES, PAR DEMANDE, 2018-2032 (en MILLIERS DE USD)
TABLEAU 167 MARCHÉ DES COMPLÉMENTS TAIWAN ORTHODONTIQUES, PAR UTILISATEUR FINAL, 2018-2032 (MILLIERS USD)
TABLEAU 168 MARCHÉ DES COMPLÉMENTS TAIWAN ORTHODONTIQUES, PAR CHANEAU DE DISTRIBUTION, 2018-2032 (MILLIERS USD)
TABLEAU 169 MARCHÉ DES COMPLÉMENTS ORTHODONTIQUES DU SINGAPORE, PAR TYPE DE PRODUITS, 2018-2032 (en milliers de dollars)
TABLEAU 170 APPLICABLES ORTHODONTIQUES DU SINGAPORE SUR LE MARCHÉ DES COMPLÉMENTS ORTHODONTIQUES, PAR TYPE DE PRODUITS, 2018-2032 (en MILLOIS USD)
TABLEAU 171 RETENEURS DU SINGAPORE SUR LE MARCHÉ DES COMPLÉMENTS ORTHODONTIQUES, PAR TYPE DE PRODUITS, 2018-2032 (MILLIERS USD)
TABLEAU 172 APPLICABLES ORTHODONTIQUES FIXES À SINGAPORE SUR LE MARCHÉ DES COMPLÉMENTS ORTHODONTIQUES, PAR TYPE DE PRODUITS, 2018-2032
TABLEAU 173 BRACKETS DE SINGAPORE SUR LE MARCHÉ DES COMPLÉMENTS ORTHODONTIQUES, PAR TYPE, 2018-2032 (MILLIERS USD)
TABLEAU 174 BRACKETS DE SINGAPORE SUR LE MARCHÉ DES COMPLÉMENTS ORTHODONTIQUES, PAR COMPOSANT, 2018-2032 (en millions de dollars)
TABLEAU 175 ARCHWIRES DE SINGAPORE SUR LE MARCHÉ DES COMPLÉMENTS ORTHODONTIQUES, PAR TYPE, 2018-2032 (MILLIERS USD)
TABLEAU 176 ADHÉSIVES ET ACCESSOIRES DU SINGAPORE SUR LE MARCHÉ DES COMPLÉMENTS ORTHODONTIQUES, PAR PRODUITS, 2018-2032 (en milliers de dollars)
TABLEAU 177 PRODUITS ÉLASTOMÉRIQUES DU SINGAPORE SUR LE MARCHÉ DES COMPLÉMENTS ORTHODONTIQUES, PAR TYPE DE PRODUITS, 2018-2032 (MILLIERS USD)
TABLEAU 178 MARCHÉ DES COMPLÉMENTS ORTHODONTIQUES DU SINGAPORE, PAR TYPE DE PATIENTS, 2018-2032 (MILLIERS USD)
TABLEAU 179 MARCHÉ DES COMPLÉMENTS ORTHODONTIQUES DU SINGAPORE, PAR TYPE DE MATÉRIAUX, 2018-2032 (MILLIERS USD)
TABLEAU 180 BRACKETS DE SINGAPORE SUR LE MARCHÉ DES COMPLÉMENTS ORTHODONTIQUES, PAR TYPE, 2018-2032 (en MILLE USD)
TABLEAU 181 ARCHWIRE DE SINGAPORE SUR LE MARCHÉ DES COMPLÉMENTS ORTHODONTIQUES, PAR TYPE, 2018-2032 (MILLIERS USD)
TABLEAU 182 ALIGNEUR-SINGAPORE ET RETENEURS SUR LE MARCHÉ DES COMPLÉMENTS ORTHODONTIQUES, PAR TYPE, 2018-2032 (en milliers de dollars)
TABLEAU 183 MARCHÉ DES COMPLÉMENTS ORTHODONTIQUES DU SINGAPORE, PAR DEMANDE, 2018-2032 (en milliers de dollars)
TABLEAU 184 TRAITEMENT DE LA MALOCCLUSION DU SINGAPORE SUR LE MARCHÉ DES COMPLÉMENTS ORTHODONTIQUES, PAR APPLICATION, 2018-2032 (en milliers de dollars)
TABLEAU 185 MARCHÉ DES COMPLÉMENTS ORTHODONTIQUES DU SINGAPORE, PAR UTILISATEUR FINAL, 2018-2032 (MILLIERS USD)
TABLEAU 186 MARCHÉ DES COMPLÉMENTS ORTHODONTIQUES DU SINGAPORE, PAR CHANEAU DE DISTRIBUTION, 2018-2032 (MILLIERS USD)
TABLEAU 187 MARCHÉ DES COMPLÉMENTS ORTHODONTIQUES DE LA THAÏLANDE, PAR TYPE DE PRODUITS, 2018-2032 (en milliers de dollars)
TABLEAU 188 APPLICABLES ORTHODONTIQUES DE LA THAÏLANDE SUR LE MARCHÉ DES COMPLÉMENTS ORTHODONTIQUES, PAR TYPE DE PRODUITS, 2018-2032 (MILLIERS USD)
TABLEAU 189 RETENEURS DE LA THAÏLANDE SUR LE MARCHÉ DES COMPLÉMENTS ORTHODONTIQUES, PAR TYPE DE PRODUITS, 2018-2032 (MILLIERS USD)
TABLEAU 190 APPLICABLES ORTHODONTIQUES FIXES DE LA THAÏLANDE SUR LE MARCHÉ DES COMPLÉMENTS ORTHODONTIQUES, PAR TYPE DE PRODUITS, 2018-2032 (MILLIERS USD)
TABLEAU 191 BRACKETS DE LA THAILANDE SUR LE MARCHÉ DES COMPLÉMENTS ORTHODONTIQUES, PAR TYPE, 2018-2032 (MILLIERS USD)
TABLEAU 192 BRACKETS DE LA THAÏLANDE SUR LE MARCHÉ DES COMPLÉMENTS ORTHODONTIQUES, PAR COMPOSANT, 2018-2032 (MILLIERS DE USD)
TABLEAU 193 ARCHWIRS THAÏLANDE SUR LE MARCHÉ DES COMPLÉMENTS ORTHODONTIQUES, PAR TYPE, 2018-2032 (en MILLIERS)
TABLEAU 194 ADHÉSIFS ET ACCESSOIRES THAÏLANDES SUR LE MARCHÉ DES COMPLÉMENTS ORTHODONTIQUES, PAR PRODUITS, 2018-2032
TABLEAU 195 PRODUITS ÉLASTOMÉRIQUES THAÏLANDE SUR LE MARCHÉ DES COMPLÉMENTS ORTHODONTIQUES, PAR TYPE DE PRODUITS, 2018-2032 (MILLIERS USD)
TABLEAU 196 MARCHÉ DES COMPLÉMENTS ORTHODONTIQUES DE LA THAÏLANDE, PAR TYPE DE PATIENTS, 2018-2032 (MILLIERS USD)
TABLEAU 197 MARCHÉ DES COMPLÉMENTS ORTHODONTIQUES DE LA THAÏLANDE, PAR TYPE DE MATÉRIAUX, 2018-2032
TABLEAU 198 BRACKETS DE LA THAILANDE SUR LE MARCHÉ DES COMPLÉMENTS ORTHODONTIQUES, PAR TYPE, 2018-2032 (en MILLE USD)
TABLEAU 199 ARCHWIRE THAÏLANDE SUR LE MARCHÉ DES COMPLÉMENTS ORTHODONTIQUES, PAR TYPE, 2018-2032 (en milliers de dollars)
TABLEAU 200 ALIGNEUR ET RETENEURS THAÏLANDES SUR LE MARCHÉ DES COMPLÉMENTS ORTHODONTIQUES, PAR TYPE, 2018-2032 (en milliers de dollars)
TABLEAU 201 MARCHÉ DES COMPLÉMENTS ORTHODONTIQUES DE LA THAÏLANDE, PAR DEMANDE, 2018-2032 (en milliers de dollars)
TABLEAU 202 TRAITEMENT DE LA MALOCCLUSION DE LA THAÏLANDE SUR LE MARCHÉ DES COMPLÉMENTS ORTHODONTIQUES, PAR DEMANDE, 2018-2032 (en milliers de dollars)
TABLEAU 203 MARCHÉ DES COMPLÉMENTS ORTHODONTIQUES DE LA THAÏLANDE, PAR UTILISATEUR FINAL, 2018-2032 (MILLIERS USD)
TABLEAU 204 MARCHÉ DES COMPLÉMENTS ORTHODONTIQUES DE LA THAÏLANDE, PAR CHANEAU DE DISTRIBUTION, 2018-2032 (en millions de dollars)
TABLEAU 205 MARCHÉ DES COMPLÉMENTS DE MALAISIE ORTHODONTIQUES, PAR TYPE DE PRODUITS, 2018-2032 (MILLIERS USD)
TABLEAU 206 MALAISIE APPLICABLES ORTHODONTIQUES SUR LE MARCHÉ DES COMPLÉMENTS ORTHODONTIQUES, PAR TYPE DE PRODUIT, 2018-2032 (en MILLIERS DE USD)
TABLEAU 207 RETENEURS DE LA MALAISIE SUR LE MARCHÉ DES COMPLÉMENTS ORTHODONTIQUES, PAR TYPE DE PRODUITS, 2018-2032 (MILLIERS USD)
TABLEAU 208 MALAYSIE APPLICABLES ORTHODONTIQUES FIXES SUR LE MARCHÉ DES COMPLÉMENTS ORTHODONTIQUES, PAR TYPE DE PRODUITS, 2018-2032 (en milliers de dollars américains)
TABLEAU 209 BRACKETS DE MALAISIE SUR LE MARCHÉ DES COMPLÉMENTS ORTHODONTIQUES, PAR TYPE, 2018-2032 (en MILLE)
TABLEAU 210 BRACKES DE MALAISIE SUR LE MARCHÉ DES COMPLÉMENTS ORTHODONTIQUES, PAR COMPOSANT, 2018-2032
TABLEAU 211 ARCHWIRS MALAYSIA SUR LE MARCHÉ DES COMPLÉMENTS ORTHODONTIQUES, PAR TYPE, 2018-2032 (en MILLIERS)
TABLEAU 212 ADHÉSIFS ET ACCESSOIRES MALAYSIE DANS LE MARCHÉ DES COMPLÉMENTS ORTHODONTIQUES, PAR PRODUITS, 2018-2032 (en milliers de dollars)
TABLEAU 213 PRODUITS ÉLASTOMÉRIQUES DE LA MALAISIE SUR LE MARCHÉ DES COMPLÉMENTS ORTHODONTIQUES, PAR TYPE DE PRODUITS, 2018-2032 (MILLIERS USD)
TABLEAU 214 MARCHÉ DES COMPLÉMENTS ORTHODONTIQUES DE MALAISIE, PAR TYPE DE PATIENTS, 2018-2032 (MILLIERS USD)
TABLEAU 215 MARCHÉ DES COMPLÉMENTS MALAYSIE ORTHODONTIQUES, PAR TYPE DE MATÉRIAUX, 2018-2032 (MILLIERS USD)
TABLEAU 216 BRACKETS DE MALAYSIE SUR LE MARCHÉ DES COMPLÉMENTS ORTHODONTIQUES, PAR TYPE, 2018-2032 (en milliers de dollars)
TABLEAU 217 ARCHWIRE DE MALAISIE SUR LE MARCHÉ DES COMPLÉMENTS ORTHODONTIQUES, PAR TYPE, 2018-2032 (en MILLIERS)
TABLEAU 218 ALIGNEUR ET RETENEURS DE LA MALAISIE SUR LE MARCHÉ DES COMPLÉMENTS ORTHODONTIQUES, PAR TYPE, 2018-2032 (en milliers de dollars)
TABLEAU 219 MARCHÉ DES COMPLÉMENTS ORTHODONTIQUES DE LA MALAISIE, PAR DEMANDE, 2018-2032 (en milliers de dollars)
TABLEAU 220 TRAITEMENT DE LA MALOCCLUSION DE LA MALAISIE SUR LE MARCHÉ DES COMPLÉMENTS ORTHODONTIQUES, PAR APPLICATION, 2018-2032 (en milliers de dollars)
TABLEAU 221 MARCHÉ DES COMPLÉMENTS ORTHODONTIQUES DE LA MALAISIE, PAR UTILISATEUR DE FIN, 2018-2032 (MILLIERS USD)
TABLEAU 222 MARCHÉ DES COMPLÉMENTS DE MALAISIE ORTHODONTIQUE, PAR CHANEAU DE DISTRIBUTION, 2018-2032 (MILLIERS)
TABLEAU 223 MARCHÉ DES COMPLÉMENTS ORTHODONTIQUES INDONÉSIELS, PAR TYPE DE PRODUITS, 2018-2032 (en milliers de dollars US)
TABLEAU 224 APPLICABLES ORTHODONTIQUES À L'INDONÉSIE SUR LE MARCHÉ DES COMPLÉMENTS ORTHODONTIQUES, PAR TYPE DE PRODUITS, 2018-2032 (en millions de dollars américains)
TABLEAU 225 RETENEURS DE L'INDONESIE SUR LE MARCHÉ DES COMPLÉMENTS ORTHODONTIQUES, PAR TYPE DE PRODUITS, 2018-2032 (MILLIERS USD)
TABLEAU 226 APPLICABLES ORTHODONTIQUES FIXES INDONÉS SUR LE MARCHÉ DES COMPLÉMENTS ORTHODONTIQUES, PAR TYPE DE PRODUITS, 2018-2032 (MILLIERS USD)
TABLEAU 227 BRACKES INDONÉSIE DANS LE MARCHÉ DES COMPLÉMENTS ORTHODONTIQUES, PAR TYPE, 2018-2032 (MILLIERS USD)
TABLEAU 228 BRACKES INDONÉSIE SUR LE MARCHÉ DES COMPLÉMENTS ORTHODONTIQUES, PAR COMPOSANT, 2018-2032 (MILLIERS USD)
TABLEAU 229 ARCHWIRS INDONÉSIE SUR LE MARCHÉ DES COMPLÉMENTS ORTHODONTIQUES, PAR TYPE, 2018-2032 (MILLIERS USD)
TABLEAU 230 ADHÉSIFS ET ACCESSOIRES INDONÉSIELS SUR LE MARCHÉ DES COMPLÉMENTS ORTHODONTIQUES, PAR PRODUITS, 2018-2032 (en milliers de dollars)
TABLEAU 231 PRODUITS DE L'ÉLASTOMÉRIQUE INDONÉSIE SUR LE MARCHÉ DES COMPLÉMENTS ORTHODONTIQUES, PAR TYPE DE PRODUITS, 2018-2032 (en milliers de dollars américains)
TABLEAU 232 MARCHÉ DES COMPLÉMENTS ORTHODONTIQUES INDONÉSIELS, PAR TYPE DE PATIENTS, 2018-2032 (en milliers d'USD)
TABLEAU 233 MARCHÉ DES COMPLÉMENTS ORTHODONTIQUES INDONÉSIELS, PAR TYPE DE MATÉRIAUX, 2018-2032
TABLEAU 234 BRACKETS INDONÉSIE DANS LE MARCHÉ DES COMPLÉMENTS ORTHODONTIQUES, PAR TYPE, 2018-2032 (MILLIERS USD)
TABLEAU 235 ARCHWIRE INDONÉSIE DANS LE MARCHÉ DES COMPLÉMENTS ORTHODONTIQUES, PAR TYPE, 2018-2032 (MILLIERS USD)
TABLEAU 236 ALIGNEUR ET RETENEURS INDONÉSIELS SUR LE MARCHÉ DES COMPLÉMENTS ORTHODONTIQUES, PAR TYPE, 2018-2032 (en milliers de dollars É.-U.)
TABLEAU 237 MARCHÉ DES COMPLÉMENTS ORTHODONTIQUES INDONÉSIELS, PAR DEMANDE, 2018-2032 (en milliers de dollars)
TABLEAU 238 TRAITEMENT DE LA MALOCCLUSION DE L'INDONESIE SUR LE MARCHÉ DES COMPLÉMENTS ORTHODONTIQUES, PAR DEMANDE, 2018-2032 (en milliers de dollars)
TABLEAU 239 MARCHÉ DES COMPLÉMENTS INDONÉSIE ORTHODONTIQUES, PAR UTILISATEUR FINAL, 2018-2032 (MILLIERS USD)
TABLEAU 240 MARCHÉ DES COMPLÉMENTS ORTHODONTIQUES INDONÉSIELS, PAR CHANEAU DE DISTRIBUTION, 2018-2032 (MILLIERS USD)
TABLEAU 241 MARCHÉ DES COMPLÉMENTS PHILIPPINES ORTHODONTIQUES, PAR TYPE DE PRODUITS, 2018-2032 (MILLIERS USD)
TABLEAU 242 PHILIPPINES APPLICABLES ORTHODONTIQUES SUR LE MARCHÉ DES COMPLÉMENTS ORTHODONTIQUES, PAR TYPE DE PRODUIT, 2018-2032 (MILLIERS DE USD)
TABLEAU 243 RÉTABLISSEMENTS DES PHILIPPINES SUR LE MARCHÉ DES COMPLÉMENTS ORTHODONTIQUES, PAR TYPE DE PRODUITS, 2018-2032 (MILLIERS USD)
TABLEAU 244 PHILIPPINES APPLICABLES ORTHODONTIQUES FIXES SUR LE MARCHÉ DES COMPLÉMENTS ORTHODONTIQUES, PAR TYPE DE PRODUITS, 2018-2032
TABLEAU 245 BRACKES DE PHILIPPINES SUR LE MARCHÉ DES COMPLÉMENTS ORTHODONTIQUES, PAR TYPE, 2018-2032 (en milliers de dollars)
TABLEAU 246 BRACKES DE PHILIPPINES SUR LE MARCHÉ DES COMPLÉMENTS ORTHODONTIQUES, PAR COMPOSANT, 2018-2032 (en milliers de dollars)
TABLEAU 247 ARCHWIRES PHILIPPINES SUR LE MARCHÉ DES COMPLÉMENTS ORTHODONTIQUES, PAR TYPE, 2018-2032 (en milliers de dollars)
TABLEAU 248 PHILIPPINES ADHÉSIVES ET ACCESSOIRES SUR LE MARCHÉ DES COMPLÉMENTS ORTHODONTIQUES, PAR PRODUITS, 2018-2032 (en milliers de dollars)
TABLEAU 249 PRODUITS ÉLASTOMÉRIQUES PHILIPPINES SUR LE MARCHÉ DES COMPLÉMENTS ORTHODONTIQUES, PAR TYPE DE PRODUITS, 2018-2032 (MILLIERS USD)
TABLEAU 250 MARCHÉ DES COMPLÉMENTS PHILIPPINES ORTHODONTIQUES, PAR TYPE DE PATIENTS, 2018-2032 (en milliers de dollars)
TABLEAU 251 MARCHÉ DES COMPLÉMENTS PHILIPPINES ORTHODONTIQUES, PAR TYPE DE MATÉRIEL, 2018-2032 (MILLIERS USD)
TABLEAU 252 BRACETTES PHILIPPINES SUR LE MARCHÉ DES COMPLÉMENTS ORTHODONTIQUES, PAR TYPE, 2018-2032 (en milliers de dollars)
TABLEAU 253 ARCHWIRE DE PHILIPPINES SUR LE MARCHÉ DES COMPLÉMENTS ORTHODONTIQUES, PAR TYPE, 2018-2032 (en milliers de dollars)
TABLEAU 254 ALIGNEUR ET RETENEURS DES PHILIPPINES SUR LE MARCHÉ DES COMPLÉMENTS ORTHODONTIQUES, PAR TYPE, 2018-2032 (en milliers de dollars)
TABLEAU 255 MARCHÉ DES COMPLÉMENTS PHILIPPINES ORTHODONTIQUES, PAR APPLICATION, 2018-2032 (MILLIERS USD)
TABLEAU 256 TRAITEMENT DE LA MALOCCLUSION DES PHILIPPINES SUR LE MARCHÉ DES COMPLÉMENTS ORTHODONTIQUES, PAR DEMANDE, 2018-2032 (MILLIERS USD)
TABLEAU 257 MARCHÉ DES COMPLÉMENTS PHILIPPINES ORTHODONTIQUES, PAR UTILISATEUR FINAL, 2018-2032 (MILLIERS USD)
TABLEAU 258 PHILIPPINES MARCHÉ DES COMPLÉMENTS ORTHODONTIQUES, PAR CHANEAU DE DISTRIBUTION, 2018-2032 (MILLIERS USD)
TABLEAU 259 MARCHÉ DES COMPLÉMENTS ORTHODONTIQUES DE LA NOUVELLE ZÉLANDE, PAR TYPE DE PRODUITS, 2018-2032 (en milliers de dollars US)
TABLEAU 260 APPLICABLES ORTHODONTIQUES DE LA NOUVELLE ZÉLANDE SUR LE MARCHÉ DES COMPLÉMENTS ORTHODONTIQUES, PAR TYPE DE PRODUITS, 2018-2032 (MILLIERS USD)
TABLEAU 261 RETENEURS DE LA NOUVELLE ZÉLANDE SUR LE MARCHÉ DES COMPLÉMENTS ORTHODONTIQUES, PAR TYPE DE PRODUITS, 2018-2032 (MILLIERS USD)
TABLEAU 262 APPLICABLES ORTHODONTIQUES FIXES DE LA NOUVELLE ZÉLANDE SUR LE MARCHÉ DES COMPLÉMENTS ORTHODONTIQUES, PAR TYPE DE PRODUITS, 2018-2032 (en MILLE USD)
TABLEAU 263 BRACKETS DE LA NOUVELLE ZÉLANDE SUR LE MARCHÉ DES COMPLÉMENTS ORTHODONTIQUES, PAR TYPE, 2018-2032 (en MILLE USD)
TABLEAU 264 BRACKETS DE LA NOUVELLE ZÉLANDE SUR LE MARCHÉ DES COMPLÉMENTS ORTHODONTIQUES, PAR COMPOSANT, 2018-2032 (en MILLOIS USD)
TABLEAU 265 ARCHWIRES DE LA NOUVELLE ZÉLANDE SUR LE MARCHÉ DES COMPLÉMENTS ORTHODONTIQUES, PAR TYPE, 2018-2032 (en milliers de dollars)
TABLEAU 266 ADHÉSIVES ET ACCESSOIRES DE LA NOUVELLE ZÉLANDE SUR LE MARCHÉ DES COMPLÉMENTS ORTHODONTIQUES, PAR PRODUITS, 2018-2032 (en MILLE USD)
TABLEAU 267 PRODUITS ÉLASTOMÉRIQUES DE LA NOUVELLE ZÉLANDE SUR LE MARCHÉ DES COMPLÉMENTS ORTHODONTIQUES, PAR TYPE DE PRODUITS, 2018-2032 (en MILLE USD)
TABLEAU 268 MARCHÉ DES COMPLÉMENTS ORTHODONTIQUES DE LA NOUVELLE-ZÉLANDE, PAR TYPE DE PATIENTS, 2018-2032 (MILLIERS USD)
TABLEAU 269 MARCHÉ DES COMPLÉMENTS ORTHODONTIQUES DE LA NOUVELLE-ZÉLANDE, PAR TYPE DE MATÉRIEL, 2018-2032 (MILLIERS USD)
TABLEAU 270 BRACKETS DE LA NOUVELLE ZÉLANDE SUR LE MARCHÉ DES COMPLÉMENTS ORTHODONTIQUES, PAR TYPE, 2018-2032 (MILLIERS USD)
TABLEAU 271 ARCHWIRE DE LA NOUVELLE ZÉLANDE SUR LE MARCHÉ DES COMPLÉMENTS ORTHODONTIQUES, PAR TYPE, 2018-2032 (en milliers de dollars)
TABLEAU 272 ALIGNEUR ET RETENEURS DE LA NOUVELLE ZÉLANDE SUR LE MARCHÉ DES COMPLÉMENTS ORTHODONTIQUES, PAR TYPE, 2018-2032 (en milliers de dollars)
TABLEAU 273 MARCHÉ DES COMPLÉMENTS ORTHODONTIQUES DE LA NOUVELLE-ZÉLANDE, PAR DEMANDE, 2018-2032 (en milliers de dollars)
TABLEAU 274 TRAITEMENT DE LA MALOCCLUSION DE LA NOUVELLE ZÉLANDE SUR LE MARCHÉ DES COMPLÉMENTS ORTHODONTIQUES, PAR APPLICATION, 2018-2032 (en milliers de dollars)
TABLEAU 275 MARCHÉ DES COMPLÉMENTS ORTHODONTIQUES DE LA NOUVELLE ZÉLANDE, PAR UTILISATEUR DE FIN, 2018-2032 (en MILLIERS USD)
TABLEAU 276 MARCHÉ DES COMPLÉMENTS ORTHODONTIQUES DE LA NOUVELLE ZÉLANDE, PAR CHANEAU DE DISTRIBUTION, 2018-2032 (MILLIERS DE USD)
TABLEAU 277 MARCHÉ DES COMPLÉMENTS ORTHODONTIQUES DU VIETNAM, PAR TYPE DE PRODUITS, 2018-2032 (MILLIERS USD)
TABLEAU 278 APPLICABLES ORTHODONTIQUES DU VIETNAM SUR LE MARCHÉ DES COMPLÉMENTS ORTHODONTIQUES, PAR TYPE DE PRODUITS, 2018-2032 (en MILLOIS USD)
TABLEAU 279 RETENEURS DU VIETNAM SUR LE MARCHÉ DES COMPLÉMENTS ORTHODONTIQUES, PAR TYPE DE PRODUITS, 2018-2032 (MILLIERS USD)
TABLEAU 280 APPLICABLES ORTHODONTIQUES FIXES DU VIETNAM SUR LE MARCHÉ DES COMPLÉMENTS ORTHODONTIQUES, PAR TYPE DE PRODUITS, 2018-2032 (en millions de dollars US)
TABLEAU 281 BRACETTES VIETNAM SUR LE MARCHÉ DES COMPLÉMENTS ORTHODONTIQUES, PAR TYPE, 2018-2032 (MILLIERS USD)
TABLEAU 282 BRACLES DE VIETNAM SUR LE MARCHÉ DES COMPLÉMENTS ORTHODONTIQUES, PAR COMPOSANT, 2018-2032 (en milliers de dollars)
TABLEAU 283 ARCHWIRS VIETNAM SUR LE MARCHÉ DES COMPLÉMENTS ORTHODONTIQUES, PAR TYPE, 2018-2032 (MILLIERS USD)
TABLEAU 284 ADHÉSIFS ET ACCESSOIRES DU VIETNAM SUR LE MARCHÉ DES COMPLÉMENTS ORTHODONTIQUES, PAR PRODUITS, 2018-2032 (en milliers de dollars)
TABLEAU 285 PRODUITS ÉLASTOMÉRIQUES VIETNAM SUR LE MARCHÉ DES COMPLÉMENTS ORTHODONTIQUES, PAR TYPE DE PRODUITS, 2018-2032 (MILLIERS USD)
TABLEAU 286 MARCHÉ DES COMPLÉMENTS ORTHODONTIQUES DU VIETNAM, PAR TYPE DE PATIENTS, 2018-2032 (MILLIERS USD)
TABLEAU 287 MARCHÉ DES COMPLÉMENTS ORTHODONTIQUES DU VIETNAM, PAR TYPE DE MATÉRIAUX, 2018-2032 (MILLIERS USD)
TABLEAU 288 BRACLES DE VIETNAM SUR LE MARCHÉ DES COMPLÉMENTS ORTHODONTIQUES, PAR TYPE, 2018-2032 (MILLIERS USD)
TABLEAU 289 ARCHWIRE VIETNAM SUR LE MARCHÉ DES COMPLÉMENTS ORTHODONTIQUES, PAR TYPE, 2018-2032 (en milliers de dollars)
TABLEAU 290 ALIGNATEURS ET RETENEURS DE VIETNAM SUR LE MARCHÉ DES COMPLÉMENTS ORTHODONTIQUES, PAR TYPE, 2018-2032 (MILLIERS USD)
TABLEAU 291 MARCHÉ DES COMPLÉMENTS ORTHODONTIQUES VIETNAM, PAR DEMANDE, 2018-2032 (en milliers de dollars)
TABLEAU 292 TRAITEMENT DE LA MALOCCLUSION DU VIETNAM SUR LE MARCHÉ DES COMPLÉMENTS ORTHODONTIQUES, PAR DEMANDE, 2018-2032 (en MILLIERS USD)
TABLEAU 293 MARCHÉ DES COMPLÉMENTS ORTHODONTIQUES DU VIETNAM, PAR UTILISATEUR DE FIN, 2018-2032 (MILLIERS USD)
TABLEAU 294 MARCHÉ DES COMPLÉMENTS ORTHODONTIQUES DU VIETNAM, PAR CHANEAU DE DISTRIBUTION, 2018-2032 (en MILLOIS USD)
TABLEAU 295 RESTE DU MARCHÉ DES COMPLÉMENTS ORTHODONTIQUES ASIE-PACIFIQUE, PAR TYPE DE PRODUITS, 2018-2032 (MILLIERS USD)
Liste des figures
FIGURE 1 MARCHÉ DES COMPLÉMENTS ORTHODONTIQUES ASIE-PACIFIQUE: SEGMENTATION
FIGURE 2 MARCHÉ DES COMPLÉMENTS ORTHODONTIQUES ASIE-PACIFIQUE: TRIANGULATION DES DONNÉES
FIGURE 3 MARCHÉ DES COMPLÉMENTS ORTHODONTIQUES ASIE-PACIFIQUE: ANALYSE DES DROGUES
FIGURE 4 MARCHÉ DES COMPLÉMENTS ORTHODONTIQUES ASIE-PACIFIQUE: ANALYSE RÉGIONALE DES VS ASIE-PACIFIQUE
FIGURE 5 ANALYSE DE LA RECHERCHE D'ENTREPRISE
GRAPHIQUE 6 MARCHÉ DES COMPLÉMENTS ORTHODONTIQUES ASIE-PACIFIQUE: DÉMOGRAPHIQUES INTERVIEW
FIGURE 7 MARCHÉ DES COMPLÉMENTS ORTHODONTIQUES ASIE-PACIFIQUE: GRID DE POSITION DU MARCHÉ DU DBMR
FIGURE 8 MARCHÉ DES COMPLÉMENTS ORTHODONTIQUES ASIE-PACIFIQUE: GRID DE COUVERTURE DE L'UTILISATEUR
FIGURE 9 MARCHÉ DES COMPLÉMENTS ORTHODONTIQUES ASIE-PACIFIQUE: ANALYSE DU PARTAGE DES VENDEURS
FIGURE 10 MARCHÉ DES COMPLÉMENTS ORTHODONTIQUES ASIE-PACIFIQUE: SEGMENTATION
FIGURE 11 TROIS SEGMENTS COMPRIS LE MARCHÉ DES COMPLÉMENTS ORTHODONTIQUES ASIE-PACIFIQUE, PAR TYPE DE PRODUIT
FIGURE 12 COMPLÉMENTS ORTHODONTIQUES ASIE-PACIFIQUE DU MARCHÉ RÉSUMÉ
FIGURE 13 DÉCISIONS STRATÉGIQUES
FIGURE 14 CROISSANCE DU MARCHÉ DES SUPPLÉMENTS ORTHODONTIQUES ASIE-PACIFIQUE DE 2025 À 2032
GRAPHIQUE 15 APPLICABLES ORTHODONTIQUES LE SEGMENT EST COMPTABLE POUR LE PLUS GRAND PARTAGE DU MARCHÉ DES SUPPLÉMENTS ORTHODONTIQUES ASIE-PACIFIQUE EN 2025 ET 2032
FIGURE 16 MARCHÉ DES COMPLÉMENTS ORTHODONTIQUES ASIE-PACIFIQUE: PAR TYPE DE PRODUITS, 2024
GRAPHIQUE 17 MARCHÉ DES COMPLÉMENTS ORTHODONTIQUES ASIE-PACIFIQUE: PAR TYPE DE PRODUITS, 2025-2032 (en MILLE USD)
GRAPHIQUE 18 MARCHÉ DES COMPLÉMENTS ORTHODONTIQUES ASIE-PACIFIQUE: PAR TYPE DE PRODUIT, TCAC (2025-2032)
GRAPHIQUE 19 MARCHÉ DES COMPLÉMENTS ORTHODONTIQUES ASIE-PACIFIQUE: PAR TYPE DE PRODUIT, COURS DE VIE
FIGURE 20 MARCHÉ VÉTÉRINAIRE ASIE-PACIFIQUE: PAR TYPE DE PATIENTS, 2024
FIGURE 21 MARCHÉ VÉTÉRINAIRE ASIE-PACIFIQUE: PAR TYPE DE PATIENTS, 2025-2032 (en MILLIERS USD)
FIGURE 22 MARCHÉ VÉTÉRINAIRE ASIE-PACIFIQUE: PAR TYPE DE PATIENTS, TCAC (2025-2032)
FIGURE 23 MARCHÉ VÉTÉRINAIRE ASIE-PACIFIQUE: PAR TYPE DE PATIENTS, COURS DE VIE
FIGURE 24 MARCHÉ DES COMPLÉMENTS ORTHODONTIQUES ASIE-PACIFIQUE: PAR TYPE DE MATÉRIAUX, 2024
FIGURE 25 MARCHÉ DES COMPLÉMENTS ORTHODONTIQUES ASIE-PACIFIQUE: PAR TYPE DE MATÉRIAUX, 2025-2032
FIGURE 26 MARCHÉ DES COMPLÉMENTS ORTHODONTIQUES ASIE-PACIFIQUE: PAR TYPE DE MATÉRIEL, TCAC (2025-2032)
FIGURE 27 MARCHÉ DES COMPLÉMENTS ORTHODONTIQUES ASIE-PACIFIQUE: PAR TYPE DE MATÉRIEL, CURVIER
FIGURE 28 MARCHÉ DES COMPLÉMENTS ORTHODONTIQUES ASIE-PACIFIQUE: PAR DEMANDE, 2024
GRAPHIQUE 29 MARCHÉ DES COMPLÉMENTS ORTHODONTIQUES ASIE-PACIFIQUE: PAR DEMANDE, 2025-2032 (MILLE US)
GRAPHIQUE 30 MARCHÉ DES COMPLÉMENTS ORTHODONTIQUES ASIE-PACIFIQUE: PAR DEMANDE, CAGR (2025-2032)
FIGURE 31 MARCHÉ DES COMPLÉMENTS ORTHODONTIQUES ASIE-PACIFIQUE: PAR APPLICATION, CURVIER
FIGURE 32 MARCHÉ DES COMPLÉMENTS ORTHODONTIQUES ASIE-PACIFIQUE: PAR UTILISATEUR DE FIN, 2024
GRAPHIQUE 33 MARCHÉ DES COMPLÉMENTS ORTHODONTIQUES ASIE-PACIFIQUE: PAR UTILISATEUR DE FIN, 2025-2032 (MILLIERS USD)
FIGURE 34 MARCHÉ DES COMPLÉMENTS ORTHODONTIQUES ASIE-PACIFIQUE: PAR UTILISATEUR FINAL, CAGR (2025-2032)
GRAPHIQUE 35 MARCHÉ DES COMPLÉMENTS ORTHODONTIQUES ASIE-PACIFIQUE: PAR UTILISATEUR FINAL, COURS DE VIE
FIGURE 36 MARCHÉ DES COMPLÉMENTS ORTHODONTIQUES ASIE-PACIFIQUE: PAR CHANEAU DE DISTRIBUTION, 2024
GRAPHIQUE 37 MARCHÉ DES COMPLÉMENTS ORTHODONTIQUES ASIE-PACIFIQUE : PAR CHANEAU DE DISTRIBUTION, 2025-2032 (MILLIERS USD)
GRAPHIQUE 38 MARCHÉ DES COMPLÉMENTS ORTHODONTIQUES ASIE-PACIFIQUE: PAR CHANEAU DE DISTRIBUTION, CAGR (2025-2032)
GRAPHIQUE 39 MARCHÉ DES COMPLÉMENTS ORTHODONTIQUES ASIE-PACIFIQUE: PAR CHANEAU DE DISTRIBUTION, COURS DE VIE
FIGURE 40 MARCHÉ DES COMPLÉMENTS ORTHODONTIQUES ASIE-PACIFIQUE: SNAPSHOT (2024)
GRAPHIQUE 41 MARCHÉ DES COMPLÉMENTS ORTHODONTIQUES ASIE-PACIFIQUE: ENTREPRISE PARTAGE 2024 (%)
Méthodologie de recherche
La collecte de données et l'analyse de l'année de base sont effectuées à l'aide de modules de collecte de données avec des échantillons de grande taille. L'étape consiste à obtenir des informations sur le marché ou des données connexes via diverses sources et stratégies. Elle comprend l'examen et la planification à l'avance de toutes les données acquises dans le passé. Elle englobe également l'examen des incohérences d'informations observées dans différentes sources d'informations. Les données de marché sont analysées et estimées à l'aide de modèles statistiques et cohérents de marché. De plus, l'analyse des parts de marché et l'analyse des tendances clés sont les principaux facteurs de succès du rapport de marché. Pour en savoir plus, veuillez demander un appel d'analyste ou déposer votre demande.
La méthodologie de recherche clé utilisée par l'équipe de recherche DBMR est la triangulation des données qui implique l'exploration de données, l'analyse de l'impact des variables de données sur le marché et la validation primaire (expert du secteur). Les modèles de données incluent la grille de positionnement des fournisseurs, l'analyse de la chronologie du marché, l'aperçu et le guide du marché, la grille de positionnement des entreprises, l'analyse des brevets, l'analyse des prix, l'analyse des parts de marché des entreprises, les normes de mesure, l'analyse globale par rapport à l'analyse régionale et des parts des fournisseurs. Pour en savoir plus sur la méthodologie de recherche, envoyez une demande pour parler à nos experts du secteur.
Personnalisation disponible
Data Bridge Market Research est un leader de la recherche formative avancée. Nous sommes fiers de fournir à nos clients existants et nouveaux des données et des analyses qui correspondent à leurs objectifs. Le rapport peut être personnalisé pour inclure une analyse des tendances des prix des marques cibles, une compréhension du marché pour d'autres pays (demandez la liste des pays), des données sur les résultats des essais cliniques, une revue de la littérature, une analyse du marché des produits remis à neuf et de la base de produits. L'analyse du marché des concurrents cibles peut être analysée à partir d'une analyse basée sur la technologie jusqu'à des stratégies de portefeuille de marché. Nous pouvons ajouter autant de concurrents que vous le souhaitez, dans le format et le style de données que vous recherchez. Notre équipe d'analystes peut également vous fournir des données sous forme de fichiers Excel bruts, de tableaux croisés dynamiques (Fact book) ou peut vous aider à créer des présentations à partir des ensembles de données disponibles dans le rapport.

