Global Drinkware Market
Taille du marché en milliards USD
TCAC :
% 

| 2026 –2033 | |
| Dollars américains 29.73 [email protected] | |
| Dollars américains 42.51 [email protected] | |
| % | |
|
Segmentation du marché mondial de la boisson, par produit (bouteilles, verre à vin, verre à bière, tasses à café et tasses à thé, verre tous les jours, verre à cocktail, verre spiritueux, autres), matière (polymère, métal, verre, silicone, céramique, plastique, os Chine, porcelaine/stoneware), application (domestique, commerciale), canal de distribution (supermarché, magasins indépendants, commerce électronique) – tendances de l'industrie et prévisions à 2033
Aperçu du marché des produits de boisson
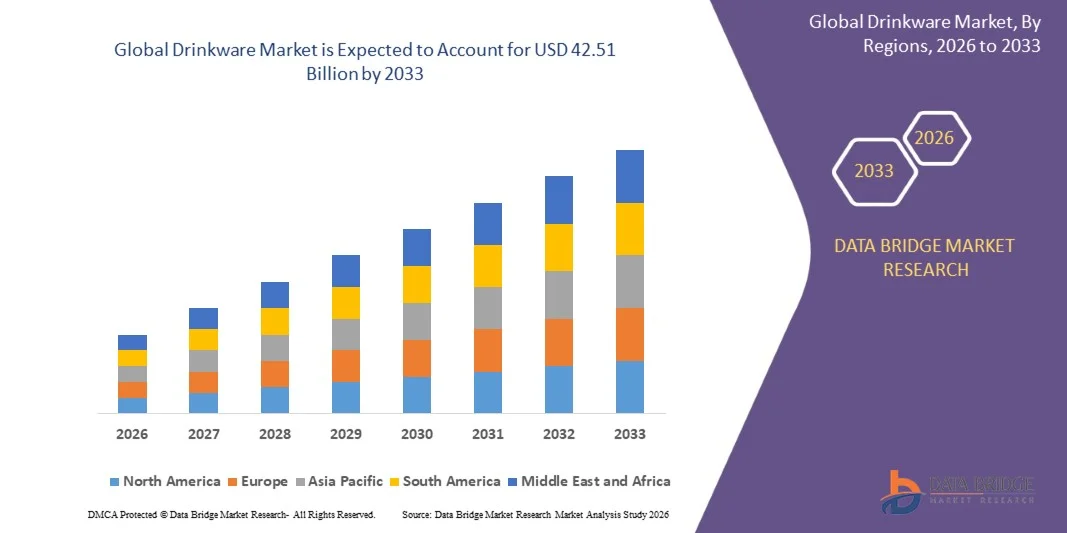
Le marché des produits de boisson, évalué à 29,73 milliards de dollars en 2025, devrait atteindre 42,51 milliards de dollars d'ici 2033, avec une croissance de 4,57% du TCAC entre 2026 et 2033. La croissance du marché est soutenue par l'adoption de boissons réutilisables, la marque de style de vie, l'augmentation de la demande d'accueil, le sport et la culture de fitness,
La consommation de boissons dépasse de plus en plus la consommation de boissons de base et devient une catégorie de produits façonnée par la durabilité, le style personnel, le bien-être et la commodité. Les consommateurs achètent des bouteilles réutilisables, des tambours isolés, des tasses et des verres de première qualité pour l'hydratation, les voyages, les sports, les repas à domicile, les cadeaux et l'accueil. Les fabricants répondent avec de nouveaux matériaux, une meilleure isolation, des formats étanches, des gouttes de couleur d'édition limitée, une personnalisation et des canaux directs plus forts pour les consommateurs.
Taille du marché et prévisions
- Valeur marchande mondiale (2025): USD 29.73 Million
- Valeur marchande prévue (2033) : 42,51 milliards de dollars
- Prévisions CAGR (2026-2033): 4,57%
- Région chef de file: Amérique du Nord
- Région de croissance la plus rapide: Asie-Pacifique
Principales tendances et perspectives du marché
- L'Amérique du Nord a dominé le marché des boissons en 2025 avec une part de revenus estimée à 30,71 %. La demande est soutenue par une forte consommation de boissons réutilisables et isolées, une consommation importante de produits ménagers et de services alimentaires, des loisirs en plein air, des marques haut de gamme et des circuits de vente au détail et de consommation directe très développés.
- L'Asie-Pacifique devrait être la région qui connaîtra la croissance la plus rapide, avec un TCAC de 6,81% dû à l'urbanisation rapide, à l'augmentation de la consommation de la classe moyenne, à la forte capacité de production, à l'expansion des secteurs des cafés et de l'accueil, et à l'adoption rapide du commerce électronique, qui augmente la demande en Chine, au Japon, en Inde et en Corée du Sud.
- Les bouteilles sont restées le premier segment de produits, représentant 39,65 % des revenus du marché en 2025, sous l'impulsion d'une forte demande des consommateurs pour des produits réutilisables, isolés et durables d'hydratation, ainsi que de l'adoption croissante de produits de boisson sur le marché et de l'innovation continue des produits.
- Les boissons métalliques sont le segment de matériaux qui connaît la croissance la plus rapide et qui devrait enregistrer le TCAC le plus élevé au cours de la période de prévision de 2026 à 2033, en raison de l'augmentation de la demande de bouteilles et de tumblers isolés en acier inoxydable, de l'augmentation des activités de plein air et de voyages et de la tendance croissante vers des solutions de remplacement durables et réutilisables des plastiques à usage unique.
- En 2025, Supermarket a représenté la plus grande part des canaux de distribution, appuyée par une grande disponibilité de produits, des prix concurrentiels, des offres promotionnelles et la commodité d'un guichet unique. Le commerce électronique est le canal de distribution qui connaît la croissance la plus rapide et qui devrait s'étendre au niveau le plus élevé du TCAC pendant la période de prévision de 2026 à 2033, en raison de l'augmentation de la pénétration d'Internet, de l'adoption d'un smartphone, des paiements numériques, de l'élargissement de la disponibilité des produits, des avis des clients et de la croissance des marques directes aux consommateurs.
Portée du rapport et segmentation du marché mondial des boissons
|
Attributs |
Conduire des simulateurs Principales perspectives du marché |
|
Segments couverts |
|
|
Pays couverts |
Amérique du Nord
Europe
Asie-Pacifique
Moyen-Orient et Afrique
Amérique du Sud
|
|
Principaux acteurs du marché |
|
|
Possibilités de marché |
|
|
Infos sur la valeur ajoutée |
En plus des renseignements sur les scénarios du marché tels que la valeur du marché, le taux de croissance, la segmentation, la couverture géographique et les principaux intervenants, les rapports de marché établis par Data Bridge Market Research comprennent également une analyse approfondie des experts, une analyse des prix, une analyse des parts de marque, une enquête auprès des consommateurs, une analyse démographique, une analyse de la chaîne d'approvisionnement, une analyse de la chaîne de valeur, une vue d'ensemble des matières premières et des consommables, des critères de sélection des fournisseurs, une analyse PESTLE, une analyse Porter et un cadre réglementaire. |
Tendances du marché des boissons
Tendance : Accélérer l'adoption de drinkwares réutilisables, conçus et axés sur le style de vie
L'une des principales tendances actuelles est que les boissons réutilisables dépassent de plus en plus une fonction d'utilité de base et deviennent un mode de vie visible, un bien-être et un produit de conception. Les consommateurs évaluent les bouteilles, les tumblers, les tasses et les verres en fonction de l'isolation, de la capacité, de la conception du couvercle, de la portabilité, de la couleur, de la texture, de la personnalisation et de l'identité de la marque. Les préoccupations et les efforts de durabilité visant à réduire les contenants à boisson à usage unique renforcent la demande de produits durables en métal, en verre, en céramique et en polymères de qualité supérieure. Parmi les facteurs qui appuient cette tendance, mentionnons les formats isolés à haute capacité, la consommation de sport et de conditionnement physique, le don, la visibilité des médias sociaux, la culture des cafés et la vente au détail numérique. L'analyse mondiale identifie l'image de marque, l'esthétique, les boissons réutilisables, l'expansion de l'hôtellerie et les ventes en ligne comme des thèmes de croissance importants. La croissance la plus rapide dans les boissons métalliques et le commerce électronique montre également que les consommateurs combinent fonctionnalité, design haut de gamme et découverte de produits pratiques. Par exemple, en juin 2026, Hydro Flask et Universal Music Group ont annoncé un partenariat mondial pour installer des solutions d'hydratation réutilisables dans les studios de musique, les sessions d'écriture de chansons et les événements. Le programme de première année vise à éliminer plus de 10 000 boissons à usage unique et à distribuer plus de 2 000 bouteilles réutilisables, tandis que les produits d'inspiration artistique et de studio limités relient la durabilité à la culture et à l'image de marque. On s'attend à ce que l'intégration continue de la durabilité, de la performance, de la personnalisation et de la collaboration culturelle renforce la prime et augmente les achats répétés, en particulier chez les consommateurs plus jeunes, soucieux de la conception et du bien-être.
Dynamique du marché mondial des boissons
Facteur clé du marché :Augmentation de la demande de produits d'hydratation réutilisables et axés sur la santé
Le marché est principalement motivé par une prise de conscience accrue de l'hydratation, de la santé, de la durabilité et de l'impact environnemental des contenants de boissons jetables. Les consommateurs choisissent de plus en plus de bouteilles d'eau réutilisables, de gobelets, de tasses et de tasses de voyage pour le travail, l'éducation, l'exercice, les déplacements, les loisirs en plein air et l'utilisation à domicile. Les produits durables en acier inoxydable, verre, céramique et polymères sans BPA offrent une combinaison pratique de portabilité, de contrôle de température, de sécurité et de longue durée de vie. La croissance est renforcée par l'expansion de la consommation de boissons et des services alimentaires. L'industrie américaine des restaurants et des services alimentaires devrait atteindre 1,5 billion de dollars en 2025, tandis que la British Soft Drinks Association a indiqué que le volume des ventes de boissons douces au Royaume-Uni a augmenté de 1,7 % en 2024 et que la valeur des ventes a atteint 22,3 milliards de livres sterling. Ces grands écosystèmes au service des boissons créent une demande récurrente pour les produits ménagers, l'hospitalité, les boissons à emporter et les boissons de marque. Par exemple, YETI a signalé que les ventes nettes de produits de boisson ont augmenté de 6 % au quatrième trimestre de 2025, tandis que les ventes nettes internationales ont augmenté de 25 %. Le résultat démontre la demande soutenue des consommateurs de produits de boisson réutilisables haut de gamme et la capacité des marques établies à se développer grâce à l'innovation des produits, à la distribution internationale et au commerce de détail multicanaux. À mesure que l'hydratation devient une priorité quotidienne en matière de bien-être et que les produits réutilisables deviennent plus largement acceptés, on s'attend à ce que la demande demeure stable dans les ménages, les services alimentaires commerciaux, les voyages, les sports, l'éducation et les milieux de travail.
Principales contraintes et défis : Intensification de la concurrence en matière de prix et pression sur les coûts des matières premières
L'un des principaux défis à relever est que les fournisseurs de produits de boisson font face à une forte concurrence de produits locaux, sans marque et à faible coût qui offrent des fonctionnalités similaires à court terme. Les marques premium doivent justifier des prix plus élevés grâce aux performances d'isolation, à la résistance aux fuites, à la durabilité, à la sécurité des matériaux, au soutien de la garantie, au design et à la confiance de la marque. Les changements fréquents de couleur et de collection peuvent également raccourcir les cycles de vie perçus des produits et augmenter le risque d'inventaire pour les détaillants et les fabricants. Les coûts pour l'acier inoxydable, le verre, les polymères, l'emballage, le fret et l'énergie peuvent changer en raison des perturbations de la chaîne d'approvisionnement, des tarifs, des taux de change et des conditions géopolitiques. Ces pressions sont particulièrement importantes pour les marques qui disposent de réseaux mondiaux d'approvisionnement et de produits fabriqués dans plusieurs pays. Les consommateurs sensibles aux prix peuvent retarder les achats de remplacement ou passer à des solutions de base lorsque les prix de détail augmentent. Par exemple, YETI a déclaré que ses gains ajustés au quatrième trimestre de 2025 comprenaient un effet défavorable de 0,15 USD par action provenant de coûts tarifaires plus élevés, tandis que les gains ajustés au cours de l'année entière comprenaient un effet défavorable de 0,35 USD. L'entreprise a également souligné la diversification continue de la chaîne d'approvisionnement, montrant comment les tarifs et les décisions de production-localisation peuvent affecter la rentabilité même lorsque la demande de boissons reste positive. On s'attend à ce que la concurrence en matière de prix et la volatilité entre les intrants et les coûts demeurent d'importantes restrictions, en encourageant les fournisseurs à accroître leur souplesse d'approvisionnement, à gérer soigneusement les stocks, à améliorer la durabilité des produits et à communiquer une valeur claire aux consommateurs.
Principales possibilités de marché : Élargir le commerce électronique des produits de boisson métalliques et des produits de consommation directe
La plus forte opportunité à court terme réside dans les bouteilles de métal isolées, les tumblers, les tasses de voyage et les produits de fitness qui combinent durabilité, rétention de température, portabilité et conception réutilisable. Les boissons métalliques sont le segment mondial le plus en croissance dans le dernier point de référence public, tandis que les gobelets devraient croître fortement sur le plus grand marché régional. De plus grandes capacités, des poignées intégrées, des couvercles de paille, des accessoires modulaires et des systèmes à double prise augmentent les occasions d'utilisation. Les canaux en ligne et direct au consommateur offrent d'autres possibilités grâce à un large assortiment, à l'examen des produits, à la personnalisation, à des baisses d'édition limitées, à des programmes d'abonnement ou de fidélité et à un accès international. L'initiative combine des boissons métalliques de première qualité avec de la circulaire, de l'engagement des consommateurs et des incitations à l'achat répété, démontrant ainsi comment la durabilité peut devenir un différenciateur commercial. Les fabricants qui combinent la performance des métaux, les matériaux recyclés, l'innovation en matière de conception, la personnalisation et la forte distribution numérique devraient saisir des possibilités de croissance intéressantes au cours de la période de prévision.
Étendue du marché des produits de boisson
Le marché mondial des boissons est segmenté en fonction du produit, du matériel, de l'application et du canal de distribution.
- Par produit
Sur la base du produit, le marché mondial de la boisson est segmenté en bouteilles, verre à vin, verre à bière, tasses à café et tasses à thé, verre quotidien, verre à cocktail, verre à alcool, etc. Le segment des bouteilles a dominé le marché avec une part des revenus de 39,65 % en 2025, en raison de la demande croissante de produits d'hydratation réutilisables, isolés et durables pour les applications résidentielles, commerciales et extérieures. La préférence accrue des consommateurs pour les boissons sur le marché, la sensibilisation accrue à l'environnement et les innovations continues de produits dans l'isolation sous vide et les matériaux haut de gamme ont renforcé le leadership du segment.
Le segment des tasses de café et des tasses de thé devrait enregistrer la croissance la plus rapide au cours de la période de prévision de 2026 à 2033, soutenue par l'expansion de la culture des cafés, l'augmentation de la consommation de café et de thé et la demande croissante de produits esthétiques et personnalisés. On s'attend à ce que la popularité croissante des tasses en céramique, des boissons spécialisées et des tendances du don accélère encore la croissance du marché.
- Par matière
Sur la base de la matière, le marché mondial de la boisson est segmenté en polymères, métal, verre, silicone, céramique, plastique, porcelaine osseuse et porcelaine/pierre. Le segment du verre représentait la plus grande part de marché en 2025, en raison de son aspect haut de gamme, de sa recyclabilité, de son inerte chimique et de son utilisation généralisée dans les ménages, les restaurants, les bars et le secteur de l'accueil. Les boissons en verre continuent d'être préférées pour servir des boissons alcoolisées, des jus et des boissons premium en raison de sa transparence et de sa capacité à préserver le goût des boissons.
On s'attend à ce que le segment des métaux soit témoin du TCAC le plus rapide de 2026 à 2033, en raison de l'augmentation de la demande de bouteilles et de tambours isolés en acier inoxydable, de l'augmentation des activités à l'extérieur et des voyages, et de la tendance croissante vers des solutions de rechange durables et réutilisables aux plastiques à usage unique.
- Par demande
Sur la base de l'application, le marché mondial des boissons est segmenté en produits domestiques et commerciaux. Le segment national détenait la plus grande part de marché en 2025, en raison de l'augmentation de la consommation de boissons réutilisables par les ménages, de la prise de conscience croissante de la santé et de l'adoption croissante de produits de cuisine de qualité supérieure. Les consommateurs investissent de plus en plus dans des produits de boisson durables et esthétiquement attrayants pour l'hydratation quotidienne et les repas à domicile.
Le segment commercial devrait enregistrer la croissance la plus rapide au cours de la période de prévision de 2026 à 2033, avec l'appui de l'expansion des industries de l'hôtellerie, de la restauration, des cafés et des restaurants à service rapide, ainsi que de la demande croissante de produits de boisson premium et personnalisés dans les hôtels, les restaurants et les entreprises.
- Par canal de distribution
Sur la base de la chaîne de distribution, le marché mondial des boissons est segmenté en supermarchés, magasins indépendants et commerce électronique. Le segment Supermarket a dominé le marché en 2025, en raison de son large assortiment de produits, des offres promotionnelles attrayantes, et la commodité d'un guichet unique. Les consommateurs continuent de préférer les supermarchés pour évaluer la qualité, la conception et les prix des produits avant l'achat.
Le segment du commerce électronique devrait connaître la croissance la plus rapide de 2026 à 2033, en raison de l'augmentation de la pénétration d'Internet, de l'utilisation croissante des smartphones, de l'adoption croissante des paiements numériques et de la disponibilité de vastes choix de produits, de prix concurrentiels, d'avis de clients et d'offres de marques directes aux consommateurs. On s'attend à ce que la croissance des plateformes de vente au détail en ligne et les expériences d'achat personnalisées favorisent la croissance du segment.
Analyse régionale du marché des boissons
Amérique du Norda dominé le marché mondial des boissons et a représenté la plus grande part des recettes de30,71 % en 2025, en raison de la forte préférence des consommateurs pour les articles de boisson réutilisables et isolés, d'une consommation élevée des ménages et des services alimentaires et d'une participation généralisée aux activités de plein air et de loisirs. La présence de grandes marques de produits de boisson haut de gamme, de réseaux bien établis de vente au détail et de circuits de vente directs aux consommateurs en expansion rapide soutient encore le leadership du marché régional.
Aperçu du marché américain des produits de boisson
Le marché américain connaît une croissance soutenue, soutenue par une forte demande de produits réutilisables, isolés et durables. Une sensibilisation accrue à la santé et au bien-être, une participation accrue aux activités récréatives en plein air et la popularité croissante de la consommation de boissons sur place sont à l'origine de l'adoption de produits. De plus, la présence de marques haut de gamme établies, l'expansion des canaux de commerce électronique et l'innovation continue des produits dans les bouteilles, les tumblers et les tasses de voyage sous vide continuent de renforcer le marché américain.
Aperçu du marché canadien des produits de boisson
Le marché canadien des produits de boisson ne cesse d'augmenter en raison de la préférence croissante des consommateurs pour les contenants de boissons écologiques et réutilisables, appuyée par des initiatives de durabilité croissantes et des efforts gouvernementaux visant à réduire les plastiques à usage unique. La hausse des activités de plein air et de loisirs, conjuguée à la demande croissante de boissons isothermes de qualité supérieure pour les boissons chaudes et froides, contribue à la croissance du marché. De plus, l'augmentation de la disponibilité au détail et des ventes en ligne améliore l'accessibilité des produits partout au pays.
Aperçu du marché des boissons en Asie-Pacifique
Le marché de la boisson en Asie-Pacifique devrait connaître une croissance rapide, en raison de l'urbanisation croissante, de l'augmentation des revenus disponibles et de l'évolution des modes de vie des consommateurs. La demande croissante de boissons réutilisables, l'expansion de la culture des cafés et l'adoption croissante de produits d'hydratation haut de gamme favorisent l'expansion du marché régional. De plus, les capacités de fabrication solides de la région, la croissance rapide du commerce de détail organisé et l'expansion de l'écosystème du commerce électronique accélèrent le développement des marchés dans les grandes économies.
Aperçu du marché japonais de la boisson
Le marché japonais de la boisson connaît une croissance constante en raison de la forte préférence des consommateurs pour les produits de boisson de qualité supérieure, durables et isolés. La demande croissante de contenants de boissons portables, la forte culture des dépanneurs et la sensibilisation croissante à l'environnement encouragent l'adoption de bouteilles et de tambours réutilisables. L'innovation des produits, les capacités de fabrication avancées et la popularité des boissons compactes et esthétiques continuent de soutenir la croissance du marché.
China Drinkware Market Insight
Le marché chinois de la boisson augmente rapidement, en raison de l'urbanisation croissante, de l'augmentation du revenu disponible et de l'augmentation de la consommation de la classe moyenne. Une prise de conscience croissante de la durabilité, une préférence accrue pour les bouteilles réutilisables et les tumblers isolés et l'expansion rapide des plateformes de commerce électronique stimulent considérablement la demande de produits. En outre, l'écosystème manufacturier fort de la Chine, l'innovation continue des produits et la croissance des industries des cafés et des services alimentaires placent le pays comme l'un des marchés de boissons les plus dynamiques au monde.
Part du marché de la boisson
Le marché de la boisson est établi par des entreprises bien connues:
- YETI Holdings, Inc. (États-Unis)
- Zhejiang Haers Vacuum Containers Co., Ltd. (Chine)
- Libbey Inc. (États-Unis)
- CamelBak Products, LLC (États-Unis)
- Marques Trove / Owala (États-Unis)
- Thermos L.L.C. (États-Unis)
- Klean Kanteen, Inc. (États-Unis)
- Williams-Sonoma, Inc. (États-Unis)
- Tervis Tumbler Company (États-Unis)
- Bormioli Rocco S.p.A. (Italie)
- Pasabahce (Turquie)
- Groupe Dometic AB (Suède)
Derniers développements du marché des produits de boisson
- En juin 2026, Hydro Flask et Universal Music Group ont annoncé un partenariat mondial visant à promouvoir les boissons réutilisables dans les studios d'enregistrement, les sessions d'écriture de chansons, les événements en direct et les expériences d'artistes. Le programme vise à éliminer plus de 10 000 boissons à usage unique au cours de sa première année, à distribuer plus de 2 000 bouteilles réutilisables, et à développer des produits limités inspirés par les artistes et les studios, renforçant ainsi le lien entre la durabilité, la culture et les boissons de style de vie.
- En mai 2026, Stanley 1913 a signalé que 81 % de ses unités en acier inoxydable produites en 2025 contenaient de l'acier inoxydable recyclé, dépassant ainsi son objectif de matériau antérieur. L'entreprise a également élargi son programme Take Back, qui permet aux consommateurs de retourner les produits admissibles au recyclage, démontrant ainsi que les matériaux recyclés et la récupération des produits deviennent d'importantes stratégies concurrentielles dans les produits de boisson réutilisables de qualité supérieure.
- En février 2026, YETI Holdings a signalé que les ventes nettes de produits de boisson ont augmenté de 6 % au quatrième trimestre de 2025, soutenues par une forte croissance internationale. La société a également fourni une perspective 2026 axée sur l'innovation, l'expansion internationale et les investissements continus, indiquant une demande commerciale soutenue de bouteilles isothermes, de tumblers, de tasses et de produits d'hydratation connexes.
SKU-
Accédez en ligne au rapport sur le premier cloud mondial de veille économique

- Tableau de bord d'analyse de données interactif
- Tableau de bord d'analyse d'entreprise pour les opportunités à fort potentiel de croissance
- Accès d'analyste de recherche pour la personnalisation et les requêtes
- Analyse de la concurrence avec tableau de bord interactif
- Dernières actualités, mises à jour et analyse des tendances
- Exploitez la puissance de l'analyse comparative pour un suivi complet de la concurrence
Table des matières
1. INTRODUCTION
1.1 OBJECTIVES OF THE STUDY
1.2 MARKET DEFINITION
1.3 OVERVIEW OF GLOBAL DRINKWARE MARKET
1.4 CURRENCY AND PRICING
1.5 LIMITATION
1.6 MARKETS COVERED
2 MARKET SEGMENTATION
2.1 KEY TAKEAWAYS
2.2 ARRIVING AT THE GLOBAL DRINKWARE MARKET SIZE
2.3 VENDOR POSITIONING GRID
2.4 MARKETS COVERED
2.5 GEOGRAPHIC SCOPE
2.6 YEARS CONSIDERED FOR THE STUDY
2.7 RESEARCH METHODOLOGY
2.8 TECHNOLOGY LIFE LINE CURVE
2.9 MULTIVARIATE MODELLING
2.10 PRIMARY INTERVIEWS WITH KEY OPINION LEADERS
2.11 DBMR MARKET POSITION GRID
2.12 MARKET APPLICATION COVERAGE GRID
2.13 DBMR MARKET CHALLENGE MATRIX
2.14 SECONDARY SOURCES
2.15 GLOBAL DRINKWARE MARKET: RESEARCH SNAPSHOT
2.16 ASSUMPTIONS
3 MARKET OVERVIEW
3.1 DRIVERS
3.2 RESTRAINTS
3.3 OPPORTUNITIES
3.4 CHALLENGES
4 EXECUTIVE SUMMARY
5 PREMIUM INSIGHTS
5.1 CONSUMER BUYING BEHAVIOUR
5.2 FACTORS AFFECTING BUYING DECISION
5.3 PRODUCT ADOPTION SCENARIO
5.4 PORTER’S FIVE FORCES
5.5 REGULATION COVERAGE
5.6 BRAND ANALYSIS
5.7 RAW MATERIAL SOURCING ANALYSIS
5.8 IMPORT EXPORT SCENARIO
6 PRODUCTION CAPACITY OUTLOOK
7 BRAND OUTLOOK GRID
8 IMPACT OF ECONOMIC SLOWDOWN
8.1 IMPACT ON PRICES
8.2 IMPACT ON SUPPLY CHAIN
8.3 IMPACT ON SHIPMENT
8.4 IMPACT ON DEMAND
8.5 IMPACT ON STRATEGIC DECISIONS
9 SUPPLY CHAIN ANALYSIS
9.1 OVERVIEW
9.2 LOGISTIC COST SCENARIO
9.3 IMPORTANCE OF LOGISTICS SERVICE PROVIDERS
10 GLOBAL GLASSWARE MARKET, BY RAW MATERIAL, 2020-2029, (USD MILLION) (MILLION UNITS)
10.1 OVERVIEW
10.2 SODA LIME GLASS
10.3 ASP
10.4 VOLUME
10.5 VALUE
10.6 LEAD GLASS
10.7 ASP
10.8 VOLUME
10.9 VALUE
10.10 HEAT RESISTANT
10.11 ASP
10.12 VOLUME
10.13 VALUE
10.14 OTHERS
10.15 ASP
10.16 VOLUME
10.17 VALUE
11 GLOBAL DRINKWARE MARKET, BY STYLE, 2020-2029, (USD MILLION) (MILLION UNITS)
11.1 OVERVIEW
11.2 EVERYDAY USAGE
11.3 ASP
11.4 VOLUME
11.5 VALUE
11.6 STEMWARE
11.7 ASP
11.8 VOLUME
11.9 VALUE
11.10 STEMWARE, BY CATEGORY
1.1.1 RED WINE GLASS
1.1.1.1. CABERNET
1.1.1.2. BURGUNDY
1.1.1.3. BORDEAUX
1.1.1.4. ZINFANDEL
1.1.1.5. PINOT NOIR
1.1.1.6. ROSE
1.1.2 WHITE WINE GLASS
1.1.2.1. CHARDONNAY
1.1.2.2. VIOGNIER
1.1.2.3. SPARKLING
1.1.2.4. SWEET WINE
1.1.2.5. VINTAGE
11.11 STEMLESS GLASS
11.12 ASP
11.13 VOLUME
11.14 VALUE
11.15 STEMLESS GLASS, BY CATEGORY
11.16 BEER GLASS
11.17 LIQUOR GLASS
11.18 OTHERS
11.19 ASP
11.20 VOLUME
11.21 VALUE
12 GLOBAL DRINKWARE MARKET, BY DISTRIBUTION CHANNEL, 2020-2029, (USD MILLION)
12.1 OVERVIEW
12.2 B2B
12.3 E COMMERCE
12.4 SUPERMARKETS/HYPERMARKETS
12.5 SPECIALIZED STORES
12.6 OTHERS
13 GLOBAL DRINKWARE MARKET, BY END-USE, 2020-2029, (USD MILLION)
13.1 OVERVIEW
13.2 HOTELS & RESTAURANTS
13.3 BARS & CAFE
13.4 CORPORATE CANTEENS
13.5 HOUSEHOLD
13.6 OTHERS
14 GLOBAL DRINKWARE MARKET, BY GEOGRAPHY, 2020-2029, (USD MILLION)(MILLION UNITS)
14.1 GLOBAL GLASSWARE MARKET, (ALL SEGMENTATION PROVIDED ABOVE IS REPRESENTED IN THIS CHAPTER BY COUNTRY)
14.2 OVERVIEW
14.3 NORTH AMERICA
1.1.3 U.S.
1.1.4 CANADA
1.1.5 MEXICO
14.4 EUROPE
1.1.6 GERMANY
1.1.7 U.K.
1.1.8 ITALY
1.1.9 FRANCE
1.1.10 SPAIN
1.1.11 SWITZERLAND
1.1.12 RUSSIA
1.1.13 TURKEY
1.1.14 BELGIUM
1.1.15 NETHERLANDS
1.1.16 REST OF EUROPE
14.5 ASIA-PACIFIC
1.1.17 JAPAN
1.1.18 CHINA
1.1.19 SOUTH KOREA
1.1.20 INDIA
1.1.21 AUSTRALIA & NEW ZEALAND
1.1.22 HONG KONG
1.1.23 TAIWAN
1.1.24 SINGAPORE
1.1.25 THAILAND
1.1.26 INDONESIA
1.1.27 MALAYSIA
1.1.28 PHILIPPINES
1.1.29 REST OF ASIA-PACIFIC
14.6 SOUTH AMERICA
1.1.30 BRAZIL
1.1.31 ARGENTINA
1.1.32 REST OF SOUTH AMERICA
14.7 MIDDLE EAST AND AFRICA
1.1.33 SOUTH AFRICA
1.1.34 EGYPT
1.1.35 SAUDI ARABIA
1.1.36 UNITED ARAB EMIRATES
1.1.37 ISRAEL
1.1.38 REST OF MIDDLE EAST AND AFRICA
15 GLOBAL DRINKWARE MARKET, COMPANY LANDSCAPE
15.1 COMPANY SHARE ANALYSIS: GLOBAL
15.2 COMPANY SHARE ANALYSIS: NORTH AMERICA
15.3 COMPANY SHARE ANALYSIS: ASIA-PACIFIC
15.4 COMPANY SHARE ANALYSIS: EUROPE
15.5 MERGERS & ACQUISITIONS
15.6 NEW PRODUCT DEVELOPMENT & APPROVALS
15.7 EXPANSIONS
15.8 REGULATORY CHANGES
15.9 PARTNERSHIP AND OTHER STRATEGIC DEVELOPMENTS
16 GLOBAL DRINKWARE MARKET – COMPANY PROFILES
16.1 VILLEROY & BOCH AG
1.1.39 COMPANY SNAPSHOT
1.1.40 REVENUE ANALYSIS
1.1.41 SWOT ANALYSIS
1.1.42 PRODUCTION CAPACITY OVERVIEW
1.1.43 PRODUCT PORTFOLIO
1.1.44 RECENT UPDATES
16.2 GUY DEGRENNE SA
1.1.45 COMPANY SNAPSHOT
1.1.46 REVENUE ANALYSIS
1.1.47 SWOT ANALYSIS
1.1.48 PRODUCTION CAPACITY OVERVIEW
1.1.49 PRODUCT PORTFOLIO
1.1.50 RECENT UPDATES
16.3 NORITAKE CO., LTD.
1.1.51 COMPANY SNAPSHOT
1.1.52 REVENUE ANALYSIS
1.1.53 SWOT ANALYSIS
1.1.54 PRODUCTION CAPACITY OVERVIEW
1.1.55 PRODUCT PORTFOLIO
1.1.56 RECENT UPDATES
16.4 LENOX CORPORATION
1.1.57 COMPANY SNAPSHOT
1.1.58 REVENUE ANALYSIS
1.1.59 SWOT ANALYSIS
1.1.60 PRODUCTION CAPACITY OVERVIEW
1.1.61 PRODUCT PORTFOLIO
1.1.62 RECENT UPDATES
16.5 LIFETIME BRANDS, INC.
1.1.63 COMPANY SNAPSHOT
1.1.64 REVENUE ANALYSIS
1.1.65 SWOT ANALYSIS
1.1.66 PRODUCTION CAPACITY OVERVIEW
1.1.67 PRODUCT PORTFOLIO
1.1.68 RECENT UPDATES
16.6 THE ZRIKE COMPANY, INC.
1.1.69 COMPANY SNAPSHOT
1.1.70 REVENUE ANALYSIS
1.1.71 SWOT ANALYSIS
1.1.72 PRODUCTION CAPACITY OVERVIEW
1.1.73 PRODUCT PORTFOLIO
1.1.74 RECENT UPDATES
16.7 LIBBEY, INC.
1.1.75 COMPANY SNAPSHOT
1.1.76 REVENUE ANALYSIS
1.1.77 SWOT ANALYSIS
1.1.78 PRODUCTION CAPACITY OVERVIEW
1.1.79 PRODUCT PORTFOLIO
1.1.80 RECENT UPDATES
16.8 WORLD KITCHEN, LLC
1.1.81 COMPANY SNAPSHOT
1.1.82 REVENUE ANALYSIS
1.1.83 SWOT ANALYSIS
1.1.84 PRODUCTION CAPACITY OVERVIEW
1.1.85 PRODUCT PORTFOLIO
1.1.86 RECENT UPDATES
16.9 WMF WURTTEMBERGISCHE METALLWARENFABRIK AG
1.1.87 COMPANY SNAPSHOT
1.1.88 REVENUE ANALYSIS
1.1.89 SWOT ANALYSIS
1.1.90 PRODUCTION CAPACITY OVERVIEW
1.1.91 PRODUCT PORTFOLIO
1.1.92 RECENT UPDATES
16.10 ONEIDA LTD.
1.1.93 COMPANY SNAPSHOT
1.1.94 REVENUE ANALYSIS
1.1.95 SWOT ANALYSIS
1.1.96 PRODUCTION CAPACITY OVERVIEW
1.1.97 PRODUCT PORTFOLIO
1.1.98 RECENT UPDATES
16.11 JAYSYNTH DYESTUFF (INDIA) LIMITED
1.1.99 COMPANY SNAPSHOT
1.1.100 REVENUE ANALYSIS
1.1.101 PRODUCT PORTFOLIO
1.1.102 RECENT UPDATES
16.12 DIGITAL INK LIMITED
1.1.103 COMPANY SNAPSHOT
1.1.104 REVENUE ANALYSIS
1.1.105 SWOT ANALYSIS
1.1.106 PRODUCTION CAPACITY OVERVIEW
1.1.107 PRODUCT PORTFOLIO
1.1.108 RECENT UPDATES
16.13 AVERY DENNISON CORPORATION
1.1.109 COMPANY SNAPSHOT
1.1.110 REVENUE ANALYSIS
1.1.111 SWOT ANALYSIS
1.1.112 PRODUCTION CAPACITY OVERVIEW
1.1.113 PRODUCT PORTFOLIO
1.1.114 RECENT UPDATES
16.14 WADAAN INDUSTRIES LLC
1.1.115 COMPANY SNAPSHOT
1.1.116 REVENUE ANALYSIS
1.1.117 SWOT ANALYSIS
1.1.118 PRODUCTION CAPACITY OVERVIEW
1.1.119 PRODUCT PORTFOLIO
1.1.120 RECENT UPDATES
17 QUESTIONNAIRE
18 RELATED REPORTS
19 ABOUT DATA BRIDGE MARKET RESEARCH
Méthodologie de recherche
La collecte de données et l'analyse de l'année de base sont effectuées à l'aide de modules de collecte de données avec des échantillons de grande taille. L'étape consiste à obtenir des informations sur le marché ou des données connexes via diverses sources et stratégies. Elle comprend l'examen et la planification à l'avance de toutes les données acquises dans le passé. Elle englobe également l'examen des incohérences d'informations observées dans différentes sources d'informations. Les données de marché sont analysées et estimées à l'aide de modèles statistiques et cohérents de marché. De plus, l'analyse des parts de marché et l'analyse des tendances clés sont les principaux facteurs de succès du rapport de marché. Pour en savoir plus, veuillez demander un appel d'analyste ou déposer votre demande.
La méthodologie de recherche clé utilisée par l'équipe de recherche DBMR est la triangulation des données qui implique l'exploration de données, l'analyse de l'impact des variables de données sur le marché et la validation primaire (expert du secteur). Les modèles de données incluent la grille de positionnement des fournisseurs, l'analyse de la chronologie du marché, l'aperçu et le guide du marché, la grille de positionnement des entreprises, l'analyse des brevets, l'analyse des prix, l'analyse des parts de marché des entreprises, les normes de mesure, l'analyse globale par rapport à l'analyse régionale et des parts des fournisseurs. Pour en savoir plus sur la méthodologie de recherche, envoyez une demande pour parler à nos experts du secteur.
Personnalisation disponible
Data Bridge Market Research est un leader de la recherche formative avancée. Nous sommes fiers de fournir à nos clients existants et nouveaux des données et des analyses qui correspondent à leurs objectifs. Le rapport peut être personnalisé pour inclure une analyse des tendances des prix des marques cibles, une compréhension du marché pour d'autres pays (demandez la liste des pays), des données sur les résultats des essais cliniques, une revue de la littérature, une analyse du marché des produits remis à neuf et de la base de produits. L'analyse du marché des concurrents cibles peut être analysée à partir d'une analyse basée sur la technologie jusqu'à des stratégies de portefeuille de marché. Nous pouvons ajouter autant de concurrents que vous le souhaitez, dans le format et le style de données que vous recherchez. Notre équipe d'analystes peut également vous fournir des données sous forme de fichiers Excel bruts, de tableaux croisés dynamiques (Fact book) ou peut vous aider à créer des présentations à partir des ensembles de données disponibles dans le rapport.

