

| 2026 - 2033 | |
| USD 29.73 [email protected] | |
| USD 42.51 [email protected] | |
| % | |
|
Drinkware Market Overview
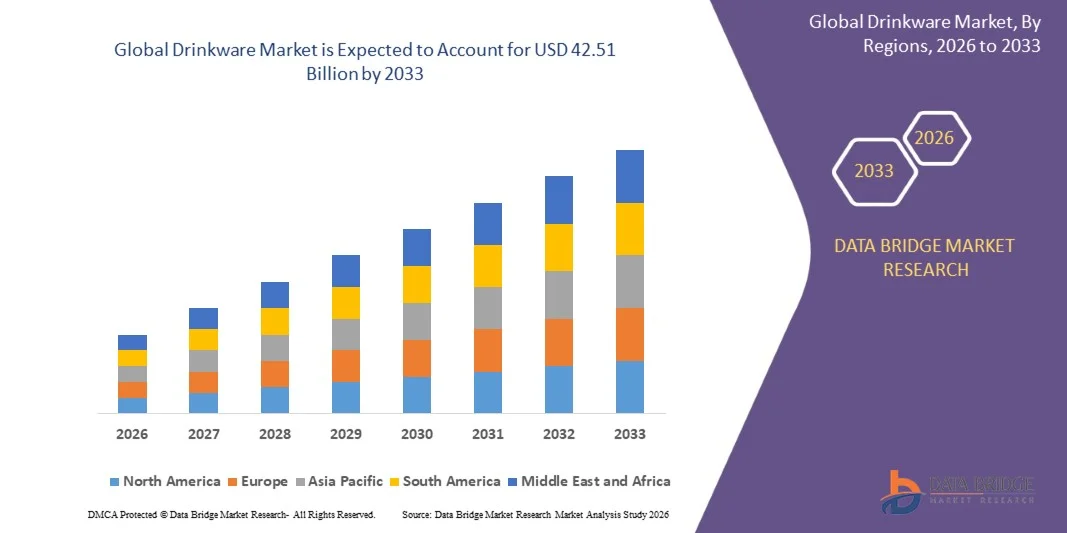
The drinkware market was valued at USD 29.73 billion in 2025 and is projected to reach USD 42.51 billion by 2033, growing at a CAGR of 4.57% from 2026 to 2033. The market growth is being supported by reusable drinkware adoption, lifestyle branding, expanding hospitality demand, sports and fitness culture,
Drinkware is increasingly moving beyond basic beverage consumption and becoming a product category shaped by sustainability, personal style, wellness, and convenience. Consumers are purchasing reusable bottles, insulated tumblers, mugs, and premium glassware for hydration, travel, sports, home dining, gifting, and hospitality use. Manufacturers are responding with new materials, better insulation, leakproof formats, limited-edition color drops, customization, and stronger direct-to-consumer channels.
Market Size & Forecast
- Global Market Value (2025): USD 29.73 Billion
- Expected Market Value (2033): USD 42.51 Billion
- Forecast CAGR (2026-2033): 4.57%
- Leading Region: North America
- Fastest-Growing Region: Asia-Pacific
Key Market Trends & Insights
- North America dominated the drinkware market in 2025 with an estimated 30.71% revenue share. The Demand is supported by strong reusable and insulated drinkware adoption, large household and foodservice consumption, outdoor recreation, premium brands, and highly developed retail and direct-to-consumer channels.
- Asia-Pacific is expected to be the fastest-growing region, with a CAGR of 6.81% driven by rapid urbanization, rising middle-class consumption, strong manufacturing capacity, expanding café and hospitality sectors, and rapid e-commerce adoption are increasing demand across China, Japan, India, and South Korea.
- Bottles remained the leading product segment, accounting for 39.65% of market revenue in 2025, driven by strong consumer demand for reusable, insulated, and sustainable hydration products, along with increasing adoption of on-the-go drinkware and continuous product innovation.
- Metal drinkware is the fastest-growing material segment, projected to register the highest CAGR during the forecast period of 2026 to 2033, driven by rising demand for stainless steel insulated bottles and tumblers, increasing outdoor and travel activities, and the growing shift toward durable, reusable alternatives to single-use plastics.
- Supermarket accounted for the largest distribution channel share in 2025, supported by extensive product availability, competitive pricing, promotional offers, and the convenience of one-stop shopping. E-commerce is the fastest-growing distribution channel, projected to expand at the highest CAGR during the forecast period of 2026 to 2033, driven by increasing internet penetration, smartphone adoption, digital payments, wider product availability, customer reviews, and the growth of direct-to-consumer brands.
Report Scope and Global Drinkware Market Segmentation
|
Attributes |
Driving Simulators Key Market Insights |
|
Segments Covered |
|
|
Countries Covered |
North America
Europe
Asia-Pacific
Middle East and Africa
South America
|
|
Key Market Players |
|
|
Market Opportunities |
|
|
Value Added Data Infosets |
In addition to the insights on market scenarios such as market value, growth rate, segmentation, geographical coverage, and major players, the market reports curated by the Data Bridge Market Research also include in-depth expert analysis, pricing analysis, brand share analysis, consumer survey, demography analysis, supply chain analysis, value chain analysis, raw material/consumables overview, vendor selection criteria, PESTLE Analysis, Porter Analysis, and regulatory framework. |
Drinkware Market Trends
Trend: Accelerating Adoption of Reusable, Design-Led, and Lifestyle-Focused Drinkware
A major current trend is that reusable drinkware is increasingly moving beyond a basic utility function and becoming a visible lifestyle, wellness, and design product. Consumers evaluate bottles, tumblers, mugs, and glasses based on insulation, capacity, lid design, portability, color, texture, personalization, and brand identity. Sustainability concerns and efforts to reduce single-use beverage containers are reinforcing demand for durable metal, glass, ceramic, and premium polymer products. Industry factors supporting the trend include high-capacity insulated formats, sports and fitness consumption, gifting, social-media visibility, café culture, and digital retail. Global analysis identifies lifestyle branding, aesthetics, reusable drinkware, hospitality expansion, and online sales as important growth themes. The fastest growth in metal drinkware and e-commerce also shows that consumers are combining functionality with premium design and convenient product discovery. For instance, in June 2026, Hydro Flask and Universal Music Group announced a global partnership to install reusable hydration solutions across music studios, songwriting sessions, and events. The first-year program aims to eliminate more than 10,000 single-use drinks and distribute over 2,000 reusable bottles, while limited artist- and studio-inspired products connect sustainability with culture and lifestyle branding. The continued integration of sustainability, performance, personalization, and cultural collaboration is expected to strengthen premiumization and increase repeat purchases, particularly among younger, design-conscious, and wellness-oriented consumers.
Global Drinkware Market Dynamics
Key Market Driver: Expanding Demand for Reusable and Health-Focused Hydration Products
The market is primarily driven by rising awareness of hydration, health, sustainability, and the environmental impact of disposable beverage containers. Consumers increasingly choose reusable water bottles, tumblers, mugs, and travel cups for work, education, exercise, commuting, outdoor recreation, and home use. Durable products made from stainless steel, glass, ceramic, and BPA-free polymers offer a practical combination of portability, temperature control, safety, and long service life. Growth is reinforced by the expansion of beverage consumption and foodservice. The U.S. restaurant and foodservice industry was forecast to reach USD 1.5 trillion in sales in 2025, while the British Soft Drinks Association reported that U.K. soft-drink volume sales increased 1.7% in 2024 and value sales reached GBP 22.3 billion. These large beverage-serving ecosystems create recurring demand for household, hospitality, takeaway, and branded drinkware. For instance, YETI reported that drinkware net sales increased 6% in the fourth quarter of 2025, while international net sales increased 25%. The result demonstrates sustained consumer demand for premium reusable drinkware and the ability of established brands to expand through product innovation, international distribution, and multi-channel retail. As hydration becomes a daily wellness priority and reusable products gain wider acceptance, demand is expected to remain steady across households, commercial foodservice, travel, sports, education, and workplace environments.
Key Restraint/Challenge: Intensifying Price Competition and Raw-Material Cost Pressure
A major challenge is the drinkware suppliers face strong competition from local, unbranded, and low-cost alternatives that provide similar short-term functionality. Premium brands must justify higher prices through insulation performance, leak resistance, durability, material safety, warranty support, design, and brand trust. Frequent color and collection changes can also shorten perceived product life cycles and increase inventory risk for retailers and manufacturers. Costs for stainless steel, glass, polymers, packaging, freight, and energy can change because of supply-chain disruptions, tariffs, exchange rates, and geopolitical conditions. These pressures are especially important for brands with global sourcing networks and products manufactured across several countries. Price-sensitive consumers may delay replacement purchases or shift to basic alternatives when retail prices increase. For instance, YETI stated that its fourth-quarter 2025 adjusted earnings included an unfavorable USD 0.15 per-share impact from higher tariff costs, while full-year adjusted earnings included a USD 0.35 unfavorable impact. The company also highlighted ongoing supply-chain diversification, showing how tariffs and production-location decisions can affect profitability even when drinkware demand remains positive. Price competition and input-cost volatility are expected to remain important restraints, encouraging suppliers to strengthen sourcing flexibility, manage inventory carefully, improve product durability, and communicate clear value to consumers.
Key Market Opportunity: Expanding Metal Drinkware and Direct-to-Consumer E-Commerce
The strongest near-term opportunity lies in insulated metal bottles, tumblers, travel mugs, and fitness products that combine durability, temperature retention, portability, and reusable design. Metal drinkware is the fastest-growing global material segment in the latest public benchmark, while tumblers are projected to grow strongly in the largest regional market. Larger capacities, integrated handles, straw lids, modular accessories, and dual-intake systems are widening usage occasions. Online and direct-to-consumer channels offer further opportunity through broad assortment, product reviews, customization, limited-edition drops, subscription or loyalty programs, and international access. The initiative combines premium metal drinkware with circularity, consumer engagement, and repeat-purchase incentives, demonstrating how sustainability can become a commercial differentiator. Manufacturers that combine metal performance, recycled materials, design innovation, personalization, and strong digital distribution are expected to capture attractive growth opportunities during the forecast period.
Drinkware Market Scope
The global drinkware market is segmented on the basis of product, material, application, and distribution channel.
- By Product
On the basis of product, the global drinkware market is segmented into bottles, wine glass, beer glass, coffee mugs and teacups, everyday glass, cocktail glass, spirit glass, and others. The Bottles segment dominated the market with a 39.65% revenue share in 2025, driven by the growing demand for reusable, insulated, and sustainable hydration products across residential, commercial, and outdoor applications. Rising consumer preference for on-the-go beverages, increasing environmental awareness, and continuous product innovations in vacuum insulation and premium materials have further strengthened the segment's leadership.
The Coffee Mugs and Teacups segment is projected to register the fastest growth during the forecast period of 2026 to 2033, supported by expanding café culture, rising home consumption of coffee and tea, and increasing demand for aesthetically designed and personalized drinkware. The growing popularity of premium ceramic mugs, specialty beverages, and gifting trends is expected to further accelerate market growth.
- By Material
On the basis of material, the global drinkware market is segmented into polymer, metal, glass, silicone, ceramic, plastic, bone china, and porcelain/stoneware. The glass segment accounted for the largest market share in 2025, owing to its premium appearance, recyclability, chemical inertness, and widespread use across households, restaurants, bars, and the hospitality sector. Glass drinkware continues to be preferred for serving alcoholic beverages, juices, and premium drinks due to its transparency and ability to preserve beverage taste.
The metal segment is anticipated to witness the fastest CAGR from 2026 to 2033, driven by increasing demand for stainless steel insulated bottles and tumblers, rising outdoor and travel activities, and the growing shift toward durable, reusable alternatives to single-use plastics.
- By Application
On the basis of application, the global drinkware market is segmented into domestic and commercial. The Domestic segment held the largest market share in 2025, driven by increasing household consumption of reusable drinkware, growing health consciousness, and rising adoption of premium kitchenware products. Consumers are increasingly investing in durable and aesthetically appealing drinkware for everyday hydration and home dining experiences.
The commercial segment is expected to register the fastest growth during the forecast period of 2026 to 2033, supported by the expansion of the hospitality, foodservice, café, and quick-service restaurant industries, along with increasing demand for premium and customized drinkware in hotels, restaurants, and corporate settings.
- By Distribution Channel
On the basis of distribution channel, the global drinkware market is segmented into supermarket, independent stores, and e-commerce. The Supermarket segment dominated the market in 2025, owing to its wide product assortment, attractive promotional offers, and the convenience of one-stop shopping. Consumers continue to prefer supermarkets for evaluating product quality, design, and pricing before purchase.
The e-commerce segment is projected to witness the fastest growth from 2026 to 2033, driven by increasing internet penetration, rising smartphone usage, expanding digital payment adoption, and the availability of extensive product choices, competitive pricing, customer reviews, and direct-to-consumer brand offerings. Growing online retail platforms and personalized shopping experiences are expected to further support segment growth.
Drinkware Market Regional Analysis
North America dominated the global drinkware market and accounted for the largest revenue share of 30.71% in 2025, driven by strong consumer preference for reusable and insulated drinkware, high household and foodservice consumption, and widespread participation in outdoor and recreational activities. The presence of leading premium drinkware brands, well-established retail networks, and rapidly expanding direct-to-consumer sales channels further supports the region’s market leadership.
U.S. Drinkware Market Insight
The U.S. drinkware market is experiencing steady growth, supported by strong consumer demand for reusable, insulated, and sustainable drinkware products. Increasing health and wellness awareness, rising participation in outdoor recreation, and the growing popularity of on-the-go beverage consumption are driving product adoption. In addition, the presence of established premium brands, expanding e-commerce channels, and continuous product innovation in vacuum-insulated bottles, tumblers, and travel mugs continue to strengthen the U.S. market.
Canada Drinkware Market Insight
The Canada drinkware market is expanding steadily due to increasing consumer preference for eco-friendly and reusable beverage containers, supported by growing sustainability initiatives and government efforts to reduce single-use plastics. Rising outdoor and recreational activities, coupled with increasing demand for premium insulated drinkware for both hot and cold beverages, are contributing to market growth. Furthermore, expanding retail availability and growing online sales are enhancing product accessibility across the country.
Asia-Pacific Drinkware Market Insight
The Asia-Pacific drinkware market is expected to witness rapid growth, driven by increasing urbanization, rising disposable incomes, and changing consumer lifestyles. Growing demand for reusable drinkware, expanding café culture, and increasing adoption of premium hydration products are supporting regional market expansion. Additionally, the region’s strong manufacturing capabilities, rapid growth of organized retail, and expanding e-commerce ecosystem are accelerating market development across major economies.
Japan Drinkware Market Insight
The Japan drinkware market is witnessing consistent growth owing to high consumer preference for premium-quality, durable, and insulated drinkware products. Increasing demand for portable beverage containers, strong convenience store culture, and growing environmental awareness are encouraging the adoption of reusable bottles and tumblers. Product innovation, advanced manufacturing capabilities, and the popularity of compact, aesthetically designed drinkware continue to support market growth.
China Drinkware Market Insight
The China drinkware market is growing rapidly, driven by rising urbanization, increasing disposable income, and expanding middle-class consumption. Growing awareness regarding sustainability, increasing preference for reusable bottles and insulated tumblers, and rapid expansion of e-commerce platforms are significantly boosting product demand. In addition, China's strong manufacturing ecosystem, continuous product innovation, and growing café and foodservice industries are positioning the country as one of the fastest-growing drinkware markets globally.
Drinkware Market Share
The drinkware market is established by well known companies:
- YETI Holdings, Inc. (U.S.)
- Zhejiang Haers Vacuum Containers Co., Ltd. (China)
- Libbey Inc. (U.S.)
- CamelBak Products, LLC (U.S.)
- Trove Brands / Owala (U.S.)
- Thermos L.L.C. (U.S.)
- Klean Kanteen, Inc. (U.S.)
- Williams-Sonoma, Inc. (U.S.)
- Tervis Tumbler Company (U.S.)
- Bormioli Rocco S.p.A. (Italy)
- Pasabahce (Turkey)
- Dometic Group AB (Sweden)
Latest Developments in Drinkware Market
- In June 2026, Hydro Flask and Universal Music Group announced a global partnership to promote reusable drinkware across recording studios, songwriting sessions, live events, and artist experiences. The program aims to eliminate more than 10,000 single-use drinks in its first year, distribute over 2,000 reusable bottles, and develop limited artist- and studio-inspired products, strengthening the connection between sustainability, culture, and lifestyle drinkware.
- In May 2026, Stanley 1913 reported that 81% of its stainless-steel units produced in 2025 contained recycled stainless steel, exceeding its earlier material target. The company also expanded its Take Back program, which enables consumers to return eligible products for recycling, demonstrating how recycled materials and product recovery are becoming important competitive strategies in premium reusable drinkware.
- In February 2026, YETI Holdings reported that drinkware net sales increased 6% in the fourth quarter of 2025, supported by strong international growth. The company also provided a 2026 outlook focused on innovation, international expansion, and continued investment, indicating sustained commercial demand for premium insulated bottles, tumblers, mugs, and related hydration products.
SKU-

- Interactive Data Analysis Dashboard
- Company Analysis Dashboard for high growth potential opportunities
- Research Analyst Access for customization & queries
- Competitor Analysis with Interactive dashboard
- Latest News, Updates & Trend analysis
- Harness the Power of Benchmark Analysis for Comprehensive Competitor Tracking
Data collection and base year analysis are done using data collection modules with large sample sizes. The stage includes obtaining market information or related data through various sources and strategies. It includes examining and planning all the data acquired from the past in advance. It likewise envelops the examination of information inconsistencies seen across different information sources. The market data is analysed and estimated using market statistical and coherent models. Also, market share analysis and key trend analysis are the major success factors in the market report. To know more, please request an analyst call or drop down your inquiry.
The key research methodology used by DBMR research team is data triangulation which involves data mining, analysis of the impact of data variables on the market and primary (industry expert) validation. Data models include Vendor Positioning Grid, Market Time Line Analysis, Market Overview and Guide, Company Positioning Grid, Patent Analysis, Pricing Analysis, Company Market Share Analysis, Standards of Measurement, Global versus Regional and Vendor Share Analysis. To know more about the research methodology, drop in an inquiry to speak to our industry experts.
Data Bridge Market Research is a leader in advanced formative research. We take pride in servicing our existing and new customers with data and analysis that match and suits their goal. The report can be customized to include price trend analysis of target brands understanding the market for additional countries (ask for the list of countries), clinical trial results data, literature review, refurbished market and product base analysis. Market analysis of target competitors can be analyzed from technology-based analysis to market portfolio strategies. We can add as many competitors that you require data about in the format and data style you are looking for. Our team of analysts can also provide you data in crude raw excel files pivot tables (Fact book) or can assist you in creating presentations from the data sets available in the report.


