Marché mondial de la gestion du transport de marchandises, par mode de transport (routes, chemins de fer, voies maritimes et aériennes), offre (solutions et services), mode de déploiement (cloud ou hébergé et sur site), taille de l'organisation (grandes entreprises et PME), industrie (fabrication, vente au détail et commerce électronique, transport, biens de consommation à évolution rapide (FMCG), soins de santé, alimentation et boissons, pétrole et gaz, énergie et services publics, électronique, automobile, informatique et télécommunications et autres) - Tendances et prévisions de l'industrie jusqu'en 2029.
Quelle est la taille et l'aperçu du marché de la gestion du transport de marchandises
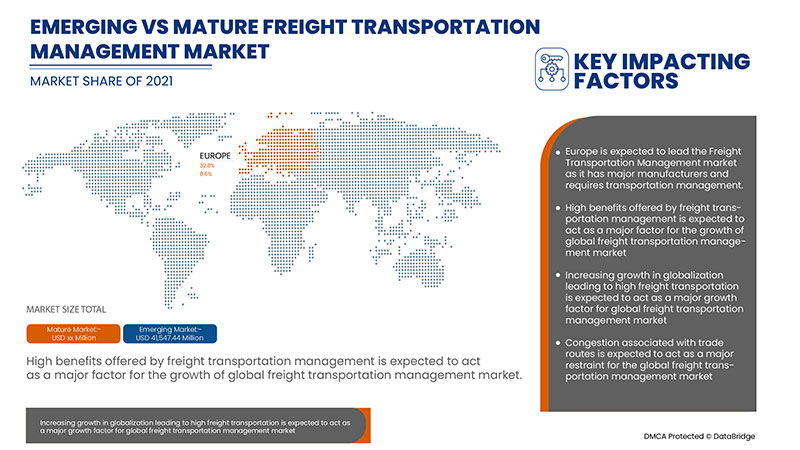
Conformément à l'analyse de marché de Data Bridge, le marché mondial de la gestion du transport de marchandises intègre diverses stratégies pour accroître l'efficacité du fret et du transport commercial. La gestion du transport de marchandises vise à réduire les coûts des chargeurs tout en tenant compte des coûts sociaux tels que la congestion ou les effets de la pollution. Les avantages élevés offerts par la gestion du transport de marchandises font augmenter la demande de solutions de gestion du transport de marchandises sur le marché. Le marché mondial de la gestion du transport de marchandises connaît une croissance rapide en raison de la mondialisation croissante qui entraîne un transport de marchandises élevé. Les entreprises lancent même de nouveaux produits pour gagner une part de marché plus importante.
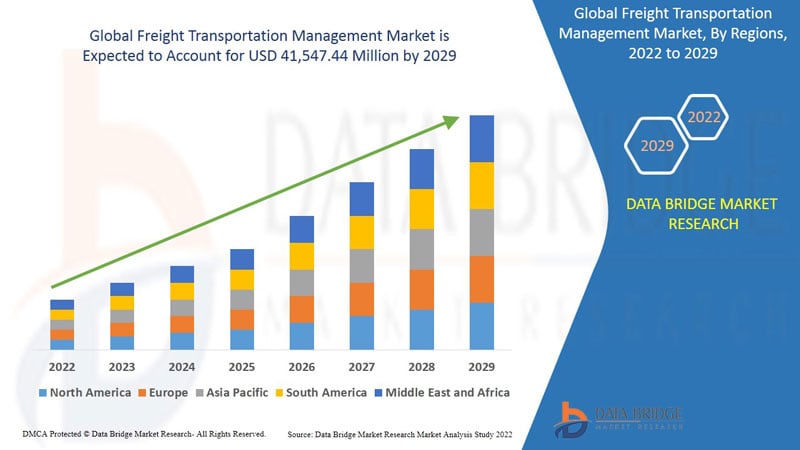
Data Bridge Market Research analyse que le marché de la gestion du transport de marchandises devrait atteindre la valeur de 41 547,44 millions de dollars d'ici 2029, soit un TCAC de 8,1 % au cours de la période de prévision. Les « routes » représentent le segment de transport le plus important du marché de la gestion du transport de marchandises. Le rapport sur le marché du transport de marchandises porte également sur l'analyse des prix, l'analyse des brevets et les progrès technologiques.
Taille du marché et prévisions
- Valeur marchande mondiale (2025):41 547,44 millions de dollars
- Prévisions CAGR (2026-2033): 8.1%
|
Rapport métrique |
Gestion du transport de marchandises Aperçu clé du marché |
|
Période de prévision |
2022 à 2029 |
|
Année de référence |
2021 |
|
Années historiques |
2020 |
|
Unités quantitatives |
Millions de dollars |
|
Segments couverts |
Par mode de transport (routes, chemins de fer, maritimes et aériens), par offre (solutions et services), par mode de déploiement (cloud ou hébergé et sur place), par taille de l'organisation (grandes entreprises et PME), par industrie (fabrication, vente au détail et commerce électronique, transport, biens de consommation en mouvement rapide (FMCG), santé, aliments et boissons, pétrole et gaz, énergie et services publics, électronique, automobile, TI et télécommunications et autres) |
|
Pays couverts |
États-Unis, Canada et Mexique en Amérique du Nord, Allemagne, France, Royaume-Uni, Pays-Bas, Suisse, Belgique, Russie, Italie, Espagne, Turquie, Reste de l'Europe en Europe, Chine, Japon, Inde, Corée du Sud, Singapour, Malaisie, Australie, Thaïlande, Indonésie, Philippines, Reste de l'Asie-Pacifique (APAC), Arabie saoudite, États-Unis, Afrique du Sud, Égypte, Israël, Reste du Moyen-Orient et Afrique (MEA), Brésil, Argentine et Reste de l'Amérique du Sud en Amérique du Sud. |
|
Acteurs du marché couverts |
CTSI-GLOBAL, GEODIS, THE DESCARTES SYSTEMS GROUP INC, Manhattan Associates, Transplace, Softeon, GlobalTranz, Oracle, SAP SE, Accenture, Blue Yonder Group, Inc., E2open, LLC., Trimble Inc., DSV, Werner Enterprises, Supply Chain Solutions, C.H. Robinson Worldwide, Inc., TRANSPOREON GmbH, MercuryGate, entre autres |
Définition du marché
La gestion du transport de marchandises comporte diverses stratégies visant à accroître l'efficacité du transport de marchandises et du transport commercial. La gestion du transport de marchandises vise à réduire les coûts des chargeurs tout en tenant compte des coûts sociaux tels que la congestion ou les effets de la pollution. Il aide les expéditeurs à utiliser le bon mode de transport. Par exemple, le transport ferroviaire et le transport par eau sont très efficaces sur de longues distances par rapport à l'utilisation de camions pour la même raison. Il aide à améliorer l'itinéraire et l'horaire afin d'augmenter les facteurs de charge et de réduire le kilométrage des véhicules de fret. Il aide à mettre en oeuvre des programmes de gestion du parc automobile qui aident à utiliser des véhicules de taille optimale pour chaque voyage, à réduire le kilométrage des véhicules et à s'assurer que les véhicules du parc automobile sont exploités et entretenus de manière à réduire les coûts externes.
La gestion du transport de marchandises est utilisée pour divers modes de transport tels que les routes, les chemins de fer, les voies maritimes et aériennes. Le transport de marchandises à travers le chemin de fer est appelé sous le segment. Il s'agit du mode de transport le plus courant puisqu'il nécessite un seul document douanier. Le mode de transport ferroviaire est très économe en carburant et peut être qualifié de mode de transport « vert ». Les expéditions maritimes servent au transport de marchandises en vrac comme le charbon, les produits agricoles, le minerai de fer et les produits en vrac humides comme le pétrole brut et le gaz. Les compagnies aériennes sont le mode de transport le plus rapide et sont très utilisées pour assurer la reconstitution des stocks « juste à temps ».
Gestion du transport de marchandises Dynamique du marché
Cette section traite de la compréhension des facteurs du marché, des avantages, des possibilités, des restrictions et des défis. Tout cela est examiné en détail comme suit:
- Avantages élevés offerts par la gestion du transport de marchandises
Au fil des ans, il est devenu extrêmement nécessaire d'avoir une chaîne d'approvisionnement très efficace. Cette exigence est remplie par la gestion du transport de marchandises. Le système de gestion du transport de marchandises aide les entreprises à déplacer les produits d'une destination à l'autre de façon rentable, fiable et efficace. Le système offre une meilleure visibilité et une meilleure analyse des données, ce qui accroît la croissance du marché mondial de la gestion du transport de marchandises.
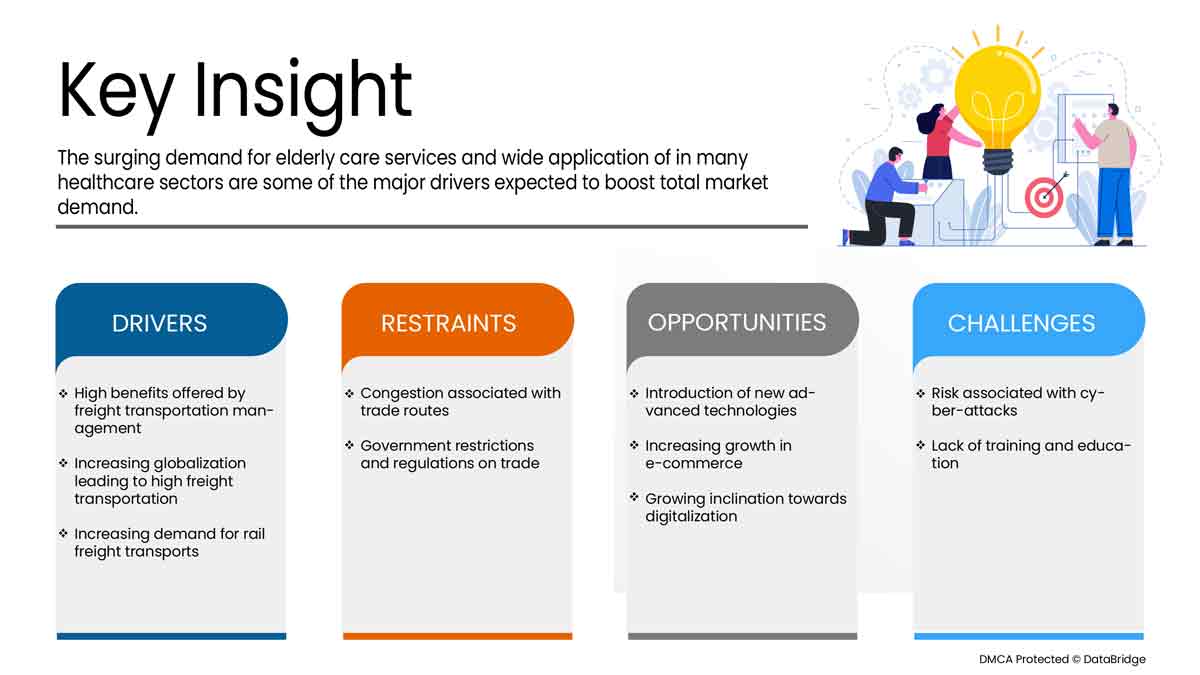
- Augmentation de la demande de transport ferroviaire de marchandises
Le transport ferroviaire de marchandises utilise le chemin de fer pour le transport terrestre de marchandises. Il est utilisé pour le transport de diverses marchandises telles que les produits chimiques, les matières premières de construction, l'agriculture, l'automobile, l'énergie (charbon, pétrole et éolienne) et les productions forestières. Les chemins de fer peuvent transporter des marchandises lourdes rapidement par les chemins de fer. Les chemins de fer sont l'une des formes de transport les plus utilisées et disposent d'une infrastructure énorme dans le monde entier. L'utilisation croissante des chemins de fer pour le transport augmente la gestion du transport de marchandises pour la gestion du transport de marchandises par chemin de fer.
- Haute utilisation de la gestion du transport de marchandises dans les routes
La numérisation s'est développée dans diverses industries et a donné naissance au commerce électronique. La croissance du commerce électronique a rendu nécessaire pour les entreprises de rendre leur chaîne d'approvisionnement très efficace, de réduire le temps de transit et de fournir les produits aux clients sans délai. Cela a accru le flux des transports intérieurs par les routes, et un grand nombre de camions sont utilisés pour la même raison. La croissance croissante de la technologie des routes accroît la croissance du marché mondial du transport de marchandises.
- Congestion associée aux routes commerciales
À mesure que les volumes de trafic et les embouteillages augmentent sur les routes et les voies navigables, les opérateurs de services de fret et de transport sont de plus en plus confrontés à des défis pour maintenir des horaires fiables. Cela affecte les chaînes d'approvisionnement et les entreprises dépendantes des camions, qui sont de plus en plus importantes pour la couverture publique et les exploitants de régions privées. De plus, plusieurs accidents sur les routes ou déversements de pétrole en mer peuvent constituer un défi inattendu pour les systèmes de transport, ce qui rend difficile la gestion du système. Le récent COVID-19 a également interrompu plusieurs opérations logistiques causant de graves dommages à l'ensemble des opérations de la chaîne d'approvisionnement. Ces paramètres constituent un frein majeur à la croissance du marché mondial du transport de marchandises.
- Restrictions et réglementation gouvernementales sur le commerce
Le commerce international a connu plusieurs restrictions et changements de réglementation en raison de la guerre commerciale américaine et chinoise et de la pandémie de COVID-19. Le transport transfrontalier est limité, et les coûts augmentent, qui ne sont pas en mesure de prévoir par le système de gestion des transports et entraînent une inefficacité dans la chaîne d'approvisionnement et les stocks, ce qui constitue une contrainte majeure pour le marché mondial du transport de marchandises.
Après COVID-19 Impact sur le marché de la gestion du transport de marchandises
COVID-19 a eu un impact majeur sur le marché de la gestion du transport de marchandises puisque presque tous les pays ont opté pour l'arrêt de toutes les installations de production, sauf celles qui traitent de la production des marchandises essentielles. Le gouvernement a pris des mesures strictes comme l'arrêt de la production et de la vente de biens non essentiels, le blocage du commerce international et bien d'autres pour empêcher la propagation de COVID-19. La seule entreprise qui fait face à cette pandémie est les services essentiels qui sont autorisés à ouvrir et à gérer les processus.
La croissance du marché de la gestion du transport de marchandises augmente en raison des politiques gouvernementales visant à stimuler le commerce international. Les avantages offerts par la gestion du transport de marchandises pour optimiser les coûts et les débits augmentent également la demande de gestion du transport de marchandises sur le marché. Toutefois, des facteurs tels que la congestion liée aux itinéraires commerciaux et les restrictions commerciales entre certains pays freinent la croissance du marché. La fermeture des installations de production pendant la pandémie a eu un impact significatif sur le marché.
Les fabricants prennent diverses décisions stratégiques pour rebondir après COVID-19. Les intervenants mènent de multiples activités de recherche-développement pour améliorer la technologie de gestion du transport de marchandises. Avec cela, les entreprises apporteront des solutions avancées et précises au marché. De plus, les initiatives gouvernementales visant à stimuler le commerce international ont entraîné la croissance du marché.
Développement récent
- En mars 2021, SAP SE a annoncé son partenariat avec Sedna Systems. Dans le cadre de ce partenariat, les entreprises intégreront SAP TMS avec la collaboration de l'équipe de Sedna Systems et la solution de gestion du courrier électronique, ce qui peut aider les clients à acquérir un contrôle complet sur les données liées à la gestion des transports. Ainsi, l'entreprise pourra consolider sa position sur le marché.
- En février 2022, Oracle a annoncé l'introduction de nouvelles capacités de gestion logistique dans Oracle Fusion Cloud Supply Chain & Manufacturing (SCM). La société a mis à jour son Oracle Fusion Cloud Transportation Management qui peut aider les organisations à réduire les coûts et les risques, à améliorer l'expérience client et à s'adapter aux perturbations commerciales. Ainsi, l'entreprise pourra attirer plus de clients sur le marché.
Portée du marché mondial du transport de marchandises
Le marché de la gestion du transport de marchandises est segmenté par mode de transport, par mode de déploiement, par taille d'organisation et par industrie. La croissance de ces segments vous aidera à analyser des segments de croissance médiocres dans les industries et à fournir aux utilisateurs une vue d'ensemble du marché et des perspectives de marché précieuses pour les aider à prendre des décisions stratégiques pour identifier les applications du marché central.
Par mode de transport
- Voies routières
- Chemins de fer
- Marine
- Voies aériennes
Sur la base du mode de transport, le marché mondial de la gestion du transport de marchandises est segmenté en routes, chemins de fer, maritimes et aériennes.
En offrant
- Solutions
- Services
Sur la base de l'offre, le marché mondial de la gestion du transport de marchandises a été segmenté en solutions et services.
Par mode de déploiement
- Nuage ou hébergé
- Sur le site
Sur la base du mode de déploiement, le marché mondial de la gestion du transport de marchandises a été segmenté en cloud ou hébergé et sur place.
Selon la taille de l'organisation
- Grandes entreprises
- PME
Compte tenu de la taille de l'organisation, le marché mondial du transport de marchandises a été segmenté en grandes entreprises et en PME.
Par industrie
- Industrie manufacturière
- Commerce de détail et commerce électronique
- Transports
- Biens de consommation en mouvement rapide (FMCG)
- Santé
- Aliments et boissons
- Pétrole et gaz
- Énergie et services publics
- Électronique
- Automobile
- Il & Télécom
- Autres
![]()
Sur la base de l'industrie, le marché mondial du transport de marchandises a été segmenté dans la fabrication, la vente au détail et le commerce électronique, le transport, les biens de consommation en mouvement rapide (FMCG), les soins de santé, l'alimentation et les boissons, le pétrole et le gaz, l'énergie et les services publics, l'électronique, l'automobile, l'informatique et les télécommunications et autres.
Gestion du transport de marchandises Marché Analyse/observations régionales
Le marché de la gestion du transport de marchandises est analysé et la taille du marché est présentée par pays, mode de transport, mode d'offre, mode de déploiement, taille de l'organisation et industrie, comme indiqué ci-dessus.
Les pays couverts par le rapport sur le marché du transport de marchandises sont les suivants: États-Unis, Canada et Mexique en Amérique du Nord, Allemagne, France, Royaume-Uni, Pays-Bas, Suisse, Belgique, Russie, Italie, Espagne, Turquie, Reste de l'Europe en Europe, Chine, Japon, Inde, Corée du Sud, Singapour, Malaisie, Australie, Thaïlande, Indonésie, Philippines, Reste de l'Asie-Pacifique (APAC), Arabie saoudite, États-Unis d'Amérique, Afrique du Sud, Égypte, Israël, Reste du Moyen-Orient et Afrique (MEA), Brésil, Argentine et Reste de l'Amérique du Sud en Amérique du Sud.
L'Europe domine le marché de la gestion du transport de marchandises L'Europe devrait être le marché mondial de la gestion du transport de marchandises qui connaît la croissance la plus rapide. LesGestion européenne du transport de marchandisesLe marché devrait connaître la croissance la plus rapide au monde. L'Europe a les lignes de transport mondiales passant par la région, l'Allemagne dominant la région avec une part de 22,74 %. L'Europe étant la plaque tournante des grands acteurs et des entreprises manufacturières, elle a besoin d'une grande gestion des transports dans la région.
La section de pays du rapport présente également des facteurs d'impact individuels sur le marché et des changements dans la réglementation du marché qui influent sur les tendances actuelles et futures du marché. Des points de données comme l'analyse de la chaîne de valeur en aval et en amont, les tendances techniques et l'analyse des cinq forces du porteur, des études de cas sont quelques-uns des indicateurs utilisés pour prévoir le scénario du marché pour chaque pays. En outre, la présence et la disponibilité des marques mondiales et les difficultés qu ' elles rencontrent en raison de la concurrence importante ou rare des marques locales et nationales, l ' impact des tarifs intérieurs et des itinéraires commerciaux sont pris en compte tout en fournissant une analyse prévisionnelle des données nationales.
Analyse des parts de marché de la gestion du paysage et du transport de marchandises
Le paysage concurrentiel du marché du transport de marchandises fournit des détails par concurrent. Les détails inclus sont l'aperçu de l'entreprise, les finances de l'entreprise, les revenus générés, le potentiel du marché, les investissements dans la recherche et le développement, les nouvelles initiatives du marché, la présence mondiale, les sites et installations de production, les capacités de production, les forces et faiblesses de l'entreprise, le lancement de produits, la largeur et l'étendue du produit, la domination de l'application. Les points de données ci-dessus fournis ne sont liés qu'à l'importance accordée par les compagnies au marché de la gestion du transport de marchandises.
Voici quelques-uns des principaux acteurs du marché de la gestion du transport de marchandises :CTI-GLOBAL,GÉODIS,LE GROUPE DES SYSTÈMES DESCARTES INC, Manhattan Associés, Transplace, Softeon, GlobalTranz, Oracle, SAP SE,Accenture, Groupe Yonder Bleu,Inc., E2open, LLC, Trimble Inc., DSV, Werner Enterprises, Supply Chain Solutions,C.H. Robinson dans le monde, Inc., TRANSPOREON GmbH, MercuryGate.
SKU-
Accédez en ligne au rapport sur le premier cloud mondial de veille économique

- Tableau de bord d'analyse de données interactif
- Tableau de bord d'analyse d'entreprise pour les opportunités à fort potentiel de croissance
- Accès d'analyste de recherche pour la personnalisation et les requêtes
- Analyse de la concurrence avec tableau de bord interactif
- Dernières actualités, mises à jour et analyse des tendances
- Exploitez la puissance de l'analyse comparative pour un suivi complet de la concurrence
Table des matières
- INTRODUCTION
- OBJECTIVES OF THE STUDY
- MARKET DEFINITION
- OVERVIEW OF GLOBAL FREIGHT TRANSPORTATION MANAGEMENT MARKET
- CURRENCY AND PRICING
- LIMITATIONS
- MARKETS COVERED
- MARKET SEGMENTATION
- MARKETS COVERED
- GEOGRAPHICAL SCOPE
- YEARS CONSIDERED FOR THE STUDY
- DBMR TRIPOD DATA VALIDATION MODEL
- PRIMARY INTERVIEWS WITH KEY OPINION LEADERS
- DBMR MARKET POSITION GRID
- VENDOR SHARE ANALYSIS
- MULTIVARIATE MODELING
- TRANSPORTATION MODETIMELINE CURVE
- MARKET INDUSTRY COVERAGE GRID
- SECONDARY SOURCES
- ASSUMPTIONS
- EXECUTIVE SUMMARY
- PREMIUM INSIGHTS
- MARKET OVERVIEW
- DRIVERS
- INCREASING GROWTH IN GLOBALIZATION LEADING TO HIGH FREIGHT TRANSPORTATION
- HIGH BENEFITS OFFERED BY FREIGHT TRANSPORTATION MANAGEMENT
- SURGING DEMAND FOR RAIL FREIGHT TRANSPORTS
- INCREASING GROWTH OF LOGISTICS THROUGH AIRWAYS AND WATER WAYS
- HIGH USE OF FREIGHT TRANSPORTATION MANAGEMENT IN ROADWAYS
- RESTRAINTS
- CONGESTION ASSOCIATED WITH TRADE ROUTES
- SEVERAL GOVERNMENT REGULATIONS AND RESTRICTIONS
- OPPORTUNITIES
- GROWING INCLINATION TOWARDS DIGITALIZATION
- INCREASING GROWTH IN E-COMMERCE
- INCREASING USE OF GREEN FREIGHT
- EMERGENCE OF NEW ADVANCED TECHNOLOGIES
- CHALLENGES
- LACK OF TRAINING AND EDUCATION
- RISK ASSOCIATED WITH CYBER-ATTACKS
- LACK OF DIGITAL LITERACY IN VARIOUS REGIONS
- COVID-19 IMPACT ON GLOBAL FREIGHT TRANSPORTATION MANAGEMENT MARKET IN INFORMATION & COMMUNICATION TECHNOLOGY
- ANALYSIS ON IMPACT OF COVID-19 ON THE MARKET
- AFTERMATH OF COVID-19 AND GOVERNMENT INITIATIVE TO BOOST THE MARKET
- STRATEGIC DECISIONS FOR MANUFACTURERS AFTER COVID-19 TO GAIN COMPETITIVE MARKET SHARE
- IMPACT ON DEMAND
- IMPACT ON SUPPLY CHAIN
- CONCLUSION
- GLOBAL FREIGHT TRANSPORTATION MANAGEMENT MARKET, BY TRANSPORTATION MODE
- OVERVIEW
- ROADWAYS
- RAILWAYS
- MARINE
- AIRWAYS
- GLOBAL FREIGHT TRANSPORTATION MANAGEMENT MARKET, BY OFFERING
- OVERVIEW
- SOLUTIONS
- FREIGHT 3PL SOLUTIONS
- CROSS DOCK OPERATION
- LOAD OPTIMIZATION PLATFORM
- FREIGHT ORDER MANAGEMENT
- BROKERAGE OPERATIONAL MANAGEMENT
- BUSINESS INTELLIGENCE SOLUTION
- OTHERS
- FREIGHT TRANSPORTATION COST MANAGEMENT SYSTEM
- FREIGHT MOBILITY SOLUTION
- GPS
- RFID
- FREIGHT SECURITY SOLUTIONS
- CARGO TRACKING
- INTRUSION DETECTION
- VIDEO SURVEILLANCE
- FREIGHT INFORMATION MANAGEMENT SYSTEM
- FLEET TRACKING SOLUTION
- FLEET MAINTENANCE SOLUTION
- FREIGHT OPERATION MANAGEMENT SOLUTION
- AUDIT AND PAYMENT SOLUTION
- SUPPLIER AND VENDOR MANAGEMENT
- CRM
- OTHERS
- WAREHOUSE MANAGEMENT SYSTEM
- SERVICES
- INTEGRATION SERVICES
- MANAGED SERVICES
- BUSINESS SERVICES
- GLOBAL FREIGHT TRANSPORTATION MANAGEMENT MARKET, BY DEPLOYMENT MODE
- OVERVIEW
- CLOUD OR HOSTED
- SUBSCRIPTION BASED
- TRANSACTION BASED
- ON PREMISE
- GLOBAL FREIGHT TRANSPORTATION MANAGEMENT MARKET, BY ORGANIZATION SIZE
- OVERVIEW
- LARGE ENTERPRISES
- SME'S
- GLOBAL FREIGHT TRANSPORTATION MANAGEMENT MARKET, BY INDUSTRY
- OVERVIEW
- MANUFACTURING
- RETAIL & E-COMMERCE
- TRANSPORTATION
- FAST MOVING CONSUMER GOODS (FMCG)
- HEALTHCARE
- FOOD & BEVERAGES
- OIL & GAS
- ENERGY & UTILITY
- ELECTRONICS
- AUTOMOTIVE
- IT & TELECOM
- OTHERS
- GLOBAL FREIGHT TRANSPORTATION MANAGEMENT MARKET, BY GEOGRAPHY
- OVERVIEW
- NORTH AMERICA
- U.S.
- CANADA
- MEXICO
- EUROPE
- GERMANY
- FRANCE
- ITALY
- U.K.
- SPAIN
- NETHERLANDS
- SWITZERLAND
- BELGIUM
- RUSSIA
- TURKEY
- REST OF EUROPE
- ASIA-PACIFIC
- CHINA
- JAPAN
- INDIA
- SOUTH KOREA
- AUSTRALIA
- INDONESIA
- SINGAPORE
- THAILAND
- MALAYSIA
- PHILIPPINES
- REST OF ASIA-PACIFIC
- MIDDLE EAST & AFRICA
- SAUDI ARABIA
- U.A.E
- SOUTH AFRICA
- EGYPT
- ISRAEL
- REST OF MIDDLE EAST & AFRICA
- SOUTH AMERICA
- BRAZIL
- ARGENTINA
- REST OF SOUTH AMERICA
- GLOBAL FREIGHT TRANSPORTATION MANAGEMENT MARKET, COMPANY LANDSCAPE
- COMPANY SHARE ANALYSIS: GLOBAL
- COMPANY SHARE ANALYSIS: NORTH AMERICA
- COMPANY SHARE ANALYSIS: EUROPE
- COMPANY SHARE ANALYSIS: ASIA-PACIFIC
- SWOT ANALYSIS
- COMPANY PROFILE
- SAP SE
- COMPANY SNAPSHOT
- REVENUE ANALYSIS
- PRODUCT PORTFOLIO
- RECENT DEVELOPMENTS
- ORACLE
- COMPANY SNAPSHOT
- REVENUE ANALYSIS
- APPLICATION PORTFOLIO
- RECENT DEVELOPMENTS
- C.H. ROBINSON WORLDWIDE, INC.
- COMPANY SNAPSHOT
- REVENUE ANALYSIS
- PRODUCT PORTFOLIO
- RECENT DEVELOPMENTS
- ACCENTURE
- COMPANY SNAPSHOT
- REVENUE ANALYSIS
- PRODUCT PORTFOLIO
- RECENT DEVELOPMENTS
- GEODIS
- COMPANY SNAPSHOT
- PRODUCT PORTFOLIO
- RECENT DEVELOPMENTS
- WERNER ENTERPRISES
- COMPANY SNAPSHOT
- REVENUE ANALYSIS
- PRODUCT PORTFOLIO
- RECENT DEVELOPMENT
- BLUE YONDER GROUP, INC.
- COMPANY SNAPSHOT
- PRODUCT PORTFOLIO
- RECENT DEVELOPMENTS
- BLUJAY SOLUTIONS LTD.
- COMPANY SNAPSHOT
- PRODUCT PORTFOLIO
- RECENT DEVELOPMENTS
- TRANSPOREON GMBH
- COMPANY SNAPSHOT
- PLATFORM PORTFOLIO
- RECENT DEVELOPMENTS
- MANHATTAN ASSOCIATES
- COMPANY SNAPSHOT
- REVENUE ANALYSIS
- SOLUTION PORTFOLIO
- RECENT DEVELOPMENT
- CTSI-GLOBAL
- COMPANY SNAPSHOT
- PRODUCT PORTFOLIO
- RECENT DEVELOPMENT
- 3GTMS
- COMPANY SNAPSHOT
- PLATFORM PORTFOLIO
- RECENT DEVELOPMENTS
- CLOUD LOGISTICS
- COMPANY SNAPSHOT
- PRODUCT PORTFOLIO
- RECENT DEVELOPMENT
- GLOBALTRANZ
- COMPANY SNAPSHOT
- PRODUCT PORTFOLIO
- RECENT DEVELOPMENT
- KUEBIX
- COMPANY SNAPSHOT
- SOLUTION PORTFOLIO
- RECENT DEVELOPMENT
- MERCURYGATE
- COMPANY SNAPSHOT
- SOLUTIONS PORTFOLIO
- RECENT DEVELOPMENT
- SOFTEON
- COMPANY SNAPSHOT
- PRODUCT PORTFOLIO
- RECENT DEVELOPMENT
- SUPPLY CHAIN SOLUTIONS
- COMPANY SNAPSHOT
- PRODUCT PORTFOLIO
- RECENT DEVELOPMENT
- THE DESCARTES SYSTEMS GROUP INC
- COMPANY SNAPSHOT
- REVENUE ANALYSIS
- PRODUCT PORTFOLIO
- RECENT DEVELOPMENTS
- TRANSPLACE
- COMPANY SNAPSHOT
- SOLUTION PORTFOLIO
- RECENT DEVELOPMENTS
- QUESTIONNAIRE
- RELATED REPORTS
Liste des tableaux
TABLEAU 1 Marché mondial de la gestion du transport de marchandises, par MODE DE TRANSPORT, prévisions de marché 2021-2028 (en millions USD)
TABLEAU 2 Marché mondial de la gestion des routes de transport de marchandises, par région, prévisions de marché 2021-2028 (en millions USD)
TABLEAU 3 Marché mondial de la gestion du transport ferroviaire de marchandises, par région, prévisions de marché 2021-2028 (en millions USD)
TABLEAU 4 Marché mondial de la gestion du transport maritime de marchandises, par région, prévisions de marché 2021-2028 (en millions USD)
TABLEAU 5 Global Airways sur le marché de la gestion du transport de fret, par région, prévisions de marché 2021-2028 (en millions USD)
TABLEAU 6 Marché mondial de la gestion du transport de marchandises, par offre, prévisions de marché 2021-2028 (en millions USD)
TABLEAU 7 Solutions mondiales pour le marché de la gestion du transport de marchandises, par région, 2019-2028, (en millions USD)
TABLEAU 8 Solutions mondiales de gestion du transport de marchandises, par type, 2021-2028 (en millions USD)
TABLEAU 9 3PL mondial sur le marché de la gestion du transport de marchandises, par type, 2019-2028 (en millions USD)
TABLEAU 10 Solution mondiale de mobilité du fret sur le marché de la gestion du transport de fret, par type, 2019-2028 (en millions USD)
TABLEAU 11 Solutions mondiales de sécurité du fret sur le marché de la gestion du transport de marchandises, par type, 2019-2028 (en millions USD)
TABLEAU 12 Solution mondiale de gestion des opérations de fret sur le marché de la gestion du transport de marchandises, par type, 2019-2028 (en millions USD)
TABLEAU 13 Services mondiaux de gestion du transport de marchandises, par région, 2019-2028, (en millions USD)
TABLEAU 14 Services mondiaux sur le marché de la gestion du transport de marchandises, par type, 2019-2028 (en millions USD)
TABLEAU 15 Marché mondial de la gestion du transport de marchandises, par mode de déploiement, prévisions de marché 2021-2028 (en millions USD)
TABLEAU 16 Marché mondial de la gestion du transport de marchandises en nuage ou hébergé, par région, prévisions de marché 2021-2028 (en millions USD)
TABLEAU 17 Marché mondial de la gestion du transport de marchandises hébergées ou en cloud, par prix, 2019-2028 (en millions USD)
TABLEAU 18 Marché mondial de la gestion du transport de marchandises sur site, par région, prévisions de marché 2021-2028 (en millions USD)
TABLEAU 19 Marché mondial de la gestion du transport de marchandises, par taille d'organisation, prévisions de marché 2021-2028 (en millions USD)
TABLEAU 20 Grandes entreprises mondiales sur le marché de la gestion du transport de marchandises, par région, 2019-2028, (en millions USD)
TABLEAU 21 PME mondiales sur le marché de la gestion du transport de marchandises, par région, 2019-2028, (en millions USD)
TABLEAU 22 Marché mondial de la gestion du transport de marchandises, par secteur, prévisions de marché 2021-2028 (en millions USD)
TABLEAU 23 Marché mondial de la fabrication dans la gestion du transport de marchandises, par région, 2019-2028, (en millions USD)
TABLEAU 24 Marché mondial de la gestion du transport de marchandises au détail et en ligne, par région, 2019-2028 (en millions USD)
TABLEAU 25 Marché mondial de la gestion du transport de marchandises, par région, 2019-2028, (en millions USD)
TABLEAU 26 Marché mondial de la gestion du transport de marchandises pour les biens de consommation courante (FMCG), par région, 2019-2028, (en millions USD)
TABLEAU 27 Marché mondial de la gestion des soins de santé dans le transport de marchandises, par région, 2019-2028, (en millions USD)
TABLEAU 28 Marché mondial de la gestion du transport de marchandises et des aliments et boissons, par région, 2019-2028, (en millions USD)
TABLEAU 29 Marché mondial de la gestion du transport de pétrole et de gaz, par région, 2019-2028, (en millions USD)
TABLEAU 30 Marché mondial de la gestion de l'énergie et des services publics dans le transport de marchandises, par région, 2019-2028, (en millions USD)
TABLEAU 31 Marché mondial de l'électronique dans la gestion du transport de marchandises, par région, 2019-2028, (en millions USD)
TABLEAU 32 Marché mondial de la gestion du transport automobile de marchandises, par région, 2019-2028, (en millions USD)
TABLEAU 33 Marché mondial des technologies de l'information et des télécommunications dans la gestion du transport de marchandises, par région, 2019-2028, (en millions USD)
TABLEAU 34 Autres acteurs mondiaux du marché de la gestion du transport de marchandises, par région, 2019-2028, (en millions USD)
TABLEAU 35 Marché mondial de la gestion du transport de marchandises, par région, 2020-2028 (en millions USD)
TABLEAU 36 Marché nord-américain de la gestion du transport de marchandises, par pays, 2019-2028 (en millions USD)
TABLEAU 37 Marché nord-américain de la gestion du transport de marchandises, par mode de transport, 2019-2028 (en millions USD)
TABLEAU 38 Marché nord-américain de la gestion du transport de marchandises, par offre, 2019-2028 (en millions USD)
TABLEAU 39 Solutions nord-américaines pour le marché de la gestion du transport de marchandises, par type, 2019-2028 (en millions USD)
TABLEAU 40 3PL en Amérique du Nord sur le marché de la gestion du transport de marchandises, par type, 2019-2028 (en millions USD)
TABLEAU 41 Solutions de mobilité de fret en Amérique du Nord sur le marché de la gestion du transport de fret, par type, 2019-2028 (en millions USD)
TABLEAU 42 Solutions de sécurité du fret en Amérique du Nord sur le marché de la gestion du transport de marchandises, par type, 2019-2028 (en millions USD)
TABLEAU 43 Solutions de gestion des opérations de fret en Amérique du Nord sur le marché de la gestion du transport de marchandises, par type, 2019-2028 (en millions USD)
TABLEAU 44 Services de gestion du transport de marchandises en Amérique du Nord, par type, 2019-2028 (en millions USD)
TABLEAU 45 Marché de la gestion du transport de marchandises en Amérique du Nord, par mode de déploiement, 2018-2028 (en millions USD)
TABLEAU 46 Marché nord-américain de la gestion du transport de marchandises en nuage ou hébergé, par prix, 2019-2028 (en millions USD)
TABLEAU 47 Marché nord-américain de la gestion du transport de marchandises, par taille d'organisation, 2019-2028 (en millions USD)
TABLEAU 48 Marché nord-américain de la gestion du transport de marchandises, par secteur, 2019-2028 (en millions USD)
TABLEAU 49 Marché américain de la gestion du transport de marchandises, par mode de transport, 2019-2028 (en millions USD)
TABLEAU 50 Marché américain de la gestion du transport de marchandises, par offre, 2019-2028 (en millions USD)
TABLEAU 51 Solutions américaines sur le marché de la gestion du transport de marchandises, par type, 2019-2028 (en millions USD)
TABLEAU 52 3PL américains sur le marché de la gestion du transport de marchandises, par type, 2019-2028 (en millions USD)
TABLEAU 53 Solutions de mobilité de fret aux États-Unis sur le marché de la gestion du transport de fret, par type, 2019-2028 (en millions USD)
TABLEAU 54 Solutions de sécurité du fret aux États-Unis sur le marché de la gestion du transport de marchandises, par type, 2019-2028 (en millions USD)
TABLEAU 55 Solutions de gestion des opérations de fret aux États-Unis sur le marché de la gestion du transport de fret, par type, 2019-2028 (en millions USD)
TABLEAU 56 Services américains sur le marché de la gestion du transport de marchandises, par type, 2019-2028 (en millions USD)
TABLEAU 57 Marché américain de la gestion du transport de marchandises, par mode de déploiement, 2018-2028 (en millions USD)
TABLEAU 58 Marché américain de la gestion du transport de marchandises en nuage ou hébergé, par prix, 2019-2028 (en millions USD)
TABLEAU 59 Marché américain de la gestion du transport de marchandises, par taille d'organisation, 2019-2028 (en millions USD)
TABLEAU 60 Marché américain de la gestion du transport de marchandises, par secteur, 2019-2028 (en millions USD)
TABLEAU 61 CANADA Marché de la gestion du transport de marchandises, par mode de transport, 2019-2028 (en millions USD)
TABLEAU 62 CANADA Marché de la gestion du transport de marchandises, par offre, 2019-2028 (en millions USD)
TABLEAU 63 Solutions canadiennes pour le marché de la gestion du transport de marchandises, par type, 2019-2028 (en millions USD)
TABLEAU 64 CANADA 3PL sur le marché de la gestion du transport de marchandises, par type, 2019-2028 (en millions USD)
TABLEAU 65 CANADA Solution de mobilité de fret sur le marché de la gestion du transport de fret, par type, 2019-2028 (en millions USD)
TABLEAU 66 CANADA Solutions de sécurité du fret sur le marché de la gestion du transport de marchandises, par type, 2019-2028 (en millions USD)
TABLEAU 67 CANADA Solution de gestion des opérations de fret sur le marché de la gestion du transport de marchandises, par type, 2019-2028 (en millions USD)
TABLEAU 68 CANADA Services sur le marché de la gestion du transport de marchandises, par type, 2019-2028 (en millions USD)
TABLEAU 69 CANADA Marché de la gestion du transport de marchandises, par mode de déploiement, 2018-2028 (en millions USD)
TABLEAU 70 CANADA Cloud ou hébergé sur le marché de la gestion du transport de marchandises, par prix, 2019-2028 (en millions USD)
TABLEAU 71 CANADA Marché de la gestion du transport de marchandises, par taille d'organisation, 2019-2028 (en millions USD)
TABLEAU 72 Marché canadien de la gestion du transport de marchandises, par industrie, 2019-2028 (en millions de dollars américains)
TABLEAU 73 Marché mexicain de la gestion du transport de marchandises, par mode de transport, 2019-2028 (en millions USD)
TABLEAU 74 Marché mexicain de la gestion du transport de marchandises, par offre, 2019-2028 (en millions USD)
TABLEAU 75 MEXIQUE Solutions sur le marché de la gestion du transport de marchandises, par type, 2019-2028 (en millions USD)
TABLEAU 76 MEXIQUE 3PL sur le marché de la gestion du transport de marchandises, par type, 2019-2028 (en millions USD)
TABLEAU 77 MEXIQUE Solution de mobilité de fret sur le marché de la gestion du transport de fret, par type, 2019-2028 (en millions USD)
TABLEAU 78 MEXIQUE Solutions de sécurité du fret sur le marché de la gestion du transport de marchandises, par type, 2019-2028 (en millions USD)
TABLEAU 79 MEXIQUE Solution de gestion des opérations de fret sur le marché de la gestion du transport de marchandises, par type, 2019-2028 (en millions USD)
TABLEAU 80 MEXIQUE Services sur le marché de la gestion du transport de marchandises, par type, 2019-2028 (en millions USD)
TABLE 81 MEXICO Freight Transportation Management Market, By Deployment Mode, 20189-2028 (USD Million)
TABLE 82 MEXICO Cloud or Hosted in Freight Transportation Management Market, By Pricing, 2019-2028 (USD Million)
TABLE 83 MEXICO Freight Transportation Management Market, By Organization Size, 2019-2028 (USD Million)
TABLE 84 MEXICO Freight Transportation Management Market, By Industry, 2019-2028 (USD Million)
TABLE 85 Europe Freight Transportation Management Market, By Country, 2019-2028 (USD Million)
TABLE 86 Europe Freight Transportation Management Market, By Transportation MODE, 2019-2028 (USD Million)
TABLE 87 Europe Freight Transportation Management Market, By Offering, 2019-2028 (USD Million)
TABLE 88 Europe Solution in Freight Transportation Management Market, By Type, 2019-2028 (USD Million)
TABLE 89 Europe 3PL in Freight Transportation Management Market, By Type, 2019-2028 (USD Million)
TABLE 90 Europe Freight Mobility Solution in Freight Transportation Management Market, By Type, 2019-2028 (USD Million)
TABLE 91 Europe Freight Security Solutions in Freight Transportation Management Market, By Type, 2019-2028 (USD Million)
TABLE 92 Europe Freight Operation Management Solution in Freight Transportation Management Market, By Type, 2019-2028 (USD Million)
TABLE 93 Europe Services in Freight Transportation Management Market, By Type, 2019-2028 (USD Million)
TABLE 94 Europe Freight Transportation Management Market, By Deployment Mode, 20189-2028 (USD Million)
TABLE 95 Europe Cloud or Hosted in Freight Transportation Management Market, By Pricing, 2019-2028 (USD Million)
TABLE 96 Europe Freight Transportation Management Market, By Organization Size, 2019-2028 (USD Million)
TABLE 97 Europe Freight Transportation Management Market, By Industry, 2019-2028 (USD Million)
TABLE 98 GERMANY Freight Transportation Management Market, By Transportation MODE, 2019-2028 (USD Million)
TABLE 99 GERMANY Freight Transportation Management Market, By Offering, 2019-2028 (USD Million)
TABLE 100 GERMANY Solution in Freight Transportation Management Market, By Type, 2019-2028 (USD Million)
TABLE 101 GERMANY 3PL in Freight Transportation Management Market, By Type, 2019-2028 (USD Million)
TABLE 102 GERMANY Freight Mobility Solution in Freight Transportation Management Market, By Type, 2019-2028 (USD Million)
TABLE 103 GERMANY Freight Security Solutions in Freight Transportation Management Market, By Type, 2019-2028 (USD Million)
TABLE 104 GERMANY Freight Operation Management Solution in Freight Transportation Management Market, By Type, 2019-2028 (USD Million)
TABLE 105 GERMANY Services in Freight Transportation Management Market, By Type, 2019-2028 (USD Million)
TABLE 106 GERMANY Freight Transportation Management Market, By Deployment Mode, 20189-2028 (USD Million)
TABLE 107 GERMANY Cloud or Hosted in Freight Transportation Management Market, By Pricing, 2019-2028 (USD Million)
TABLE 108 GERMANY Freight Transportation Management Market, By Organization Size, 2019-2028 (USD Million)
TABLE 109 GERMANY Freight Transportation Management Market, By Industry, 2019-2028 (USD Million)
TABLE 110 FRANCE Freight Transportation Management Market, By Transportation MODE, 2019-2028 (USD Million)
TABLE 111 FRANCE Freight Transportation Management Market, By Offering, 2019-2028 (USD Million)
TABLE 112 FRANCE Solution in Freight Transportation Management Market, By Type, 2019-2028 (USD Million)
TABLE 113 FRANCE 3PL in Freight Transportation Management Market, By Type, 2019-2028 (USD Million)
TABLE 114 FRANCE Freight Mobility Solution in Freight Transportation Management Market, By Type, 2019-2028 (USD Million)
TABLE 115 FRANCE Freight Security Solutions in Freight Transportation Management Market, By Type, 2019-2028 (USD Million)
TABLE 116 fRANCE Freight Operation Management Solution in Freight Transportation Management Market, By Type, 2019-2028 (USD Million)
TABLE 117 FRANCE Services in Freight Transportation Management Market, By Type, 2019-2028 (USD Million)
TABLE 118 FRANCE Freight Transportation Management Market, By Deployment Mode, 20189-2028 (USD Million)
TABLE 119 FRANCE Cloud or Hosted in Freight Transportation Management Market, By Pricing, 2019-2028 (USD Million)
TABLE 120 FRANCE Freight Transportation Management Market, By Organization Size, 2019-2028 (USD Million)
TABLE 121 FRANCE Freight Transportation Management Market, By Industry, 2019-2028 (USD Million)
TABLE 122 Italy Freight Transportation Management Market, By Transportation MODE, 2019-2028 (USD Million)
TABLE 123 ITALY Freight Transportation Management Market, By Offering, 2019-2028 (USD Million)
TABLE 124 iTALY Solution in Freight Transportation Management Market, By Type, 2019-2028 (USD Million)
TABLE 125 ITALY 3PL in Freight Transportation Management Market, By Type, 2019-2028 (USD Million)
TABLE 126 ITALY Freight Mobility Solution in Freight Transportation Management Market, By Type, 2019-2028 (USD Million)
TABLE 127 ITALY Freight Security Solutions in Freight Transportation Management Market, By Type, 2019-2028 (USD Million)
TABLE 128 ITALY Freight Operation Management Solution in Freight Transportation Management Market, By Type, 2019-2028 (USD Million)
TABLE 129 ITALY Services in Freight Transportation Management Market, By Type, 2019-2028 (USD Million)
TABLE 130 ITALY Freight Transportation Management Market, By Deployment Mode, 20189-2028 (USD Million)
TABLE 131 ITALY Cloud or Hosted in Freight Transportation Management Market, By Pricing, 2019-2028 (USD Million)
TABLE 132 ITALY Freight Transportation Management Market, By Organization Size, 2019-2028 (USD Million)
TABLE 133 ITALY Freight Transportation Management Market, By Industry, 2019-2028 (USD Million)
TABLE 134 U.K. Freight Transportation Management Market, By Transportation MODE, 2019-2028 (USD Million)
TABLE 135 U.K. Freight Transportation Management Market, By Offering, 2019-2028 (USD Million)
TABLE 136 U.K. Solution in Freight Transportation Management Market, By Type, 2019-2028 (USD Million)
TABLEAU 137 3PL au Royaume-Uni sur le marché de la gestion du transport de marchandises, par type, 2019-2028 (en millions USD)
TABLEAU 138 Solutions de mobilité de fret au Royaume-Uni sur le marché de la gestion du transport de fret, par type, 2019-2028 (en millions USD)
TABLEAU 139 Solutions de sécurité du fret au Royaume-Uni sur le marché de la gestion du transport de marchandises, par type, 2019-2028 (en millions USD)
TABLEAU 140 Solutions de gestion des opérations de fret au Royaume-Uni sur le marché de la gestion du transport de marchandises, par type, 2019-2028 (en millions USD)
TABLEAU 141 Services britanniques sur le marché de la gestion du transport de marchandises, par type, 2019-2028 (en millions USD)
TABLEAU 142 Marché de la gestion du transport de marchandises au Royaume-Uni, par mode de déploiement, 2018-2028 (en millions USD)
TABLEAU 143 Marché britannique de la gestion du transport de marchandises en nuage ou hébergé, par prix, 2019-2028 (en millions USD)
TABLEAU 144 Marché britannique de la gestion du transport de marchandises, par taille d'organisation, 2019-2028 (en millions USD)
TABLEAU 145 Marché de la gestion du transport de marchandises au Royaume-Uni, par secteur, 2019-2028 (en millions USD)
TABLEAU 146 Marché espagnol de la gestion du transport de marchandises, par mode de transport, 2019-2028 (en millions USD)
TABLEAU 147 Marché de la gestion du transport de marchandises en Espagne, par offre, 2019-2028 (en millions USD)
TABLEAU 148 ESPAGNE Solution sur le marché de la gestion du transport de marchandises, par type, 2019-2028 (en millions USD)
TABLEAU 149 ESPAGNE 3PL sur le marché de la gestion du transport de marchandises, par type, 2019-2028 (en millions USD)
TABLEAU 150 ESPAGNE Solution de mobilité de fret sur le marché de la gestion du transport de fret, par type, 2019-2028 (en millions USD)
TABLEAU 151 ESPAGNE Solutions de sécurité du fret sur le marché de la gestion du transport de marchandises, par type, 2019-2028 (en millions USD)
TABLEAU 152 ESPAGNE Solution de gestion des opérations de fret sur le marché de la gestion du transport de marchandises, par type, 2019-2028 (en millions USD)
TABLEAU 153 ESPAGNE Services sur le marché de la gestion du transport de marchandises, par type, 2019-2028 (en millions USD)
TABLEAU 154 Marché de la gestion du transport de marchandises en Espagne, par mode de déploiement, 2018-2028 (en millions USD)
TABLEAU 155 ESPAGNE Cloud ou hébergé sur le marché de la gestion du transport de marchandises, par prix, 2019-2028 (en millions USD)
TABLEAU 156 Marché de la gestion du transport de marchandises en Espagne, par taille d'organisation, 2019-2028 (en millions USD)
TABLEAU 157 Marché de la gestion du transport de marchandises en Espagne, par secteur, 2019-2028 (en millions USD)
TABLEAU 158 Marché néerlandais de la gestion du transport de marchandises, par mode de transport, 2019-2028 (en millions USD)
TABLEAU 159 PAYS-BAS Marché de la gestion du transport de marchandises, par offre, 2019-2028 (en millions USD)
TABLEAU 160 PAYS-BAS Solution sur le marché de la gestion du transport de marchandises, par type, 2019-2028 (en millions USD)
TABLEAU 161 PAYS-BAS 3PL sur le marché de la gestion du transport de marchandises, par type, 2019-2028 (en millions USD)
TABLEAU 162 PAYS-BAS Solution de mobilité de fret sur le marché de la gestion du transport de fret, par type, 2019-2028 (en millions USD)
TABLEAU 163 PAYS-BAS Solutions de sécurité du fret sur le marché de la gestion du transport de marchandises, par type, 2019-2028 (en millions USD)
TABLEAU 164 PAYS-BAS Solution de gestion des opérations de fret sur le marché de la gestion du transport de marchandises, par type, 2019-2028 (en millions USD)
TABLEAU 165 PAYS-BAS Services sur le marché de la gestion du transport de marchandises, par type, 2019-2028 (en millions USD)
TABLEAU 166 PAYS-BAS Marché de la gestion du transport de marchandises, par mode de déploiement, 2018-2028 (en millions USD)
TABLEAU 167 PAYS-BAS Cloud ou hébergé sur le marché de la gestion du transport de marchandises, par prix, 2019-2028 (en millions USD)
TABLEAU 168 PAYS-BAS Marché de la gestion du transport de marchandises, par taille d'organisation, 2019-2028 (en millions USD)
TABLEAU 169 PAYS-BAS Marché de la gestion du transport de marchandises, par secteur, 2019-2028 (en millions USD)
TABLEAU 170 Marché suisse de la gestion du transport de marchandises, par mode de transport, 2019-2028 (en millions USD)
TABLEAU 171 SUISSE Marché de la gestion du transport de marchandises, par offre, 2019-2028 (en millions USD)
TABLEAU 172 SUISSE Solution sur le marché de la gestion du transport de marchandises, par type, 2019-2028 (en millions USD)
TABLEAU 173 SUISSE 3PL sur le marché de la gestion du transport de marchandises, par type, 2019-2028 (en millions USD)
TABLEAU 174 SUISSE Solution de mobilité de fret sur le marché de la gestion du transport de fret, par type, 2019-2028 (en millions USD)
TABLEAU 175 Solutions de sécurité du fret en SUISSE sur le marché de la gestion du transport de marchandises, par type, 2019-2028 (en millions USD)
TABLEAU 176 SUISSE Solution de gestion des opérations de fret sur le marché de la gestion du transport de marchandises, par type, 2019-2028 (en millions USD)
TABLEAU 177 SUISSE Services sur le marché de la gestion du transport de marchandises, par type, 2019-2028 (en millions USD)
TABLEAU 178 SUISSE Marché de la gestion du transport de marchandises, par mode de déploiement, 2018-2028 (en millions USD)
TABLEAU 179 SUISSE Cloud ou hébergé sur le marché de la gestion du transport de marchandises, par prix, 2019-2028 (en millions USD)
TABLEAU 180 Marché suisse de la gestion du transport de marchandises, par taille d'organisation, 2019-2028 (en millions USD)
TABLEAU 181 SUISSE Marché de la gestion du transport de marchandises, par secteur, 2019-2028 (en millions USD)
TABLEAU 182 Marché belge de la gestion du transport de marchandises, par mode de transport, 2019-2028 (en millions USD)
TABLEAU 183 Marché belge de la gestion du transport de marchandises, par offre, 2019-2028 (en millions USD)
TABLEAU 184 BELGIQUE Solution sur le marché de la gestion du transport de marchandises, par type, 2019-2028 (en millions USD)
TABLEAU 185 BELGIQUE 3PL sur le marché de la gestion du transport de marchandises, par type, 2019-2028 (en millions USD)
TABLEAU 186 BELGIQUE Solution de mobilité de fret sur le marché de la gestion du transport de fret, par type, 2019-2028 (en millions USD)
TABLEAU 187 BELGIQUE Solutions de sécurité du fret sur le marché de la gestion du transport de marchandises, par type, 2019-2028 (en millions USD)
TABLEAU 188 BELGIQUE Solution de gestion des opérations de fret sur le marché de la gestion du transport de marchandises, par type, 2019-2028 (en millions USD)
TABLEAU 189 BELGIQUE Services sur le marché de la gestion du transport de marchandises, par type, 2019-2028 (en millions USD)
TABLE 190 BELGIUM Freight Transportation Management Market, By Deployment Mode, 20189-2028 (USD Million)
TABLE 191 BELGIUM Cloud or Hosted in Freight Transportation Management Market, By Pricing, 2019-2028 (USD Million)
TABLE 192 BELGIUM Freight Transportation Management Market, By Organization Size, 2019-2028 (USD Million)
TABLE 193 BELGIUM Freight Transportation Management Market, By Industry, 2019-2028 (USD Million)
TABLE 194 Russia Freight Transportation Management Market, By Transportation MODE, 2019-2028 (USD Million)
TABLE 195 RUSSIA Freight Transportation Management Market, By Offering, 2019-2028 (USD Million)
TABLE 196 RUSSIA Solution in Freight Transportation Management Market, By Type, 2019-2028 (USD Million)
TABLE 197 RUSSIA 3PL in Freight Transportation Management Market, By Type, 2019-2028 (USD Million)
TABLE 198 RUSSIA Freight Mobility Solution in Freight Transportation Management Market, By Type, 2019-2028 (USD Million)
TABLE 199 RUSSIA Freight Security Solutions in Freight Transportation Management Market, By Type, 2019-2028 (USD Million)
TABLE 200 RUSSIA Freight Operation Management Solution in Freight Transportation Management Market, By Type, 2019-2028 (USD Million)
TABLE 201 RUSSIA Services in Freight Transportation Management Market, By Type, 2019-2028 (USD Million)
TABLE 202 RUSSIA Freight Transportation Management Market, By Deployment Mode, 20189-2028 (USD Million)
TABLE 203 RUSSIA Cloud or Hosted in Freight Transportation Management Market, By Pricing, 2019-2028 (USD Million)
TABLE 204 RUSSIA Freight Transportation Management Market, By Organization Size, 2019-2028 (USD Million)
TABLE 205 RUSSIA Freight Transportation Management Market, By Industry, 2019-2028 (USD Million)
TABLE 206 Turkey Freight Transportation Management Market, By Transportation MODE, 2019-2028 (USD Million)
TABLE 207 TURKEY Freight Transportation Management Market, By Offering, 2019-2028 (USD Million)
TABLE 208 TURKEY Solution in Freight Transportation Management Market, By Type, 2019-2028 (USD Million)
TABLE 209 TURKEY 3PL in Freight Transportation Management Market, By Type, 2019-2028 (USD Million)
TABLE 210 TURKEY Freight Mobility Solution in Freight Transportation Management Market, By Type, 2019-2028 (USD Million)
TABLE 211 TURKEY Freight Security Solutions in Freight Transportation Management Market, By Type, 2019-2028 (USD Million)
TABLE 212 TURKEY Freight Operation Management Solution in Freight Transportation Management Market, By Type, 2019-2028 (USD Million)
TABLE 213 TURKEY Services in Freight Transportation Management Market, By Type, 2019-2028 (USD Million)
TABLE 214 TURKEY Freight Transportation Management Market, By Deployment Mode, 20189-2028 (USD Million)
TABLE 215 TURKEY Cloud or Hosted in Freight Transportation Management Market, By Pricing, 2019-2028 (USD Million)
TABLE 216 TURKEY Freight Transportation Management Market, By Organization Size, 2019-2028 (USD Million)
TABLE 217 TURKEY Freight Transportation Management Market, By Industry, 2019-2028 (USD Million)
TABLE 218 Rest of Europe Freight Transportation Management Market, By Transportation MODE, 2019-2028 (USD Million)
TABLE 219 Asia-pacific Freight Transportation Management Market, By Country, 2019-2028 (USD Million)
TABLE 220 Asia-pacific Freight Transportation Management Market, By Transportation MODE, 2019-2028 (USD Million)
TABLE 221 Asia-pacific Freight Transportation Management Market, By Offering, 2019-2028 (USD Million)
TABLE 222 Asia-pacific Solution in Freight Transportation Management Market, By Type, 2019-2028 (USD Million)
TABLE 223 Asia-pacific 3PL in Freight Transportation Management Market, By Type, 2019-2028 (USD Million)
TABLE 224 Asia-pacific Freight Mobility Solution in Freight Transportation Management Market, By Type, 2019-2028 (USD Million)
TABLE 225 Asia-pacific Freight Security Solutions in Freight Transportation Management Market, By Type, 2019-2028 (USD Million)
TABLE 226 Asia-pacific Freight Operation Management Solution in Freight Transportation Management Market, By Type, 2019-2028 (USD Million)
TABLE 227 Asia-pacific Services in Freight Transportation Management Market, By Type, 2019-2028 (USD Million)
TABLE 228 Asia-pacific Freight Transportation Management Market, By Deployment Mode, 20189-2028 (USD Million)
TABLE 229 Asia-pacific Cloud or Hosted in Freight Transportation Management Market, By Pricing, 2019-2028 (USD Million)
TABLE 230 Asia-pacific Freight Transportation Management Market, By Organization Size, 2019-2028 (USD Million)
TABLE 231 Asia-pacific Freight Transportation Management Market, By Industry, 2019-2028 (USD Million)
TABLE 232 CHINA Freight Transportation Management Market, By Transportation MODE, 2019-2028 (USD Million)
TABLE 233 CHINA Freight Transportation Management Market, By Offering, 2019-2028 (USD Million)
TABLE 234 CHINA Solution in Freight Transportation Management Market, By Type, 2019-2028 (USD Million)
TABLE 235 CHINA 3PL in Freight Transportation Management Market, By Type, 2019-2028 (USD Million)
TABLE 236 CHINA Freight Mobility Solution in Freight Transportation Management Market, By Type, 2019-2028 (USD Million)
TABLE 237 CHINA Freight Security Solutions in Freight Transportation Management Market, By Type, 2019-2028 (USD Million)
TABLE 238 CHINA Freight Operation Management Solution in Freight Transportation Management Market, By Type, 2019-2028 (USD Million)
TABLE 239 CHINA Services in Freight Transportation Management Market, By Type, 2019-2028 (USD Million)
TABLE 240 CHINA Freight Transportation Management Market, By Deployment Mode, 20189-2028 (USD Million)
TABLE 241 CHINA Cloud or Hosted in Freight Transportation Management Market, By Pricing, 2019-2028 (USD Million)
TABLE 242 CHINA Freight Transportation Management Market, By Organization Size, 2019-2028 (USD Million)
TABLE 243 CHINA Freight Transportation Management Market, By Industry, 2019-2028 (USD Million)
TABLE 244 JAPAN Freight Transportation Management Market, By Transportation MODE, 2019-2028 (USD Million)
TABLE 245 JAPAN Freight Transportation Management Market, By Offering, 2019-2028 (USD Million)
TABLE 246 JAPAN Solution in Freight Transportation Management Market, By Type, 2019-2028 (USD Million)
TABLE 247 JAPAN 3PL in Freight Transportation Management Market, By Type, 2019-2028 (USD Million)
TABLE 248 JAPAN Freight Mobility Solution in Freight Transportation Management Market, By Type, 2019-2028 (USD Million)
TABLE 249 JAPAN Freight Security Solutions in Freight Transportation Management Market, By Type, 2019-2028 (USD Million)
TABLE 250 JAPAN Freight Operation Management Solution in Freight Transportation Management Market, By Type, 2019-2028 (USD Million)
TABLE 251 JAPAN Services in Freight Transportation Management Market, By Type, 2019-2028 (USD Million)
TABLE 252 JAPAN Freight Transportation Management Market, By Deployment Mode, 20189-2028 (USD Million)
TABLE 253 JAPAN Cloud or Hosted in Freight Transportation Management Market, By Pricing, 2019-2028 (USD Million)
TABLE 254 JAPAN Freight Transportation Management Market, By Organization Size, 2019-2028 (USD Million)
TABLE 255 JAPAN Freight Transportation Management Market, By Industry, 2019-2028 (USD Million)
TABLE 256 India Freight Transportation Management Market, By Transportation MODE, 2019-2028 (USD Million)
TABLE 257 INDIA Freight Transportation Management Market, By Offering, 2019-2028 (USD Million)
TABLE 258 INDIA Solution in Freight Transportation Management Market, By Type, 2019-2028 (USD Million)
TABLE 259 INDIA 3PL in Freight Transportation Management Market, By Type, 2019-2028 (USD Million)
TABLE 260 INDIA Freight Mobility Solution in Freight Transportation Management Market, By Type, 2019-2028 (USD Million)
TABLE 261 INDIA Freight Security Solutions in Freight Transportation Management Market, By Type, 2019-2028 (USD Million)
TABLE 262 INDIA Freight Operation Management Solution in Freight Transportation Management Market, By Type, 2019-2028 (USD Million)
TABLE 263 INDIA Services in Freight Transportation Management Market, By Type, 2019-2028 (USD Million)
TABLE 264 INDIA Freight Transportation Management Market, By Deployment Mode, 20189-2028 (USD Million)
TABLE 265 INDIA Cloud or Hosted in Freight Transportation Management Market, By Pricing, 2019-2028 (USD Million)
TABLE 266 INDIA Freight Transportation Management Market, By Organization Size, 2019-2028 (USD Million)
TABLE 267 INDIA Freight Transportation Management Market, By Industry, 2019-2028 (USD Million)
TABLE 268 South Korea Freight Transportation Management Market, By Transportation MODE, 2019-2028 (USD Million)
TABLE 269 SOUTH KOREA Freight Transportation Management Market, By Offering, 2019-2028 (USD Million)
TABLE 270 SOUTH KOREA Solution in Freight Transportation Management Market, By Type, 2019-2028 (USD Million)
TABLE 271 SOUTH KOREA 3PL in Freight Transportation Management Market, By Type, 2019-2028 (USD Million)
TABLE 272 SOUTH KOREA Freight Mobility Solution in Freight Transportation Management Market, By Type, 2019-2028 (USD Million)
TABLE 273 SOUTH KOREA Freight Security Solutions in Freight Transportation Management Market, By Type, 2019-2028 (USD Million)
TABLE 274 SOUTH KOREA Freight Operation Management Solution in Freight Transportation Management Market, By Type, 2019-2028 (USD Million)
TABLE 275 SOUTH KOREA Services in Freight Transportation Management Market, By Type, 2019-2028 (USD Million)
TABLE 276 SOUTH KOREA Freight Transportation Management Market, By Deployment Mode, 20189-2028 (USD Million)
TABLE 277 SOUTH KOREA Cloud or Hosted in Freight Transportation Management Market, By Pricing, 2019-2028 (USD Million)
TABLE 278 SOUTH KOREA Freight Transportation Management Market, By Organization Size, 2019-2028 (USD Million)
TABLE 279 SOUTH KOREA Freight Transportation Management Market, By Industry, 2019-2028 (USD Million)
TABLE 280 Australia Freight Transportation Management Market, By Transportation MODE, 2019-2028 (USD Million)
TABLE 281 AUSTRALIA Freight Transportation Management Market, By Offering, 2019-2028 (USD Million)
TABLE 282 AUSTRALIA Solution in Freight Transportation Management Market, By Type, 2019-2028 (USD Million)
TABLE 283 AUSTRALIA 3PL in Freight Transportation Management Market, By Type, 2019-2028 (USD Million)
TABLE 284 AUSTRALIA Freight Mobility Solution in Freight Transportation Management Market, By Type, 2019-2028 (USD Million)
TABLE 285 AUSTRALIA Freight Security Solutions in Freight Transportation Management Market, By Type, 2019-2028 (USD Million)
TABLE 286 AUSTRALIA Freight Operation Management Solution in Freight Transportation Management Market, By Type, 2019-2028 (USD Million)
TABLE 287 AUSTRALIA Services in Freight Transportation Management Market, By Type, 2019-2028 (USD Million)
TABLE 288 AUSTRALIA Freight Transportation Management Market, By Deployment Mode, 20189-2028 (USD Million)
TABLE 289 AUSTRALIA Cloud or Hosted in Freight Transportation Management Market, By Pricing, 2019-2028 (USD Million)
TABLE 290 AUSTRALIA Freight Transportation Management Market, By Organization Size, 2019-2028 (USD Million)
TABLE 291 AUSTRALIA Freight Transportation Management Market, By Industry, 2019-2028 (USD Million)
TABLE 292 Indonesia Freight Transportation Management Market, By Transportation MODE, 2019-2028 (USD Million)
TABLE 293 INDONESIA Freight Transportation Management Market, By Offering, 2019-2028 (USD Million)
TABLE 294 INDONESIA Solution in Freight Transportation Management Market, By Type, 2019-2028 (USD Million)
TABLE 295 INDONESIA 3PL in Freight Transportation Management Market, By Type, 2019-2028 (USD Million)
TABLE 296 INDONESIA Freight Mobility Solution in Freight Transportation Management Market, By Type, 2019-2028 (USD Million)
TABLE 297 INDONESIA Freight Security Solutions in Freight Transportation Management Market, By Type, 2019-2028 (USD Million)
TABLE 298 INDONESIA Freight Operation Management Solution in Freight Transportation Management Market, By Type, 2019-2028 (USD Million)
TABLE 299 INDONESIA Services in Freight Transportation Management Market, By Type, 2019-2028 (USD Million)
TABLE 300 INDONESIA Freight Transportation Management Market, By Deployment Mode, 20189-2028 (USD Million)
TABLE 301 INDONESIA Cloud or Hosted in Freight Transportation Management Market, By Pricing, 2019-2028 (USD Million)
TABLE 302 INDONESIA Freight Transportation Management Market, By Organization Size, 2019-2028 (USD Million)
TABLE 303 INDONESIA Freight Transportation Management Market, By Industry, 2019-2028 (USD Million)
TABLE 304 Singapore Freight Transportation Management Market, By Transportation MODE, 2019-2028 (USD Million)
TABLE 305 SINGAPORE Freight Transportation Management Market, By Offering, 2019-2028 (USD Million)
TABLE 306 SINGAPORE Solution in Freight Transportation Management Market, By Type, 2019-2028 (USD Million)
TABLE 307 SINGAPORE 3PL in Freight Transportation Management Market, By Type, 2019-2028 (USD Million)
TABLE 308 SINGAPORE Freight Mobility Solution in Freight Transportation Management Market, By Type, 2019-2028 (USD Million)
TABLE 309 SINGAPORE Freight Security Solutions in Freight Transportation Management Market, By Type, 2019-2028 (USD Million)
TABLE 310 SINGAPORE Freight Operation Management Solution in Freight Transportation Management Market, By Type, 2019-2028 (USD Million)
TABLE 311 SINGAPORE Services in Freight Transportation Management Market, By Type, 2019-2028 (USD Million)
TABLE 312 SINGAPORE Freight Transportation Management Market, By Deployment Mode, 20189-2028 (USD Million)
TABLE 313 SINGAPORE Cloud or Hosted in Freight Transportation Management Market, By Pricing, 2019-2028 (USD Million)
TABLE 314 SINGAPORE Freight Transportation Management Market, By Organization Size, 2019-2028 (USD Million)
TABLE 315 SINGAPORE Freight Transportation Management Market, By Industry, 2019-2028 (USD Million)
TABLE 316 Thailand Freight Transportation Management Market, By Transportation MODE, 2019-2028 (USD Million)
TABLE 317 THAILAND Freight Transportation Management Market, By Offering, 2019-2028 (USD Million)
TABLE 318 THAILAND Solution in Freight Transportation Management Market, By Type, 2019-2028 (USD Million)
TABLE 319 THAILAND 3PL in Freight Transportation Management Market, By Type, 2019-2028 (USD Million)
TABLE 320 THAILAND Freight Mobility Solution in Freight Transportation Management Market, By Type, 2019-2028 (USD Million)
TABLE 321 THAILAND Freight Security Solutions in Freight Transportation Management Market, By Type, 2019-2028 (USD Million)
TABLE 322 THAILAND Freight Operation Management Solution in Freight Transportation Management Market, By Type, 2019-2028 (USD Million)
TABLE 323 THAILAND Services in Freight Transportation Management Market, By Type, 2019-2028 (USD Million)
TABLE 324 THAILAND Freight Transportation Management Market, By Deployment Mode, 20189-2028 (USD Million)
TABLE 325 THAILAND Cloud or Hosted in Freight Transportation Management Market, By Pricing, 2019-2028 (USD Million)
TABLE 326 THAILAND Freight Transportation Management Market, By Organization Size, 2019-2028 (USD Million)
TABLE 327 THAILAND Freight Transportation Management Market, By Industry, 2019-2028 (USD Million)
TABLE 328 Malaysia Freight Transportation Management Market, By Transportation MODE, 2019-2028 (USD Million)
TABLE 329 MALAYSIA Freight Transportation Management Market, By Offering, 2019-2028 (USD Million)
TABLE 330 MALAYSIA Solution in Freight Transportation Management Market, By Type, 2019-2028 (USD Million)
TABLE 331 MALAYSIA 3PL in Freight Transportation Management Market, By Type, 2019-2028 (USD Million)
TABLE 332 MALAYSIA Freight Mobility Solution in Freight Transportation Management Market, By Type, 2019-2028 (USD Million)
TABLE 333 MALAYSIA Freight Security Solutions in Freight Transportation Management Market, By Type, 2019-2028 (USD Million)
TABLE 334 MALAYSIA Freight Operation Management Solution in Freight Transportation Management Market, By Type, 2019-2028 (USD Million)
TABLE 335 MALAYSIA Services in Freight Transportation Management Market, By Type, 2019-2028 (USD Million)
TABLE 336 MALAYSIA Freight Transportation Management Market, By Deployment Mode, 20189-2028 (USD Million)
TABLE 337 MALAYSIA Cloud or Hosted in Freight Transportation Management Market, By Pricing, 2019-2028 (USD Million)
TABLE 338 MALAYSIA Freight Transportation Management Market, By Organization Size, 2019-2028 (USD Million)
TABLE 339 MALAYSIA Freight Transportation Management Market, By Industry, 2019-2028 (USD Million)
TABLE 340 Philippines Freight Transportation Management Market, By Transportation MODE, 2019-2028 (USD Million)
TABLE 341 PHILIPPINES Freight Transportation Management Market, By Offering, 2019-2028 (USD Million)
TABLE 342 PHILIPPINES Solution in Freight Transportation Management Market, By Type, 2019-2028 (USD Million)
TABLE 343 PHILIPPINES 3PL in Freight Transportation Management Market, By Type, 2019-2028 (USD Million)
TABLE 344 PHILIPPINES Freight Mobility Solution in Freight Transportation Management Market, By Type, 2019-2028 (USD Million)
TABLE 345 PHILIPPINES Freight Security Solutions in Freight Transportation Management Market, By Type, 2019-2028 (USD Million)
TABLE 346 PHILIPPINES Freight Operation Management Solution in Freight Transportation Management Market, By Type, 2019-2028 (USD Million)
TABLE 347 PHILIPPINES Services in Freight Transportation Management Market, By Type, 2019-2028 (USD Million)
TABLE 348 PHILIPPINES Freight Transportation Management Market, By Deployment Mode, 20189-2028 (USD Million)
TABLE 349 PHILIPPINES Cloud or Hosted in Freight Transportation Management Market, By Pricing, 2019-2028 (USD Million)
TABLE 350 PHILIPPINES Freight Transportation Management Market, By Organization Size, 2019-2028 (USD Million)
TABLE 351 PHILIPPINES Freight Transportation Management Market, By Industry, 2019-2028 (USD Million)
TABLEAU 352 Marché de la gestion du transport de marchandises dans le reste de l'Asie-Pacifique, par mode de transport, 2019-2028 (en millions USD)
TABLEAU 353 Marché de la gestion du transport de marchandises au Moyen-Orient et en Afrique, par pays, 2019-2028 (en millions USD)
TABLEAU 354 Marché de la gestion du transport de marchandises au Moyen-Orient et en Afrique, par mode de transport, 2019-2028 (en millions USD)
TABLEAU 355 Marché de la gestion du transport de marchandises au Moyen-Orient et en Afrique, par offre, 2019-2028 (en millions USD)
TABLEAU 356 Solutions de gestion du transport de marchandises au Moyen-Orient et en Afrique, par type, 2019-2028 (en millions USD)
TABLEAU 357 Moyen-Orient et Afrique : 3PL sur le marché de la gestion du transport de marchandises, par type, 2019-2028 (en millions USD)
TABLEAU 358 Solutions de mobilité de fret au Moyen-Orient et en Afrique sur le marché de la gestion du transport de fret, par type, 2019-2028 (en millions USD)
TABLEAU 359 Solutions de sécurité du fret au Moyen-Orient et en Afrique sur le marché de la gestion du transport de marchandises, par type, 2019-2028 (en millions USD)
TABLEAU 360 Solutions de gestion des opérations de fret au Moyen-Orient et en Afrique sur le marché de la gestion du transport de marchandises, par type, 2019-2028 (en millions USD)
TABLEAU 361 Services de gestion du transport de marchandises au Moyen-Orient et en Afrique, par type, 2019-2028 (en millions USD)
TABLEAU 362 Marché de la gestion du transport de marchandises au Moyen-Orient et en Afrique, par mode de déploiement, 2018-2028 (en millions USD)
TABLEAU 363 Marché de la gestion du transport de marchandises hébergé ou en nuage au Moyen-Orient et en Afrique, par prix, 2019-2028 (en millions USD)
TABLEAU 364 Marché de la gestion du transport de marchandises au Moyen-Orient et en Afrique, par taille d'organisation, 2019-2028 (en millions USD)
TABLEAU 365 Marché de la gestion du transport de marchandises au Moyen-Orient et en Afrique, par secteur, 2019-2028 (en millions USD)
TABLEAU 366 Marché de la gestion du transport de marchandises en Arabie saoudite, par mode de transport, 2019-2028 (en millions USD)
TABLEAU 367 Marché de la gestion du transport de marchandises en Arabie saoudite, par offre, 2019-2028 (en millions USD)
TABLEAU 368 Solutions saoudiennes pour le marché de la gestion du transport de marchandises, par type, 2019-2028 (en millions USD)
TABLEAU 369 Arabie saoudite : 3PL sur le marché de la gestion du transport de marchandises, par type, 2019-2028 (en millions USD)
TABLEAU 370 Solutions de mobilité de fret en Arabie saoudite sur le marché de la gestion du transport de fret, par type, 2019-2028 (en millions USD)
TABLEAU 371 Solutions de sécurité du fret en Arabie saoudite sur le marché de la gestion du transport de marchandises, par type, 2019-2028 (en millions USD)
TABLEAU 372 Solution de gestion des opérations de fret en Arabie saoudite sur le marché de la gestion du transport de marchandises, par type, 2019-2028 (en millions USD)
TABLEAU 373 Services saoudiens sur le marché de la gestion du transport de marchandises, par type, 2019-2028 (en millions USD)
TABLEAU 374 Marché de la gestion du transport de marchandises en Arabie saoudite, par mode de déploiement, 2018-2028 (en millions USD)
TABLEAU 375 Arabie saoudite : Cloud ou hébergement sur le marché de la gestion du transport de marchandises, par prix, 2019-2028 (en millions USD)
TABLEAU 376 Marché de la gestion du transport de marchandises en Arabie saoudite, par taille d'organisation, 2019-2028 (en millions USD)
TABLEAU 377 Marché de la gestion du transport de marchandises en Arabie saoudite, par secteur, 2019-2028 (en millions USD)
TABLEAU 378 Marché de la gestion du transport de marchandises aux Émirats arabes unis, par mode de transport, 2019-2028 (en millions USD)
TABLEAU 379 Marché de la gestion du transport de marchandises aux Émirats arabes unis, par offre, 2019-2028 (en millions USD)
TABLEAU 380 Solutions des Émirats arabes unis pour la gestion du transport de marchandises, par type, 2019-2028 (en millions USD)
TABLEAU 381 3PL sur le marché de la gestion du transport de marchandises aux Émirats arabes unis, par type, 2019-2028 (en millions USD)
TABLEAU 382 Solutions de mobilité de fret aux Émirats arabes unis sur le marché de la gestion du transport de fret, par type, 2019-2028 (en millions USD)
TABLEAU 383 Solutions de sécurité du fret aux Émirats arabes unis sur le marché de la gestion du transport de marchandises, par type, 2019-2028 (en millions USD)
TABLEAU 384 Solution de gestion des opérations de fret aux Émirats arabes unis sur le marché de la gestion du transport de marchandises, par type, 2019-2028 (en millions USD)
TABLEAU 385 Services des Émirats arabes unis sur le marché de la gestion du transport de marchandises, par type, 2019-2028 (en millions USD)
TABLEAU 386 Marché de la gestion du transport de marchandises aux Émirats arabes unis, par mode de déploiement, 2018-2028 (en millions USD)
TABLEAU 387 Marché de la gestion du transport de marchandises hébergé ou en cloud aux Émirats arabes unis, par prix, 2019-2028 (en millions USD)
TABLEAU 388 Marché de la gestion du transport de marchandises aux Émirats arabes unis, par taille d'organisation, 2019-2028 (en millions USD)
TABLEAU 389 Marché de la gestion du transport de marchandises aux Émirats arabes unis, par secteur, 2019-2028 (en millions USD)
TABLEAU 390 Marché de la gestion du transport de marchandises en Afrique du Sud, par mode de transport, 2019-2028 (en millions USD)
TABLEAU 391 Marché de la gestion du transport de marchandises en Afrique du Sud, par offre, 2019-2028 (en millions USD)
TABLEAU 392 AFRIQUE DU SUD Solutions sur le marché de la gestion du transport de marchandises, par type, 2019-2028 (en millions USD)
TABLEAU 393 AFRIQUE DU SUD 3PL sur le marché de la gestion du transport de marchandises, par type, 2019-2028 (en millions USD)
TABLEAU 394 AFRIQUE DU SUD Solution de mobilité de fret sur le marché de la gestion du transport de fret, par type, 2019-2028 (en millions USD)
TABLEAU 395 AFRIQUE DU SUD Solutions de sécurité du fret sur le marché de la gestion du transport de marchandises, par type, 2019-2028 (en millions USD)
TABLEAU 396 AFRIQUE DU SUD Solution de gestion des opérations de fret sur le marché de la gestion du transport de marchandises, par type, 2019-2028 (en millions USD)
TABLEAU 397 AFRIQUE DU SUD Services sur le marché de la gestion du transport de marchandises, par type, 2019-2028 (en millions USD)
TABLEAU 398 Marché de la gestion du transport de marchandises en Afrique du Sud, par mode de déploiement, 2018-2028 (en millions USD)
TABLEAU 399 AFRIQUE DU SUD Cloud ou hébergé sur le marché de la gestion du transport de marchandises, par prix, 2019-2028 (en millions USD)
TABLEAU 400 Marché de la gestion du transport de marchandises en Afrique du Sud, par taille d'organisation, 2019-2028 (en millions USD)
TABLEAU 401 Marché de la gestion du transport de marchandises en Afrique du Sud, par secteur, 2019-2028 (en millions USD)
TABLEAU 402 Marché de la gestion du transport de marchandises en ÉGYPTE, par mode de transport, 2019-2028 (en millions USD)
TABLE 403 EGYPT Freight Transportation Management Market, By Offering, 2019-2028 (USD Million)
TABLE 404 EGYPT Solution in Freight Transportation Management Market, By Type, 2019-2028 (USD Million)
TABLE 405 EGYPT 3PL in Freight Transportation Management Market, By Type, 2019-2028 (USD Million)
TABLE 406 EGYPT Freight Mobility Solution in Freight Transportation Management Market, By Type, 2019-2028 (USD Million)
TABLE 407 EGYPT Freight Security Solutions in Freight Transportation Management Market, By Type, 2019-2028 (USD Million)
TABLE 408 EGYPT Freight Operation Management Solution in Freight Transportation Management Market, By Type, 2019-2028 (USD Million)
TABLE 409 EGYPT Services in Freight Transportation Management Market, By Type, 2019-2028 (USD Million)
TABLE 410 EGYPT Freight Transportation Management Market, By Deployment Mode, 20189-2028 (USD Million)
TABLE 411 EGYPT Cloud or Hosted in Freight Transportation Management Market, By Pricing, 2019-2028 (USD Million)
TABLE 412 EGYPT Freight Transportation Management Market, By Organization Size, 2019-2028 (USD Million)
TABLE 413 EGYPT Freight Transportation Management Market, By Industry, 2019-2028 (USD Million)
TABLE 414 ISRAEL Freight Transportation Management Market, By Transportation MODE, 2019-2028 (USD Million)
TABLE 415 ISRAEL Freight Transportation Management Market, By Offering, 2019-2028 (USD Million)
TABLE 416 ISRAEL Solution in Freight Transportation Management Market, By Type, 2019-2028 (USD Million)
TABLE 417 ISRAEL 3PL in Freight Transportation Management Market, By Type, 2019-2028 (USD Million)
TABLE 418 ISRAEL Freight Mobility Solution in Freight Transportation Management Market, By Type, 2019-2028 (USD Million)
TABLE 419 ISRAEL Freight Security Solutions in Freight Transportation Management Market, By Type, 2019-2028 (USD Million)
TABLE 420 ISRAEL Freight Operation Management Solution in Freight Transportation Management Market, By Type, 2019-2028 (USD Million)
TABLE 421 ISRAEL Services in Freight Transportation Management Market, By Type, 2019-2028 (USD Million)
TABLE 422 ISRAEL Freight Transportation Management Market, By Deployment Mode, 20189-2028 (USD Million)
TABLE 423 ISRAEL Cloud or Hosted in Freight Transportation Management Market, By Pricing, 2019-2028 (USD Million)
TABLE 424 ISRAEL Freight Transportation Management Market, By Organization Size, 2019-2028 (USD Million)
TABLE 425 ISRAEL Freight Transportation Management Market, By Industry, 2019-2028 (USD Million)
TABLE 426 rest of middle East & Africa Freight Transportation Management Market, By Transportation MODE, 2019-2028 (USD Million)
TABLE 427 South America Freight Transportation Management Market, By Country, 2019-2028 (USD Million)
TABLE 428 South America Freight Transportation Management Market, By Transportation MODE, 2019-2028 (USD Million)
TABLE 429 South America Freight Transportation Management Market, By Offering, 2019-2028 (USD Million)
TABLE 430 South America Solution in Freight Transportation Management Market, By Type, 2019-2028 (USD Million)
TABLE 431 South America 3PL in Freight Transportation Management Market, By Type, 2019-2028 (USD Million)
TABLE 432 South America Freight Mobility Solution in Freight Transportation Management Market, By Type, 2019-2028 (USD Million)
TABLE 433 South America Freight Security Solutions in Freight Transportation Management Market, By Type, 2019-2028 (USD Million)
TABLE 434 South America Freight Operation Management Solution in Freight Transportation Management Market, By Type, 2019-2028 (USD Million)
TABLE 435 South America Services in Freight Transportation Management Market, By Type, 2019-2028 (USD Million)
TABLE 436 South America Freight Transportation Management Market, By Deployment Mode, 20189-2028 (USD Million)
TABLE 437 South America Cloud or Hosted in Freight Transportation Management Market, By Pricing, 2019-2028 (USD Million)
TABLE 438 South America Freight Transportation Management Market, By Organization Size, 2019-2028 (USD Million)
TABLE 439 South America Freight Transportation Management Market, By Industry, 2019-2028 (USD Million)
TABLE 440 Brazil Freight Transportation Management Market, By Transportation MODE, 2019-2028 (USD Million)
TABLE 441 Brazil Freight Transportation Management Market, By Offering, 2019-2028 (USD Million)
TABLE 442 Brazil Solution in Freight Transportation Management Market, By Type, 2019-2028 (USD Million)
TABLE 443 Brazil 3PL in Freight Transportation Management Market, By Type, 2019-2028 (USD Million)
TABLE 444 Brazil Freight Mobility Solution in Freight Transportation Management Market, By Type, 2019-2028 (USD Million)
TABLE 445 Brazil Freight Security Solutions in Freight Transportation Management Market, By Type, 2019-2028 (USD Million)
TABLE 446 Brazil Freight Operation Management Solution in Freight Transportation Management Market, By Type, 2019-2028 (USD Million)
TABLE 447 Brazil Services in Freight Transportation Management Market, By Type, 2019-2028 (USD Million)
TABLE 448 Brazil Freight Transportation Management Market, By Deployment Mode, 20189-2028 (USD Million)
TABLE 449 Brazil Cloud or Hosted in Freight Transportation Management Market, By Pricing, 2019-2028 (USD Million)
TABLE 450 Brazil Freight Transportation Management Market, By Organization Size, 2019-2028 (USD Million)
TABLE 451 Brazil Freight Transportation Management Market, By Industry, 2019-2028 (USD Million)
TABLE 452 ARGENTINA Freight Transportation Management Market, By Transportation MODE, 2019-2028 (USD Million)
TABLE 453 ARGENTINA Freight Transportation Management Market, By Offering, 2019-2028 (USD Million)
TABLE 454 ARGENTINA Solution in Freight Transportation Management Market, By Type, 2019-2028 (USD Million)
TABLE 455 ARGENTINA 3PL in Freight Transportation Management Market, By Type, 2019-2028 (USD Million)
TABLE 456 ARGENTINA Freight Mobility Solution in Freight Transportation Management Market, By Type, 2019-2028 (USD Million)
TABLE 457 ARGENTINA Freight Security Solutions in Freight Transportation Management Market, By Type, 2019-2028 (USD Million)
TABLE 458 ARGENTINA Freight Operation Management Solution in Freight Transportation Management Market, By Type, 2019-2028 (USD Million)
TABLE 459 ARGENTINA Services in Freight Transportation Management Market, By Type, 2019-2028 (USD Million)
TABLE 460 ARGENTINA Freight Transportation Management Market, By Deployment Mode, 20189-2028 (USD Million)
TABLE 461 ARGENTINA Cloud or Hosted in Freight Transportation Management Market, By Pricing, 2019-2028 (USD Million)
TABLE 462 ARGENTINA Freight Transportation Management Market, By Organization Size, 2019-2028 (USD Million)
TABLE 463 ARGENTINA Freight Transportation Management Market, By Industry, 2019-2028 (USD Million)
TABLE 464 rest of South America Freight Transportation Management Market, By Transportation MODE, 2019-2028 (USD Million)
Liste des figures
FIGURE 1 Global Freight transportation management market: segmentation
FIGURE 2 Global Freight transportation management market: data triangulation
FIGURE 3 Global Freight transportation management market: DROC ANALYSIS
FIGURE 4 Global Freight transportation management market: GLOBAL VS. REGIONAL MARKET ANALYSIS
FIGURE 5 Global Freight transportation management market: COMPANY RESEARCH ANALYSIS
FIGURE 6 Global Freight transportation management market: INTERVIEW DEMOGRAPHICS
FIGURE 7 Global Freight transportation management market: DBMR MARKET POSITION GRID
FIGURE 8 Global Freight transportation management market: vendor share analysis
FIGURE 9 GLOBAL freight transportation management MARKET: MARKET IndustryCOVERAGE GRID
FIGURE 10 Global Freight transportation management market: SEGMENTATION
FIGURE 11 Increasing growth in globalization leading to high freight transportation is EXPECTED TO DRIVE Global Freight transportation management market IN THE FORECAST PERIOD OF 2021 to 2028
FIGURE 12 Roadways is expected to account for the largest share of Global Freight transportation management market in 2021 & 2028
FIGURE 13 europe is expected to DOMINATE and is the fastest growing region in THE global Freight transportation management market IN the forecast period of 2021 to 2028
FIGURE 14 Europe is the fastest growing market for Freight transportation management manufacturers in the forecast period of 2021 to 2028
FIGURE 15 DRIVERS, RESTRAINTS, OPPORTUNITIES AND CHALLENGES OF Global Freight Transportation Management Market
FIGURE 16 Global Freight transportation management MARKET: BY Transportation Mode, 2020
FIGURE 17 Global Freight transportation management MARKET: BY Offering, 2020
FIGURE 18 Global Freight transportation management MARKET: BY deployment mode, 2020
FIGURE 19 Global Freight transportation management MARKET: BY organization size, 2020
FIGURE 20 Global Freight transportation management MARKET: BY industry, 2020
FIGURE 21 GLOBAL FREIGHT Transportation Management market: SNAPSHOT (2020)
FIGURE 22 GLOBAL FREIGHT Transportation Management market: by geography (2020)
FIGURE 23 GLOBAL FREIGHT Transportation Management market: by geography (2021 & 2028)
FIGURE 24 GLOBAL FREIGHT Transportation Management market: by Geography (2021& 2028)
FIGURE 25 GLOBAL FREIGHT Transportation Management market: by product type (2021-2028)
FIGURE 26 NORTH AMERICA Freight transportation management MARKET: SNAPSHOT (2020)
FIGURE 27 NORTH AMERICA Freight transportation management MARKET: by Country (2020)
FIGURE 28 NORTH AMERICA Freight transportation management MARKET: by Country (2021 & 2028)
FIGURE 29 NORTH AMERICA Freight transportation management MARKET: by Country (2021 & 2028)
FIGURE 30 NORTH AMERICA Freight transportation management MARKET: by type (2021-2028)
FIGURE 31 Europe Freight transportation management MARKET: SNAPSHOT (2020)
FIGURE 32 Europe Freight transportation management MARKET: by Country (2020)
FIGURE 33 Europe Freight transportation management MARKET: by Country (2021 & 2028)
FIGURE 34 Europe Freight transportation management MARKET: by Country (2021 & 2028)
FIGURE 35 Europe Freight transportation management MARKET: by type (2021-2028)
FIGURE 36 ASIA-PACIFIC Freight transportation management MARKET: SNAPSHOT (2020)
FIGURE 37 ASIA-PACIFIC Freight transportation management MARKET: by Country (2020)
FIGURE 38 ASIA-PACIFIC Freight transportation management MARKET: by Country (2021 & 2028)
FIGURE 39 ASIA-PACIFIC Freight transportation management MARKET: by Country (2021 & 2028)
FIGURE 40 ASIA-PACIFIC Freight transportation management MARKET: by type (2021-2028)
FIGURE 41 MIDDLE EAST & AFRICA Freight transportation management MARKET: SNAPSHOT (2020)
FIGURE 42 MIDDLE EAST & AFRICA Freight transportation management MARKET: by Country (2020)
FIGURE 43 MIDDLE EAST & AFRICA Freight transportation management MARKET: by Country (2021 & 2028)
FIGURE 44 MIDDLE EAST & AFRICA Freight transportation management MARKET: by Country (2021 & 2028)
FIGURE 45 MIDDLE EAST & AFRICA Freight transportation management MARKET: by type (2021-2028)
FIGURE 46 SOUTH AMERICA Freight transportation management MARKET: SNAPSHOT (2020)
FIGURE 47 SOUTH AMERICA Freight transportation management MARKET: by Country (2020)
FIGURE 48 SOUTH AMERICA Freight transportation management MARKET: by Country (2021 & 2028)
FIGURE 49 SOUTH AMERICA Freight transportation management MARKET: by Country (2021 & 2028)
FIGURE 50 SOUTH AMERICA Freight transportation management MARKET: by type (2021-2028)
FIGURE 51 global Freight Transportation Management Market: company share 2020 (%)
FIGURE 52 NORTH AMERICA Freight Transportation Management Market: company share 2020 (%)
FIGURE 53 Europe Freight Transportation Management Market: company share 2020 (%)
FIGURE 54 Asia-Pacific Freight Transportation Management Market: company share 2020 (%)
Méthodologie de recherche
La collecte de données et l'analyse de l'année de base sont effectuées à l'aide de modules de collecte de données avec des échantillons de grande taille. L'étape consiste à obtenir des informations sur le marché ou des données connexes via diverses sources et stratégies. Elle comprend l'examen et la planification à l'avance de toutes les données acquises dans le passé. Elle englobe également l'examen des incohérences d'informations observées dans différentes sources d'informations. Les données de marché sont analysées et estimées à l'aide de modèles statistiques et cohérents de marché. De plus, l'analyse des parts de marché et l'analyse des tendances clés sont les principaux facteurs de succès du rapport de marché. Pour en savoir plus, veuillez demander un appel d'analyste ou déposer votre demande.
La méthodologie de recherche clé utilisée par l'équipe de recherche DBMR est la triangulation des données qui implique l'exploration de données, l'analyse de l'impact des variables de données sur le marché et la validation primaire (expert du secteur). Les modèles de données incluent la grille de positionnement des fournisseurs, l'analyse de la chronologie du marché, l'aperçu et le guide du marché, la grille de positionnement des entreprises, l'analyse des brevets, l'analyse des prix, l'analyse des parts de marché des entreprises, les normes de mesure, l'analyse globale par rapport à l'analyse régionale et des parts des fournisseurs. Pour en savoir plus sur la méthodologie de recherche, envoyez une demande pour parler à nos experts du secteur.
Personnalisation disponible
Data Bridge Market Research est un leader de la recherche formative avancée. Nous sommes fiers de fournir à nos clients existants et nouveaux des données et des analyses qui correspondent à leurs objectifs. Le rapport peut être personnalisé pour inclure une analyse des tendances des prix des marques cibles, une compréhension du marché pour d'autres pays (demandez la liste des pays), des données sur les résultats des essais cliniques, une revue de la littérature, une analyse du marché des produits remis à neuf et de la base de produits. L'analyse du marché des concurrents cibles peut être analysée à partir d'une analyse basée sur la technologie jusqu'à des stratégies de portefeuille de marché. Nous pouvons ajouter autant de concurrents que vous le souhaitez, dans le format et le style de données que vous recherchez. Notre équipe d'analystes peut également vous fournir des données sous forme de fichiers Excel bruts, de tableaux croisés dynamiques (Fact book) ou peut vous aider à créer des présentations à partir des ensembles de données disponibles dans le rapport.

