Global Haptic Technology Market
Taille du marché en milliards USD
TCAC :
% 
 USD
14.05 Billion
USD
42.09 Billion
2025
2033
USD
14.05 Billion
USD
42.09 Billion
2025
2033
| 2026 –2033 | |
| USD 14.05 Billion | |
| USD 42.09 Billion | |
| % | |
|
Global Haptic Technology Market, By Component (Microcontrollers, conducteurs, actuateurs, logiciels, etc.), Feedback (Rétroaction tactile et rétroaction de la force), Application (Automobile et transport, Électronique des consommateurs, Éducation et recherche, Gaming, Santé, Ingénierie, etc.) - Tendances et prévisions de l'industrie jusqu'en 2033
Marché des technologies haptiquesAperçu général
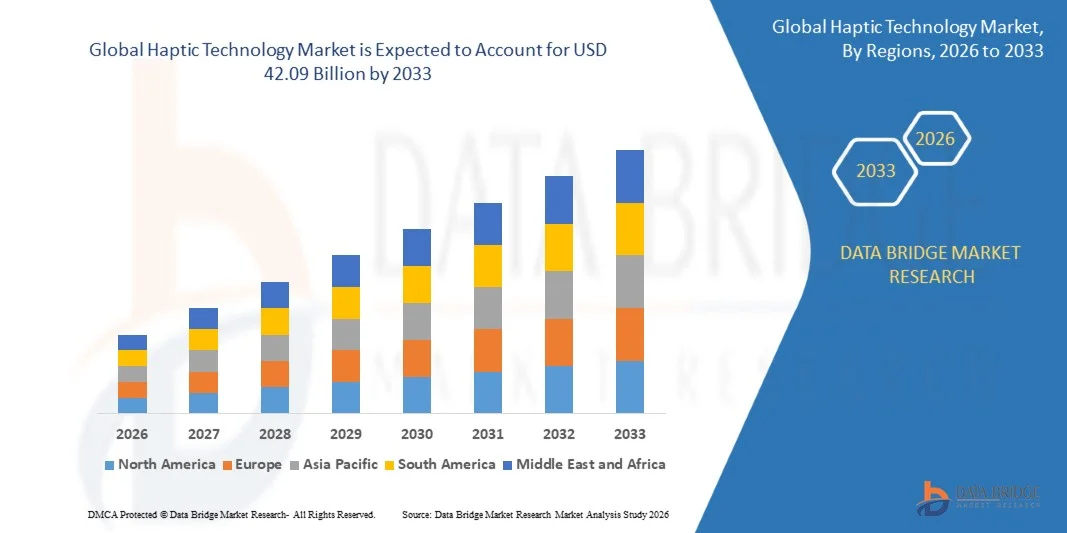
Le marché de la technologie haptique a été évalué à14,05 milliards de dollars en 2025et devrait atteindre42,09 milliards de dollars avant 2033, croissance à unTCAC de 14,70 % de 2026 à 2033. Le marché connaît une croissance constante due à la demande croissante d'expériences utilisateur immersives, à l'adoption croissante de smartphones et d'appareils portables et à l'expansion rapide des écosystèmes AR/VR et des jeux. Les progrès réalisés dans les technologies d'actionnement, les logiciels haptiques intégrés à l'IA et les systèmes de retour d'information sur les forces appuient davantage l'expansion du marché dans les domaines de l'électronique grand public, de l'automobile, des soins de santé et des applications industrielles.
L'évolution mondiale croissante vers l'amélioration de l'interaction homme-machine, combinée à l'intégration croissante des systèmes de rétroaction tactile dans les appareils numériques, remodele de façon significative les technologies d'interface utilisateur. La demande croissante d'environnements de simulation réalistes dans les systèmes de jeu, de formation médicale et d'infodivertissement automobile accélère encore l'adoption. En outre, l'innovation continue par des entreprises technologiques de premier plan dans des composants haptiques miniaturisés et économes en énergie renforce les perspectives de croissance du marché à long terme.
Principales tendances et perspectives du marché
- L'Asie-Pacifique a dominé le marché de la technologie haptique avec la plus grande part des revenus de 42 % en 2025, soutenue par la forte fabrication d'électronique grand public, l'adoption rapide de smartphones et l'expansion des écosystèmes de jeux et d'AR/VR
- Le segment de rétroaction tactile a mené le marché avec une part de 56,2% en 2025, entraîné par une utilisation généralisée dans les smartphones, écrans tactiles et appareils portables
- L'Amérique du Nord devrait être la région qui connaît la croissance la plus rapide avec un TCAC de 13,3 % de 2026 à 2033, alimenté par une forte demande d'expériences de jeu immersifs, de technologies AR/VR et d'interfaces automobiles de pointe.
- Le jeu est le type d'application qui connaît la croissance la plus rapide, projeté pour enregistrer un TCAC de 16,1% de 2026 à 2033, soutenu par une demande croissante d'expériences de jeu immersifs et de systèmes de rétroaction sensorielle réalistes
- Le segment électronique grand public a dominé la catégorie d'applications avec une part des revenus de 44,7 % en 2025, menée par l'intégration généralisée de la rétroaction haptique dans les smartphones, tablettes, portables et appareils intelligents
- Les actuateurs représentaient 38,4% du marché en 2025, préféré par son rôle critique dans la conversion des signaux électriques en réponses tactiles physiques à travers les appareils
- Le segment de rétroaction de la force est la catégorie de rétroaction qui augmente le plus rapidement, avec un TCAC de 15,3% entre 2026 et 2033, sous l'effet de la demande croissante d'expériences de simulation hautement immersives et réalistes.
Taille du marché et prévisions
- Valeur marchande mondiale (2025): 14,05 milliards de dollars
- Valeur marchande prévue (2033) : 42,09 milliards de dollars
- Prévisions TCAC (2026-2033): 14,70%
- Région phare en 2025: Asie-Pacifique
- Région de croissance la plus rapide : Amérique du Nord
Portée du rapport et marché des technologies haptiquesSegmentation
|
Attributs |
Clé technologique haptiquePerspectives du marché |
|
Segments couverts |
|
|
Pays couverts |
Amérique du Nord · États-Unis · Canada · Mexique Europe · Allemagne · France · Royaume-Uni · Pays-Bas · Suisse · Belgique · Russie · Italie · Espagne · Turquie · Reste de l'Europe Asie-Pacifique · Chine · Japon · Inde · Corée du Sud · Singapour · Malaisie · Australie · Thaïlande · Indonésie · Philippines · Reste de l'Asie-Pacifique Moyen-Orient et Afrique · Arabie saoudite · U.A.E. · Afrique du Sud · Égypte · Israël · Reste du Moyen-Orient et de l'Afrique Amérique du Sud · Brésil · Argentine · Reste de l'Amérique du Sud |
|
Principaux acteurs du marché |
·Pomme Inc.(États-Unis) ·Google LLC(États-Unis) · HAPTION SA (États-Unis) ·Immersion(États-Unis) · 3D Systems, Inc. (États-Unis) · Nuance Communications, Inc. (États-Unis) · NOVASENTIS, INC. (États-Unis) · Ultraleap Limited (Royaume-Uni) ·Qualcomm Technologies Inc.(États-Unis) · ALPS ALPINE CO., LTD. (Japon) ·SAMSUNG(Corée du Sud) · Panasonic Corporation (Japon) · Alpine Electronics Inc. (Japon) · semi-conducteurs NXP (Pays-Bas) · Polaris Industries, Inc. (États-Unis) · FeliCa Networks, Inc. (Japon) · CCL Industries (Canada) · LINTEC Corporation (Japon) · Robert Bosch GmbH (Allemagne) · Telefonaktiebolaget LM Ericsson (Suède) |
|
Possibilités de marché |
· Extension des haptiques dans les systèmes d'infodivertissement et de sécurité automobiles · Croissance des applications haptiques dans la simulation de soins de santé et la formation chirurgicale · Accroître l'adoption de la technologie haptique dans le jeu et l'électronique portable |
|
Infos sur la valeur ajoutée |
Outre les perspectives du marché telles que la valeur du marché, le taux de croissance, les segments de marché, la couverture géographique, les acteurs du marché et le scénario du marché, le rapport de marché préparé par l'équipe de recherche sur le marché de Data Bridge comprend une analyse approfondie des experts, une analyse des importations et des exportations, une analyse des prix, une analyse de la consommation de production et une analyse des ravageurs. |
Tendances du marché des technologies haptiques
Tendance: Intégration croissante de la rétroaction haptique dans les AR/VR et les dispositifs immersifs
Les tendances du marché des technologies haptiques mettent en évidence l'intégration rapide des systèmes de rétroaction haptiques dans les casques AR/VR, les contrôleurs de jeu et les dispositifs numériques immersifs pour améliorer le réalisme et l'interaction des utilisateurs. La demande d'expériences d'immersion grâce au tact augmente à travers les applications de jeu, de simulation et d'entraînement, où le mouvement précis et la rétroaction tactile améliorent considérablement l'engagement. Les progrès dans les servomoteurs ultracompacts, les haptiques ultrasoniques et les systèmes de rétroaction portables accélèrent encore l'adoption dans les appareils de nouvelle génération.
Des entreprises telles qu'Ultraleap Limited et Apple Inc. développent activement des interfaces AR/VR perfectionnées, y compris des systèmes d'interaction spatiale et gestuelle qui améliorent les environnements numériques immersifs.
Dynamique du marché des technologies haptiques
Principal moteur du marché : augmentation de la demande de systèmes améliorés d'interface homme-machine
Le besoin croissant d'une interaction intuitive et immersive entre l'homme et la machine conduit de façon significative le marché de la technologie haptique, en particulier à travers les smartphones, les interfaces automobiles, les systèmes de jeu et les simulateurs de soins de santé. La rétroaction haptique améliore l'expérience utilisateur en fournissant des réponses tactiles réalistes dans les environnements numériques, en améliorant la précision, la convivialité et l'engagement. L'adoption croissante d'interfaces tactiles dans les systèmes électroniques grand public et d'infodivertissement automobile renforce encore la demande du marché.
De grandes entreprises comme Immersion Corporation et Qualcomm Technologies Inc développent des solutions haptiques avancées intégrées aux appareils mobiles et aux plateformes automobiles afin d'améliorer la réactivité et la qualité des interactions entre les applications.
Principales contraintes et défis : coûts de développement élevés et limites de la consommation d'énergie
Les coûts de développement élevés et les besoins accrus en matière de consommation d'énergie demeurent un défi majeur sur le marché de la technologie haptique, en particulier pour les systèmes avancés de rétroactivité de la force et les actuateurs de haute précision. L'intégration matérielle complexe, les contraintes de miniaturisation et la demande de puissance continue dans les appareils portables et mobiles limitent l'adoption à grande échelle. De plus, l'équilibre des performances avec l'efficacité énergétique demeure un défi majeur pour les fabricants.
Des entreprises comme ALPS ALPINE CO., LTD. et NOVASENTIS, INC. se concentrent sur les conceptions d'actionneurs de faible puissance et les pilotes haptiques optimisés pour répondre aux contraintes d'efficacité tout en maintenant les performances dans les appareils électroniques compacts.
Opportunité de marché clé : Expansion des haptiques dans les systèmes d'infodivertissement et de sécurité automobiles
L'expansion de la technologie haptique dans les systèmes d'infodivertissement et de sécurité de l'automobile représente une opportunité de croissance importante pour le marché, en raison de la demande croissante de systèmes avancés d'assistance au conducteur (ADAS) et d'interfaces de véhicules intuitives. La rétroaction haptique est largement intégrée aux écrans tactiles, aux commandes de direction et aux interfaces du tableau de bord pour réduire la distraction du conducteur et améliorer la sécurité. Les constructeurs automobiles adoptent de plus en plus des systèmes d'avertissement tactiles pour la navigation, l'assistance aux voies et les alertes de collision.
Des entreprises telles que Google LLC et Apple Inc. font progresser les technologies d'interface embarquée par le biais de plates-formes de cockpit numériques et de systèmes de rétroaction haptiques intégrés, soutenant l'évolution des écosystèmes de véhicules intelligents et connectés.
Portée du marché des technologies haptiques
Le marché de la technologie haptique est segmenté sur la base de composants, de rétroaction, d'applications.
- Par composante
Sur la base de la composante, le marché de la technologie haptique est segmenté en microcontrôleurs, pilotes, actionneurs, logiciels, etc. Le segment des actuateurs a dominé le marché avec la plus grande part de 38,4% en 2025, en raison de son rôle essentiel dans la conversion des signaux électriques en réponses tactiles physiques entre les appareils. Une forte adoption dans les smartphones, les contrôleurs de jeu, les interfaces automobiles et les appareils portables soutient une demande soutenue. Les progrès continus dans la miniaturisation et la conception d'actionneurs économes en énergie améliorent encore la performance et la capacité d'intégration. Le déploiement croissant d'interfaces utilisateur immersives dans l'électronique grand public continue de renforcer la domination du segment.
Le segment des logiciels devrait enregistrer la croissance la plus rapide à un TCAC de 14,6 % de 2026 à 2033, en raison de la demande croissante de systèmes avancés de personnalisation de la rétroaction haptique et de contrôle sensoriel en temps réel. L'intégration croissante des logiciels haptiques pilotés par l'IA aux plateformes AR/VR et aux écosystèmes de jeu améliore l'immersion et la réactivité des utilisateurs. L'utilisation accrue des plates-formes de simulation haptique et SDK basées sur le cloud favorise l'adoption des développeurs. De plus en plus l'accent mis sur les expériences tactiles personnalisées dans les applications automobiles et de soins de santé accélère l'expansion du segment.
- Par retour d'information
Sur la base de la rétroaction, le marché des technologies haptiques est segmenté en rétroaction tactile et force la rétroaction. Le segment Tactile Feedback a dominé le marché avec une part de 56,2% en 2025, entraîné par une utilisation généralisée dans les smartphones, les écrans tactiles et les appareils portables. Sa capacité à simuler les réponses sensorielles basées sur les vibrations à faible coût le rend très approprié pour l'électronique grand public. L'amélioration continue de la technologie des moteurs à vibrations et de la précision haptique favorise l'adoption. La demande croissante pour une interaction accrue des utilisateurs dans le jeu et les applications mobiles renforce sa position dominante.
Le segment Rétroaction de la Force devrait enregistrer la croissance la plus rapide à un TCAC de 15,3% entre 2026 et 2033, en raison de la demande croissante d'expériences de simulation hautement immersives et réalistes. L'expansion de l'utilisation dans les contrôleurs de jeu, les systèmes de simulation chirurgicale et les interfaces conducteur-assistant automobile stimule l'adoption. Les progrès des systèmes d'actionnement robotique et de contrôle de précision améliorent la précision et le réalisme de la réponse. Les investissements croissants dans les écosystèmes AR/VR et les simulateurs de formation avancée accélèrent encore la croissance du segment.
- Par demande
Sur la base de l'application, le marché des technologies haptiques est segmenté dans l'automobile et le transport, l'électronique grand public, l'éducation et la recherche, le jeu, la santé, l'ingénierie, etc. Le segment de Consumer Electronics a dominé le marché avec la plus grande part de 44,7 % en 2025, grâce à l'intégration généralisée de la rétroaction haptique dans les smartphones, tablettes, portables et appareils intelligents. La demande croissante des consommateurs pour des interfaces utilisateur immersives et interactives favorise l'adoption. L'innovation continue par les principaux fabricants d'appareils dans l'amélioration des expériences basées sur le toucher renforce la pénétration du marché. L'expansion des expéditions mondiales de smartphones continue de renforcer le leadership du segment.
Le segment des jeux devrait enregistrer la croissance la plus rapide à un TCAC de 16,1% entre 2026 et 2033, en raison de la demande croissante d'expériences de jeux immersifs et de systèmes de rétroaction sensorielles réalistes. L'adoption croissante de casques VR, de contrôleurs avancés et de systèmes de jeu basés sur le mouvement améliore considérablement l'engagement des utilisateurs. L'augmentation des investissements des sociétés de jeu dans les écosystèmes AR/VR et les consoles de prochaine génération accélère les progrès technologiques. L'expansion de la popularité des e-sports et des plateformes de divertissement interactives favorise l'expansion rapide du segment.
Analyse régionale du marché des technologies haptiques
L'Asie-Pacifique a dominé le marché de la technologie haptique et a représenté la plus grande part des revenus de 42 % en 2025, soutenue par la forte fabrication d'électroniques grand public, l'adoption rapide de smartphones et l'expansion des écosystèmes de jeux et de RA/VR. La région bénéficie de capacités de production à grande échelle dans des pays comme la Chine, la Corée du Sud et le Japon, qui accueillent de grands fabricants et fournisseurs de composants qui stimulent l'innovation dans les modules et les actuateurs haptiques. La demande croissante d'interfaces utilisateur immersives dans les appareils de jeu, les systèmes d'infodivertissement automobile et l'électronique portable accélère encore l'expansion du marché régional. En outre, l'augmentation des investissements dans la R-D électronique de pointe et l'intégration des semi-conducteurs renforce le leadership de l'Asie-Pacifique dans le domaine des technologies haptiques mondiales.
Chine Aperçu du marché des technologies haptiques
La Chine détenait la plus grande part du marché de la technologie haptique Asie-Pacifique en 2025, en raison de sa position dominante dans la fabrication d'électroniques grand public et de la forte présence de producteurs de smartphones et d'appareils de jeu. Le pays bénéficie d'une importante production de composants haptiques tels que des actionneurs et des microcontrôleurs, qui soutiennent l'intégration à grande échelle dans les appareils mobiles et les portables intelligents. L'expansion rapide des applications AR/VR et l'augmentation des investissements des entreprises technologiques nationales dans les technologies immersives stimulent encore la demande. En outre, de solides capacités d'exportation dans la fabrication d'électronique renforcent le leadership de la Chine dans les chaînes mondiales d'approvisionnement en technologie haptique.
Inde Aperçu du marché des technologies haptiques
L'Inde connaît la croissance la plus rapide dans la région Asie-Pacifique, sous l'effet de la pénétration croissante des smartphones, de l'expansion de l'industrie du jeu et de l'adoption croissante de plateformes d'apprentissage numérique et d'AR/VR. La demande croissante des consommateurs pour des smartphones abordables avec des fonctionnalités de rétroaction tactile avancées soutient l'expansion du marché. Le pays investit également de plus en plus dans la fabrication d'électronique dans le cadre d'initiatives gouvernementales visant à promouvoir la production locale. De plus, l'utilisation croissante des applications haptiques dans l'éducation, l'infodivertissement automobile et la simulation des soins de santé accélère la croissance du marché à long terme.
Perspectives du marché européen des technologies haptiques
Le marché européen des technologies haptiques est en pleine expansion, soutenu par une forte adoption dans les systèmes automobiles, l'automatisation industrielle, la simulation de soins de santé et l'électronique grand public. La demande croissante de systèmes avancés d'assistance au conducteur et d'interfaces d'infodivertissement immersives dans les véhicules entraîne une intégration haptique significative. La région bénéficie également de solides activités de R-D dans les domaines de la robotique, des systèmes de formation médicale et des applications AR/VR. De plus, l'accent croissant mis sur l'ingénierie de précision et l'amélioration de l'expérience utilisateur favorise l'adoption dans plusieurs industries d'utilisation finale.
Allemagne Aperçu du marché des technologies haptiques
En 2025, l'Allemagne a représenté la plus grande part du marché européen de la technologie haptique, grâce à une forte production automobile et à des capacités d'ingénierie avancées. Le pays est un centre clé pour l'intégration des systèmes de rétroaction haptique dans les tableaux de bord, les systèmes de direction et les applications de sécurité des véhicules afin d'améliorer l'interaction avec les conducteurs. L'adoption croissante des technologies de l'industrie 4.0 et de la robotique dans le secteur manufacturier soutient davantage la demande de systèmes haptiques. En outre, des investissements importants dans l'innovation automobile et les technologies d'interface homme-machine renforcent la position de leader de l'Allemagne sur le marché régional.
Aperçu du marché des technologies haptiques au Royaume-Uni
Le marché britannique est soutenu par une demande croissante d'appareils de jeu haptiques, d'outils de simulation de soins de santé et de technologies portables de pointe. L'adoption croissante de systèmes de formation basés sur la RV dans les secteurs de l'éducation et de la défense stimule considérablement la croissance du marché. Le pays bénéficie également d'une industrie de jeu forte qui intègre des systèmes de rétroaction tactile avancés pour améliorer l'immersion des utilisateurs. En outre, les investissements croissants dans l'innovation numérique et les startups AR/VR soutiennent davantage l'expansion des applications de la technologie haptique.
Aperçu du marché des technologies haptiques en Amérique du Nord
L'Amérique du Nord devrait croître à la vitesse la plus rapide de TCAC de 13,3 %, de 2026 à 2033, en raison de la forte demande d'expériences de jeu immersifs, de technologies AR/VR et d'interfaces automobiles de pointe. L'adoption croissante de systèmes haptiques dans la simulation des soins de santé, la robotique et les appareils portables accélère encore la croissance du marché régional. La région bénéficie d'une forte présence d'entreprises technologiques de premier plan et d'une innovation continue dans les systèmes d'interaction homme-machine. De plus, l'augmentation des investissements dans les plates-formes métaverses et les interfaces informatiques de la prochaine génération stimule considérablement la demande de technologies haptiques.
Aperçu du marché américain de la technologie haptique
Les États-Unis ont représenté la plus grande part du marché nord-américain de la technologie haptique en 2025, grâce à la forte présence d'entreprises technologiques de premier plan et à des capacités de R-D de pointe dans les secteurs de l'AR/VR, du jeu et de l'automobile. Une forte adoption de la rétroaction haptique dans les smartphones, les consoles de jeu et les appareils portables conduit à une demande soutenue. Le pays bénéficie également de l'expansion rapide des systèmes de formation immersifs dans les applications de santé et de défense. De plus, l'innovation continue dans les interfaces utilisateur et les technologies d'interaction homme-machine axées sur l'IA renforce la position de leader des États-Unis sur le marché régional.
Part du marché de la technologie haptique
L'industrie de la technologie haptique est principalement dirigée par des entreprises bien établies, notamment :
- Apple Inc. (États-Unis)
- Google LLC (États-Unis)
- HAPTION SA (États-Unis)
- Immersion (États-Unis)
- 3D Systems, Inc. (États-Unis)
- Nuance Communications, Inc. (États-Unis)
- NOVASENTIS, INC. (États-Unis)
- Ultraleap Limited (Royaume-Uni)
- Qualcomm Technologies Inc (États-Unis)
- ALPS ALPINE CO., LTD. (Japon)
- SAMSUNG (Corée du Sud)
- Panasonic Corporation (Japon)
- Alpine Electronics Inc. (Japon)
- NXP Semiconductors (Pays-Bas)
- Polaris Industries, Inc. (États-Unis)
- FeliCa Networks, Inc. (Japon)
- CCL Industries (Canada)
- LINTEC Corporation (Japon)
- Robert Bosch GmbH (Allemagne)
- Telefonaktiebolaget LM Ericsson (Suède)
Les derniers développements du marché des technologies haptiques
- En janvier 2023, OnePlus a développé son expérience haptique par smartphone en intégrant l'actionneur haptique biométrique AAC Technologies, combinant l'acoustique, l'optique et les systèmes de vibration pour fournir une rétroaction tactile plus forte et plus précise. Ce développement améliore considérablement l'interaction utilisateur dans les smartphones en améliorant la précision des vibrations, la réactivité et l'expérience tactile immersive. Il renforce également le positionnement concurrentiel des fabricants de smartphones haut de gamme en accélérant l'adoption de modules haptiques avancés dans l'électronique grand public
- En décembre 2022, D-BOX Technologies s'est associé à Track Racer pour développer un châssis de jeu de feedback haptique haute fidélité capable de fournir quatre degrés de liberté. Cette collaboration améliore le marché du jeu immersif et de la simulation en permettant un mouvement plus réaliste et des systèmes de réponse tactile pour les environnements professionnels de jeu et de formation. Il soutient également l'expansion des écosystèmes matériels haptiques avancés dans l'infrastructure de jeu haut de gamme, malgré les coûts élevés des composants limitant l'adoption de masse
- En juin 2022, D-BOX Technologies Inc. et MILA ont conclu un partenariat stratégique pour intégrer l'intelligence artificielle dans les systèmes haptiques afin d'améliorer la performance et la productivité. Cette initiative a un impact important sur le marché en permettant des solutions de rétroaction haptiques plus intelligentes et adaptatives qui améliorent la précision dans les applications de simulation, de divertissement et industrielles. Il accélère également l'innovation dans les technologies sensorielles basées sur l'IA, améliorant l'efficacité et la personnalisation des expériences tactiles dans les industries d'utilisation finale
- En janvier 2022, AAC Technologies a lancé son moteur à actionnement linéaire ultra large conçu pour améliorer la performance haptique des smartphones et des appareils de réalité virtuelle. Ce développement améliore la dynamique du marché en offrant une intensité de vibration plus forte et une rétroaction tactile plus raffinée, comblant l'écart entre les environnements virtuels et la réponse sensorielle du monde réel. Elle renforce également la demande de technologies d'actionnement avancées dans les écosystèmes électroniques grand public et AR/VR
- En août 2021, Renesas Electronics Corporation a acquis Dialog Semiconductor PLC pour étendre son portefeuille de solutions de technologie haptique, de traitement intégré et de connectivité. Cette acquisition a eu un impact significatif sur le marché en renforçant les capacités de Renesas dans les solutions haptiques intégrées pour les applications automobiles et électroniques grand public. Il a également permis une intégration plus large des produits dans les systèmes de rétroéclairage LED et les systèmes haptiques, favorisant l'innovation dans les technologies d'interface homme-machine et accélérant la consolidation de l'industrie
SKU-
Accédez en ligne au rapport sur le premier cloud mondial de veille économique

- Tableau de bord d'analyse de données interactif
- Tableau de bord d'analyse d'entreprise pour les opportunités à fort potentiel de croissance
- Accès d'analyste de recherche pour la personnalisation et les requêtes
- Analyse de la concurrence avec tableau de bord interactif
- Dernières actualités, mises à jour et analyse des tendances
- Exploitez la puissance de l'analyse comparative pour un suivi complet de la concurrence
Table des matières
1 INTRODUCTION
1.1 OBJECTIVES OF THE STUDY
1.2 MARKET DEFINITION
1.3 OVERVIEW OF GLOBAL HAPTIC TECHNOLOGY MARKET
1.4 CURRENCY AND PRICING
1.5 LIMITATION
1.6 MARKETS COVERED
2 MARKET SEGMENTATION
2.1 KEY TAKEAWAYS
2.2 ARRIVING AT THE GLOBAL HAPTIC TECHNOLOGY MARKET
2.2.1 VENDOR POSITIONING GRID
2.2.2 TECHNOLOGY LIFE LINE CURVE
2.2.3 MARKET GUIDE
2.2.4 COMPANY MARKET SHARE ANALYSIS
2.2.5 MULTIVARIATE MODELLING
2.2.6 TOP TO BOTTOM ANALYSIS
2.2.7 VENDOR SHARE ANALYSIS
2.2.8 DATA POINTS FROM KEY PRIMARY INTERVIEWS
2.2.9 DATA POINTS FROM KEY SECONDARY DATABASES
2.3 GLOBAL HAPTIC TECHNOLOGY MARKET: RESEARCH SNAPSHOT
2.4 ASSUMPTIONS
3 MARKET OVERVIEW
3.1 DRIVERS
3.2 RESTRAINTS
3.3 OPPORTUNITIES
3.4 CHALLENGES
4 EXECUTIVE SUMMARY
5 PREMIUM INSIGHTS
5.1 TECHNOLOGY ANALYSIS
5.2 PORTER’S FIVE FORCES MODEL
5.3 REGULATORY LANDSCAPE
6 GLOBAL HAPTIC TECHNOLOGY MARKET, BY COMPONENT
6.1 OVERVIEW
6.2 HARDWARE
6.3 ACTUATORS
6.3.1 ECCENTRIC ROTATING MASS (ERM) AND LINEAR RESONANT ACTUATORS (LRAS)
6.3.2 PIEZOELECTRIC ACTUATORS
6.4 DRIVERS AND MICROCONTROLLERS
6.5 SOFTWARE
7 GLOBAL HAPTIC TECHNOLOGY MARKET, BY FEEDBACK TYPE
7.1 OVERVIEW
7.2 FORCE
7.3 TACTILE
8 GLOBAL HAPTIC TECHNOLOGY MARKET, BY TECHNOLOGY
8.1 OVERVIEW
8.2 CAPTIVE
8.3 RESISTIVE
8.4 OTHERS
9 GLOBAL HAPTIC TECHNOLOGY MARKET, BY APPLICATION
9.1 OVERVIEW
9.2 CONSUMER DEVICES
9.3 BY COMPONENT
9.3.1 HARDWARE
9.3.2 SOFTWARE
9.4 BY TYPE
9.4.1 SMARTPHONES, TABLETS, AND SMARTWATCHES
9.4.2 AUGMENTED REALITY (AR) & VIRTUAL REALITY (VR) AND GAMING DEVICES
9.4.3 OTHERS
9.5 AUTOMOTIVE & TRANSPORTATION
9.6 BY COMPONENT
9.6.1 HARDWARE
9.6.2 SOFTWARE
9.7 EDUCATION & RESEARCH
9.8 BY COMPONENT
9.8.1 HARDWARE
9.8.2 SOFTWARE
9.9 HEALTHCARE
9.1 BY COMPONENT
9.10.1 HARDWARE
9.10.2 SOFTWARE
9.11 INDUSTRIAL
9.12 BY COMPONENT
9.12.1 HARDWARE
9.12.2 SOFTWARE
9.13 OTHERS
10 GLOBAL HAPTIC TECHNOLOGY MARKET, BY GEOGRAPHY
10.1 GLOBAL HAPTIC TECHNOLOGY MARKET, (ALL SEGMENTATION PROVIDED ABOVE IS REPRESENTED IN THIS CHAPTER BY COUNTRY)
10.1.1 NORTH AMERICA
10.1.1.1. U.S.
10.1.1.2. CANADA
10.1.1.3. MEXICO
10.1.2 EUROPE
10.1.2.1. GERMANY
10.1.2.2. FRANCE
10.1.2.3. U.K.
10.1.2.4. ITALY
10.1.2.5. SPAIN
10.1.2.6. RUSSIA
10.1.2.7. TURKEY
10.1.2.8. BELGIUM
10.1.2.9. NETHERLANDS
10.1.2.10. SWITZERLAND
10.1.2.11. REST OF EUROPE
10.1.3 ASIA PACIFIC
10.1.3.1. JAPAN
10.1.3.2. CHINA
10.1.3.3. SOUTH KOREA
10.1.3.4. INDIA
10.1.3.5. AUSTRALIA
10.1.3.6. SINGAPORE
10.1.3.7. THAILAND
10.1.3.8. MALAYSIA
10.1.3.9. INDONESIA
10.1.3.10. PHILIPPINES
10.1.3.11. REST OF ASIA PACIFIC
10.1.4 SOUTH AMERICA
10.1.4.1. BRAZIL
10.1.4.2. ARGENTINA
10.1.4.3. REST OF SOUTH AMERICA
10.1.5 MIDDLE EAST AND AFRICA
10.1.5.1. SOUTH AFRICA
10.1.5.2. EGYPT
10.1.5.3. SAUDI ARABIA
10.1.5.4. U.A.E
10.1.5.5. ISRAEL
10.1.5.6. REST OF MIDDLE EAST AND AFRICA
10.2 KEY PRIMARY INSIGHTS: BY MAJOR COUNTRIES
11 GLOBAL HAPTIC TECHNOLOGY MARKET, COMPANY LANDSCAPE
11.1 COMPANY SHARE ANALYSIS: GLOBAL
11.2 COMPANY SHARE ANALYSIS: NORTH AMERICA
11.3 COMPANY SHARE ANALYSIS: EUROPE
11.4 COMPANY SHARE ANALYSIS: ASIA PACIFIC
11.5 MERGERS & ACQUISITIONS
11.6 NEW PRODUCT DEVELOPMENT AND APPROVALS
11.7 EXPANSIONS
11.8 REGULATORY CHANGES
11.9 PARTNERSHIP AND OTHER STRATEGIC DEVELOPMENTS
12 GLOBAL HAPTIC TECHNOLOGY MARKET, SWOT & DBMR ANALYSIS
13 GLOBAL HAPTIC TECHNOLOGY MARKET, COMPANY PROFILE
13.1 TEXAS INSTRUMENTS
13.1.1 COMPANY SNAPSHOT
13.1.2 REVENUE ANALYSIS
13.1.3 GEOGRAPHIC PRESENCE
13.1.4 PRODUCT PORTFOLIO
13.1.5 RECENT DEVELOPMENTS
13.2 JOHNSON ELECTRIC
13.2.1 COMPANY SNAPSHOT
13.2.2 REVENUE ANALYSIS
13.2.3 GEOGRAPHIC PRESENCE
13.2.4 PRODUCT PORTFOLIO
13.2.5 RECENT DEVELOPMENTS
13.3 AAC TECHNOLOGIES
13.3.1 COMPANY SNAPSHOT
13.3.2 REVENUE ANALYSIS
13.3.3 GEOGRAPHIC PRESENCE
13.3.4 PRODUCT PORTFOLIO
13.3.5 RECENT DEVELOPMENTS
13.4 TDK
13.4.1 COMPANY SNAPSHOT
13.4.2 REVENUE ANALYSIS
13.4.3 GEOGRAPHIC PRESENCE
13.4.4 PRODUCT PORTFOLIO
13.4.5 RECENT DEVELOPMENTS
13.5 MICROCHIP TECHNOLOGY
13.5.1 COMPANY SNAPSHOT
13.5.2 REVENUE ANALYSIS
13.5.3 GEOGRAPHIC PRESENCE
13.5.4 PRODUCT PORTFOLIO
13.5.5 RECENT DEVELOPMENTS
13.6 IMMERSION
13.6.1 COMPANY SNAPSHOT
13.6.2 REVENUE ANALYSIS
13.6.3 GEOGRAPHIC PRESENCE
13.6.4 PRODUCT PORTFOLIO
13.6.5 RECENT DEVELOPMENTS
13.7 ON SEMICONDUCTOR
13.7.1 COMPANY SNAPSHOT
13.7.2 REVENUE ANALYSIS
13.7.3 GEOGRAPHIC PRESENCE
13.7.4 PRODUCT PORTFOLIO
13.7.5 RECENT DEVELOPMENTS
13.8 PRECISION MICRODRIVES
13.8.1 COMPANY SNAPSHOT
13.8.2 REVENUE ANALYSIS
13.8.3 GEOGRAPHIC PRESENCE
13.8.4 PRODUCT PORTFOLIO
13.8.5 RECENT DEVELOPMENTS
13.9 SYNAPTICS
13.9.1 COMPANY SNAPSHOT
13.9.2 REVENUE ANALYSIS
13.9.3 GEOGRAPHIC PRESENCE
13.9.4 PRODUCT PORTFOLIO
13.9.5 RECENT DEVELOPMENTS
13.1 ULTRALEAP
13.10.1 COMPANY SNAPSHOT
13.10.2 REVENUE ANALYSIS
13.10.3 GEOGRAPHIC PRESENCE
13.10.4 PRODUCT PORTFOLIO
13.10.5 RECENT DEVELOPMENTS
13.11 AITO BV
13.11.1 COMPANY SNAPSHOT
13.11.2 REVENUE ANALYSIS
13.11.3 GEOGRAPHIC PRESENCE
13.11.4 PRODUCT PORTFOLIO
13.11.5 RECENT DEVELOPMENTS
13.12 ALPS ALPINE
13.12.1 COMPANY SNAPSHOT
13.12.2 REVENUE ANALYSIS
13.12.3 GEOGRAPHIC PRESENCE
13.12.4 PRODUCT PORTFOLIO
13.12.5 RECENT DEVELOPMENTS
13.13 CIRRUS LOGIC
13.13.1 COMPANY SNAPSHOT
13.13.2 REVENUE ANALYSIS
13.13.3 GEOGRAPHIC PRESENCE
13.13.4 PRODUCT PORTFOLIO
13.13.5 RECENT DEVELOPMENTS
13.14 DIALOG SEMICONDUCTOR
13.14.1 COMPANY SNAPSHOT
13.14.2 REVENUE ANALYSIS
13.14.3 GEOGRAPHIC PRESENCE
13.14.4 PRODUCT PORTFOLIO
13.14.5 RECENT DEVELOPMENTS
13.15 HAP2U
13.15.1 COMPANY SNAPSHOT
13.15.2 REVENUE ANALYSIS
13.15.3 GEOGRAPHIC PRESENCE
13.15.4 PRODUCT PORTFOLIO
13.15.5 RECENT DEVELOPMENTS
13.16 INFINEON
13.16.1 COMPANY SNAPSHOT
13.16.2 REVENUE ANALYSIS
13.16.3 GEOGRAPHIC PRESENCE
13.16.4 PRODUCT PORTFOLIO
13.16.5 RECENT DEVELOPMENTS
13.17 JINLONG MACHINERY & ELECTRONICS
13.17.1 COMPANY SNAPSHOT
13.17.2 REVENUE ANALYSIS
13.17.3 GEOGRAPHIC PRESENCE
13.17.4 PRODUCT PORTFOLIO
13.17.5 RECENT DEVELOPMENTS
13.18 NIDEC
13.18.1 COMPANY SNAPSHOT
13.18.2 REVENUE ANALYSIS
13.18.3 GEOGRAPHIC PRESENCE
13.18.4 PRODUCT PORTFOLIO
13.18.5 RECENT DEVELOPMENTS
13.19 SMK CORPORATION
13.19.1 COMPANY SNAPSHOT
13.19.2 REVENUE ANALYSIS
13.19.3 GEOGRAPHIC PRESENCE
13.19.4 PRODUCT PORTFOLIO
13.19.5 RECENT DEVELOPMENTS
13.2 TACTUS TECHNOLOGY INC.
13.20.1 COMPANY SNAPSHOT
13.20.2 REVENUE ANALYSIS
13.20.3 GEOGRAPHIC PRESENCE
13.20.4 PRODUCT PORTFOLIO
13.20.5 RECENT DEVELOPMENTS
13.21 HAPTION
13.21.1 COMPANY SNAPSHOT
13.21.2 REVENUE ANALYSIS
13.21.3 GEOGRAPHIC PRESENCE
13.21.4 PRODUCT PORTFOLIO
13.21.5 RECENT DEVELOPMENTS
13.22 FORCE DIMENSION
13.22.1 COMPANY SNAPSHOT
13.22.2 REVENUE ANALYSIS
13.22.3 GEOGRAPHIC PRESENCE
13.22.4 PRODUCT PORTFOLIO
13.22.5 RECENT DEVELOPMENTS
13.23 3D SYSTEMS, INC.
13.23.1 COMPANY SNAPSHOT
13.23.2 REVENUE ANALYSIS
13.23.3 GEOGRAPHIC PRESENCE
13.23.4 PRODUCT PORTFOLIO
13.23.5 RECENT DEVELOPMENTS
13.24 SENSEG OY
13.24.1 COMPANY SNAPSHOT
13.24.2 REVENUE ANALYSIS
13.24.3 GEOGRAPHIC PRESENCE
13.24.4 PRODUCT PORTFOLIO
13.24.5 RECENT DEVELOPMENTS
13.25 IMAGIS
13.25.1 COMPANY SNAPSHOT
13.25.2 REVENUE ANALYSIS
13.25.3 GEOGRAPHIC PRESENCE
13.25.4 PRODUCT PORTFOLIO
13.25.5 RECENT DEVELOPMENTS
13.26 DENSITRON TECHNOLOGIES LTD
13.26.1 COMPANY SNAPSHOT
13.26.2 REVENUE ANALYSIS
13.26.3 GEOGRAPHIC PRESENCE
13.26.4 PRODUCT PORTFOLIO
13.26.5 RECENT DEVELOPMENTS
13.27 CAMAR
13.27.1 COMPANY SNAPSHOT
13.27.2 REVENUE ANALYSIS
13.27.3 GEOGRAPHIC PRESENCE
13.27.4 PRODUCT PORTFOLIO
13.27.5 RECENT DEVELOPMENTS
13.28 CYPRESS SEMICONDUCTOR CORPORATION
13.28.1 COMPANY SNAPSHOT
13.28.2 REVENUE ANALYSIS
13.28.3 GEOGRAPHIC PRESENCE
13.28.4 PRODUCT PORTFOLIO
13.28.5 RECENT DEVELOPMENTS
13.29 ULTRAHAPTIC
13.29.1 COMPANY SNAPSHOT
13.29.2 REVENUE ANALYSIS
13.29.3 GEOGRAPHIC PRESENCE
13.29.4 PRODUCT PORTFOLIO
13.29.5 RECENT DEVELOPMENTS
13.3 SAMSUNG ELECTRONICS
13.30.1 COMPANY SNAPSHOT
13.30.2 REVENUE ANALYSIS
13.30.3 GEOGRAPHIC PRESENCE
13.30.4 PRODUCT PORTFOLIO
13.30.5 RECENT DEVELOPMENTS
*NOTE: THE COMPANIES PROFILED IS NOT EXHAUSTIVE LIST AND IS AS PER OUR PREVIOUS CLIENT REQUIREMENT. WE PROFILE MORE THAN 100 COMPANIES IN OUR STUDY AND HENCE THE LIST OF COMPANIES CAN BE MODIFIED OR REPLACED ON REQUEST
14 CONCLUSION
15 RELATED REPORTS
16 sur les études de marché des ponts de données
Méthodologie de recherche
La collecte de données et l'analyse de l'année de base sont effectuées à l'aide de modules de collecte de données avec des échantillons de grande taille. L'étape consiste à obtenir des informations sur le marché ou des données connexes via diverses sources et stratégies. Elle comprend l'examen et la planification à l'avance de toutes les données acquises dans le passé. Elle englobe également l'examen des incohérences d'informations observées dans différentes sources d'informations. Les données de marché sont analysées et estimées à l'aide de modèles statistiques et cohérents de marché. De plus, l'analyse des parts de marché et l'analyse des tendances clés sont les principaux facteurs de succès du rapport de marché. Pour en savoir plus, veuillez demander un appel d'analyste ou déposer votre demande.
La méthodologie de recherche clé utilisée par l'équipe de recherche DBMR est la triangulation des données qui implique l'exploration de données, l'analyse de l'impact des variables de données sur le marché et la validation primaire (expert du secteur). Les modèles de données incluent la grille de positionnement des fournisseurs, l'analyse de la chronologie du marché, l'aperçu et le guide du marché, la grille de positionnement des entreprises, l'analyse des brevets, l'analyse des prix, l'analyse des parts de marché des entreprises, les normes de mesure, l'analyse globale par rapport à l'analyse régionale et des parts des fournisseurs. Pour en savoir plus sur la méthodologie de recherche, envoyez une demande pour parler à nos experts du secteur.
Personnalisation disponible
Data Bridge Market Research est un leader de la recherche formative avancée. Nous sommes fiers de fournir à nos clients existants et nouveaux des données et des analyses qui correspondent à leurs objectifs. Le rapport peut être personnalisé pour inclure une analyse des tendances des prix des marques cibles, une compréhension du marché pour d'autres pays (demandez la liste des pays), des données sur les résultats des essais cliniques, une revue de la littérature, une analyse du marché des produits remis à neuf et de la base de produits. L'analyse du marché des concurrents cibles peut être analysée à partir d'une analyse basée sur la technologie jusqu'à des stratégies de portefeuille de marché. Nous pouvons ajouter autant de concurrents que vous le souhaitez, dans le format et le style de données que vous recherchez. Notre équipe d'analystes peut également vous fournir des données sous forme de fichiers Excel bruts, de tableaux croisés dynamiques (Fact book) ou peut vous aider à créer des présentations à partir des ensembles de données disponibles dans le rapport.

