Global Industrial Display Market
Taille du marché en milliards USD
TCAC :
% 
 USD
5.30 Billion
USD
8.85 Billion
2022
2030
USD
5.30 Billion
USD
8.85 Billion
2022
2030
| 2023 –2030 | |
| USD 5.30 Billion | |
| USD 8.85 Billion | |
| % | |
Marché mondial de l'affichage industriel, par type (écrans robustes, moniteurs à cadre ouvert, écran multi-touch (P-Cap), écran avant, écran USB Type-C, écran SDI, écran à montage arrière, moniteurs à montage sur panneau, écrans marins, murs vidéo, autres), taille du panneau (jusqu'à 14 pouces, 14 pouces à 21 pouces, 21 à 40 pouces, 40 pouces et plus), technologie (LCD, LED, OLED, écran E-Paper), type de communication (série, Ethernet, réseau mobile, communication industrielle, RF/Zigbee/IR, Jason/MQTT, autres), application (IHM, application à distance, affichage interactif, signalisation numérique, imagerie), vertical (fabrication, énergie et électricité, militaire et avionique, pétrole et gaz, métaux et mines, transport, autres) - Tendances et prévisions de l'industrie jusqu'en 2030.
Analyse et taille du marché de l'affichage industriel
Les technologies d'affichage industriel ont connu des changements et une croissance remarquables au cours des dernières années. Elles ont contribué à la croissance des fonctionnalités avancées et de nouvelle génération telles que les grands pas de pixels de 1 mm, le toucher sensible et les solutions d'évolutivité infinie. L'OLED devrait être le segment technologique qui connaîtra la croissance la plus rapide au cours de la période de prévision en raison de ses propriétés uniques telles qu'une luminosité élevée, une faible consommation d'énergie et un rapport de contraste plus élevé des écrans OLED. À l'ère actuelle de la technologie numérique, ces écrans sont largement adoptés dans la publicité partout dans le monde au cours de la période de prévision.
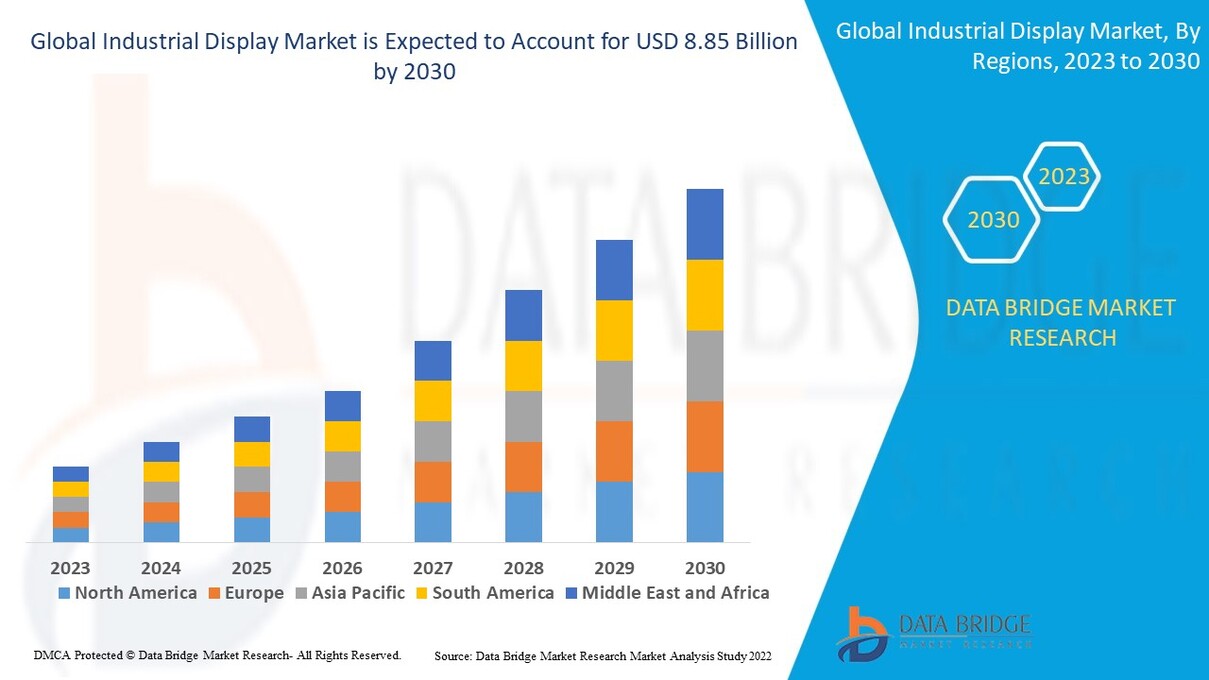
Français Data Bridge Market Research analyse que le marché de l'affichage industriel était évalué à 5,30 milliards USD en 2022 et devrait atteindre 8,85 milliards USD d'ici 2030, enregistrant un TCAC de 6,60 % au cours de la période de prévision de 2023 à 2030. En plus des informations sur les scénarios de marché tels que la valeur marchande, le taux de croissance, la segmentation, la couverture géographique et les principaux acteurs, les rapports de marché organisés par Data Bridge Market Research comprennent également une analyse approfondie des experts, une production et une capacité géographiquement représentées par l'entreprise, des configurations de réseau de distributeurs et de partenaires, une analyse détaillée et mise à jour des tendances des prix et une analyse des déficits de la chaîne d'approvisionnement et de la demande.
Portée et segmentation du marché de l'affichage industriel
|
Rapport métrique |
Détails |
|
Période de prévision |
2023 à 2030 |
|
Année de base |
2022 |
|
Années historiques |
2021 (personnalisable de 2015 à 2020) |
|
Unités quantitatives |
Chiffre d'affaires en milliards USD, volumes en unités, prix en USD |
|
Segments couverts |
Type (écrans robustes, moniteurs à cadre ouvert, écran multipoint tactile (P-Cap), écran avant, écran USB Type-C, écran SDI, écran à montage arrière, moniteurs à montage sur panneau, écrans marins, murs vidéo, autres), taille du panneau (jusqu'à 14 pouces, 14 pouces à 21 pouces, 21 à 40 pouces, 40 pouces et plus), technologie (écran LCD, LED, OLED, écran E-Paper), type de communication (série, Ethernet, réseau mobile, communication industrielle, RF/Zigbee/IR, Jason/MQTT, autres), application (IHM, application à distance, affichage interactif, signalisation numérique, imagerie), vertical (fabrication, énergie et électricité, militaire et avionique, pétrole et gaz, métaux et mines, transport, autres) |
|
Pays couverts |
États-Unis, Canada et Mexique en Amérique du Nord, Allemagne, France, Royaume-Uni, Pays-Bas, Suisse, Belgique, Russie, Italie, Espagne, Turquie, Reste de l'Europe en Europe, Chine, Japon, Inde, Corée du Sud, Singapour, Malaisie, Australie, Thaïlande, Indonésie, Philippines, Reste de l'Asie-Pacifique (APAC) en Asie-Pacifique (APAC), Arabie saoudite, Émirats arabes unis, Afrique du Sud, Égypte, Israël, Reste du Moyen-Orient et de l'Afrique (MEA) en tant que partie du Moyen-Orient et de l'Afrique (MEA), Brésil, Argentine et Reste de l'Amérique du Sud en tant que partie de l'Amérique du Sud |
|
Acteurs du marché couverts |
Samsung (Corée du Sud), LG Display (Corée du Sud), Panasonic Corporation Co, Ltd (Japon), Japan Display Inc (Japon), AUO Corporation (Taïwan), BOE Technology Group Co., Ltd (Chine), Corning Incorporated (États-Unis), DuPont (États-Unis), FlexEnable Limited (Royaume-Uni), Kateeva (États-Unis), SONY INDIA (Inde), Pioneer Corporation (Japon), WiseChip Semiconductor Inc. (Taïwan), WINSTAR Display Co., Ltd. (Chine), Visionox Company (Chine), SHARP CORPORATION (Japon), Innolux Corporation (Taïwan), RAYSTAR OPTRONICS, INC, (Taïwan), RITEK CORPORATION (Taïwan), OSRAM GmbH (Allemagne), Plessey (Royaume-Uni) |
|
Opportunités de marché |
|
Définition du marché
Un écran industriel est un ensemble de machines principalement utilisées pour afficher des sorties numériques. Ces machines comprennent différents types d'écrans TFT, d'affichage numérique, de moniteurs et d'équipements similaires. Les écrans industriels sont conçus pour une durabilité accrue et pour résister à des situations environnementales difficiles telles que l'humidité, la poussière, la saleté, les températures extrêmes et autres dans les applications industrielles.
Dynamique du marché de l'affichage industriel
Conducteurs
- Accent accru sur la croissance et l'expansion
Les principaux acteurs du marché se concentrent principalement sur les produits d'affichage industriels innovants et nouveaux sur le marché et développent leurs capacités de production et leurs caractéristiques telles qu'un rapport de contraste amélioré, une haute résolution, une lisibilité, une large plage de températures, une robustesse, une durabilité, une luminosité d'affichage plus élevée, une stabilité environnementale et une faible consommation d'énergie. Ces produits d'affichage industriels sont fabriqués de manière à contribuer au respect de directives strictes.
- Augmentation de la pénétration de l'Internet des objets
La pénétration croissante de la connectivité Internet parmi les consommateurs et la demande croissante d'informations en déplacement influencent davantage la croissance du marché à l'échelle mondiale. La révolution technologique devrait intégrer la portée d'Internet et la capacité de gérer directement l'infrastructure, les opérations et les machines des usines dans le monde entier. Le besoin d'appareils IHM a augmenté en raison de la croissance rapide des applications IoT, qui devrait alimenter la croissance du marché de l'affichage industriel.
Opportunités
- Réglementation croissante concernant la fabrication et la vente d'écrans industriels
Les réglementations concernant la fabrication et la vente au détail d'écrans industriels diffèrent selon les pays ou les régions. Par exemple, la loi de l'Union européenne sur la limitation de l'utilisation de substances dangereuses (RoHS) lors de la fabrication d'écrans industriels. Cette loi restreint l'utilisation du plomb, du mercure, du cadmium et du chrome hexavalent ainsi que des retardateurs de flamme, par exemple les polybromobiphényles (PBB) ou les polybromodiphényléthers (PBDE) dans les équipements électroniques.
- Lancements de nouveaux produits en plein essor
Les lancements de produits en plein essor des principaux acteurs du marché offrent également des opportunités de croissance lucratives sur le marché. Par exemple, l'aéroport international d'Orlando a installé 700 murs d'affichage vidéo qui fournissent des informations de vol actualisées. Ces écrans vidéo ont également fourni du contenu vidéo cinématographique dans le Grand Hall du système de navettes automatisé (APM). Cela a permis de fournir un contenu visuel pertinent aux passagers.
Contraintes/Défis
- Coût élevé associé aux écrans industriels
Le prix élevé des matières premières principalement utilisées pour la production d'écrans industriels devrait limiter la demande de ces écrans et entraver la croissance du marché. De plus, des investissements importants sont nécessaires pour installer des écrans industriels qui pourraient entraver la croissance du marché au cours de la période de prévision 2023-2030.
Ce rapport sur le marché de l'affichage industriel fournit des détails sur les nouveaux développements récents, les réglementations commerciales, l'analyse des importations et des exportations, l'analyse de la production, l'optimisation de la chaîne de valeur, la part de marché, l'impact des acteurs du marché national et local, les opportunités d'analyse en termes de poches de revenus émergentes, les changements dans la réglementation du marché, l'analyse stratégique de la croissance du marché, la taille du marché, la croissance du marché des catégories, les niches d'application et la domination, les approbations de produits, les lancements de produits, les expansions géographiques, les innovations technologiques sur le marché. Pour obtenir plus d'informations sur le marché de l'affichage industriel, contactez Data Bridge Market Research pour un briefing d'analyste, notre équipe vous aidera à prendre une décision de marché éclairée pour atteindre la croissance du marché.
Impact et scénario actuel du marché en cas de pénurie de matières premières et de retards d'expédition
Data Bridge Market Research propose une analyse de haut niveau du marché et fournit des informations en tenant compte de l'impact et de l'environnement actuel du marché en matière de pénurie de matières premières et de retards d'expédition. Cela se traduit par l'évaluation des possibilités stratégiques, la création de plans d'action efficaces et l'assistance aux entreprises dans la prise de décisions importantes.
Outre le rapport standard, nous proposons également une analyse approfondie du niveau d'approvisionnement à partir des retards d'expédition prévus, de la cartographie des distributeurs par région, de l'analyse des produits de base, de l'analyse de la production, des tendances de la cartographie des prix, de l'approvisionnement, de l'analyse des performances des catégories, des solutions de gestion des risques de la chaîne d'approvisionnement, de l'analyse comparative avancée et d'autres services d'approvisionnement et de soutien stratégique.
Impact du COVID-19 sur le marché de l'affichage industriel
L'épidémie de Covid-19 a considérablement entravé la croissance du marché des écrans industriels. Les nouveaux projets ont ralenti partout dans le monde, ce qui a considérablement affecté la demande d'écrans industriels. Les usines ont eu du mal à assembler et à fabriquer de nouveaux appareils dans le monde entier pendant cette pandémie. De plus, plusieurs entrepôts ne peuvent pas transporter d'écrans industriels en raison de règles strictes qui ont perturbé les unités de fabrication et d'approvisionnement pendant la pandémie. L'impact du COVID-19 est temporaire sur ce marché car seule la chaîne d'approvisionnement et la production sont bloquées. Une fois la situation redevenue normale, la demande, la production et les chaînes d'approvisionnement de ces produits vont progressivement augmenter.
Impact attendu du ralentissement économique sur les prix et la disponibilité des produits
Lorsque l'activité économique ralentit, les industries commencent à souffrir. Les effets prévus du ralentissement économique sur les prix et l'accessibilité des produits sont pris en compte dans les rapports d'analyse du marché et les services de renseignements fournis par DBMR. Grâce à cela, nos clients peuvent généralement garder une longueur d'avance sur leurs concurrents, projeter leurs ventes et leurs revenus et estimer leurs dépenses de profits et pertes.
Développement récent
- En 2022, Winmate a présenté la M140TG 14 pouces, une tablette très robuste développée pour offrir mobilité et connectivité aux clients sur le terrain. Cette nouvelle tablette Rugged Extreme offre des processeurs avancés et de nombreuses options de connectivité dans des appareils compacts. De plus, la M140TG est conçue pour intégrer fonctionnalité, robustesse, main-d'œuvre mobile et mobilité pour former une tablette fiable mais adaptable qui s'adapte à diverses situations et menaces.
- En 2022 : Samsung a présenté le Smart Monitor M8, un écran de 32 pouces. Ce nouveau Monitor M8 produit un écran qui correspond aux préférences de conception et au style de vie mature de la génération Z, car ils recherchent normalement une solution unique pour travailler, apprendre et jouer. De plus, le moniteur intelligent serait disponible dans les couleurs vert printemps et rose coucher de soleil.
Portée du marché mondial de l'affichage industriel
Le marché de l'affichage industriel est segmenté en fonction du type, de la taille du panneau, de la technologie, du type de communication, de l'application et du secteur vertical. La croissance parmi ces segments vous aidera à analyser les segments de faible croissance dans les industries et fournira aux utilisateurs un aperçu précieux du marché et des informations sur le marché pour les aider à prendre des décisions stratégiques pour identifier les principales applications du marché.
Taper
- Écrans robustes
- Moniteurs à cadre ouvert
- Écran multi-touch (P-Cap)
- Affichage avant
- Affichage USB Type-C
- Affichage SDI
- Écran monté à l'arrière
- Moniteurs montés sur panneau
- Affichages marins
- Murs vidéo
- Autres
Taille du panneau
- Jusqu'à 14 pouces
- 14 pouces à 21 pouces
- 21 à 40 pouces
- 40 pouces
- Au-dessus de
Technologie
- Écran LCD
- DIRIGÉ
- OLED
- Affichage du papier électronique
Type de communication
- En série
- Ethernet
- Réseau mobile
- Communication industrielle
- RF/Zigbee/IR
- Jason/MQTT
- Autres
- Application
- IHM
- Candidature à distance
- Affichage interactif
- Affichage numérique
- Imagerie
Verticale
- Fabrication
- Énergie et électricité
- Militaire et avionique
- Pétrole et gaz
- Métaux et mines
- Transport
- Autres
Analyse/perspectives régionales du marché de l'affichage industriel
Le marché de l'affichage industriel est analysé et des informations sur la taille du marché et les tendances sont fournies par pays, type, taille du panneau, technologie, type de communication, application et vertical comme référencé ci-dessus.
Les pays couverts dans le rapport sur le marché de l'affichage industriel sont les États-Unis, le Canada et le Mexique en Amérique du Nord, l'Allemagne, la France, le Royaume-Uni, les Pays-Bas, la Suisse, la Belgique, la Russie, l'Italie, l'Espagne, la Turquie, le reste de l'Europe en Europe, la Chine, le Japon, l'Inde, la Corée du Sud, Singapour, la Malaisie, l'Australie, la Thaïlande, l'Indonésie, les Philippines, le reste de l'Asie-Pacifique (APAC) en Asie-Pacifique (APAC), l'Arabie saoudite, les Émirats arabes unis, l'Afrique du Sud, l'Égypte, Israël, le reste du Moyen-Orient et de l'Afrique (MEA) en tant que partie du Moyen-Orient et de l'Afrique (MEA), le Brésil, l'Argentine et le reste de l'Amérique du Sud en tant que partie de l'Amérique du Sud.
L'Amérique du Nord domine le marché de l'affichage industriel marin en termes de chiffre d'affaires et de part de marché. Cela est principalement dû à l'adoption croissante de l'affichage numérique et des IHM ainsi qu'à l'investissement croissant dans la technologie de l'Internet des objets et les appareils IHM multifonctions dans cette région.
L’Asie-Pacifique devrait être la région qui connaîtra le développement le plus rapide au cours de la période de prévision de 2023 à 2030 en raison de la croissance du secteur de la production d’électricité et du développement de l’industrie manufacturière dans cette région.
La section pays du rapport fournit également des facteurs d'impact sur les marchés individuels et des changements dans la réglementation du marché qui ont un impact sur les tendances actuelles et futures du marché. Des points de données tels que l'analyse de la chaîne de valeur en aval et en amont, les tendances techniques et l'analyse des cinq forces du porteur, les études de cas sont quelques-uns des indicateurs utilisés pour prévoir le scénario de marché pour les différents pays. En outre, la présence et la disponibilité des marques mondiales et les défis auxquels elles sont confrontées en raison de la concurrence importante ou rare des marques locales et nationales, l'impact des tarifs nationaux et les routes commerciales sont pris en compte tout en fournissant une analyse prévisionnelle des données nationales.
Analyse du paysage concurrentiel et des parts de marché de l'affichage industriel
Le paysage concurrentiel du marché de l'affichage industriel fournit des détails par concurrent. Les détails inclus sont la présentation de l'entreprise, les finances de l'entreprise, les revenus générés, le potentiel du marché, les investissements dans la recherche et le développement, les nouvelles initiatives du marché, la présence mondiale, les sites et installations de production, les capacités de production, les forces et les faiblesses de l'entreprise, le lancement du produit, la largeur et l'étendue du produit, la domination des applications. Les points de données ci-dessus fournis ne concernent que l'orientation des entreprises liée au marché de l'affichage industriel.
Certains des principaux acteurs opérant sur le marché de l'affichage industriel sont :
- Samsung (Corée du Sud)
- LG Display (Corée du Sud)
- Panasonic Corporation Co, Ltd (Japon)
- Japan Display Inc (Japon)
- AUO Corporation (Taïwan)
- BOE Technology Group Co., Ltd (Chine)
- Corning Incorporated (États-Unis)
- DuPont (États-Unis)
- FlexEnable Limited (Royaume-Uni)
- Kateeva (États-Unis)
- SONY INDE (Inde)
- Pioneer Corporation (Japon)
- WiseChip Semiconductor Inc. (Taïwan)
- WINSTAR Display Co., Ltd. (Chine)
- Société Visionox (Chine)
- SHARP CORPORATION (Japon)
- Innolux Corporation (Taïwan)
- RAYSTAR OPTRONICS, INC, (Taïwan)
- RITEK CORPORATION (Taïwan)
- OSRAM GmbH (Allemagne)
- Plessey (Royaume-Uni)
SKU-
Accédez en ligne au rapport sur le premier cloud mondial de veille économique

- Tableau de bord d'analyse de données interactif
- Tableau de bord d'analyse d'entreprise pour les opportunités à fort potentiel de croissance
- Accès d'analyste de recherche pour la personnalisation et les requêtes
- Analyse de la concurrence avec tableau de bord interactif
- Dernières actualités, mises à jour et analyse des tendances
- Exploitez la puissance de l'analyse comparative pour un suivi complet de la concurrence
Table des matières
- INTRODUCTION
- OBJECTIVES OF THE STUDY
- MARKET DEFINITION
- OVERVIEW OF GLOBAL INDUSTRIAL DISPLAY MARKET
- LIMITATIONS
- MARKETS COVERED
- MARKET SEGMENTATION
- MARKETS COVERED
- GEOGRAPHICAL SCOPE
- YEARS CONSIDERED FOR THE STUDY
- CURRENCY AND PRICING
- DBMR TRIPOD DATA VALIDATION MODEL
- MULTIVARIATE MODELLING
- TYPE LIFELINE CURVE
- PRIMARY INTERVIEWS WITH KEY OPINION LEADERS
- DBMR MARKET POSITION GRID
- VENDOR SHARE ANALYSIS
- MARKET APPLICATION COVERAGE GRID
- SECONDARY SOURCES
- ASSUMPTIONS
- EXECUTIVE SUMMARY
- PREMIUM INSIGHTS
- OVERVIEW OF VALUE CHAIN ANALYSIS OF INDUSTRIAL DISPLAY MARKET
- STANDARD RATINGS FOR INDUSTRIAL DISPLAY MARKET
- INGRESS PROTECTION (IP) RATING:
- NATIONAL ELECTRICAL MANUFACTURERS ASSOCIATION (NEMA) RATINGS:
- MARKET OVERVIEW
- DRIVERS
- EMERGENCE OF VARIOUS TECHNOLOGICAL DEVELOPMENTS AND AUTOMATED PROCESSES IN INDUSTRIES
- LED AND LCD BASED DISPLAY PRODUCTS REDUCES THE RISK OF EYE DAMAGE
- RISING DEMAND FOR HUMAN MACHINE INTERFACE (HMI) APPLICATION IN MANUFACTURING AND PROCESS INDUSTRIES
- INCREASING MANUFACTURING FACILITIES WORLDWIDE IS LEADING THE ADOPTION OF INDUSTRIAL DISPLAYS
- AVAILABILITY OF ROBUST DISPLAY SCREEN AND WIRELESS CONNECTION
- RESTRAINT
- HIGH INVESTMENTS REQUIRED FOR INSTALLING OF INDUSTRIAL DISPLAYS / PANELS
- OPPORTUNITIES
- GROWING DEMAND FOR DIGITAL SIGNAGE APPLICATIONS IN INDUSTRIES FOR DISPLAYING NECESSARY INFORMATION
- INCREASING DIGITALIZATION OF FACILITIES WITH INDUSTRY 4.0
- RISING ADOPTION OF OLED DISPLAYS IN VARIOUS APPLICATIONS
- COMPANIES ARE TRANSFORMING THEIR PROCESS FROM MANUAL TO DIGITAL
- VARIOUS PARTNERSHIPS AND ACQUISITION IS LEADING FOR NEW PRODUCT DEVELOPMENTS AND BUSINESS EXPANSION
- CHALLENGES
- SUITABILITY OF INDUSTRIAL DISPLAY FOR ALL WEATHER CONDITIONS
- DEPENDENCE OF MANUFACTURERS ON VARIOUS SUPPLIERS TO PROVIDE EQUIPMENT AND COMPONENTS
- ECONOMIC CRISIS OCCURRED DUE TO VARIOUS FACTORS
- IMPACT OF COVID-19 ON THE GLOBAL INDUSTRIAL DISPLAY MARKET
- AFTERMATH OF COVID-19 AND GOVERNMENT ROLE
- STRATEGIC DECISIONS FOR MARKET PLAYERS AFTER COVID-19 TO GAIN COMPETITIVE MARKET SHARE
- IMPACT ON DEMAND
- IMPACT ON SUPPLY CHAIN
- CONCLUSION
- GLOBAL INDUSTRIAL DISPLAY MARKET, BY TYPE
- OVERVIEW
- RUGGED DISPLAY
- TYPE
- SMARTPHONE & HANDHELD COMPUTER
- TABLET
- LAPTOP
- MISSION CRITICAL DISPLAY
- AVIONIC DISPLAY
- VEHICLE-MOUNTED DISPLAY
- LEVEL OF RUGEDNESS
- ULTRA-RUGGED
- FULLY RUGGED
- SEMI RUGGED
- PANEL MOUNT MONITOR
- VIDEO WALLS
- OPEN FRAME MONITOR
- FRONT DISPLAY
- REAR MOUNT DISPLAY
- MARINE DISPLAY
- APPLICATION
- HMI
- DIGITAL SIGNAGE
- INTERACTIVE DISPLAY
- REMOTE MONITORING
- IMAGING
- sdi display
- multi-touch (p-cap) display
- usb type-c display
- others
- Global Industrial Display MARKET, BY panel size
- overview
- Up to 14 Inches
- 14 inches to 21 inches
- 21 to 40 inches
- 40 inches and above
- Global Industrial Display MARKET, BY technology
- overview
- lcd
- led
- full array
- edge lit
- direct lit
- Oled
- amoled
- pmoled
- e-paper display
- Global Industrial Display MARKET, BY communication type
- overview
- serial
- ethernet
- mobile network
- industrial communication
- rf/zigbee/ir
- Jason/mqtt
- others
- Global Industrial Display MARKET, BY application
- overview
- hmi
- digital signage
- interactive display
- remote monitoring
- imaging
- Global Industrial Display MARKET, BY vertical
- overview
- manufacturing
- lcd
- led
- FULL ARRAY
- EDGE LIT
- DIRECT LIT
- OLED
- AMOLED
- PMOLED
- E-Paper display
- energy & power
- lcd
- led
- FULL ARRAY
- EDGE LIT
- DIRECT LIT
- oled
- AMOLED
- PMOLED
- e-paper display
- military and avionics
- lcd
- led
- FULL ARRAY
- EDGE LIT
- DIRECT LIT
- oled
- AMOLED
- PMOLED
- e-paper display
- oil & gas
- lcd
- led
- FULL ARRAY
- EDGE LIT
- DIRECT LIT
- oled
- AMOLED
- PMOLED
- e-paper display
- transportation
- lcd
- led
- FULL ARRAY
- EDGE LIT
- DIRECT LIT
- oled
- AMOLED
- PMOLED
- e-paper display
- METAL & MINING
- lcd
- led
- FULL ARRAY
- EDGE LIT
- DIRECT LIT
- oled
- AMOLED
- PMOLED
- e-paper display
- OTHERS
- lcd
- led
- FULL ARRAY
- EDGE LIT
- DIRECT LIT
- oled
- AMOLED
- PMOLED
- e-paper display
- Global industrial display market, by region
- overview
- North America
- U.S.
- Canada
- Mexico
- Europe
- U.K.
- Germany
- france
- Italy
- spain
- netherlands
- switzerland
- russia
- Turkey
- belgium
- Rest of Europe
- Asia-Pacific
- CHINA
- Japan
- south korea
- singapore
- India
- malaysia
- Thailand
- indonesia
- Australia
- Philippines
- Rest of Asia-Pacific
- Middle East and Africa
- u.a.e
- saudi arabia
- south africa
- egypt
- israel
- Rest of Middle East and Africa
- South America
- BRAZIL
- Argentina
- venezuela
- chile
- colombia
- ecuador
- Rest of South America
- Company land scape
- Company share analysis: Global
- company share analysis: north AMERICA
- company share analysis: europe
- Company share analysis: asia-pacific
- Swot analysis
- Company profile
- Au optronics corp.
- COMPANY snapshot
- revenue analysis
- COMPANY SHARE ANALYSIS
- Product PORTFOLIO
- recent DEVELOPMENT
- boe technology uk limited
- COMPANY snapshot
- COMPANY SHARE ANALYSIS
- Product PORTFOLIO
- recent DEVELOPMENT
- innolux corporation
- COMPANY snapshot
- revenue analysis
- COMPANY SHARE ANALYSIS
- Product PORTFOLIO
- recent DEVELOPMENTS
- Samsung electronics co., ltd
- COMPANY snapshot
- revenue analysis
- COMPANY SHARE ANALYSIS
- Product PORTFOLIO
- recent DEVELOPMENTS
- lg display co., ltd.
- COMPANY snapshot
- revenue analysis
- COMPANY SHARE ANALYSIS
- Product PORTFOLIO
- recent DEVELOPMENTS
- tianma microelectronics co., ltd.
- COMPANY snapshot
- Product PORTFOLIO
- recent DEVELOPMENTS
- advantech co., ltd.
- COMPANY snapshot
- revenue analysis
- Product PORTFOLIO
- recent DEVELOPMENTS
- Panasonic Corporation
- COMPANY snapshot
- revenue analysis
- PRODUCT PORTFOLIo
- recent DEVELOPMENTS
- emerson electric co.
- COMPANY snapshot
- revenue analysis
- Product PORTFOLIO
- recent DEVELOPMENT
- general digital corporation
- COMPANY snapshot
- Product PORTFOLIO
- recent DEVELOPMENTS
- general electric
- COMPANY snapshot
- revenue analysis
- PRODUCT PORTFOLIo
- recent DEVELOPMENTS
- japan display inc.
- COMPANY snapshot
- revenue analysis
- Product PORTFOLIO
- recent DEVELOPMENTS
- pepperl+fuchs SE
- COMPANY snapshot
- Product PORTFOLIO
- recent DEVELOPMENT
- planar
- COMPANY snapshot
- Product PORTFOLIO
- recent DEVELOPMENTS
- rockwell automation, inc.
- COMPANY snapshot
- revenue analysis
- Product PORTFOLIO
- recent DEVELOPMENTS
- schneider electric
- COMPANY snapshot
- revenue analysis
- PRODUCT PORTFOLIo
- recent DEVELOPMENT
- Sharp NEC Display Solutions, Ltd. (a subsidiary of NEC Corporation)
- COMPANY snapshot
- revenue analysis
- Product PORTFOLIO
- recent DEVELOPMENTS
- shenzhen topway technology co., ltd.
- COMPANY snapshot
- Product PORTFOLIO
- recent DEVELOPMENTS
- siemens
- COMPANY snapshot
- revenue analysis
- Product PORTFOLIO
- recent DEVELOPMENTS
- tricomtek co., ltd
- COMPANY snapshot
- Product PORTFOLIO
- recent DEVELOPMENT
- questionnaire
- related reports
Liste des tableaux
TABLEAU 1 Marché mondial des écrans industriels, par type, 2019-2028 (en millions USD)
TABLEAU 2 Marché mondial des écrans robustes pour l'affichage industriel, PAR RÉGION, 2019-2028 (EN MILLIONS USD)
TABLEAU 3 Marché mondial des écrans robustes sur le marché des écrans industriels, par type, 2019-2028 (en millions USD)
TABLEAU 4 Écrans robustes mondiaux sur le marché de l'affichage industriel, par niveau de robustesse, 2019-2028 (en millions USD)
TABLEAU 5 Marché mondial des écrans à montage sur panneau pour l'affichage industriel, PAR RÉGION, 2019-2028 (EN MILLIONS USD)
TABLEAU 6 Marché mondial des murs vidéo sur écrans industriels, PAR RÉGION, 2019-2028 (EN MILLIONS USD)
TABLEAU 7 Marché mondial des écrans ouverts pour l'affichage industriel, PAR RÉGION, 2019-2028 (EN MILLIONS USD)
TABLEAU 8 Marché mondial des écrans frontaux industriels, PAR RÉGION, 2019-2028 (EN MILLIONS USD)
TABLEAU 9 Marché mondial des écrans industriels à montage arrière, PAR RÉGION, 2019-2028 (EN MILLIONS USD)
TABLEAU 10 Marché mondial des écrans marins sur l'affichage industriel, PAR RÉGION, 2019-2028 (EN MILLIONS USD)
TABLEAU 11 Affichage marin mondial sur le marché de l'affichage industriel, par application, 2019-2028 (en millions USD)
TABLEAU 12 Marché mondial de l'affichage SDI sur l'affichage industriel, PAR RÉGION, 2019-2028 (EN MILLIONS USD)
TABLEAU 13 Marché mondial des écrans tactiles multipoints (P-cap) sur le marché de l'affichage industriel, PAR RÉGION, 2019-2028 (EN MILLIONS USD)
TABLEAU 14 Marché mondial des écrans USB Type-C sur les écrans industriels, PAR RÉGION, 2019-2028 (EN MILLIONS USD)
TABLEAU 15 Autres acteurs mondiaux du marché de l'affichage industriel, PAR RÉGION, 2019-2028 (EN MILLIONS USD)
TABLEAU 16 Marché mondial des écrans industriels, par taille de panneau, 2019-2028 (en millions USD)
TABLEAU 17 Marché mondial des écrans industriels jusqu'à 14 pouces, PAR RÉGION, 2019-2028 (EN MILLIONS USD)
TABLEAU 18 Marché mondial des écrans industriels de 14 à 21 pouces, PAR RÉGION, 2019-2028 (EN MILLIONS USD)
TABLEAU 19 Marché mondial des écrans industriels de 21 à 40 pouces, PAR RÉGION, 2019-2028 (EN MILLIONS USD)
TABLEAU 20 Marché mondial des écrans industriels de 40 pouces et plus, PAR RÉGION, 2019-2028 (EN MILLIONS USD)
TABLEAU 21 Marché mondial des écrans industriels, par technologie, 2019-2028 (en millions USD)
TABLEAU 22 Marché mondial des écrans LCD industriels, PAR RÉGION, 2019-2028 (EN MILLIONS USD)
TABLEAU 23 Leader mondial du marché des écrans industriels, PAR RÉGION, 2019-2028 (EN MILLIONS USD)
TABLEAU 24 Leader mondial du marché des écrans industriels, par type, 2019-2028 (en millions USD)
TABLEAU 25 Marché mondial des écrans OLED industriels, PAR RÉGION, 2019-2028 (EN MILLIONS USD)
TABLEAU 26 Marché mondial des écrans OLED industriels, par type, 2019-2028 (en millions USD)
TABLEAU 27 Marché mondial de l'affichage électronique sur papier industriel, PAR RÉGION, 2019-2028 (EN MILLIONS USD)
TABLEAU 28 Marché mondial de l'affichage industriel, par type de communication, 2019-2028 (en millions USD)
TABLEAU 29 Marché mondial des écrans industriels, PAR RÉGION, 2019-2028 (EN MILLIONS USD)
TABLEAU 30 Marché mondial de l'Ethernet dans l'affichage industriel, PAR RÉGION, 2019-2028 (EN MILLIONS USD)
TABLEAU 31 Marché mondial des réseaux mobiles d'affichage industriel, PAR RÉGION, 2019-2028 (EN MILLIONS USD)
TABLEAU 32 Marché mondial de la communication industrielle sur l'affichage industriel, PAR RÉGION, 2019-2028 (EN MILLIONS USD)
TABLE 33 Global rf/zigbee/ir in industrial display Market, BY REGION, 2019-2028 (USD MILLION)
TABLE 34 Global Jason/MQTT in industrial display Market, BY REGION, 2019-2028 (USD MILLION)
TABLE 35 Global OTHERS in industrial display Market, BY REGION, 2019-2028 (USD MILLION)
TABLE 36 Global Industrial Display Market, By application, 2019-2028 (USD MILLION)
TABLE 37 Global hmi in industrial display Market, BY REGION, 2019-2028 (USD MILLION)
TABLE 38 Global digital signage in industrial display Market, BY REGION, 2019-2028 (USD MILLION)
TABLE 39 Global interactive display in industrial display Market, BY REGION, 2019-2028 (USD MILLION)
TABLE 40 Global remote monitoring in industrial display Market, BY REGION, 2019-2028 (USD MILLION)
TABLE 41 Global imaging in industrial display Market, BY REGION, 2019-2028 (USD MILLION)
TABLE 42 Global Industrial Display Market, By vertical, 2019-2028 (USD MILLION)
TABLE 43 Global manufacturing in industrial display Market, BY REGION, 2019-2028 (USD MILLION)
TABLE 44 Global manufacturing in Industrial Display Market, By technology, 2019-2028 (USD MILLION)
TABLE 45 Global manufacturing in led for Industrial Display Market, By type, 2019-2028 (USD MILLION)
TABLE 46 Global manufacturing in oled for Industrial Display Market, By type, 2019-2028 (USD MILLION)
TABLE 47 Global energy & power in industrial display Market, BY REGION, 2019-2028 (USD MILLION)
TABLE 48 Global energy & power in Industrial Display Market, By technology, 2019-2028 (USD MILLION)
TABLE 49 Global energy and power in led for Industrial Display Market, By type, 2019-2028 (USD MILLION)
TABLE 50 Global energy and power in oled for Industrial Display Market, By type, 2019-2028 (USD MILLION)
TABLE 51 Global military and avionics in industrial display Market, BY REGION, 2019-2028 (USD MILLION)
TABLE 52 Global military and avionics in Industrial Display Market, By technology, 2019-2028 (USD MILLION)
TABLE 53 Global military and avionics in led for Industrial Display Market, By type, 2019-2028 (USD MILLION)
TABLE 54 Global military and avionics in oled for Industrial Display Market, By type, 2019-2028 (USD MILLION)
TABLE 55 Global oil & gas in industrial display Market, BY REGION, 2019-2028 (USD MILLION)
TABLE 56 Global Oil & gas in Industrial Display Market, By technology, 2019-2028 (USD MILLION)
TABLE 57 Global oil & gas in led for Industrial Display Market, By type, 2019-2028 (USD MILLION)
TABLE 58 Global oil & gas in oled for Industrial Display Market, By type, 2019-2028 (USD MILLION)
TABLE 59 Global transportation in industrial display Market, BY REGION, 2019-2028 (USD MILLION)
TABLE 60 Global Transportation in Industrial Display Market, By technology, 2019-2028 (USD MILLION)
TABLE 61 Global transportation in led for Industrial Display Market, By type, 2019-2028 (USD MILLION)
TABLE 62 Global transportation in oled for Industrial Display Market, By type, 2019-2028 (USD MILLION)
TABLEAU 63 Marché mondial des métaux et des mines dans l'affichage industriel, PAR RÉGION, 2019-2028 (EN MILLIONS USD)
TABLEAU 64 Marché mondial des écrans industriels pour les métaux et les mines, par technologie, 2019-2028 (en millions USD)
TABLEAU 65 Marché mondial des métaux et des mines pour l'affichage industriel à LED, par type, 2019-2028 (en millions USD)
TABLEAU 66 Marché mondial des écrans OLED pour l'affichage industriel, métallurgie et mines, par type, 2019-2028 (en millions USD)
TABLEAU 67 Autres acteurs mondiaux du marché de l'affichage industriel, PAR RÉGION, 2019-2028 (EN MILLIONS USD)
TABLEAU 68 Autres acteurs mondiaux du marché de l'affichage industriel, par technologie, 2019-2028 (en millions USD)
TABLEAU 69 Autres acteurs mondiaux du marché des écrans industriels, par type, 2019-2028 (en millions USD)
TABLEAU 70 Autres acteurs mondiaux du marché des écrans OLED pour l'affichage industriel, par type, 2019-2028 (en millions USD)
TABLEAU 71 MARCHÉ MONDIAL DES ÉCRANS INDUSTRIELS, PAR RÉGION, 2019-2028 (en millions USD)
TABLEAU 72 Marché nord-américain des écrans industriels, par pays, 2019-2028 (en millions USD)
TABLEAU 73 Marché des écrans industriels en Amérique du Nord, par type, 2019-2028 (en millions USD)
TABLEAU 74 Marché des écrans robustes en Amérique du Nord pour l'affichage industriel, par type, 2019-2028 (en millions USD)
TABLEAU 75 Marché des écrans robustes en Amérique du Nord sur le marché de l'affichage industriel, par niveau de robustesse, 2019-2028 (en millions USD)
TABLEAU 76 Marché nord-américain des écrans marins sur les écrans industriels, par application, 2019-2028 (en millions USD)
TABLEAU 77 Marché nord-américain des écrans industriels, par technologie, 2019-2028 (en millions USD)
TABLEAU 78 L'Amérique du Nord domine le marché des écrans industriels, par type, 2019-2028 (en millions USD)
TABLEAU 79 Marché nord-américain des écrans OLED industriels, par type, 2019-2028 (en millions USD)
TABLEAU 80 Marché nord-américain de l'affichage industriel, par type de communication, 2019-2028 (en millions USD)
TABLEAU 81 Marché nord-américain des écrans industriels, par taille de panneau, 2019-2028 (en millions USD)
TABLEAU 82 Marché nord-américain des écrans industriels, par application, 2019-2028 (en millions USD)
TABLEAU 83 Marché nord-américain des écrans industriels, par secteur, 2019-2028 (en millions USD)
TABLEAU 84 Marché nord-américain de la fabrication d'écrans industriels, par technologie, 2019-2028 (en millions USD)
TABLEAU 85 Fabrication en Amérique du Nord sur le marché des LED pour l'affichage industriel, par type, 2019-2028 (en millions USD)
TABLEAU 86 Fabrication nord-américaine de panneaux OLED pour l'affichage industriel, par type, 2019-2028 (en millions USD)
TABLEAU 87 Marché nord-américain de l'énergie et de la puissance dans l'affichage industriel, par technologie, 2019-2028 (en millions USD)
TABLEAU 88 Énergie et puissance sur le marché des LED pour l'affichage industriel en Amérique du Nord, par type, 2019-2028 (en millions USD)
TABLEAU 89 Marché nord-américain de l'énergie et de la puissance dans les écrans OLED pour l'affichage industriel, par type, 2019-2028 (en millions USD)
TABLEAU 90 Marché nord-américain des écrans militaires et avioniques industriels, par technologie, 2019-2028 (en millions USD)
TABLEAU 91 Marché nord-américain des écrans LED militaires et avioniques pour l'affichage industriel, par type, 2019-2028 (en millions USD)
TABLEAU 92 Marché nord-américain des écrans OLED militaires et avioniques pour l'affichage industriel, par type, 2019-2028 (en millions USD)
TABLEAU 93 Marché nord-américain de l'affichage industriel du pétrole et du gaz, par technologie, 2019-2028 (en millions USD)
TABLEAU 94 Marché nord-américain du pétrole et du gaz pour l'affichage industriel, par type, 2019-2028 (en millions USD)
TABLEAU 95 Marché nord-américain du pétrole et du gaz dans les écrans OLED pour l'affichage industriel, par type, 2019-2028 (en millions USD)
TABLEAU 96 Marché nord-américain des transports sur le marché de l'affichage industriel, par technologie, 2019-2028 (en millions USD)
TABLEAU 97 Transport en Amérique du Nord sur le marché des LED pour l'affichage industriel, par type, 2019-2028 (en millions USD)
TABLEAU 98 Marché des transports en Amérique du Nord pour l'affichage industriel OLED, par type, 2019-2028 (en millions USD)
TABLEAU 99 Marché nord-américain des écrans industriels pour les métaux et les mines, par technologie, 2019-2028 (en millions USD)
TABLEAU 100 Amérique du Nord : Marché des LED pour l'affichage industriel, métaux et mines, par type, 2019-2028 (en millions USD)
TABLEAU 101 Marché nord-américain des écrans OLED pour l'affichage industriel, métallurgie et mines, par type, 2019-2028 (en millions USD)
TABLEAU 102 Autres acteurs du marché de l'affichage industriel en Amérique du Nord, par technologie, 2019-2028 (en millions USD)
TABLEAU 103 Autres marchés nord-américains des LED pour l'affichage industriel, par type, 2019-2028 (en millions USD)
TABLEAU 104 Autres marchés d'affichage industriel OLED en Amérique du Nord, par type, 2019-2028 (en millions USD)
TABLEAU 105 Marché des écrans industriels aux États-Unis, par type, 2019-2028 (en millions USD)
TABLEAU 106 Écrans robustes américains sur le marché des écrans industriels, par type, 2019-2028 (en millions USD)
TABLEAU 107 Écrans robustes américains sur le marché de l'affichage industriel, par niveau de robustesse, 2019-2028 (en millions USD)
TABLEAU 108 Affichage marin américain sur le marché de l'affichage industriel, par application, 2019-2028 (en millions USD)
TABLEAU 109 Marché américain des écrans industriels, par technologie, 2019-2028 (en millions USD)
TABLEAU 110 Les États-Unis dominent le marché des écrans industriels, par type, 2019-2028 (en millions USD)
TABLEAU 111 Marché américain des écrans OLED industriels, par type, 2019-2028 (en millions USD)
TABLEAU 112 Marché américain des écrans industriels, par type de communication, 2019-2028 (en millions USD)
TABLEAU 113 Marché des écrans industriels aux États-Unis, par taille de panneau, 2019-2028 (en millions USD)
TABLEAU 114 Marché américain des écrans industriels, par application, 2019-2028 (en millions USD)
TABLEAU 115 Marché américain des écrans industriels, par secteur, 2019-2028 (en millions USD)
TABLEAU 116 Fabrication américaine sur le marché de l'affichage industriel, par technologie, 2019-2028 (en millions USD)
TABLEAU 117 Fabrication américaine sur le marché des LED pour l'affichage industriel, par type, 2019-2028 (en millions USD)
TABLEAU 118 Fabrication américaine de panneaux OLED pour l'affichage industriel, par type, 2019-2028 (en millions USD)
TABLEAU 119 Marché américain de l'énergie et de la puissance dans l'affichage industriel, par technologie, 2019-2028 (en millions USD)
TABLEAU 120 Énergie et puissance du marché américain des LED pour l'affichage industriel, par type, 2019-2028 (en millions USD)
TABLEAU 121 Marché américain de l'énergie et de la puissance dans les écrans OLED pour l'affichage industriel, par type, 2019-2028 (en millions USD)
TABLEAU 122 Marché de l'affichage industriel et militaire américain, par technologie, 2019-2028 (en millions USD)
TABLE 123 U.S. military & avionics in led for industrial display Market, By type, 2019-2028 (USD million)
TABLE 124 U.S. military & avionics in oled for industrial display Market, By type, 2019-2028 (USD million)
TABLE 125 U.S. oil & gas in industrial display Market, By technology, 2019-2028 (USD million)
TABLE 126 U.S. oil & gas in led for industrial display Market, By type, 2019-2028 (USD million)
TABLE 127 U.S. oil & gas in oled for industrial display Market, By type, 2019-2028 (USD million)
TABLE 128 U.S. transportation in industrial display Market, By technology, 2019-2028 (USD million)
TABLE 129 U.S. transportation in led for industrial display Market, By type, 2019-2028 (USD million)
TABLE 130 U.S. transportation in oled for industrial display Market, By type, 2019-2028 (USD million)
TABLE 131 U.S. metal & mining in industrial display Market, By technology, 2019-2028 (USD million)
TABLE 132 U.S. metaL & mining in led for industrial display Market, By type, 2019-2028 (USD million)
TABLE 133 U.S. metal & mining in oled for industrial display Market, By type, 2019-2028 (USD million)
TABLE 134 U.S. others in industrial display Market, By technology, 2019-2028 (USD million)
TABLE 135 U.S. others in led for industrial display Market, By type, 2019-2028 (USD million)
TABLE 136 U.S. others in oled for industrial display Market, By type, 2019-2028 (USD million)
TABLE 137 Canada industrial display Market, By type, 2019-2028 (USD million)
TABLE 138 Canada rugged display in industrial display Market, By type, 2019-2028 (USD million)
TABLE 139 Canada rugged display in industrial display Market, By level of ruggedness, 2019-2028 (USD million)
TABLE 140 Canada marine display in industrial display Market, By application, 2019-2028 (USD million)
TABLE 141 Canada industrial display Market, By technology, 2019-2028 (USD million)
TABLE 142 Canada led in industrial display Market, By type, 2019-2028 (USD million)
TABLE 143 Canada oled in industrial display Market, By type, 2019-2028 (USD million)
TABLE 144 Canada industrial display Market, By communication type, 2019-2028 (USD million)
TABLE 145 Canada industrial display Market, By panel size, 2019-2028 (USD million)
TABLE 146 Canada industrial display Market, By application, 2019-2028 (USD million)
TABLE 147 Canada industrial display Market, By Vertical, 2019-2028 (USD million)
TABLE 148 Canada manufacturing in industrial display Market, By technology, 2019-2028 (USD million)
TABLE 149 Canada manufacturing in led for industrial display Market, By type, 2019-2028 (USD million)
TABLE 150 Canada manufacturing in oled for industrial display Market, By type, 2019-2028 (USD million)
TABLE 151 Canada energy & power in industrial display Market, By technology, 2019-2028 (USD million)
TABLE 152 Canada energy & power in led for industrial display Market, By type, 2019-2028 (USD million)
TABLE 153 Canada energy & power in oled for industrial display Market, By type, 2019-2028 (USD million)
TABLE 154 Canada military & avionics in industrial display Market, By technology, 2019-2028 (USD million)
TABLE 155 Canada military & avionics in led for industrial display Market, By type, 2019-2028 (USD million)
TABLE 156 Canada military & avionics in oled for industrial display Market, By type, 2019-2028 (USD million)
TABLE 157 Canada oil & gas in industrial display Market, By technology, 2019-2028 (USD million)
TABLE 158 Canada oil & gas in led for industrial display Market, By type, 2019-2028 (USD million)
TABLE 159 Canada oil & gas in oled for industrial display Market, By type, 2019-2028 (USD million)
TABLE 160 Canada transportation in industrial display Market, By technology, 2019-2028 (USD million)
TABLE 161 Canada transportation in led for industrial display Market, By type, 2019-2028 (USD million)
TABLE 162 Canada transportation in oled for industrial display Market, By type, 2019-2028 (USD million)
TABLE 163 Canada metal & mining in industrial display Market, By technology, 2019-2028 (USD million)
TABLE 164 Canada metaL & mining in led for industrial display Market, By type, 2019-2028 (USD million)
TABLE 165 Canada metal & mining in oled for industrial display Market, By type, 2019-2028 (USD million)
TABLE 166 Canada others in industrial display Market, By technology, 2019-2028 (USD million)
TABLE 167 Canada others in led for industrial display Market, By type, 2019-2028 (USD million)
TABLE 168 Canada others in oled for industrial display Market, By type, 2019-2028 (USD million)
TABLE 169 Mexico industrial display Market, By type, 2019-2028 (USD million)
TABLE 170 Mexico rugged display in industrial display Market, By type, 2019-2028 (USD million)
TABLE 171 Mexico rugged display in industrial display Market, By level of ruggedness, 2019-2028 (USD million)
TABLE 172 Mexico marine display in industrial display Market, By application, 2019-2028 (USD million)
TABLE 173 Mexico industrial display Market, By technology, 2019-2028 (USD million)
TABLE 174 Mexico led in industrial display Market, By type, 2019-2028 (USD million)
TABLE 175 Mexico oled in industrial display Market, By type, 2019-2028 (USD million)
TABLE 176 Mexico industrial display Market, By communication type, 2019-2028 (USD million)
TABLE 177 Mexico industrial display Market, By panel size, 2019-2028 (USD million)
TABLE 178 Mexico industrial display Market, By application, 2019-2028 (USD million)
TABLE 179 Mexico industrial display Market, By Vertical, 2019-2028 (USD million)
TABLE 180 Mexico manufacturing in industrial display Market, By technology, 2019-2028 (USD million)
TABLE 181 Mexico manufacturing in led for industrial display Market, By type, 2019-2028 (USD million)
TABLE 182 Mexico manufacturing in oled for industrial display Market, By type, 2019-2028 (USD million)
TABLE 183 Mexico energy & power in industrial display Market, By technology, 2019-2028 (USD million)
TABLE 184 Mexico energy & power in led for industrial display Market, By type, 2019-2028 (USD million)
TABLE 185 Mexico energy & power in oled for industrial display Market, By type, 2019-2028 (USD million)
TABLE 186 Mexico military & avionics in industrial display Market, By technology, 2019-2028 (USD million)
TABLE 187 Mexico military & avionics in led for industrial display Market, By type, 2019-2028 (USD million)
TABLE 188 Mexico military & avionics in oled for industrial display Market, By type, 2019-2028 (USD million)
TABLE 189 Mexico oil & gas in industrial display Market, By technology, 2019-2028 (USD million)
TABLE 190 Mexico oil & gas in led for industrial display Market, By type, 2019-2028 (USD million)
TABLE 191 Mexico oil & gas in oled for industrial display Market, By type, 2019-2028 (USD million)
TABLE 192 Mexico transportation in industrial display Market, By technology, 2019-2028 (USD million)
TABLE 193 Mexico transportation in led for industrial display Market, By type, 2019-2028 (USD million)
TABLE 194 Mexico transportation in oled for industrial display Market, By type, 2019-2028 (USD million)
TABLE 195 Mexico metal & mining in industrial display Market, By technology, 2019-2028 (USD million)
TABLE 196 Mexico metaL & mining in led for industrial display Market, By type, 2019-2028 (USD million)
TABLE 197 Mexico metal & mining in oled for industrial display Market, By type, 2019-2028 (USD million)
TABLE 198 Mexico others in industrial display Market, By technology, 2019-2028 (USD million)
TABLE 199 Mexico others in led for industrial display Market, By type, 2019-2028 (USD million)
TABLE 200 Mexico others in oled for industrial display Market, By type, 2019-2028 (USD million)
TABLE 201 Europe INDUSTRIAL DISPLAY Market, By COUNTRY, 2019-2028 (USD million)
TABLE 202 Europe industrial display Market, By type, 2019-2028 (USD million)
TABLE 203 Europe rugged display in industrial display Market, By type, 2019-2028 (USD million)
TABLE 204 Europe rugged display in industrial display Market, By level of ruggedness, 2019-2028 (USD million)
TABLE 205 Europe marine display in industrial display Market, By application, 2019-2028 (USD million)
TABLE 206 Europe industrial display Market, By technology, 2019-2028 (USD million)
TABLE 207 Europe led in industrial display Market, By type, 2019-2028 (USD million)
TABLE 208 Europe oled in industrial display Market, By type, 2019-2028 (USD million)
TABLE 209 Europe industrial display Market, By communication type, 2019-2028 (USD million)
TABLE 210 Europe industrial display Market, By panel size, 2019-2028 (USD million)
TABLE 211 Europe industrial display Market, By application, 2019-2028 (USD million)
TABLE 212 Europe industrial display Market, By Vertical, 2019-2028 (USD million)
TABLE 213 Europe manufacturing in industrial display Market, By technology, 2019-2028 (USD million)
TABLE 214 Europe manufacturing in led for industrial display Market, By type, 2019-2028 (USD million)
TABLE 215 Europe manufacturing in oled for industrial display Market, By type, 2019-2028 (USD million)
TABLE 216 Europe energy & power in industrial display Market, By technology, 2019-2028 (USD million)
TABLE 217 Europe energy & power in led for industrial display Market, By type, 2019-2028 (USD million)
TABLE 218 Europe energy & power in oled for industrial display Market, By type, 2019-2028 (USD million)
TABLE 219 Europe military & avionics in industrial display Market, By technology, 2019-2028 (USD million)
TABLE 220 Europe military & avionics in led for industrial display Market, By type, 2019-2028 (USD million)
TABLE 221 Europe military & avionics in oled for industrial display Market, By type, 2019-2028 (USD million)
TABLE 222 Europe oil & gas in industrial display Market, By technology, 2019-2028 (USD million)
TABLE 223 Europe oil & gas in led for industrial display Market, By type, 2019-2028 (USD million)
TABLE 224 Europe oil & gas in oled for industrial display Market, By type, 2019-2028 (USD million)
TABLE 225 Europe transportation in industrial display Market, By technology, 2019-2028 (USD million)
TABLE 226 Europe transportation in led for industrial display Market, By type, 2019-2028 (USD million)
TABLE 227 Europe transportation in oled for industrial display Market, By type, 2019-2028 (USD million)
TABLE 228 Europe metal & mining in industrial display Market, By technology, 2019-2028 (USD million)
TABLE 229 Europe metaL & mining in led for industrial display Market, By type, 2019-2028 (USD million)
TABLE 230 Europe metal & mining in oled for industrial display Market, By type, 2019-2028 (USD million)
TABLE 231 Europe others in industrial display Market, By technology, 2019-2028 (USD million)
TABLE 232 Europe others in led for industrial display Market, By type, 2019-2028 (USD million)
TABLE 233 Europe others in oled for industrial display Market, By type, 2019-2028 (USD million)
TABLE 234 U.K. industrial display Market, By type, 2019-2028 (USD million)
TABLE 235 U.K. rugged display in industrial display Market, By type, 2019-2028 (USD million)
TABLE 236 U.K. rugged display in industrial display Market, By level of ruggedness, 2019-2028 (USD million)
TABLE 237 U.K. marine display in industrial display Market, By application, 2019-2028 (USD million)
TABLE 238 U.K. industrial display Market, By technology, 2019-2028 (USD million)
TABLE 239 U.K. led in industrial display Market, By type, 2019-2028 (USD million)
TABLE 240 U.K. oled in industrial display Market, By type, 2019-2028 (USD million)
TABLE 241 U.K. industrial display Market, By communication type, 2019-2028 (USD million)
TABLE 242 U.K. industrial display Market, By panel size, 2019-2028 (USD million)
TABLE 243 U.K. industrial display Market, By application, 2019-2028 (USD million)
TABLE 244 U.K. industrial display Market, By Vertical, 2019-2028 (USD million)
TABLE 245 U.K. manufacturing in industrial display Market, By technology, 2019-2028 (USD million)
TABLEAU 246 Production britannique de LED pour le marché de l'affichage industriel, par type, 2019-2028 (en millions USD)
TABLEAU 247 Fabrication au Royaume-Uni de panneaux OLED pour l'affichage industriel, par type, 2019-2028 (en millions USD)
TABLEAU 248 Marché britannique de l'énergie et de l'électricité dans l'affichage industriel, par technologie, 2019-2028 (en millions USD)
TABLEAU 249 Énergie et puissance au Royaume-Uni sur le marché des LED pour l'affichage industriel, par type, 2019-2028 (en millions USD)
TABLEAU 250 Marché britannique de l'énergie et de la puissance dans les écrans OLED pour l'affichage industriel, par type, 2019-2028 (en millions USD)
TABLEAU 251 Marché britannique des écrans militaires et avioniques industriels, par technologie, 2019-2028 (en millions USD)
TABLEAU 252 Marché des écrans LED pour l'industrie militaire et avionique au Royaume-Uni, par type, 2019-2028 (en millions USD)
TABLEAU 253 Marché britannique des écrans OLED militaires et avioniques pour l'affichage industriel, par type, 2019-2028 (en millions USD)
TABLEAU 254 Marché britannique de l'affichage industriel du pétrole et du gaz, par technologie, 2019-2028 (en millions USD)
TABLEAU 255 Marché britannique du pétrole et du gaz pour l'affichage industriel, par type, 2019-2028 (en millions USD)
TABLEAU 256 Marché britannique du pétrole et du gaz dans les écrans OLED pour l'affichage industriel, par type, 2019-2028 (en millions USD)
TABLEAU 257 Marché des transports sur le marché de l'affichage industriel au Royaume-Uni, par technologie, 2019-2028 (en millions USD)
TABLEAU 258 Transport au Royaume-Uni sur le marché des LED pour l'affichage industriel, par type, 2019-2028 (en millions USD)
TABLEAU 259 Marché des transports au Royaume-Uni pour l'affichage industriel OLED, par type, 2019-2028 (en millions USD)
TABLEAU 260 Marché britannique des métaux et des mines dans l'affichage industriel, par technologie, 2019-2028 (en millions USD)
TABLEAU 261 Marché britannique des métaux et des mines pour l'affichage industriel à LED, par type, 2019-2028 (en millions USD)
TABLEAU 262 Marché britannique des écrans OLED pour l'affichage industriel dans le secteur des métaux et des mines, par type, 2019-2028 (en millions USD)
TABLEAU 263 Autres acteurs du marché de l'affichage industriel au Royaume-Uni, par technologie, 2019-2028 (en millions USD)
TABLEAU 264 Autres acteurs du marché britannique des LED pour l'affichage industriel, par type, 2019-2028 (en millions USD)
TABLEAU 265 Autres acteurs du marché britannique des écrans OLED pour l'affichage industriel, par type, 2019-2028 (en millions USD)
TABLEAU 266 Marché allemand des écrans industriels, par type, 2019-2028 (en millions USD)
TABLEAU 267 Marché allemand des écrans robustes pour l'affichage industriel, par type, 2019-2028 (en millions USD)
TABLEAU 268 Écrans robustes sur le marché allemand de l'affichage industriel, par niveau de robustesse, 2019-2028 (en millions USD)
TABLEAU 269 Affichage marin allemand sur le marché de l'affichage industriel, par application, 2019-2028 (en millions USD)
TABLEAU 270 Marché allemand des écrans industriels, par technologie, 2019-2028 (en millions USD)
TABLEAU 271 L'Allemagne domine le marché des écrans industriels, par type, 2019-2028 (en millions USD)
TABLEAU 272 Marché allemand des écrans OLED industriels, par type, 2019-2028 (en millions USD)
TABLEAU 273 Marché allemand de l'affichage industriel, par type de communication, 2019-2028 (en millions USD)
TABLEAU 274 Marché allemand des écrans industriels, par taille de panneau, 2019-2028 (en millions USD)
TABLEAU 275 Marché allemand des écrans industriels, par application, 2019-2028 (en millions USD)
TABLEAU 276 Marché allemand des écrans industriels, par secteur, 2019-2028 (en millions USD)
TABLEAU 277 Marché allemand de la fabrication d'écrans industriels, par technologie, 2019-2028 (en millions USD)
TABLEAU 278 Fabrication allemande sur le marché des écrans LED industriels, par type, 2019-2028 (en millions USD)
TABLEAU 279 Fabrication allemande d'écrans OLED pour l'affichage industriel, par type, 2019-2028 (en millions USD)
TABLEAU 280 Marché allemand de l'énergie et de la puissance dans l'affichage industriel, par technologie, 2019-2028 (en millions USD)
TABLEAU 281 Énergie et puissance sur le marché allemand des LED pour l'affichage industriel, par type, 2019-2028 (en millions USD)
TABLEAU 282 Marché allemand de l'énergie et de la puissance dans les écrans OLED pour l'affichage industriel, par type, 2019-2028 (en millions USD)
TABLEAU 283 Marché allemand de l'affichage militaire et avionique industriel, par technologie, 2019-2028 (en millions USD)
TABLEAU 284 Marché allemand des écrans LED militaires et avioniques pour l'affichage industriel, par type, 2019-2028 (en millions USD)
TABLEAU 285 Marché allemand des écrans OLED militaires et avioniques pour l'affichage industriel, par type, 2019-2028 (en millions USD)
TABLEAU 286 Marché allemand du pétrole et du gaz sur le marché de l'affichage industriel, par technologie, 2019-2028 (en millions USD)
TABLEAU 287 Marché allemand du pétrole et du gaz pour l'affichage industriel, par type, 2019-2028 (en millions USD)
TABLEAU 288 Marché allemand du pétrole et du gaz dans les écrans OLED pour l'affichage industriel, par type, 2019-2028 (en millions USD)
TABLEAU 289 Marché allemand des transports sur l'affichage industriel, par technologie, 2019-2028 (en millions USD)
TABLEAU 290 Transports en Allemagne sur le marché des écrans LED pour l'affichage industriel, par type, 2019-2028 (en millions USD)
TABLEAU 291 Marché des transports en Allemagne pour l'affichage industriel OLED, par type, 2019-2028 (en millions USD)
TABLEAU 292 Marché allemand des métaux et des mines dans l'affichage industriel, par technologie, 2019-2028 (en millions USD)
TABLEAU 293 Marché allemand des métaux et des mines pour l'affichage industriel à LED, par type, 2019-2028 (en millions USD)
TABLEAU 294 Marché allemand des écrans OLED pour l'affichage industriel, métallurgie et mines, par type, 2019-2028 (en millions USD)
TABLEAU 295 Allemagne : autres acteurs du marché de l'affichage industriel, par technologie, 2019-2028 (en millions USD)
TABLEAU 296 Allemagne : autres acteurs du marché des LED pour l'affichage industriel, par type, 2019-2028 (en millions USD)
TABLEAU 297 Allemagne autres dans le marché de l'affichage industriel OLED, par type, 2019-2028 (en millions USD)
TABLEAU 298 Marché français des écrans industriels, par type, 2019-2028 (en millions USD)
TABLEAU 299 Marché des écrans durcis industriels en France, par type, 2019-2028 (en millions USD)
TABLEAU 300 Marché des écrans durcis en France, par niveau de robustesse, 2019-2028 (en millions USD)
TABLEAU 301 Marché des présentoirs marins en France, par application, 2019-2028 (en millions USD)
TABLEAU 302 Marché français des écrans industriels, par technologie, 2019-2028 (en millions USD)
TABLEAU 303 La France en tête du marché des écrans industriels, par type, 2019-2028 (en millions USD)
TABLEAU 304 Marché français des écrans OLED industriels, par type, 2019-2028 (en millions USD)
TABLEAU 305 Marché français de l'affichage industriel, par type de communication, 2019-2028 (en millions USD)
TABLEAU 306 Marché français des écrans industriels, par taille de panneau, 2019-2028 (en millions USD)
TABLE 307 France industrial display Market, By application, 2019-2028 (USD million)
TABLE 308 France industrial display Market, By Vertical, 2019-2028 (USD million)
TABLE 309 France manufacturing in industrial display Market, By technology, 2019-2028 (USD million)
TABLE 310 France manufacturing in led for industrial display Market, By type, 2019-2028 (USD million)
TABLE 311 France manufacturing in oled for industrial display Market, By type, 2019-2028 (USD million)
TABLE 312 France energy & power in industrial display Market, By technology, 2019-2028 (USD million)
TABLE 313 France energy & power in led for industrial display Market, By type, 2019-2028 (USD million)
TABLE 314 France energy & power in oled for industrial display Market, By type, 2019-2028 (USD million)
TABLE 315 France military & avionics in industrial display Market, By technology, 2019-2028 (USD million)
TABLE 316 France military & avionics in led for industrial display Market, By type, 2019-2028 (USD million)
TABLE 317 France military & avionics in oled for industrial display Market, By type, 2019-2028 (USD million)
TABLE 318 France oil & gas in industrial display Market, By technology, 2019-2028 (USD million)
TABLE 319 France oil & gas in led for industrial display Market, By type, 2019-2028 (USD million)
TABLE 320 France oil & gas in oled for industrial display Market, By type, 2019-2028 (USD million)
TABLE 321 France transportation in industrial display Market, By technology, 2019-2028 (USD million)
TABLE 322 France transportation in led for industrial display Market, By type, 2019-2028 (USD million)
TABLE 323 France transportation in oled for industrial display Market, By type, 2019-2028 (USD million)
TABLE 324 France metal & mining in industrial display Market, By technology, 2019-2028 (USD million)
TABLE 325 France metaL & mining in led for industrial display Market, By type, 2019-2028 (USD million)
TABLE 326 France metal & mining in oled for industrial display Market, By type, 2019-2028 (USD million)
TABLE 327 France others in industrial display Market, By technology, 2019-2028 (USD million)
TABLE 328 France others in led for industrial display Market, By type, 2019-2028 (USD million)
TABLE 329 France others in oled for industrial display Market, By type, 2019-2028 (USD million)
TABLE 330 Italy industrial display Market, By type, 2019-2028 (USD million)
TABLE 331 Italy rugged display in industrial display Market, By type, 2019-2028 (USD million)
TABLE 332 Italy rugged display in industrial display Market, By level of ruggedness, 2019-2028 (USD million)
TABLE 333 Italy marine display in industrial display Market, By application, 2019-2028 (USD million)
TABLE 334 Italy industrial display Market, By technology, 2019-2028 (USD million)
TABLE 335 Italy led in industrial display Market, By type, 2019-2028 (USD million)
TABLE 336 Italy oled in industrial display Market, By type, 2019-2028 (USD million)
TABLE 337 Italy industrial display Market, By communication type, 2019-2028 (USD million)
TABLE 338 Italy industrial display Market, By panel size, 2019-2028 (USD million)
TABLE 339 Italy industrial display Market, By application, 2019-2028 (USD million)
TABLE 340 Italy industrial display Market, By Vertical, 2019-2028 (USD million)
TABLE 341 Italy manufacturing in industrial display Market, By technology, 2019-2028 (USD million)
TABLE 342 Italy manufacturing in led for industrial display Market, By type, 2019-2028 (USD million)
TABLE 343 Italy manufacturing in oled for industrial display Market, By type, 2019-2028 (USD million)
TABLE 344 Italy energy & power in industrial display Market, By technology, 2019-2028 (USD million)
TABLE 345 Italy energy & power in led for industrial display Market, By type, 2019-2028 (USD million)
TABLE 346 Italy energy & power in oled for industrial display Market, By type, 2019-2028 (USD million)
TABLE 347 Italy military & avionics in industrial display Market, By technology, 2019-2028 (USD million)
TABLE 348 Italy military & avionics in led for industrial display Market, By type, 2019-2028 (USD million)
TABLE 349 Italy military & avionics in oled for industrial display Market, By type, 2019-2028 (USD million)
TABLE 350 Italy oil & gas in industrial display Market, By technology, 2019-2028 (USD million)
TABLE 351 Italy oil & gas in led for industrial display Market, By type, 2019-2028 (USD million)
TABLE 352 Italy oil & gas in oled for industrial display Market, By type, 2019-2028 (USD million)
TABLE 353 Italy transportation in industrial display Market, By technology, 2019-2028 (USD million)
TABLE 354 Italy transportation in led for industrial display Market, By type, 2019-2028 (USD million)
TABLE 355 Italy transportation in oled for industrial display Market, By type, 2019-2028 (USD million)
TABLE 356 Italy metal & mining in industrial display Market, By technology, 2019-2028 (USD million)
TABLE 357 Italy metaL & mining in led for industrial display Market, By type, 2019-2028 (USD million)
TABLE 358 Italy metal & mining in oled for industrial display Market, By type, 2019-2028 (USD million)
TABLE 359 Italy others in industrial display Market, By technology, 2019-2028 (USD million)
TABLE 360 Italy others in led for industrial display Market, By type, 2019-2028 (USD million)
TABLE 361 Italy others in oled for industrial display Market, By type, 2019-2028 (USD million)
TABLE 362 Spain industrial display Market, By type, 2019-2028 (USD million)
TABLE 363 Spain rugged display in industrial display Market, By type, 2019-2028 (USD million)
TABLE 364 Spain rugged display in industrial display Market, By level of ruggedness, 2019-2028 (USD million)
TABLE 365 Spain marine display in industrial display Market, By application, 2019-2028 (USD million)
TABLE 366 Spain industrial display Market, By technology, 2019-2028 (USD million)
TABLE 367 Spain led in industrial display Market, By type, 2019-2028 (USD million)
TABLE 368 Spain oled in industrial display Market, By type, 2019-2028 (USD million)
TABLE 369 Spain industrial display Market, By communication type, 2019-2028 (USD million)
TABLE 370 Spain industrial display Market, By panel size, 2019-2028 (USD million)
TABLE 371 Spain industrial display Market, By application, 2019-2028 (USD million)
TABLE 372 Spain industrial display Market, By Vertical, 2019-2028 (USD million)
TABLE 373 Spain manufacturing in industrial display Market, By technology, 2019-2028 (USD million)
TABLE 374 Spain manufacturing in led for industrial display Market, By type, 2019-2028 (USD million)
TABLE 375 Spain manufacturing in oled for industrial display Market, By type, 2019-2028 (USD million)
TABLE 376 Spain energy & power in industrial display Market, By technology, 2019-2028 (USD million)
TABLE 377 Spain energy & power in led for industrial display Market, By type, 2019-2028 (USD million)
TABLE 378 Spain energy & power in oled for industrial display Market, By type, 2019-2028 (USD million)
TABLE 379 Spain military & avionics in industrial display Market, By technology, 2019-2028 (USD million)
TABLE 380 Spain military & avionics in led for industrial display Market, By type, 2019-2028 (USD million)
TABLE 381 Spain military & avionics in oled for industrial display Market, By type, 2019-2028 (USD million)
TABLE 382 Spain oil & gas in industrial display Market, By technology, 2019-2028 (USD million)
TABLE 383 Spain oil & gas in led for industrial display Market, By type, 2019-2028 (USD million)
TABLE 384 Spain oil & gas in oled for industrial display Market, By type, 2019-2028 (USD million)
TABLE 385 Spain transportation in industrial display Market, By technology, 2019-2028 (USD million)
TABLE 386 Spain transportation in led for industrial display Market, By type, 2019-2028 (USD million)
TABLE 387 Spain transportation in oled for industrial display Market, By type, 2019-2028 (USD million)
TABLE 388 Spain metal & mining in industrial display Market, By technology, 2019-2028 (USD million)
TABLE 389 Spain metal & mining in led for industrial display Market, By type, 2019-2028 (USD million)
TABLE 390 Spain metal & mining in oled for industrial display Market, By type, 2019-2028 (USD million)
TABLE 391 Spain others in industrial display Market, By technology, 2019-2028 (USD million)
TABLE 392 Spain others in led for industrial display Market, By type, 2019-2028 (USD million)
TABLE 393 Spain others in oled for industrial display Market, By type, 2019-2028 (USD million)
TABLE 394 Netherlands industrial display Market, By type, 2019-2028 (USD million)
TABLE 395 Netherlands rugged display in industrial display Market, By type, 2019-2028 (USD million)
TABLE 396 Netherlands rugged display in industrial display Market, By level of ruggedness, 2019-2028 (USD million)
TABLE 397 Netherlands marine display in industrial display Market, By application, 2019-2028 (USD million)
TABLE 398 Netherlands industrial display Market, By technology, 2019-2028 (USD million)
TABLE 399 Netherlands led in industrial display Market, By type, 2019-2028 (USD million)
TABLE 400 Netherlands oled in industrial display Market, By type, 2019-2028 (USD million)
TABLE 401 Netherlands industrial display Market, By communication type, 2019-2028 (USD million)
TABLE 402 Netherlands industrial display Market, By panel size, 2019-2028 (USD million)
TABLE 403 Netherlands industrial display Market, By application, 2019-2028 (USD million)
TABLE 404 Netherlands industrial display Market, By Vertical, 2019-2028 (USD million)
TABLE 405 Netherlands manufacturing in industrial display Market, By technology, 2019-2028 (USD million)
TABLE 406 Netherlands manufacturing in led for industrial display Market, By type, 2019-2028 (USD million)
TABLE 407 Netherlands manufacturing in oled for industrial display Market, By type, 2019-2028 (USD million)
TABLE 408 Netherlands energy & power in industrial display Market, By technology, 2019-2028 (USD million)
TABLE 409 Netherlands energy & power in led for industrial display Market, By type, 2019-2028 (USD million)
TABLE 410 Netherlands energy & power in oled for industrial display Market, By type, 2019-2028 (USD million)
TABLE 411 Netherlands military & avionics in industrial display Market, By technology, 2019-2028 (USD million)
TABLE 412 Netherlands military & avionics in led for industrial display Market, By type, 2019-2028 (USD million)
TABLE 413 Netherlands military & avionics in oled for industrial display Market, By type, 2019-2028 (USD million)
TABLE 414 Netherlands oil & gas in industrial display Market, By technology, 2019-2028 (USD million)
TABLE 415 Netherlands oil & gas in led for industrial display Market, By type, 2019-2028 (USD million)
TABLE 416 Netherlands oil & gas in oled for industrial display Market, By type, 2019-2028 (USD million)
TABLE 417 Netherlands transportation in industrial display Market, By technology, 2019-2028 (USD million)
TABLE 418 Netherlands transportation in led for industrial display Market, By type, 2019-2028 (USD million)
TABLE 419 Netherlands transportation in oled for industrial display Market, By type, 2019-2028 (USD million)
TABLE 420 Netherlands metal & mining in industrial display Market, By technology, 2019-2028 (USD million)
TABLE 421 Netherlands metal & mining in led for industrial display Market, By type, 2019-2028 (USD million)
TABLE 422 Netherlands metal & mining in oled for industrial display Market, By type, 2019-2028 (USD million)
TABLE 423 Netherlands others in industrial display Market, By technology, 2019-2028 (USD million)
TABLE 424 Netherlands others in led for industrial display Market, By type, 2019-2028 (USD million)
TABLE 425 Netherlands others in oled for industrial display Market, By type, 2019-2028 (USD million)
TABLE 426 Switzerland industrial display Market, By type, 2019-2028 (USD Million)
TABLE 427 Switzerland rugged display in industrial display Market, By type, 2019-2028 (USD Million)
TABLE 428 Switzerland rugged display in industrial display Market, By level of ruggedness, 2019-2028 (USD Million)
TABLE 429 Switzerland marine display in industrial display Market, By application, 2019-2028 (USD Million)
TABLE 430 Switzerland industrial display Market, By technology, 2019-2028 (USD Million)
TABLE 431 Switzerland led in industrial display Market, By type, 2019-2028 (USD Million)
TABLE 432 Switzerland oled in industrial display Market, By type, 2019-2028 (USD Million)
TABLE 433 Switzerland industrial display Market, By communication type, 2019-2028 (USD Million)
TABLE 434 Switzerland industrial display Market, By panel size, 2019-2028 (USD Million)
TABLE 435 Switzerland industrial display Market, By application, 2019-2028 (USD Million)
TABLE 436 Switzerland industrial display Market, By Vertical, 2019-2028 (USD Million)
TABLE 437 Switzerland manufacturing in industrial display Market, By technology, 2019-2028 (USD Million)
TABLE 438 Switzerland manufacturing in led for industrial display Market, By type, 2019-2028 (USD Million)
TABLE 439 Switzerland manufacturing in oled for industrial display Market, By type, 2019-2028 (USD Million)
TABLE 440 Switzerland energy & power in industrial display Market, By technology, 2019-2028 (USD Million)
TABLE 441 Switzerland energy & power in led for industrial display Market, By type, 2019-2028 (USD Million)
TABLE 442 Switzerland energy & power in oled for industrial display Market, By type, 2019-2028 (USD Million)
TABLE 443 Switzerland military & avionics in industrial display Market, By technology, 2019-2028 (USD Million)
TABLE 444 Switzerland military & avionics in led for industrial display Market, By type, 2019-2028 (USD Million)
TABLE 445 Switzerland military & avionics in oled for industrial display Market, By type, 2019-2028 (USD Million)
TABLE 446 Switzerland oil & gas in industrial display Market, By technology, 2019-2028 (USD Million)
TABLE 447 Switzerland oil & gas in led for industrial display Market, By type, 2019-2028 (USD Million)
TABLE 448 Switzerland oil & gas in oled for industrial display Market, By type, 2019-2028 (USD Million)
TABLE 449 Switzerland transportation in industrial display Market, By technology, 2019-2028 (USD Million)
TABLE 450 Switzerland transportation in led for industrial display Market, By type, 2019-2028 (USD Million)
TABLE 451 Switzerland transportation in oled for industrial display Market, By type, 2019-2028 (USD Million)
TABLE 452 Switzerland metal & mining in industrial display Market, By technology, 2019-2028 (USD Million)
TABLE 453 Switzerland metal & mining in led for industrial display Market, By type, 2019-2028 (USD Million)
TABLE 454 Switzerland metal & mining in oled for industrial display Market, By type, 2019-2028 (USD Million)
TABLE 455 Switzerland others in industrial display Market, By technology, 2019-2028 (USD Million)
TABLE 456 Switzerland others in led for industrial display Market, By type, 2019-2028 (USD Million)
TABLE 457 Switzerland others in oled for industrial display Market, By type, 2019-2028 (USD Million)
TABLE 458 Russia industrial display Market, By type, 2019-2028 (USD Million)
TABLE 459 Russia rugged display in industrial display Market, By type, 2019-2028 (USD Million)
TABLE 460 Russia rugged display in industrial display Market, By level of ruggedness, 2019-2028 (USD Million)
TABLE 461 Russia marine display in industrial display Market, By application, 2019-2028 (USD Million)
TABLE 462 Russia industrial display Market, By technology, 2019-2028 (USD Million)
TABLE 463 Russia led in industrial display Market, By type, 2019-2028 (USD Million)
TABLE 464 Russia oled in industrial display Market, By type, 2019-2028 (USD Million)
TABLE 465 Russia industrial display Market, By communication type, 2019-2028 (USD Million)
TABLE 466 Russia industrial display Market, By panel size, 2019-2028 (USD Million)
TABLE 467 Russia industrial display Market, By application, 2019-2028 (USD Million)
TABLE 468 Russia industrial display Market, By Vertical, 2019-2028 (USD Million)
TABLE 469 Russia manufacturing in industrial display Market, By technology, 2019-2028 (USD Million)
TABLE 470 Russia manufacturing in led for industrial display Market, By type, 2019-2028 (USD Million)
TABLE 471 Russia manufacturing in oled for industrial display Market, By type, 2019-2028 (USD Million)
TABLE 472 Russia energy & power in industrial display Market, By technology, 2019-2028 (USD Million)
TABLE 473 Russia energy & power in led for industrial display Market, By type, 2019-2028 (USD Million)
TABLE 474 Russia energy & power in oled for industrial display Market, By type, 2019-2028 (USD Million)
TABLE 475 Russia military & avionics in industrial display Market, By technology, 2019-2028 (USD Million)
TABLE 476 Russia military & avionics in led for industrial display Market, By type, 2019-2028 (USD Million)
TABLE 477 Russia military & avionics in oled for industrial display Market, By type, 2019-2028 (USD Million)
TABLE 478 Russia oil & gas in industrial display Market, By technology, 2019-2028 (USD Million)
TABLE 479 Russia oil & gas in led for industrial display Market, By type, 2019-2028 (USD Million)
TABLE 480 Russia oil & gas in oled for industrial display Market, By type, 2019-2028 (USD Million)
TABLE 481 Russia transportation in industrial display Market, By technology, 2019-2028 (USD Million)
TABLE 482 Russia transportation in led for industrial display Market, By type, 2019-2028 (USD Million)
TABLE 483 Russia transportation in oled for industrial display Market, By type, 2019-2028 (USD Million)
TABLE 484 Russia metal & mining in industrial display Market, By technology, 2019-2028 (USD Million)
TABLE 485 Russia metal & mining in led for industrial display Market, By type, 2019-2028 (USD Million)
TABLE 486 Russia metal & mining in oled for industrial display Market, By type, 2019-2028 (USD Million)
TABLE 487 Russia others in industrial display Market, By technology, 2019-2028 (USD Million)
TABLE 488 Russia others in led for industrial display Market, By type, 2019-2028 (USD Million)
TABLE 489 Russia others in oled for industrial display Market, By type, 2019-2028 (USD Million)
TABLE 490 Turkey industrial display Market, By type, 2019-2028 (USD Million)
TABLE 491 Turkey rugged display in industrial display Market, By type, 2019-2028 (USD Million)
TABLE 492 Turkey rugged display in industrial display Market, By level of ruggedness, 2019-2028 (USD Million)
TABLE 493 Turkey marine display in industrial display Market, By application, 2019-2028 (USD Million)
TABLE 494 Turkey industrial display Market, By technology, 2019-2028 (USD Million)
TABLE 495 Turkey led in industrial display Market, By type, 2019-2028 (USD Million)
TABLE 496 Turkey oled in industrial display Market, By type, 2019-2028 (USD Million)
TABLE 497 Turkey industrial display Market, By communication type, 2019-2028 (USD Million)
TABLE 498 Turkey industrial display Market, By panel size, 2019-2028 (USD Million)
TABLE 499 Turkey industrial display Market, By application, 2019-2028 (USD Million)
TABLE 500 Turkey industrial display Market, By Vertical, 2019-2028 (USD Million)
TABLE 501 Turkey manufacturing in industrial display Market, By technology, 2019-2028 (USD Million)
TABLE 502 Turkey manufacturing in led for industrial display Market, By type, 2019-2028 (USD Million)
TABLE 503 Turkey manufacturing in oled for industrial display Market, By type, 2019-2028 (USD Million)
TABLE 504 Turkey energy & power in industrial display Market, By technology, 2019-2028 (USD Million)
TABLE 505 Turkey energy & power in led for industrial display Market, By type, 2019-2028 (USD Million)
TABLE 506 Turkey energy & power in oled for industrial display Market, By type, 2019-2028 (USD Million)
TABLE 507 Turkey military & avionics in industrial display Market, By technology, 2019-2028 (USD Million)
TABLE 508 Turkey military & avionics in led for industrial display Market, By type, 2019-2028 (USD Million)
TABLE 509 Turkey military & avionics in oled for industrial display Market, By type, 2019-2028 (USD Million)
TABLE 510 Turkey oil & gas in industrial display Market, By technology, 2019-2028 (USD Million)
TABLE 511 Turkey oil & gas in led for industrial display Market, By type, 2019-2028 (USD Million)
TABLE 512 Turkey oil & gas in oled for industrial display Market, By type, 2019-2028 (USD Million)
TABLE 513 Turkey transportation in industrial display Market, By technology, 2019-2028 (USD Million)
TABLE 514 Turkey transportation in led for industrial display Market, By type, 2019-2028 (USD Million)
TABLE 515 Turkey transportation in oled for industrial display Market, By type, 2019-2028 (USD Million)
TABLE 516 Turkey metal & mining in industrial display Market, By technology, 2019-2028 (USD Million)
TABLE 517 Turkey metal & mining in led for industrial display Market, By type, 2019-2028 (USD Million)
TABLE 518 Turkey metal & mining in oled for industrial display Market, By type, 2019-2028 (USD Million)
TABLE 519 Turkey others in industrial display Market, By technology, 2019-2028 (USD Million)
TABLE 520 Turkey others in led for industrial display Market, By type, 2019-2028 (USD Million)
TABLE 521 Turkey others in oled for industrial display Market, By type, 2019-2028 (USD Million)
TABLE 522 Belgium industrial display Market, By type, 2019-2028 (USD Million)
TABLE 523 Belgium rugged display in industrial display Market, By type, 2019-2028 (USD Million)
TABLE 524 Belgium rugged display in industrial display Market, By level of ruggedness, 2019-2028 (USD Million)
TABLE 525 Belgium marine display in industrial display Market, By application, 2019-2028 (USD Million)
TABLE 526 Belgium industrial display Market, By technology, 2019-2028 (USD Million)
TABLE 527 Belgium led in industrial display Market, By type, 2019-2028 (USD Million)
TABLE 528 Belgium oled in industrial display Market, By type, 2019-2028 (USD Million)
TABLE 529 Belgium industrial display Market, By communication type, 2019-2028 (USD Million)
TABLE 530 Belgium industrial display Market, By panel size, 2019-2028 (USD Million)
TABLE 531 Belgium industrial display Market, By application, 2019-2028 (USD Million)
TABLE 532 Belgium industrial display Market, By Vertical, 2019-2028 (USD Million)
TABLE 533 Belgium manufacturing in industrial display Market, By technology, 2019-2028 (USD Million)
TABLE 534 Belgium manufacturing in led for industrial display Market, By type, 2019-2028 (USD Million)
TABLE 535 Belgium manufacturing in oled for industrial display Market, By type, 2019-2028 (USD Million)
TABLE 536 Belgium energy & power in industrial display Market, By technology, 2019-2028 (USD Million)
TABLE 537 Belgium energy & power in led for industrial display Market, By type, 2019-2028 (USD Million)
TABLE 538 Belgium energy & power in oled for industrial display Market, By type, 2019-2028 (USD Million)
TABLE 539 Belgium military & avionics in industrial display Market, By technology, 2019-2028 (USD Million)
TABLE 540 Belgium military & avionics in led for industrial display Market, By type, 2019-2028 (USD Million)
TABLE 541 Belgium military & avionics in oled for industrial display Market, By type, 2019-2028 (USD Million)
TABLE 542 Belgium oil & gas in industrial display Market, By technology, 2019-2028 (USD Million)
TABLE 543 Belgium oil & gas in led for industrial display Market, By type, 2019-2028 (USD Million)
TABLE 544 Belgium oil & gas in oled for industrial display Market, By type, 2019-2028 (USD Million)
TABLE 545 Belgium transportation in industrial display Market, By technology, 2019-2028 (USD Million)
TABLE 546 Belgium transportation in led for industrial display Market, By type, 2019-2028 (USD Million)
TABLE 547 Belgium transportation in oled for industrial display Market, By type, 2019-2028 (USD Million)
TABLE 548 Belgium metal & mining in industrial display Market, By technology, 2019-2028 (USD Million)
TABLE 549 Belgium metal & mining in led for industrial display Market, By type, 2019-2028 (USD Million)
TABLE 550 Belgium metal & mining in oled for industrial display Market, By type, 2019-2028 (USD Million)
TABLE 551 Belgium others in industrial display Market, By technology, 2019-2028 (USD Million)
TABLE 552 Belgium others in led for industrial display Market, By type, 2019-2028 (USD Million)
TABLE 553 Belgium others in oled for industrial display Market, By type, 2019-2028 (USD Million)
TABLE 554 rest of europe industrial display Market, By type, 2019-2028 (USD Million)
TABLE 555 Asia-Pacific INDUSTRIAL DISPLAY Market, By COUNTRY, 2019-2028 (USD Million)
TABLE 556 Asia-pacific industrial display Market, By type, 2019-2028 (USD Million)
TABLE 557 Asia-pacific rugged display in industrial display Market, By type, 2019-2028 (USD Million)
TABLE 558 Asia-pacific rugged display in industrial display Market, By level of ruggedness, 2019-2028 (USD Million)
TABLE 559 Asia-pacific marine display in industrial display Market, By application, 2019-2028 (USD Million)
TABLE 560 Asia-pacific industrial display Market, By technology, 2019-2028 (USD Million)
TABLE 561 Asia-pacific led in industrial display Market, By type, 2019-2028 (USD Million)
TABLE 562 Asia-pacific oled in industrial display Market, By type, 2019-2028 (USD Million)
TABLE 563 Asia-pacific industrial display Market, By communication type, 2019-2028 (USD Million)
TABLE 564 Asia-pacific industrial display Market, By panel size, 2019-2028 (USD Million)
TABLE 565 Asia-pacific industrial display Market, By application, 2019-2028 (USD Million)
TABLE 566 Asia-pacific industrial display Market, By Vertical, 2019-2028 (USD Million)
TABLE 567 Asia-pacific manufacturing in industrial display Market, By technology, 2019-2028 (USD Million)
TABLE 568 Asia-pacific manufacturing in led for industrial display Market, By type, 2019-2028 (USD Million)
TABLE 569 Asia-pacific manufacturing in oled for industrial display Market, By type, 2019-2028 (USD Million)
TABLE 570 Asia-pacific energy & power in industrial display Market, By technology, 2019-2028 (USD Million)
TABLE 571 Asia-pacific energy & power in led for industrial display Market, By type, 2019-2028 (USD Million)
TABLE 572 Asia-pacific energy & power in oled for industrial display Market, By type, 2019-2028 (USD Million)
TABLE 573 Asia-pacific military & avionics in industrial display Market, By technology, 2019-2028 (USD Million)
TABLE 574 Asia-pacific military & avionics in led for industrial display Market, By type, 2019-2028 (USD Million)
TABLE 575 Asia-pacific military & avionics in oled for industrial display Market, By type, 2019-2028 (USD Million)
TABLE 576 Asia-pacific oil & gas in industrial display Market, By technology, 2019-2028 (USD Million)
TABLE 577 Asia-pacific oil & gas in led for industrial display Market, By type, 2019-2028 (USD Million)
TABLE 578 Asia-pacific oil & gas in oled for industrial display Market, By type, 2019-2028 (USD Million)
TABLE 579 Asia-pacific transportation in industrial display Market, By technology, 2019-2028 (USD Million)
TABLE 580 Asia-pacific transportation in led for industrial display Market, By type, 2019-2028 (USD Million)
TABLE 581 Asia-pacific transportation in oled for industrial display Market, By type, 2019-2028 (USD Million)
TABLE 582 Asia-pacific metal & mining in industrial display Market, By technology, 2019-2028 (USD Million)
TABLE 583 Asia-pacific metal & mining in led for industrial display Market, By type, 2019-2028 (USD Million)
TABLE 584 Asia-pacific metal & mining in oled for industrial display Market, By type, 2019-2028 (USD Million)
TABLE 585 Asia-pacific others in industrial display Market, By technology, 2019-2028 (USD Million)
TABLE 586 Asia-pacific others in led for industrial display Market, By type, 2019-2028 (USD Million)
TABLE 587 Asia-pacific others in oled for industrial display Market, By type, 2019-2028 (USD Million)
TABLE 588 China industrial display Market, By type, 2019-2028 (USD Million)
TABLE 589 China rugged display in industrial display Market, By type, 2019-2028 (USD Million)
TABLE 590 China rugged display in industrial display Market, By level of ruggedness, 2019-2028 (USD Million)
TABLE 591 China marine display in industrial display Market, By application, 2019-2028 (USD Million)
TABLE 592 China industrial display Market, By technology, 2019-2028 (USD Million)
TABLE 593 China led in industrial display Market, By type, 2019-2028 (USD Million)
TABLE 594 China oled in industrial display Market, By type, 2019-2028 (USD Million)
TABLE 595 China industrial display Market, By communication type, 2019-2028 (USD Million)
TABLE 596 China industrial display Market, By panel size, 2019-2028 (USD Million)
TABLE 597 China industrial display Market, By application, 2019-2028 (USD Million)
TABLE 598 China industrial display Market, By Vertical, 2019-2028 (USD Million)
TABLE 599 China manufacturing in industrial display Market, By technology, 2019-2028 (USD Million)
TABLE 600 China manufacturing in led for industrial display Market, By type, 2019-2028 (USD Million)
TABLE 601 China manufacturing in oled for industrial display Market, By type, 2019-2028 (USD Million)
TABLE 602 China energy & power in industrial display Market, By technology, 2019-2028 (USD Million)
TABLE 603 China energy & power in led for industrial display Market, By type, 2019-2028 (USD Million)
TABLE 604 China energy & power in oled for industrial display Market, By type, 2019-2028 (USD Million)
TABLEAU 605 Marché chinois de l'affichage militaire et avionique industriel, par technologie, 2019-2028 (en millions USD)
TABLEAU 606 Marché chinois des écrans LED militaires et avioniques pour l'affichage industriel, par type, 2019-2028 (en millions USD)
TABLEAU 607 Marché chinois des écrans OLED militaires et avioniques pour l'affichage industriel, par type, 2019-2028 (en millions USD)
TABLEAU 608 Marché chinois de l'affichage industriel du pétrole et du gaz, par technologie, 2019-2028 (en millions USD)
TABLEAU 609 Marché chinois du pétrole et du gaz pour l'affichage industriel, par type, 2019-2028 (en millions USD)
TABLEAU 610 Marché chinois du pétrole et du gaz dans les écrans OLED pour l'affichage industriel, par type, 2019-2028 (en millions USD)
TABLEAU 611 Marché chinois des transports sur l'affichage industriel, par technologie, 2019-2028 (en millions USD)
TABLEAU 612 Transports en Chine sur le marché des écrans LED industriels, par type, 2019-2028 (en millions USD)
TABLEAU 613 Marché des transports en Chine pour l'affichage industriel OLED, par type, 2019-2028 (en millions USD)
TABLEAU 614 Marché chinois des métaux et des mines dans l'affichage industriel, par technologie, 2019-2028 (en millions USD)
TABLEAU 615 Marché chinois des métaux et des mines pour l'affichage industriel à LED, par type, 2019-2028 (en millions USD)
TABLEAU 616 Marché chinois des écrans OLED pour l'affichage industriel, métallurgie et exploitation minière, par type, 2019-2028 (en millions USD)
TABLEAU 617 Autres acteurs chinois du marché de l'affichage industriel, par technologie, 2019-2028 (en millions USD)
TABLEAU 618 Autres acteurs chinois du marché des LED pour l'affichage industriel, par type, 2019-2028 (en millions USD)
TABLEAU 619 Autres marchés chinois de l'affichage industriel OLED, par type, 2019-2028 (en millions USD)
TABLEAU 620 Marché japonais des écrans industriels, par type, 2019-2028 (en millions USD)
TABLEAU 621 Marché japonais des écrans robustes pour l'affichage industriel, par type, 2019-2028 (en millions USD)
TABLEAU 622 Écrans robustes sur le marché japonais de l'affichage industriel, par niveau de robustesse, 2019-2028 (en millions USD)
TABLEAU 623 Affichage marin japonais sur le marché de l'affichage industriel, par application, 2019-2028 (en millions USD)
TABLEAU 624 Marché japonais des écrans industriels, par technologie, 2019-2028 (en millions USD)
TABLEAU 625 Le Japon domine le marché des écrans industriels, par type, 2019-2028 (en millions USD)
TABLEAU 626 Marché japonais des écrans OLED industriels, par type, 2019-2028 (en millions USD)
TABLEAU 627 Marché japonais des écrans industriels, par type de communication, 2019-2028 (en millions USD)
TABLEAU 628 Marché japonais des écrans industriels, par taille de panneau, 2019-2028 (en millions USD)
TABLEAU 629 Marché japonais des écrans industriels, par application, 2019-2028 (en millions USD)
TABLEAU 630 Marché japonais des écrans industriels, par secteur, 2019-2028 (en millions USD)
TABLEAU 631 Marché japonais de la fabrication d'écrans industriels, par technologie, 2019-2028 (en millions USD)
TABLEAU 632 Production japonaise de LED pour le marché de l'affichage industriel, par type, 2019-2028 (en millions USD)
TABLEAU 633 Fabrication japonaise d'écrans OLED pour l'affichage industriel, par type, 2019-2028 (en millions USD)
TABLEAU 634 Marché japonais de l'énergie et de la puissance dans l'affichage industriel, par technologie, 2019-2028 (en millions USD)
TABLEAU 635 Marché japonais de l'énergie et de la puissance des LED pour l'affichage industriel, par type, 2019-2028 (en millions USD)
TABLEAU 636 Marché japonais de l'énergie et de la puissance dans les écrans OLED pour l'affichage industriel, par type, 2019-2028 (en millions USD)
TABLEAU 637 Marché japonais de l'affichage militaire et avionique industriel, par technologie, 2019-2028 (en millions USD)
TABLEAU 638 Marché japonais des écrans LED militaires et avioniques pour l'affichage industriel, par type, 2019-2028 (en millions USD)
TABLEAU 639 Marché japonais des écrans OLED militaires et avioniques pour l'affichage industriel, par type, 2019-2028 (en millions USD)
TABLEAU 640 Marché japonais de l'affichage industriel du pétrole et du gaz, par technologie, 2019-2028 (en millions USD)
TABLEAU 641 Marché japonais du pétrole et du gaz pour l'affichage industriel, par type, 2019-2028 (en millions USD)
TABLEAU 642 Marché japonais du pétrole et du gaz dans les écrans OLED pour l'affichage industriel, par type, 2019-2028 (en millions USD)
TABLEAU 643 Marché japonais des transports sur l'affichage industriel, par technologie, 2019-2028 (en millions USD)
TABLEAU 644 Transports au Japon sur le marché des écrans LED industriels, par type, 2019-2028 (en millions USD)
TABLEAU 645 Marché des transports au Japon pour l'affichage industriel OLED, par type, 2019-2028 (en millions USD)
TABLEAU 646 Marché japonais des métaux et des mines dans l'affichage industriel, par technologie, 2019-2028 (en millions USD)
TABLEAU 647 Marché japonais des métaux et des mines pour l'affichage industriel à LED, par type, 2019-2028 (en millions USD)
TABLEAU 648 Marché japonais des écrans OLED pour l'affichage industriel, métallurgie et mines, par type, 2019-2028 (en millions USD)
TABLEAU 649 Autres acteurs du marché japonais de l'affichage industriel, par technologie, 2019-2028 (en millions USD)
TABLEAU 650 Japon : autres acteurs du marché des écrans LED pour l'affichage industriel, par type, 2019-2028 (en millions USD)
TABLEAU 651 Japon : autres marchés de l'affichage industriel OLED, par type, 2019-2028 (en millions USD)
TABLEAU 652 Marché des écrans industriels en Corée du Sud, par type, 2019-2028 (en millions USD)
TABLEAU 653 Écrans robustes sur le marché des écrans industriels en Corée du Sud, par type, 2019-2028 (en millions USD)
TABLEAU 654 Écrans robustes sur le marché de l'affichage industriel en Corée du Sud, par niveau de robustesse, 2019-2028 (en millions USD)
TABLEAU 655 Affichage marin sur le marché de l'affichage industriel en Corée du Sud, par application, 2019-2028 (en millions USD)
TABLEAU 656 Marché des écrans industriels en Corée du Sud, par technologie, 2019-2028 (en millions USD)
TABLEAU 657 La Corée du Sud domine le marché des écrans industriels, par type, 2019-2028 (en millions USD)
TABLEAU 658 Marché des écrans OLED industriels en Corée du Sud, par type, 2019-2028 (en millions USD)
TABLEAU 659 Marché des écrans industriels en Corée du Sud, par type de communication, 2019-2028 (en millions USD)
TABLEAU 660 Marché des écrans industriels en Corée du Sud, par taille de panneau, 2019-2028 (en millions USD)
TABLEAU 661 Marché des écrans industriels en Corée du Sud, par application, 2019-2028 (en millions USD)
TABLEAU 662 Marché des écrans industriels en Corée du Sud, par secteur, 2019-2028 (en millions USD)
TABLEAU 663 Marché manufacturier sud-coréen des écrans industriels, par technologie, 2019-2028 (en millions USD)
TABLEAU 664 Fabrication sud-coréenne sur le marché des écrans LED industriels, par type, 2019-2028 (en millions USD)
TABLEAU 665 Fabrication sud-coréenne de panneaux OLED pour écrans industriels, par type, 2019-2028 (en millions USD)
TABLE 666 South Korea energy & power in industrial display Market, By technology, 2019-2028 (USD Million)
TABLE 667 South Korea energy & power in led for industrial display Market, By type, 2019-2028 (USD Million)
TABLE 668 South Korea energy & power in oled for industrial display Market, By type, 2019-2028 (USD Million)
TABLE 669 South Korea military & avionics in industrial display Market, By technology, 2019-2028 (USD Million)
TABLE 670 South Korea military & avionics in led for industrial display Market, By type, 2019-2028 (USD Million)
TABLE 671 South Korea military & avionics in oled for industrial display Market, By type, 2019-2028 (USD Million)
TABLE 672 South Korea oil & gas in industrial display Market, By technology, 2019-2028 (USD Million)
TABLE 673 South Korea oil & gas in led for industrial display Market, By type, 2019-2028 (USD Million)
TABLE 674 South Korea oil & gas in oled for industrial display Market, By type, 2019-2028 (USD Million)
TABLE 675 South Korea transportation in industrial display Market, By technology, 2019-2028 (USD Million)
TABLE 676 South Korea transportation in led for industrial display Market, By type, 2019-2028 (USD Million)
TABLE 677 South Korea transportation in oled for industrial display Market, By type, 2019-2028 (USD Million)
TABLE 678 South Korea metal & mining in industrial display Market, By technology, 2019-2028 (USD Million)
TABLE 679 South Korea metal & mining in led for industrial display Market, By type, 2019-2028 (USD Million)
TABLE 680 South Korea metal & mining in oled for industrial display Market, By type, 2019-2028 (USD Million)
TABLE 681 South Korea others in industrial display Market, By technology, 2019-2028 (USD Million)
TABLE 682 South Korea others in led for industrial display Market, By type, 2019-2028 (USD Million)
TABLE 683 South Korea others in oled for industrial display Market, By type, 2019-2028 (USD Million)
TABLE 684 Singapore industrial display Market, By type, 2019-2028 (USD Million)
TABLE 685 Singapore rugged display in industrial display Market, By type, 2019-2028 (USD Million)
TABLE 686 Singapore rugged display in industrial display Market, By level of ruggedness, 2019-2028 (USD Million)
TABLE 687 Singapore marine display in industrial display Market, By application, 2019-2028 (USD Million)
TABLE 688 Singapore industrial display Market, By technology, 2019-2028 (USD Million)
TABLE 689 Singapore led in industrial display Market, By type, 2019-2028 (USD Million)
TABLE 690 Singapore oled in industrial display Market, By type, 2019-2028 (USD Million)
TABLE 691 Singapore industrial display Market, By communication type, 2019-2028 (USD Million)
TABLE 692 Singapore industrial display Market, By panel size, 2019-2028 (USD Million)
TABLE 693 Singapore industrial display Market, By application, 2019-2028 (USD Million)
TABLE 694 Singapore industrial display Market, By Vertical, 2019-2028 (USD Million)
TABLE 695 Singapore manufacturing in industrial display Market, By technology, 2019-2028 (USD Million)
TABLE 696 Singapore manufacturing in led for industrial display Market, By type, 2019-2028 (USD Million)
TABLE 697 Singapore manufacturing in oled for industrial display Market, By type, 2019-2028 (USD Million)
TABLE 698 Singapore energy & power in industrial display Market, By technology, 2019-2028 (USD Million)
TABLE 699 Singapore energy & power in led for industrial display Market, By type, 2019-2028 (USD Million)
TABLE 700 Singapore energy & power in oled for industrial display Market, By type, 2019-2028 (USD Million)
TABLE 701 Singapore military & avionics in industrial display Market, By technology, 2019-2028 (USD Million)
TABLE 702 Singapore military & avionics in led for industrial display Market, By type, 2019-2028 (USD Million)
TABLE 703 Singapore military & avionics in oled for industrial display Market, By type, 2019-2028 (USD Million)
TABLE 704 Singapore oil & gas in industrial display Market, By technology, 2019-2028 (USD Million)
TABLE 705 Singapore oil & gas in led for industrial display Market, By type, 2019-2028 (USD Million)
TABLE 706 Singapore oil & gas in oled for industrial display Market, By type, 2019-2028 (USD Million)
TABLE 707 Singapore transportation in industrial display Market, By technology, 2019-2028 (USD Million)
TABLE 708 Singapore transportation in led for industrial display Market, By type, 2019-2028 (USD Million)
TABLE 709 Singapore transportation in oled for industrial display Market, By type, 2019-2028 (USD Million)
TABLE 710 Singapore metal & mining in industrial display Market, By technology, 2019-2028 (USD Million)
TABLE 711 Singapore metal & mining in led for industrial display Market, By type, 2019-2028 (USD Million)
TABLE 712 Singapore metal & mining in oled for industrial display Market, By type, 2019-2028 (USD Million)
TABLE 713 Singapore others in industrial display Market, By technology, 2019-2028 (USD Million)
TABLE 714 Singapore others in led for industrial display Market, By type, 2019-2028 (USD Million)
TABLE 715 Singapore others in oled for industrial display Market, By type, 2019-2028 (USD Million)
TABLE 716 India industrial display Market, By type, 2019-2028 (USD Million)
TABLE 717 India rugged display in industrial display Market, By type, 2019-2028 (USD Million)
TABLE 718 India rugged display in industrial display Market, By level of ruggedness, 2019-2028 (USD Million)
TABLE 719 India marine display in industrial display Market, By application, 2019-2028 (USD Million)
TABLE 720 India industrial display Market, By technology, 2019-2028 (USD Million)
TABLE 721 India led in industrial display Market, By type, 2019-2028 (USD Million)
TABLE 722 India oled in industrial display Market, By type, 2019-2028 (USD Million)
TABLE 723 India industrial display Market, By communication type, 2019-2028 (USD Million)
TABLE 724 India industrial display Market, By panel size, 2019-2028 (USD Million)
TABLE 725 India industrial display Market, By application, 2019-2028 (USD Million)
TABLE 726 India industrial display Market, By Vertical, 2019-2028 (USD Million)
TABLE 727 India manufacturing in industrial display Market, By technology, 2019-2028 (USD Million)
TABLE 728 India manufacturing in led for industrial display Market, By type, 2019-2028 (USD Million)
TABLE 729 India manufacturing in oled for industrial display Market, By type, 2019-2028 (USD Million)
TABLE 730 India energy & power in industrial display Market, By technology, 2019-2028 (USD Million)
TABLE 731 India energy & power in led for industrial display Market, By type, 2019-2028 (USD Million)
TABLE 732 India energy & power in oled for industrial display Market, By type, 2019-2028 (USD Million)
TABLE 733 India military & avionics in industrial display Market, By technology, 2019-2028 (USD Million)
TABLE 734 India military & avionics in led for industrial display Market, By type, 2019-2028 (USD Million)
TABLE 735 India military & avionics in oled for industrial display Market, By type, 2019-2028 (USD Million)
TABLE 736 India oil & gas in industrial display Market, By technology, 2019-2028 (USD Million)
TABLE 737 India oil & gas in led for industrial display Market, By type, 2019-2028 (USD Million)
TABLE 738 India oil & gas in oled for industrial display Market, By type, 2019-2028 (USD Million)
TABLE 739 India transportation in industrial display Market, By technology, 2019-2028 (USD Million)
TABLE 740 India transportation in led for industrial display Market, By type, 2019-2028 (USD Million)
TABLE 741 India transportation in oled for industrial display Market, By type, 2019-2028 (USD Million)
TABLE 742 India metal & mining in industrial display Market, By technology, 2019-2028 (USD Million)
TABLE 743 India metal & mining in led for industrial display Market, By type, 2019-2028 (USD Million)
TABLE 744 India metal & mining in oled for industrial display Market, By type, 2019-2028 (USD Million)
TABLE 745 India others in industrial display Market, By technology, 2019-2028 (USD Million)
TABLE 746 India others in led for industrial display Market, By type, 2019-2028 (USD Million)
TABLE 747 India others in oled for industrial display Market, By type, 2019-2028 (USD Million)
TABLE 748 Malaysia industrial display Market, By type, 2019-2028 (USD Million)
TABLE 749 Malaysia rugged display in industrial display Market, By type, 2019-2028 (USD Million)
TABLE 750 Malaysia rugged display in industrial display Market, By level of ruggedness, 2019-2028 (USD Million)
TABLE 751 Malaysia marine display in industrial display Market, By application, 2019-2028 (USD Million)
TABLE 752 Malaysia industrial display Market, By technology, 2019-2028 (USD Million)
TABLE 753 Malaysia led in industrial display Market, By type, 2019-2028 (USD Million)
TABLE 754 Malaysia oled in industrial display Market, By type, 2019-2028 (USD Million)
TABLE 755 Malaysia industrial display Market, By communication type, 2019-2028 (USD Million)
TABLE 756 Malaysia industrial display Market, By panel size, 2019-2028 (USD Million)
TABLE 757 Malaysia industrial display Market, By application, 2019-2028 (USD Million)
TABLE 758 Malaysia industrial display Market, By Vertical, 2019-2028 (USD Million)
TABLE 759 Malaysia manufacturing in industrial display Market, By technology, 2019-2028 (USD Million)
TABLE 760 Malaysia manufacturing in led for industrial display Market, By type, 2019-2028 (USD Million)
TABLE 761 Malaysia manufacturing in oled for industrial display Market, By type, 2019-2028 (USD Million)
TABLE 762 Malaysia energy & power in industrial display Market, By technology, 2019-2028 (USD Million)
TABLE 763 Malaysia energy & power in led for industrial display Market, By type, 2019-2028 (USD Million)
TABLE 764 Malaysia energy & power in oled for industrial display Market, By type, 2019-2028 (USD Million)
TABLE 765 Malaysia military & avionics in industrial display Market, By technology, 2019-2028 (USD Million)
TABLE 766 Malaysia military & avionics in led for industrial display Market, By type, 2019-2028 (USD Million)
TABLE 767 Malaysia military & avionics in oled for industrial display Market, By type, 2019-2028 (USD Million)
TABLE 768 Malaysia oil & gas in industrial display Market, By technology, 2019-2028 (USD Million)
TABLE 769 Malaysia oil & gas in led for industrial display Market, By type, 2019-2028 (USD Million)
TABLE 770 Malaysia oil & gas in oled for industrial display Market, By type, 2019-2028 (USD Million)
TABLE 771 Malaysia transportation in industrial display Market, By technology, 2019-2028 (USD Million)
TABLE 772 Malaysia transportation in led for industrial display Market, By type, 2019-2028 (USD Million)
TABLE 773 Malaysia transportation in oled for industrial display Market, By type, 2019-2028 (USD Million)
TABLE 774 Malaysia metal & mining in industrial display Market, By technology, 2019-2028 (USD Million)
TABLE 775 Malaysia metal & mining in led for industrial display Market, By type, 2019-2028 (USD Million)
TABLE 776 Malaysia metal & mining in oled for industrial display Market, By type, 2019-2028 (USD Million)
TABLE 777 Malaysia others in industrial display Market, By technology, 2019-2028 (USD Million)
TABLE 778 Malaysia others in led for industrial display Market, By type, 2019-2028 (USD Million)
TABLE 779 Malaysia others in oled for industrial display Market, By type, 2019-2028 (USD Million)
TABLE 780 Thailand industrial display Market, By type, 2019-2028 (USD Million)
TABLE 781 Thailand rugged display in industrial display Market, By type, 2019-2028 (USD Million)
TABLE 782 Thailand rugged display in industrial display Market, By level of ruggedness, 2019-2028 (USD Million)
TABLE 783 Thailand marine display in industrial display Market, By application, 2019-2028 (USD Million)
TABLE 784 Thailand industrial display Market, By technology, 2019-2028 (USD Million)
TABLE 785 Thailand led in industrial display Market, By type, 2019-2028 (USD Million)
TABLE 786 Thailand oled in industrial display Market, By type, 2019-2028 (USD Million)
TABLE 787 Thailand industrial display Market, By communication type, 2019-2028 (USD Million)
TABLE 788 Thailand industrial display Market, By panel size, 2019-2028 (USD Million)
TABLE 789 Thailand industrial display Market, By application, 2019-2028 (USD Million)
TABLE 790 Thailand industrial display Market, By Vertical, 2019-2028 (USD Million)
TABLE 791 Thailand manufacturing in industrial display Market, By technology, 2019-2028 (USD Million)
TABLE 792 Thailand manufacturing in led for industrial display Market, By type, 2019-2028 (USD Million)
TABLE 793 Thailand manufacturing in oled for industrial display Market, By type, 2019-2028 (USD Million)
TABLE 794 Thailand energy & power in industrial display Market, By technology, 2019-2028 (USD Million)
TABLE 795 Thailand energy & power in led for industrial display Market, By type, 2019-2028 (USD Million)
TABLE 796 Thailand energy & power in oled for industrial display Market, By type, 2019-2028 (USD Million)
TABLE 797 Thailand military & avionics in industrial display Market, By technology, 2019-2028 (USD Million)
TABLE 798 Thailand military & avionics in led for industrial display Market, By type, 2019-2028 (USD Million)
TABLE 799 Thailand military & avionics in oled for industrial display Market, By type, 2019-2028 (USD Million)
TABLE 800 Thailand oil & gas in industrial display Market, By technology, 2019-2028 (USD Million)
TABLE 801 Thailand oil & gas in led for industrial display Market, By type, 2019-2028 (USD Million)
TABLE 802 Thailand oil & gas in oled for industrial display Market, By type, 2019-2028 (USD Million)
TABLE 803 Thailand transportation in industrial display Market, By technology, 2019-2028 (USD Million)
TABLE 804 Thailand transportation in led for industrial display Market, By type, 2019-2028 (USD Million)
TABLE 805 Thailand transportation in oled for industrial display Market, By type, 2019-2028 (USD Million)
TABLE 806 Thailand metal & mining in industrial display Market, By technology, 2019-2028 (USD Million)
TABLE 807 Thailand metal & mining in led for industrial display Market, By type, 2019-2028 (USD Million)
TABLE 808 Thailand metal & mining in oled for industrial display Market, By type, 2019-2028 (USD Million)
TABLE 809 Thailand others in industrial display Market, By technology, 2019-2028 (USD Million)
TABLE 810 Thailand others in led for industrial display Market, By type, 2019-2028 (USD Million)
TABLE 811 Thailand others in oled for industrial display Market, By type, 2019-2028 (USD Million)
TABLE 812 Indonesia industrial display Market, By type, 2019-2028 (USD Million)
TABLE 813 Indonesia rugged display in industrial display Market, By type, 2019-2028 (USD Million)
TABLE 814 Indonesia rugged display in industrial display Market, By level of ruggedness, 2019-2028 (USD Million)
TABLE 815 Indonesia marine display in industrial display Market, By application, 2019-2028 (USD Million)
TABLE 816 Indonesia industrial display Market, By technology, 2019-2028 (USD Million)
TABLE 817 Indonesia led in industrial display Market, By type, 2019-2028 (USD Million)
TABLE 818 Indonesia oled in industrial display Market, By type, 2019-2028 (USD Million)
TABLE 819 Indonesia industrial display Market, By communication type, 2019-2028 (USD Million)
TABLE 820 Indonesia industrial display Market, By panel size, 2019-2028 (USD Million)
TABLE 821 Indonesia industrial display Market, By application, 2019-2028 (USD Million)
TABLE 822 Indonesia industrial display Market, By Vertical, 2019-2028 (USD Million)
TABLE 823 Indonesia manufacturing in industrial display Market, By technology, 2019-2028 (USD Million)
TABLE 824 Indonesia manufacturing in led for industrial display Market, By type, 2019-2028 (USD Million)
TABLE 825 Indonesia manufacturing in oled for industrial display Market, By type, 2019-2028 (USD Million)
TABLE 826 Indonesia energy & power in industrial display Market, By technology, 2019-2028 (USD Million)
TABLE 827 Indonesia energy & power in led for industrial display Market, By type, 2019-2028 (USD Million)
TABLE 828 Indonesia energy & power in oled for industrial display Market, By type, 2019-2028 (USD Million)
TABLE 829 Indonesia military & avionics in industrial display Market, By technology, 2019-2028 (USD Million)
TABLE 830 Indonesia military & avionics in led for industrial display Market, By type, 2019-2028 (USD Million)
TABLE 831 Indonesia military & avionics in oled for industrial display Market, By type, 2019-2028 (USD Million)
TABLE 832 Indonesia oil & gas in industrial display Market, By technology, 2019-2028 (USD Million)
TABLE 833 Indonesia oil & gas in led for industrial display Market, By type, 2019-2028 (USD Million)
TABLE 834 Indonesia oil & gas in oled for industrial display Market, By type, 2019-2028 (USD Million)
TABLE 835 Indonesia transportation in industrial display Market, By technology, 2019-2028 (USD Million)
TABLE 836 Indonesia transportation in led for industrial display Market, By type, 2019-2028 (USD Million)
TABLE 837 Indonesia transportation in oled for industrial display Market, By type, 2019-2028 (USD Million)
TABLE 838 Indonesia metal & mining in industrial display Market, By technology, 2019-2028 (USD Million)
TABLE 839 Indonesia metal & mining in led for industrial display Market, By type, 2019-2028 (USD Million)
TABLE 840 Indonesia metal & mining in oled for industrial display Market, By type, 2019-2028 (USD Million)
TABLE 841 Indonesia others in industrial display Market, By technology, 2019-2028 (USD Million)
TABLE 842 Indonesia others in led for industrial display Market, By type, 2019-2028 (USD Million)
TABLE 843 Indonesia others in oled for industrial display Market, By type, 2019-2028 (USD Million)
TABLE 844 Australia industrial display Market, By type, 2019-2028 (USD Million)
TABLE 845 Australia rugged display in industrial display Market, By type, 2019-2028 (USD Million)
TABLE 846 Australia rugged display in industrial display Market, By level of ruggedness, 2019-2028 (USD Million)
TABLE 847 Australia marine display in industrial display Market, By application, 2019-2028 (USD Million)
TABLE 848 Australia industrial display Market, By technology, 2019-2028 (USD Million)
TABLE 849 Australia led in industrial display Market, By type, 2019-2028 (USD Million)
TABLE 850 Australia oled in industrial display Market, By type, 2019-2028 (USD Million)
TABLE 851 Australia industrial display Market, By communication type, 2019-2028 (USD Million)
TABLE 852 Australia industrial display Market, By panel size, 2019-2028 (USD Million)
TABLE 853 Australia industrial display Market, By application, 2019-2028 (USD Million)
TABLE 854 Australia industrial display Market, By Vertical, 2019-2028 (USD Million)
TABLE 855 Australia manufacturing in industrial display Market, By technology, 2019-2028 (USD Million)
TABLE 856 Australia manufacturing in led for industrial display Market, By type, 2019-2028 (USD Million)
TABLE 857 Australia manufacturing in oled for industrial display Market, By type, 2019-2028 (USD Million)
TABLE 858 Australia energy & power in industrial display Market, By technology, 2019-2028 (USD Million)
TABLE 859 Australia energy & power in led for industrial display Market, By type, 2019-2028 (USD Million)
TABLE 860 Australia energy & power in oled for industrial display Market, By type, 2019-2028 (USD Million)
TABLE 861 Australia military & avionics in industrial display Market, By technology, 2019-2028 (USD Million)
TABLE 862 Australia military & avionics in led for industrial display Market, By type, 2019-2028 (USD Million)
TABLE 863 Australia military & avionics in oled for industrial display Market, By type, 2019-2028 (USD Million)
TABLE 864 Australia oil & gas in industrial display Market, By technology, 2019-2028 (USD Million)
TABLE 865 Australia oil & gas in led for industrial display Market, By type, 2019-2028 (USD Million)
TABLE 866 Australia oil & gas in oled for industrial display Market, By type, 2019-2028 (USD Million)
TABLE 867 Australia transportation in industrial display Market, By technology, 2019-2028 (USD Million)
TABLE 868 Australia transportation in led for industrial display Market, By type, 2019-2028 (USD Million)
TABLE 869 Australia transportation in oled for industrial display Market, By type, 2019-2028 (USD Million)
TABLE 870 Australia metal & mining in industrial display Market, By technology, 2019-2028 (USD Million)
TABLE 871 Australia metal & mining in led for industrial display Market, By type, 2019-2028 (USD Million)
TABLE 872 Australia metal & mining in oled for industrial display Market, By type, 2019-2028 (USD Million)
TABLE 873 Australia others in industrial display Market, By technology, 2019-2028 (USD Million)
TABLE 874 Australia others in led for industrial display Market, By type, 2019-2028 (USD Million)
TABLE 875 Australia others in oled for industrial display Market, By type, 2019-2028 (USD Million)
TABLE 876 Philippines industrial display Market, By type, 2019-2028 (USD Million)
TABLE 877 Philippines rugged display in industrial display Market, By type, 2019-2028 (USD Million)
TABLE 878 Philippines rugged display in industrial display Market, By level of ruggedness, 2019-2028 (USD Million)
TABLE 879 Philippines marine display in industrial display Market, By application, 2019-2028 (USD Million)
TABLE 880 Philippines industrial display Market, By technology, 2019-2028 (USD Million)
TABLE 881 Philippines led in industrial display Market, By type, 2019-2028 (USD Million)
TABLE 882 Philippines oled in industrial display Market, By type, 2019-2028 (USD Million)
TABLE 883 Philippines industrial display Market, By communication type, 2019-2028 (USD Million)
TABLE 884 Philippines industrial display Market, By panel size, 2019-2028 (USD Million)
TABLE 885 Philippines industrial display Market, By application, 2019-2028 (USD Million)
TABLE 886 Philippines industrial display Market, By Vertical, 2019-2028 (USD Million)
TABLE 887 Philippines manufacturing in industrial display Market, By technology, 2019-2028 (USD Million)
TABLE 888 Philippines manufacturing in led for industrial display Market, By type, 2019-2028 (USD Million)
TABLE 889 Philippines manufacturing in oled for industrial display Market, By type, 2019-2028 (USD Million)
TABLE 890 Philippines energy & power in industrial display Market, By technology, 2019-2028 (USD Million)
TABLE 891 Philippines energy & power in led for industrial display Market, By type, 2019-2028 (USD Million)
TABLE 892 Philippines energy & power in oled for industrial display Market, By type, 2019-2028 (USD Million)
TABLE 893 Philippines military & avionics in industrial display Market, By technology, 2019-2028 (USD Million)
TABLE 894 Philippines military & avionics in led for industrial display Market, By type, 2019-2028 (USD Million)
TABLE 895 Philippines military & avionics in oled for industrial display Market, By type, 2019-2028 (USD Million)
TABLE 896 Philippines oil & gas in industrial display Market, By technology, 2019-2028 (USD Million)
TABLE 897 Philippines oil & gas in led for industrial display Market, By type, 2019-2028 (USD Million)
TABLE 898 Philippines oil & gas in oled for industrial display Market, By type, 2019-2028 (USD Million)
TABLE 899 Philippines transportation in industrial display Market, By technology, 2019-2028 (USD Million)
TABLE 900 Philippines transportation in led for industrial display Market, By type, 2019-2028 (USD Million)
TABLE 901 Philippines transportation in oled for industrial display Market, By type, 2019-2028 (USD Million)
TABLE 902 Philippines metal & mining in industrial display Market, By technology, 2019-2028 (USD Million)
TABLE 903 Philippines metal & mining in led for industrial display Market, By type, 2019-2028 (USD Million)
TABLE 904 Philippines metal & mining in oled for industrial display Market, By type, 2019-2028 (USD Million)
TABLE 905 Philippines others in industrial display Market, By technology, 2019-2028 (USD Million)
TABLE 906 Philippines others in led for industrial display Market, By type, 2019-2028 (USD Million)
TABLE 907 Philippines others in oled for industrial display Market, By type, 2019-2028 (USD Million)
TABLE 908 REST OF ASIA–PACIFIC IN industrial display Market, By type, 2019-2028 (USD Million)
TABLE 909 Middle East and Africa INDUSTRIAL DISPLAY Market, By COUNTRY, 2019-2028 (USD Million)
TABLE 910 Middle East and Africa industrial display Market, By type, 2019-2028 (USD Million)
TABLE 911 Middle East and Africa rugged display in industrial display Market, By type, 2019-2028 (USD Million)
TABLE 912 Middle East and Africa rugged display in industrial display Market, By level of ruggedness, 2019-2028 (USD Million)
TABLE 913 Middle East and Africa marine display in industrial display Market, By application, 2019-2028 (USD Million)
TABLE 914 Middle East and Africa industrial display Market, By technology, 2019-2028 (USD Million)
TABLE 915 Middle East and Africa led in industrial display Market, By type, 2019-2028 (USD Million)
TABLE 916 Middle East and Africa oled in industrial display Market, By type, 2019-2028 (USD Million)
TABLE 917 Middle East and Africa industrial display Market, By communication type, 2019-2028 (USD Million)
TABLE 918 Middle East and Africa industrial display Market, By panel size, 2019-2028 (USD Million)
TABLE 919 Middle East and Africa industrial display Market, By application, 2019-2028 (USD Million)
TABLE 920 Middle East and Africa industrial display Market, By Vertical, 2019-2028 (USD Million)
TABLE 921 Middle East and Africa manufacturing in industrial display Market, By technology, 2019-2028 (USD Million)
TABLE 922 Middle East and Africa manufacturing in led for industrial display Market, By type, 2019-2028 (USD Million)
TABLE 923 Middle East and Africa manufacturing in oled for industrial display Market, By type, 2019-2028 (USD Million)
TABLE 924 Middle East and Africa energy & power in industrial display Market, By technology, 2019-2028 (USD Million)
TABLE 925 Middle East and Africa energy & power in led for industrial display Market, By type, 2019-2028 (USD Million)
TABLE 926 Middle East and Africa energy & power in oled for industrial display Market, By type, 2019-2028 (USD Million)
TABLE 927 Middle East and Africa military & avionics in industrial display Market, By technology, 2019-2028 (USD Million)
TABLE 928 Middle East and Africa military & avionics in led for industrial display Market, By type, 2019-2028 (USD Million)
TABLE 929 Middle East and Africa military & avionics in oled for industrial display Market, By type, 2019-2028 (USD Million)
TABLE 930 Middle East and Africa oil & gas in industrial display Market, By technology, 2019-2028 (USD Million)
TABLE 931 Middle East and Africa oil & gas in led for industrial display Market, By type, 2019-2028 (USD Million)
TABLE 932 Middle East and Africa oil & gas in oled for industrial display Market, By type, 2019-2028 (USD Million)
TABLE 933 Middle East and Africa transportation in industrial display Market, By technology, 2019-2028 (USD Million)
TABLE 934 Middle East and Africa transportation in led for industrial display Market, By type, 2019-2028 (USD Million)
TABLE 935 Middle East and Africa transportation in oled for industrial display Market, By type, 2019-2028 (USD Million)
TABLE 936 Middle East and Africa metal & mining in industrial display Market, By technology, 2019-2028 (USD Million)
TABLE 937 Middle East and Africa metal & mining in led for industrial display Market, By type, 2019-2028 (USD Million)
TABLE 938 Middle East and Africa metal & mining in oled for industrial display Market, By type, 2019-2028 (USD Million)
TABLE 939 Middle East and Africa others in industrial display Market, By technology, 2019-2028 (USD Million)
TABLE 940 Middle East and Africa others in led for industrial display Market, By type, 2019-2028 (USD Million)
TABLE 941 Middle East and Africa others in oled for industrial display Market, By type, 2019-2028 (USD Million)
TABLE 942 U.A.E industrial display Market, By type, 2019-2028 (USD Million)
TABLE 943 U.A.E rugged display in industrial display Market, By type, 2019-2028 (USD Million)
TABLE 944 U.A.E rugged display in industrial display Market, By level of ruggedness, 2019-2028 (USD Million)
TABLE 945 U.A.E marine display in industrial display Market, By application, 2019-2028 (USD Million)
TABLE 946 U.A.E industrial display Market, By technology, 2019-2028 (USD Million)
TABLE 947 U.A.E led in industrial display Market, By type, 2019-2028 (USD Million)
TABLE 948 U.A.E oled in industrial display Market, By type, 2019-2028 (USD Million)
TABLE 949 U.A.E industrial display Market, By communication type, 2019-2028 (USD Million)
TABLE 950 U.A.E industrial display Market, By panel size, 2019-2028 (USD Million)
TABLE 951 U.A.E industrial display Market, By application, 2019-2028 (USD Million)
TABLE 952 U.A.E industrial display Market, By Vertical, 2019-2028 (USD Million)
TABLE 953 U.A.E manufacturing in industrial display Market, By technology, 2019-2028 (USD Million)
TABLE 954 U.A.E manufacturing in led for industrial display Market, By type, 2019-2028 (USD Million)
TABLE 955 U.A.E manufacturing in oled for industrial display Market, By type, 2019-2028 (USD Million)
TABLE 956 U.A.E energy & power in industrial display Market, By technology, 2019-2028 (USD Million)
TABLE 957 U.A.E energy & power in led for industrial display Market, By type, 2019-2028 (USD Million)
TABLE 958 U.A.E energy & power in oled for industrial display Market, By type, 2019-2028 (USD Million)
TABLE 959 U.A.E military & avionics in industrial display Market, By technology, 2019-2028 (USD Million)
TABLE 960 U.A.E military & avionics in led for industrial display Market, By type, 2019-2028 (USD Million)
TABLE 961 U.A.E military & avionics in oled for industrial display Market, By type, 2019-2028 (USD Million)
TABLE 962 U.A.E oil & gas in industrial display Market, By technology, 2019-2028 (USD Million)
TABLE 963 U.A.E oil & gas in led for industrial display Market, By type, 2019-2028 (USD Million)
TABLE 964 U.A.E oil & gas in oled for industrial display Market, By type, 2019-2028 (USD Million)
TABLE 965 U.A.E transportation in industrial display Market, By technology, 2019-2028 (USD Million)
TABLE 966 U.A.E transportation in led for industrial display Market, By type, 2019-2028 (USD Million)
TABLE 967 U.A.E transportation in oled for industrial display Market, By type, 2019-2028 (USD Million)
TABLE 968 U.A.E metal & mining in industrial display Market, By technology, 2019-2028 (USD Million)
TABLE 969 U.A.E metal & mining in led for industrial display Market, By type, 2019-2028 (USD Million)
TABLE 970 U.A.E metal & mining in oled for industrial display Market, By type, 2019-2028 (USD Million)
TABLE 971 U.A.E others in industrial display Market, By technology, 2019-2028 (USD Million)
TABLE 972 U.A.E others in led for industrial display Market, By type, 2019-2028 (USD Million)
TABLE 973 U.A.E others in oled for industrial display Market, By type, 2019-2028 (USD Million)
TABLE 974 SAUDI ARABIA industrial display Market, By type, 2019-2028 (USD Million)
TABLE 975 SAUDI ARABIA rugged display in industrial display Market, By type, 2019-2028 (USD Million)
TABLE 976 SAUDI ARABIA rugged display in industrial display Market, By level of ruggedness, 2019-2028 (USD Million)
TABLE 977 SAUDI ARABIA marine display in industrial display Market, By application, 2019-2028 (USD Million)
TABLE 978 SAUDI ARABIA industrial display Market, By technology, 2019-2028 (USD Million)
TABLE 979 SAUDI ARABIA led in industrial display Market, By type, 2019-2028 (USD Million)
TABLE 980 SAUDI ARABIA oled in industrial display Market, By type, 2019-2028 (USD Million)
TABLE 981 SAUDI ARABIA industrial display Market, By communication type, 2019-2028 (USD Million)
TABLE 982 SAUDI ARABIA industrial display Market, By panel size, 2019-2028 (USD Million)
TABLE 983 SAUDI ARABIA industrial display Market, By application, 2019-2028 (USD Million)
TABLE 984 SAUDI ARABIA industrial display Market, By Vertical, 2019-2028 (USD Million)
TABLE 985 SAUDI ARABIA manufacturing in industrial display Market, By technology, 2019-2028 (USD Million)
TABLE 986 SAUDI ARABIA manufacturing in led for industrial display Market, By type, 2019-2028 (USD Million)
TABLE 987 SAUDI ARABIA manufacturing in oled for industrial display Market, By type, 2019-2028 (USD Million)
TABLE 988 SAUDI ARABIA energy & power in industrial display Market, By technology, 2019-2028 (USD Million)
TABLE 989 SAUDI ARABIA energy & power in led for industrial display Market, By type, 2019-2028 (USD Million)
TABLE 990 SAUDI ARABIA energy & power in oled for industrial display Market, By type, 2019-2028 (USD Million)
TABLE 991 SAUDI ARABIA military & avionics in industrial display Market, By technology, 2019-2028 (USD Million)
TABLE 992 SAUDI ARABIA military & avionics in led for industrial display Market, By type, 2019-2028 (USD Million)
TABLE 993 SAUDI ARABIA military & avionics in oled for industrial display Market, By type, 2019-2028 (USD Million)
TABLE 994 SAUDI ARABIA oil & gas in industrial display Market, By technology, 2019-2028 (USD Million)
TABLE 995 SAUDI ARABIA oil & gas in led for industrial display Market, By type, 2019-2028 (USD Million)
TABLE 996 SAUDI ARABIA oil & gas in oled for industrial display Market, By type, 2019-2028 (USD Million)
TABLE 997 SAUDI ARABIA transportation in industrial display Market, By technology, 2019-2028 (USD Million)
TABLE 998 SAUDI ARABIA transportation in led for industrial display Market, By type, 2019-2028 (USD Million)
TABLE 999 SAUDI ARABIA transportation in oled for industrial display Market, By type, 2019-2028 (USD Million)
TABLE 1000 SAUDI ARABIA metal & mining in industrial display Market, By technology, 2019-2028 (USD Million)
TABLE 1001 SAUDI ARABIA metal & mining in led for industrial display Market, By type, 2019-2028 (USD Million)
TABLE 1002 SAUDI ARABIA metal & mining in oled for industrial display Market, By type, 2019-2028 (USD Million)
TABLE 1003 SAUDI ARABIA others in industrial display Market, By technology, 2019-2028 (USD Million)
TABLE 1004 SAUDI ARABIA others in led for industrial display Market, By type, 2019-2028 (USD Million)
TABLE 1005 SAUDI ARABIA others in oled for industrial display Market, By type, 2019-2028 (USD Million)
TABLE 1006 SOUTH AFRICA industrial display Market, By type, 2019-2028 (USD Million)
TABLE 1007 SOUTH AFRICA rugged display in industrial display Market, By type, 2019-2028 (USD Million)
TABLE 1008 SOUTH AFRICA rugged display in industrial display Market, By level of ruggedness, 2019-2028 (USD Million)
TABLE 1009 SOUTH AFRICA marine display in industrial display Market, By application, 2019-2028 (USD Million)
TABLE 1010 SOUTH AFRICA industrial display Market, By technology, 2019-2028 (USD Million)
TABLE 1011 SOUTH AFRICA led in industrial display Market, By type, 2019-2028 (USD Million)
TABLE 1012 SOUTH AFRICA oled in industrial display Market, By type, 2019-2028 (USD Million)
TABLE 1013 SOUTH AFRICA industrial display Market, By communication type, 2019-2028 (USD Million)
TABLE 1014 SOUTH AFRICA industrial display Market, By panel size, 2019-2028 (USD Million)
TABLE 1015 SOUTH AFRICA industrial display Market, By application, 2019-2028 (USD Million)
TABLE 1016 SOUTH AFRICA industrial display Market, By Vertical, 2019-2028 (USD Million)
TABLE 1017 SOUTH AFRICA manufacturing in industrial display Market, By technology, 2019-2028 (USD Million)
TABLE 1018 SOUTH AFRICA manufacturing in led for industrial display Market, By type, 2019-2028 (USD Million)
TABLE 1019 SOUTH AFRICA manufacturing in oled for industrial display Market, By type, 2019-2028 (USD Million)
TABLE 1020 SOUTH AFRICA energy & power in industrial display Market, By technology, 2019-2028 (USD Million)
TABLE 1021 SOUTH AFRICA energy & power in led for industrial display Market, By type, 2019-2028 (USD Million)
TABLE 1022 SOUTH AFRICA energy & power in oled for industrial display Market, By type, 2019-2028 (USD Million)
TABLE 1023 SOUTH AFRICA military & avionics in industrial display Market, By technology, 2019-2028 (USD Million)
TABLE 1024 SOUTH AFRICA military & avionics in led for industrial display Market, By type, 2019-2028 (USD Million)
TABLE 1025 SOUTH AFRICA military & avionics in oled for industrial display Market, By type, 2019-2028 (USD Million)
TABLE 1026 SOUTH AFRICA oil & gas in industrial display Market, By technology, 2019-2028 (USD Million)
TABLE 1027 SOUTH AFRICA oil & gas in led for industrial display Market, By type, 2019-2028 (USD Million)
TABLE 1028 SOUTH AFRICA oil & gas in oled for industrial display Market, By type, 2019-2028 (USD Million)
TABLE 1029 SOUTH AFRICA transportation in industrial display Market, By technology, 2019-2028 (USD Million)
TABLE 1030 SOUTH AFRICA transportation in led for industrial display Market, By type, 2019-2028 (USD Million)
TABLE 1031 SOUTH AFRICA transportation in oled for industrial display Market, By type, 2019-2028 (USD Million)
TABLE 1032 SOUTH AFRICA metal & mining in industrial display Market, By technology, 2019-2028 (USD Million)
TABLE 1033 SOUTH AFRICA metal & mining in led for industrial display Market, By type, 2019-2028 (USD Million)
TABLE 1034 SOUTH AFRICA metal & mining in oled for industrial display Market, By type, 2019-2028 (USD Million)
TABLE 1035 SOUTH AFRICA others in industrial display Market, By technology, 2019-2028 (USD Million)
TABLE 1036 SOUTH AFRICA others in led for industrial display Market, By type, 2019-2028 (USD Million)
TABLE 1037 SOUTH AFRICA others in oled for industrial display Market, By type, 2019-2028 (USD Million)
TABLE 1038 EGYPT industrial display Market, By type, 2019-2028 (USD Million)
TABLE 1039 EGYPT rugged display in industrial display Market, By type, 2019-2028 (USD Million)
TABLE 1040 EGYPT rugged display in industrial display Market, By level of ruggedness, 2019-2028 (USD Million)
TABLE 1041 EGYPT marine display in industrial display Market, By application, 2019-2028 (USD Million)
TABLE 1042 EGYPT industrial display Market, By technology, 2019-2028 (USD Million)
TABLE 1043 EGYPT led in industrial display Market, By type, 2019-2028 (USD Million)
TABLE 1044 EGYPT oled in industrial display Market, By type, 2019-2028 (USD Million)
TABLE 1045 EGYPT industrial display Market, By communication type, 2019-2028 (USD Million)
TABLE 1046 EGYPT industrial display Market, By panel size, 2019-2028 (USD Million)
TABLE 1047 EGYPT industrial display Market, By application, 2019-2028 (USD Million)
TABLE 1048 EGYPT industrial display Market, By Vertical, 2019-2028 (USD Million)
TABLE 1049 EGYPT manufacturing in industrial display Market, By technology, 2019-2028 (USD Million)
TABLE 1050 EGYPT manufacturing in led for industrial display Market, By type, 2019-2028 (USD Million)
TABLE 1051 EGYPT manufacturing in oled for industrial display Market, By type, 2019-2028 (USD Million)
TABLE 1052 EGYPT energy & power in industrial display Market, By technology, 2019-2028 (USD Million)
TABLE 1053 EGYPT energy & power in led for industrial display Market, By type, 2019-2028 (USD Million)
TABLE 1054 EGYPT energy & power in oled for industrial display Market, By type, 2019-2028 (USD Million)
TABLE 1055 EGYPT military & avionics in industrial display Market, By technology, 2019-2028 (USD Million)
TABLE 1056 EGYPT military & avionics in led for industrial display Market, By type, 2019-2028 (USD Million)
TABLE 1057 EGYPT military & avionics in oled for industrial display Market, By type, 2019-2028 (USD Million)
TABLE 1058 EGYPT oil & gas in industrial display Market, By technology, 2019-2028 (USD Million)
TABLE 1059 EGYPT oil & gas in led for industrial display Market, By type, 2019-2028 (USD Million)
TABLE 1060 EGYPT oil & gas in oled for industrial display Market, By type, 2019-2028 (USD Million)
TABLE 1061 EGYPT transportation in industrial display Market, By technology, 2019-2028 (USD Million)
TABLE 1062 EGYPT transportation in led for industrial display Market, By type, 2019-2028 (USD Million)
TABLE 1063 EGYPT transportation in oled for industrial display Market, By type, 2019-2028 (USD Million)
TABLE 1064 EGYPT metal & mining in industrial display Market, By technology, 2019-2028 (USD Million)
TABLE 1065 EGYPT metal & mining in led for industrial display Market, By type, 2019-2028 (USD Million)
TABLE 1066 EGYPT metal & mining in oled for industrial display Market, By type, 2019-2028 (USD Million)
TABLE 1067 EGYPT others in industrial display Market, By technology, 2019-2028 (USD Million)
TABLE 1068 EGYPT others in led for industrial display Market, By type, 2019-2028 (USD Million)
TABLE 1069 EGYPT others in oled for industrial display Market, By type, 2019-2028 (USD Million)
TABLE 1070 ISRAEL industrial display Market, By type, 2019-2028 (USD Million)
TABLE 1071 ISRAEL rugged display in industrial display Market, By type, 2019-2028 (USD Million)
TABLE 1072 ISRAEL rugged display in industrial display Market, By level of ruggedness, 2019-2028 (USD Million)
TABLE 1073 ISRAEL marine display in industrial display Market, By application, 2019-2028 (USD Million)
TABLE 1074 ISRAEL industrial display Market, By technology, 2019-2028 (USD Million)
TABLE 1075 ISRAEL led in industrial display Market, By type, 2019-2028 (USD Million)
TABLE 1076 ISRAEL oled in industrial display Market, By type, 2019-2028 (USD Million)
TABLE 1077 ISRAEL industrial display Market, By communication type, 2019-2028 (USD Million)
TABLE 1078 ISRAEL industrial display Market, By panel size, 2019-2028 (USD Million)
TABLE 1079 ISRAEL industrial display Market, By application, 2019-2028 (USD Million)
TABLE 1080 ISRAEL industrial display Market, By Vertical, 2019-2028 (USD Million)
TABLE 1081 ISRAEL manufacturing in industrial display Market, By technology, 2019-2028 (USD Million)
TABLE 1082 ISRAEL manufacturing in led for industrial display Market, By type, 2019-2028 (USD Million)
TABLE 1083 ISRAEL manufacturing in oled for industrial display Market, By type, 2019-2028 (USD Million)
TABLE 1084 ISRAEL energy & power in industrial display Market, By technology, 2019-2028 (USD Million)
TABLE 1085 ISRAEL energy & power in led for industrial display Market, By type, 2019-2028 (USD Million)
TABLE 1086 ISRAEL energy & power in oled for industrial display Market, By type, 2019-2028 (USD Million)
TABLE 1087 ISRAEL military & avionics in industrial display Market, By technology, 2019-2028 (USD Million)
TABLE 1088 ISRAEL military & avionics in led for industrial display Market, By type, 2019-2028 (USD Million)
TABLE 1089 ISRAEL military & avionics in oled for industrial display Market, By type, 2019-2028 (USD Million)
TABLE 1090 ISRAEL oil & gas in industrial display Market, By technology, 2019-2028 (USD Million)
TABLE 1091 ISRAEL oil & gas in led for industrial display Market, By type, 2019-2028 (USD Million)
TABLE 1092 ISRAEL oil & gas in oled for industrial display Market, By type, 2019-2028 (USD Million)
TABLE 1093 ISRAEL transportation in industrial display Market, By technology, 2019-2028 (USD Million)
TABLE 1094 ISRAEL transportation in led for industrial display Market, By type, 2019-2028 (USD Million)
TABLE 1095 ISRAEL transportation in oled for industrial display Market, By type, 2019-2028 (USD Million)
TABLE 1096 ISRAEL metal & mining in industrial display Market, By technology, 2019-2028 (USD Million)
TABLE 1097 ISRAEL metal & mining in led for industrial display Market, By type, 2019-2028 (USD Million)
TABLE 1098 ISRAEL metal & mining in oled for industrial display Market, By type, 2019-2028 (USD Million)
TABLE 1099 ISRAEL others in industrial display Market, By technology, 2019-2028 (USD Million)
TABLE 1100 ISRAEL others in led for industrial display Market, By type, 2019-2028 (USD Million)
TABLE 1101 ISRAEL others in oled for industrial display Market, By type, 2019-2028 (USD Million)
TABLE 1102 rest of middle east and africa industrial display Market, By type, 2019-2028 (USD Million)
TABLE 1103 South America INDUSTRIAL DISPLAY Market, By COUNTRY, 2019-2028 (USD million)
TABLE 1104 South America industrial display Market, By type, 2019-2028 (USD million)
TABLE 1105 South America rugged display in industrial display Market, By type, 2019-2028 (USD million)
TABLE 1106 South America rugged display in industrial display Market, By level of ruggedness, 2019-2028 (USD million)
TABLE 1107 South America marine display in industrial display Market, By application, 2019-2028 (USD million)
TABLE 1108 South America industrial display Market, By technology, 2019-2028 (USD million)
TABLE 1109 South America led in industrial display Market, By type, 2019-2028 (USD million)
TABLE 1110 South America oled in industrial display Market, By type, 2019-2028 (USD million)
TABLE 1111 South America industrial display Market, By communication type, 2019-2028 (USD million)
TABLE 1112 South America industrial display Market, By panel size, 2019-2028 (USD million)
TABLE 1113 South America industrial display Market, By application, 2019-2028 (USD million)
TABLE 1114 South America industrial display Market, By Vertical, 2019-2028 (USD million)
TABLE 1115 South America manufacturing in industrial display Market, By technology, 2019-2028 (USD million)
TABLE 1116 South America manufacturing in led for industrial display Market, By type, 2019-2028 (USD million)
TABLE 1117 South America manufacturing in oled for industrial display Market, By type, 2019-2028 (USD million)
TABLE 1118 South America energy & power in industrial display Market, By technology, 2019-2028 (USD million)
TABLE 1119 South America energy & power in led for industrial display Market, By type, 2019-2028 (USD million)
TABLE 1120 South America energy & power in oled for industrial display Market, By type, 2019-2028 (USD million)
TABLE 1121 South America military & avionics in industrial display Market, By technology, 2019-2028 (USD million)
TABLE 1122 South America military & avionics in led for industrial display Market, By type, 2019-2028 (USD million)
TABLE 1123 South America military & avionics in oled for industrial display Market, By type, 2019-2028 (USD million)
TABLE 1124 South America oil & gas in industrial display Market, By technology, 2019-2028 (USD million)
TABLE 1125 South America oil & gas in led for industrial display Market, By type, 2019-2028 (USD million)
TABLE 1126 South America oil & gas in oled for industrial display Market, By type, 2019-2028 (USD million)
TABLE 1127 South America transportation in industrial display Market, By technology, 2019-2028 (USD million)
TABLE 1128 South America transportation in led for industrial display Market, By type, 2019-2028 (USD million)
TABLE 1129 South America transportation in oled for industrial display Market, By type, 2019-2028 (USD million)
TABLE 1130 South America metal & mining in industrial display Market, By technology, 2019-2028 (USD million)
TABLE 1131 South America metal & mining in led for industrial display Market, By type, 2019-2028 (USD million)
TABLE 1132 South America metal & mining in oled for industrial display Market, By type, 2019-2028 (USD million)
TABLE 1133 South America others in industrial display Market, By technology, 2019-2028 (USD million)
TABLE 1134 South America others in led for industrial display Market, By type, 2019-2028 (USD million)
TABLE 1135 South America others in oled for industrial display Market, By type, 2019-2028 (USD million)
TABLE 1136 Brazil industrial display Market, By type, 2019-2028 (USD million)
TABLE 1137 Brazil rugged display in industrial display Market, By type, 2019-2028 (USD million)
TABLE 1138 Brazil rugged display in industrial display Market, By level of ruggedness, 2019-2028 (USD million)
TABLE 1139 Brazil marine display in industrial display Market, By application, 2019-2028 (USD million)
TABLE 1140 Brazil industrial display Market, By technology, 2019-2028 (USD million)
TABLE 1141 Brazil led in industrial display Market, By type, 2019-2028 (USD million)
TABLE 1142 Brazil oled in industrial display Market, By type, 2019-2028 (USD million)
TABLE 1143 Brazil industrial display Market, By communication type, 2019-2028 (USD million)
TABLE 1144 Brazil industrial display Market, By panel size, 2019-2028 (USD million)
TABLE 1145 Brazil industrial display Market, By application, 2019-2028 (USD million)
TABLE 1146 Brazil industrial display Market, By Vertical, 2019-2028 (USD million)
TABLE 1147 Brazil manufacturing in industrial display Market, By technology, 2019-2028 (USD million)
TABLE 1148 Brazil manufacturing in led for industrial display Market, By type, 2019-2028 (USD million)
TABLE 1149 Brazil manufacturing in oled for industrial display Market, By type, 2019-2028 (USD million)
TABLE 1150 Brazil energy & power in industrial display Market, By technology, 2019-2028 (USD million)
TABLE 1151 Brazil energy & power in led for industrial display Market, By type, 2019-2028 (USD million)
TABLE 1152 Brazil energy & power in oled for industrial display Market, By type, 2019-2028 (USD million)
TABLE 1153 Brazil military & avionics in industrial display Market, By technology, 2019-2028 (USD million)
TABLE 1154 Brazil military & avionics in led for industrial display Market, By type, 2019-2028 (USD million)
TABLE 1155 Brazil military & avionics in oled for industrial display Market, By type, 2019-2028 (USD million)
TABLE 1156 Brazil oil & gas in industrial display Market, By technology, 2019-2028 (USD million)
TABLE 1157 Brazil oil & gas in led for industrial display Market, By type, 2019-2028 (USD million)
TABLE 1158 Brazil oil & gas in oled for industrial display Market, By type, 2019-2028 (USD million)
TABLE 1159 Brazil transportation in industrial display Market, By technology, 2019-2028 (USD million)
TABLE 1160 Brazil transportation in led for industrial display Market, By type, 2019-2028 (USD million)
TABLE 1161 Brazil transportation in oled for industrial display Market, By type, 2019-2028 (USD million)
TABLE 1162 Brazil metal & mining in industrial display Market, By technology, 2019-2028 (USD million)
TABLE 1163 Brazil metal & mining in led for industrial display Market, By type, 2019-2028 (USD million)
TABLE 1164 Brazil metal & mining in oled for industrial display Market, By type, 2019-2028 (USD million)
TABLE 1165 Brazil others in industrial display Market, By technology, 2019-2028 (USD million)
TABLE 1166 Brazil others in led for industrial display Market, By type, 2019-2028 (USD million)
TABLE 1167 Brazil others in oled for industrial display Market, By type, 2019-2028 (USD million)
TABLE 1168 Argentina industrial display Market, By type, 2019-2028 (USD million)
TABLE 1169 Argentina rugged display in industrial display Market, By type, 2019-2028 (USD million)
TABLE 1170 Argentina rugged display in industrial display Market, By level of ruggedness, 2019-2028 (USD million)
TABLE 1171 Argentina marine display in industrial display Market, By application, 2019-2028 (USD million)
TABLE 1172 Argentina industrial display Market, By technology, 2019-2028 (USD million)
TABLE 1173 Argentina led in industrial display Market, By type, 2019-2028 (USD million)
TABLE 1174 Argentina oled in industrial display Market, By type, 2019-2028 (USD million)
TABLE 1175 Argentina industrial display Market, By communication type, 2019-2028 (USD million)
TABLE 1176 Argentina industrial display Market, By panel size, 2019-2028 (USD million)
TABLE 1177 Argentina industrial display Market, By application, 2019-2028 (USD million)
TABLE 1178 Argentina industrial display Market, By Vertical, 2019-2028 (USD million)
TABLE 1179 Argentina manufacturing in industrial display Market, By technology, 2019-2028 (USD million)
TABLE 1180 Argentina manufacturing in led for industrial display Market, By type, 2019-2028 (USD million)
TABLE 1181 Argentina manufacturing in oled for industrial display Market, By type, 2019-2028 (USD million)
TABLE 1182 Argentina energy & power in industrial display Market, By technology, 2019-2028 (USD million)
TABLE 1183 Argentina energy & power in led for industrial display Market, By type, 2019-2028 (USD million)
TABLE 1184 Argentina energy & power in oled for industrial display Market, By type, 2019-2028 (USD million)
TABLE 1185 Argentina military & avionics in industrial display Market, By technology, 2019-2028 (USD million)
TABLE 1186 Argentina military & avionics in led for industrial display Market, By type, 2019-2028 (USD million)
TABLE 1187 Argentina military & avionics in oled for industrial display Market, By type, 2019-2028 (USD million)
TABLE 1188 Argentina oil & gas in industrial display Market, By technology, 2019-2028 (USD million)
TABLE 1189 Argentina oil & gas in led for industrial display Market, By type, 2019-2028 (USD million)
TABLE 1190 Argentina oil & gas in oled for industrial display Market, By type, 2019-2028 (USD million)
TABLE 1191 Argentina transportation in industrial display Market, By technology, 2019-2028 (USD million)
TABLE 1192 Argentina transportation in led for industrial display Market, By type, 2019-2028 (USD million)
TABLE 1193 Argentina transportation in oled for industrial display Market, By type, 2019-2028 (USD million)
TABLE 1194 Argentina metal & mining in industrial display Market, By technology, 2019-2028 (USD million)
TABLE 1195 Argentina metal & mining in led for industrial display Market, By type, 2019-2028 (USD million)
TABLE 1196 Argentina metal & mining in oled for industrial display Market, By type, 2019-2028 (USD million)
TABLE 1197 Argentina others in industrial display Market, By technology, 2019-2028 (USD million)
TABLE 1198 Argentina others in led for industrial display Market, By type, 2019-2028 (USD million)
TABLE 1199 Argentina others in oled for industrial display Market, By type, 2019-2028 (USD million)
TABLE 1200 Venezuela industrial display Market, By type, 2019-2028 (USD million)
TABLE 1201 Venezuela rugged display in industrial display Market, By type, 2019-2028 (USD million)
TABLE 1202 Venezuela rugged display in industrial display Market, By level of ruggedness, 2019-2028 (USD million)
TABLE 1203 Venezuela marine display in industrial display Market, By application, 2019-2028 (USD million)
TABLE 1204 Venezuela industrial display Market, By technology, 2019-2028 (USD million)
TABLE 1205 Venezuela led in industrial display Market, By type, 2019-2028 (USD million)
TABLE 1206 Venezuela oled in industrial display Market, By type, 2019-2028 (USD million)
TABLE 1207 Venezuela industrial display Market, By communication type, 2019-2028 (USD million)
TABLE 1208 Venezuela industrial display Market, By panel size, 2019-2028 (USD million)
TABLE 1209 Venezuela industrial display Market, By application, 2019-2028 (USD million)
TABLE 1210 Venezuela industrial display Market, By Vertical, 2019-2028 (USD million)
TABLE 1211 Venezuela manufacturing in industrial display Market, By technology, 2019-2028 (USD million)
TABLE 1212 Venezuela manufacturing in led for industrial display Market, By type, 2019-2028 (USD million)
TABLE 1213 Venezuela manufacturing in oled for industrial display Market, By type, 2019-2028 (USD million)
TABLE 1214 Venezuela energy & power in industrial display Market, By technology, 2019-2028 (USD million)
TABLE 1215 Venezuela energy & power in led for industrial display Market, By type, 2019-2028 (USD million)
TABLE 1216 Venezuela energy & power in oled for industrial display Market, By type, 2019-2028 (USD million)
TABLE 1217 Venezuela military & avionics in industrial display Market, By technology, 2019-2028 (USD million)
TABLE 1218 Venezuela military & avionics in led for industrial display Market, By type, 2019-2028 (USD million)
TABLE 1219 Venezuela military & avionics in oled for industrial display Market, By type, 2019-2028 (USD million)
TABLE 1220 Venezuela oil & gas in industrial display Market, By technology, 2019-2028 (USD million)
TABLE 1221 Venezuela oil & gas in led for industrial display Market, By type, 2019-2028 (USD million)
TABLE 1222 Venezuela oil & gas in oled for industrial display Market, By type, 2019-2028 (USD million)
TABLE 1223 Venezuela transportation in industrial display Market, By technology, 2019-2028 (USD million)
TABLE 1224 Venezuela transportation in led for industrial display Market, By type, 2019-2028 (USD million)
TABLE 1225 Venezuela transportation in oled for industrial display Market, By type, 2019-2028 (USD million)
TABLE 1226 Venezuela metal & mining in industrial display Market, By technology, 2019-2028 (USD million)
TABLE 1227 Venezuela metal & mining in led for industrial display Market, By type, 2019-2028 (USD million)
TABLE 1228 Venezuela metal & mining in oled for industrial display Market, By type, 2019-2028 (USD million)
TABLE 1229 Venezuela others in industrial display Market, By technology, 2019-2028 (USD million)
TABLE 1230 Venezuela others in led for industrial display Market, By type, 2019-2028 (USD million)
TABLE 1231 Venezuela others in oled for industrial display Market, By type, 2019-2028 (USD million)
TABLE 1232 Chile industrial display Market, By type, 2019-2028 (USD million)
TABLE 1233 Chile rugged display in industrial display Market, By type, 2019-2028 (USD million)
TABLE 1234 Chile rugged display in industrial display Market, By level of ruggedness, 2019-2028 (USD million)
TABLE 1235 Chile marine display in industrial display Market, By application, 2019-2028 (USD million)
TABLE 1236 Chile industrial display Market, By technology, 2019-2028 (USD million)
TABLE 1237 Chile led in industrial display Market, By type, 2019-2028 (USD million)
TABLE 1238 Chile oled in industrial display Market, By type, 2019-2028 (USD million)
TABLE 1239 Chile industrial display Market, By communication type, 2019-2028 (USD million)
TABLE 1240 Chile industrial display Market, By panel size, 2019-2028 (USD million)
TABLE 1241 Chile industrial display Market, By application, 2019-2028 (USD million)
TABLE 1242 Chile industrial display Market, By Vertical, 2019-2028 (USD million)
TABLE 1243 Chile manufacturing in industrial display Market, By technology, 2019-2028 (USD million)
TABLE 1244 Chile manufacturing in led for industrial display Market, By type, 2019-2028 (USD million)
TABLE 1245 Chile manufacturing in oled for industrial display Market, By type, 2019-2028 (USD million)
TABLE 1246 Chile energy & power in industrial display Market, By technology, 2019-2028 (USD million)
TABLE 1247 Chile energy & power in led for industrial display Market, By type, 2019-2028 (USD million)
TABLE 1248 Chile energy & power in oled for industrial display Market, By type, 2019-2028 (USD million)
TABLE 1249 Chile military & avionics in industrial display Market, By technology, 2019-2028 (USD million)
TABLE 1250 Chile military & avionics in led for industrial display Market, By type, 2019-2028 (USD million)
TABLE 1251 Chile military & avionics in oled for industrial display Market, By type, 2019-2028 (USD million)
TABLE 1252 Chile oil & gas in industrial display Market, By technology, 2019-2028 (USD million)
TABLE 1253 Chile oil & gas in led for industrial display Market, By type, 2019-2028 (USD million)
TABLE 1254 Chile oil & gas in oled for industrial display Market, By type, 2019-2028 (USD million)
TABLE 1255 Chile transportation in industrial display Market, By technology, 2019-2028 (USD million)
TABLE 1256 Chile transportation in led for industrial display Market, By type, 2019-2028 (USD million)
TABLE 1257 Chile transportation in oled for industrial display Market, By type, 2019-2028 (USD million)
TABLE 1258 Chile metal & mining in industrial display Market, By technology, 2019-2028 (USD million)
TABLE 1259 Chile metal & mining in led for industrial display Market, By type, 2019-2028 (USD million)
TABLE 1260 Chile metal & mining in oled for industrial display Market, By type, 2019-2028 (USD million)
TABLE 1261 Chile others in industrial display Market, By technology, 2019-2028 (USD million)
TABLE 1262 Chile others in led for industrial display Market, By type, 2019-2028 (USD million)
TABLE 1263 Chile others in oled for industrial display Market, By type, 2019-2028 (USD million)
TABLE 1264 Colombia industrial display Market, By type, 2019-2028 (USD million)
TABLE 1265 Colombia rugged display in industrial display Market, By type, 2019-2028 (USD million)
TABLE 1266 Colombia rugged display in industrial display Market, By level of ruggedness, 2019-2028 (USD million)
TABLE 1267 Colombia marine display in industrial display Market, By application, 2019-2028 (USD million)
TABLE 1268 Colombia industrial display Market, By technology, 2019-2028 (USD million)
TABLE 1269 Colombia led in industrial display Market, By type, 2019-2028 (USD million)
TABLE 1270 Colombia oled in industrial display Market, By type, 2019-2028 (USD million)
TABLE 1271 Colombia industrial display Market, By communication type, 2019-2028 (USD million)
TABLE 1272 Colombia industrial display Market, By panel size, 2019-2028 (USD million)
TABLE 1273 Colombia industrial display Market, By application, 2019-2028 (USD million)
TABLE 1274 Colombia industrial display Market, By Vertical, 2019-2028 (USD million)
TABLE 1275 Colombia manufacturing in industrial display Market, By technology, 2019-2028 (USD million)
TABLE 1276 Colombia manufacturing in led for industrial display Market, By type, 2019-2028 (USD million)
TABLEAU 1277 Fabrication colombienne de LED pour le marché de l'affichage industriel, par type, 2019-2028 (en millions USD)
TABLEAU 1278 Marché colombien de l'énergie et de la puissance dans l'affichage industriel, par technologie, 2019-2028 (en millions USD)
TABLEAU 1279 Énergie et puissance en Colombie sur le marché des LED pour l'affichage industriel, par type, 2019-2028 (en millions USD)
TABLEAU 1280 Marché colombien de l'énergie et de la puissance des écrans OLED pour l'affichage industriel, par type, 2019-2028 (en millions USD)
TABLEAU 1281 Marché colombien des écrans militaires et avioniques industriels, par technologie, 2019-2028 (en millions USD)
TABLEAU 1282 Marché colombien des écrans LED militaires et avioniques pour l'affichage industriel, par type, 2019-2028 (en millions USD)
TABLEAU 1283 Marché colombien des écrans OLED militaires et avioniques pour l'affichage industriel, par type, 2019-2028 (en millions USD)
TABLEAU 1284 Marché colombien du pétrole et du gaz sur le marché industriel, par technologie, 2019-2028 (en millions USD)
TABLEAU 1285 Marché colombien du pétrole et du gaz pour l'affichage industriel, par type, 2019-2028 (en millions USD)
TABLEAU 1286 Marché colombien du pétrole et du gaz dans les écrans OLED pour l'affichage industriel, par type, 2019-2028 (en millions USD)
TABLEAU 1287 Marché des transports industriels en Colombie, par technologie, 2019-2028 (en millions USD)
TABLEAU 1288 Transports en Colombie sur le marché des écrans LED pour l'affichage industriel, par type, 2019-2028 (en millions USD)
TABLEAU 1289 Marché des transports en Colombie pour l'affichage industriel OLED, par type, 2019-2028 (en millions USD)
TABLEAU 1290 Marché colombien des métaux et des mines dans l'affichage industriel, par technologie, 2019-2028 (en millions USD)
TABLEAU 1291 Marché des LED pour l'affichage industriel en Colombie, métaux et mines, par type, 2019-2028 (en millions USD)
TABLEAU 1292 Marché colombien des métaux et des mines dans les écrans OLED pour l'affichage industriel, par type, 2019-2028 (en millions USD)
TABLEAU 1293 Autres acteurs du marché de l'affichage industriel en Colombie, par technologie, 2019-2028 (en millions USD)
TABLEAU 1294 Autres marchés colombiens des LED pour l'affichage industriel, par type, 2019-2028 (en millions USD)
TABLEAU 1295 Autres marchés colombiens de l'affichage industriel OLED, par type, 2019-2028 (en millions USD)
TABLEAU 1296 Marché des écrans industriels au Pérou, par type, 2019-2028 (en millions USD)
TABLEAU 1297 Écrans robustes du marché péruvien des écrans industriels, par type, 2019-2028 (en millions USD)
TABLEAU 1298 Écrans robustes du Pérou sur le marché de l'affichage industriel, par niveau de robustesse, 2019-2028 (en millions USD)
TABLEAU 1299 Marché des présentoirs marins du Pérou, par application, 2019-2028 (en millions USD)
TABLEAU 1300 Marché des écrans industriels au Pérou, par technologie, 2019-2028 (en millions USD)
TABLEAU 1301 Le Pérou domine le marché des écrans industriels, par type, 2019-2028 (en millions USD)
TABLEAU 1302 Marché des écrans OLED industriels au Pérou, par type, 2019-2028 (en millions USD)
TABLEAU 1303 Marché des écrans industriels au Pérou, par type de communication, 2019-2028 (en millions USD)
TABLEAU 1304 Marché des écrans industriels au Pérou, par taille de panneau, 2019-2028 (en millions USD)
TABLEAU 1305 Marché des écrans industriels au Pérou, par application, 2019-2028 (en millions USD)
TABLEAU 1306 Marché des écrans industriels au Pérou, par secteur, 2019-2028 (en millions USD)
TABLEAU 1307 Marché manufacturier des écrans industriels au Pérou, par technologie, 2019-2028 (en millions USD)
TABLEAU 1308 Fabrication au Pérou sur le marché des LED pour l'affichage industriel, par type, 2019-2028 (en millions USD)
TABLEAU 1309 Fabrication au Pérou de OLED pour le marché de l'affichage industriel, par type, 2019-2028 (en millions USD)
TABLEAU 1310 Marché péruvien de l'énergie et de la puissance dans l'affichage industriel, par technologie, 2019-2028 (en millions USD)
TABLEAU 1311 Marché péruvien de l'énergie et de la puissance dans le marché des écrans LED industriels, par type, 2019-2028 (en millions USD)
TABLEAU 1312 Marché péruvien de l'énergie et de la puissance dans les écrans OLED pour l'affichage industriel, par type, 2019-2028 (en millions USD)
TABLEAU 1313 Marché péruvien des écrans militaires et avioniques industriels, par technologie, 2019-2028 (en millions USD)
TABLEAU 1314 Marché péruvien des écrans LED militaires et avioniques pour l'affichage industriel, par type, 2019-2028 (en millions USD)
TABLEAU 1315 Marché péruvien des écrans OLED militaires et avioniques pour l'affichage industriel, par type, 2019-2028 (en millions USD)
TABLEAU 1316 Marché péruvien du pétrole et du gaz sur le marché industriel, par technologie, 2019-2028 (en millions USD)
TABLEAU 1317 Marché péruvien du pétrole et du gaz pour l'affichage industriel, par type, 2019-2028 (en millions USD)
TABLEAU 1318 Marché péruvien du pétrole et du gaz dans les écrans OLED pour l'affichage industriel, par type, 2019-2028 (en millions USD)
TABLEAU 1319 Marché des transports industriels au Pérou, par technologie, 2019-2028 (en millions USD)
TABLEAU 1320 Marché des transports au Pérou pour l'affichage industriel à LED, par type, 2019-2028 (en millions USD)
TABLEAU 1321 Marché des transports au Pérou pour l'affichage industriel OLED, par type, 2019-2028 (en millions USD)
TABLEAU 1322 Marché péruvien des métaux et des mines dans l'affichage industriel, par technologie, 2019-2028 (en millions USD)
TABLEAU 1323 Marché des métaux et des mines d'affichage industriel à LED au Pérou, par type, 2019-2028 (en millions USD)
TABLEAU 1324 Marché péruvien des écrans OLED pour l'affichage industriel, métaux et mines, par type, 2019-2028 (en millions USD)
TABLEAU 1325 Autres acteurs du marché de l'affichage industriel au Pérou, par technologie, 2019-2028 (en millions USD)
TABLEAU 1326 Autres marchés des LED pour l'affichage industriel au Pérou, par type, 2019-2028 (en millions USD)
TABLEAU 1327 Autres marchés péruvien des écrans OLED pour l'affichage industriel, par type, 2019-2028 (en millions USD)
TABLEAU 1328 Marché des présentoirs industriels en Équateur, par type, 2019-2028 (en millions USD)
TABLEAU 1329 Écrans robustes équatoriens sur le marché des écrans industriels, par type, 2019-2028 (en millions USD)
TABLEAU 1330 Écrans robustes équatoriens sur le marché de l'affichage industriel, par niveau de robustesse, 2019-2028 (en millions USD)
TABLEAU 1331 Affichage marin équatorien sur le marché de l'affichage industriel, par application, 2019-2028 (en millions USD)
TABLEAU 1332 Marché des écrans industriels en Équateur, par technologie, 2019-2028 (en millions USD)
TABLEAU 1333 L'Équateur domine le marché des écrans industriels, par type, 2019-2028 (en millions USD)
TABLEAU 1334 Marché des écrans OLED industriels en Équateur, par type, 2019-2028 (en millions USD)
TABLEAU 1335 Marché des écrans industriels en Équateur, par type de communication, 2019-2028 (en millions USD)
TABLEAU 1336 Marché des écrans industriels en Équateur, par taille de panneau, 2019-2028 (en millions USD)
TABLE 1337 Ecuador industrial display Market, By application, 2019-2028 (USD million)
TABLE 1338 Ecuador industrial display Market, By Vertical, 2019-2028 (USD million)
TABLE 1339 Ecuador manufacturing in industrial display Market, By technology, 2019-2028 (USD million)
TABLE 1340 Ecuador manufacturing in led for industrial display Market, By type, 2019-2028 (USD million)
TABLE 1341 Ecuador manufacturing in oled for industrial display Market, By type, 2019-2028 (USD million)
TABLE 1342 Ecuador energy & power in industrial display Market, By technology, 2019-2028 (USD million)
TABLE 1343 Ecuador energy & power in led for industrial display Market, By type, 2019-2028 (USD million)
TABLE 1344 Ecuador energy & power in oled for industrial display Market, By type, 2019-2028 (USD million)
TABLE 1345 Ecuador military & avionics in industrial display Market, By technology, 2019-2028 (USD million)
TABLE 1346 Ecuador military & avionics in led for industrial display Market, By type, 2019-2028 (USD million)
TABLE 1347 Ecuador military & avionics in oled for industrial display Market, By type, 2019-2028 (USD million)
TABLE 1348 Ecuador oil & gas in industrial display Market, By technology, 2019-2028 (USD million)
TABLE 1349 Ecuador oil & gas in led for industrial display Market, By type, 2019-2028 (USD million)
TABLE 1350 Ecuador oil & gas in oled for industrial display Market, By type, 2019-2028 (USD million)
TABLE 1351 Ecuador transportation in industrial display Market, By technology, 2019-2028 (USD million)
TABLE 1352 Ecuador transportation in led for industrial display Market, By type, 2019-2028 (USD million)
TABLE 1353 Ecuador transportation in oled for industrial display Market, By type, 2019-2028 (USD million)
TABLE 1354 Ecuador metal & mining in industrial display Market, By technology, 2019-2028 (USD million)
TABLE 1355 Ecuador metal & mining in led for industrial display Market, By type, 2019-2028 (USD million)
TABLE 1356 Ecuador metal & mining in oled for industrial display Market, By type, 2019-2028 (USD million)
TABLE 1357 Ecuador others in industrial display Market, By technology, 2019-2028 (USD million)
TABLE 1358 Ecuador others in led for industrial display Market, By type, 2019-2028 (USD million)
TABLE 1359 Ecuador others in oled for industrial display Market, By type, 2019-2028 (USD million)
TABLE 1360 rest of south america industrial display Market, By type, 2019-2028 (USD million)
Liste des figures
FIGURE 1 Global Industrial Display market: segmentation
FIGURE 2 GLOBAL INDUSTRIAL DISPLAY MARKET: data triangulation
FIGURE 3 Global Industrial Display market: DROC ANALYSIS
FIGURE 4 Global Industrial Display market: global VS regional MARKET ANALYSIS
FIGURE 5 GLOBAL INDUSTRIAL DISPLAY MARKET: COMPANY RESEARCH ANALYSIS
FIGURE 6 GLOBAL INDUSTRIAL DISPLAY MARKET: INTERVIEW DEMOGRAPHICS
FIGURE 8 Global Industrial Display market: vendor share analysis
FIGURE 9 GLOBAL INDUSTRIAL DISPLAY MARKET: MARKET APPLICATION COVERAGE GRID
FIGURE 10 Global Industrial Display market: SEGMENTATION
FIGURE 11 Rising demand for human machine interface (HMI) application in manufacturing and process industries is expected to DRIVe the global Industrial Display MARKET IN THE FORECAST PERIOD of 2021 to 2028
FIGURE 12 rugged displays segment is expected to account for the largest share of global Industrial Display market in 2021 & 2028
FIGURE 13 north america is expected to DOMINATE and asia-pacific is the fastest growing region in THE global Industrial Display MARKET IN the forecast period of 2021 to 2028
FIGURE 14 asia-pacific is the fastest growing market for Industrial Display manufacturers in the forecast period of 2021 to 2028
FIGURE 15 VALUE CHAIN ANALYSIS FRAMEWORK
FIGURE 16 DRIVERS, RESTRAINT, OPPORTUNITIES, AND CHALLENGES OF GLOBAL industrial display MARKET
FIGURE 17 Shipments Projection of Installation Based Digital Signage Displays
FIGURE 18 OLED Smartphone Panel Shipment
FIGURE 1 Global Industrial Display MARKET: BY type, 2020
FIGURE 2 Global Industrial Display MARKET: BY panel size, 2020
FIGURE 3 Global Industrial Display MARKET: BY technology, 2020
FIGURE 4 Global Industrial Display MARKET: BY communication type, 2020
FIGURE 5 Global Industrial Display MARKET: BY application, 2020
FIGURE 6 Global Industrial Display MARKET: BY vertical, 2020
FIGURE 7 Global industrial display MARKET: SNAPSHOT (2020)
FIGURE 8 Global industrial display MARKET: by Region (2020)
FIGURE 9 Global industrial display MARKET: by Region (2021 & 2028)
FIGURE 10 Global industrial display MARKET: by Region (2020 & 2028)
FIGURE 11 Global industrial display MARKET: by type (2021-2028)
FIGURE 12 North america industrial display MARKET: SNAPSHOT (2020)
FIGURE 13 North america industrial display MARKET: by Country (2020)
FIGURE 14 North america industrial display MARKET: by Country (2021 & 2028)
FIGURE 15 North america industrial display MARKET: by Country (2020 & 2028)
FIGURE 16 North america industrial display MARKET: by type (2021-2028)
FIGURE 17 europe industrial display MARKET: SNAPSHOT (2020)
FIGURE 18 europe industrial display MARKET: by Country (2020)
FIGURE 19 europe industrial display MARKET: by Country (2021 & 2028)
FIGURE 20 europe industrial display MARKET: by Country (2020 & 2028)
FIGURE 21 europe industrial display MARKET: by type (2021-2028)
FIGURE 22 asia-pacific industrial display MARKET: SNAPSHOT (2020)
FIGURE 23 asia-pacific industrial display MARKET: by Country (2020)
FIGURE 24 asia-pacific industrial display MARKET: by Country (2021 & 2028)
FIGURE 25 asia-pacific industrial display MARKET: by Country (2020 & 2028)
FIGURE 26 asia-pacific industrial display MARKET: by type (2021-2028)
FIGURE 27 middle east and africa industrial display MARKET: SNAPSHOT (2020)
FIGURE 28 middle east and africa industrial display MARKET: by Country (2020)
FIGURE 29 middle east and africa industrial display MARKET: by Country (2021 & 2028)
FIGURE 30 middle east and africa industrial display MARKET: by Country (2020 & 2028)
FIGURE 31 middle east and africa industrial display MARKET: by TYPE (2021-2028)
FIGURE 32 south america industrial display MARKET: SNAPSHOT (2020)
FIGURE 33 south america industrial display MARKET: by Country (2020)
FIGURE 34 south america industrial display MARKET: by Country (2021 & 2028)
FIGURE 35 south america industrial display MARKET: by Country (2020 & 2028)
FIGURE 36 south america industrial display MARKET: by type (2021-2028)
FIGURE 37 Global industrial display market: company share 2020 (%)
FIGURE 38 north America industrial display Market: company share 2020(%)
FIGURE 39 Europe industrial display Market: company share 2020 (%)
FIGURE 40 Asia-Pacific industrial display Market: company share 2020(%)
Méthodologie de recherche
La collecte de données et l'analyse de l'année de base sont effectuées à l'aide de modules de collecte de données avec des échantillons de grande taille. L'étape consiste à obtenir des informations sur le marché ou des données connexes via diverses sources et stratégies. Elle comprend l'examen et la planification à l'avance de toutes les données acquises dans le passé. Elle englobe également l'examen des incohérences d'informations observées dans différentes sources d'informations. Les données de marché sont analysées et estimées à l'aide de modèles statistiques et cohérents de marché. De plus, l'analyse des parts de marché et l'analyse des tendances clés sont les principaux facteurs de succès du rapport de marché. Pour en savoir plus, veuillez demander un appel d'analyste ou déposer votre demande.
La méthodologie de recherche clé utilisée par l'équipe de recherche DBMR est la triangulation des données qui implique l'exploration de données, l'analyse de l'impact des variables de données sur le marché et la validation primaire (expert du secteur). Les modèles de données incluent la grille de positionnement des fournisseurs, l'analyse de la chronologie du marché, l'aperçu et le guide du marché, la grille de positionnement des entreprises, l'analyse des brevets, l'analyse des prix, l'analyse des parts de marché des entreprises, les normes de mesure, l'analyse globale par rapport à l'analyse régionale et des parts des fournisseurs. Pour en savoir plus sur la méthodologie de recherche, envoyez une demande pour parler à nos experts du secteur.
Personnalisation disponible
Data Bridge Market Research est un leader de la recherche formative avancée. Nous sommes fiers de fournir à nos clients existants et nouveaux des données et des analyses qui correspondent à leurs objectifs. Le rapport peut être personnalisé pour inclure une analyse des tendances des prix des marques cibles, une compréhension du marché pour d'autres pays (demandez la liste des pays), des données sur les résultats des essais cliniques, une revue de la littérature, une analyse du marché des produits remis à neuf et de la base de produits. L'analyse du marché des concurrents cibles peut être analysée à partir d'une analyse basée sur la technologie jusqu'à des stratégies de portefeuille de marché. Nous pouvons ajouter autant de concurrents que vous le souhaitez, dans le format et le style de données que vous recherchez. Notre équipe d'analystes peut également vous fournir des données sous forme de fichiers Excel bruts, de tableaux croisés dynamiques (Fact book) ou peut vous aider à créer des présentations à partir des ensembles de données disponibles dans le rapport.

