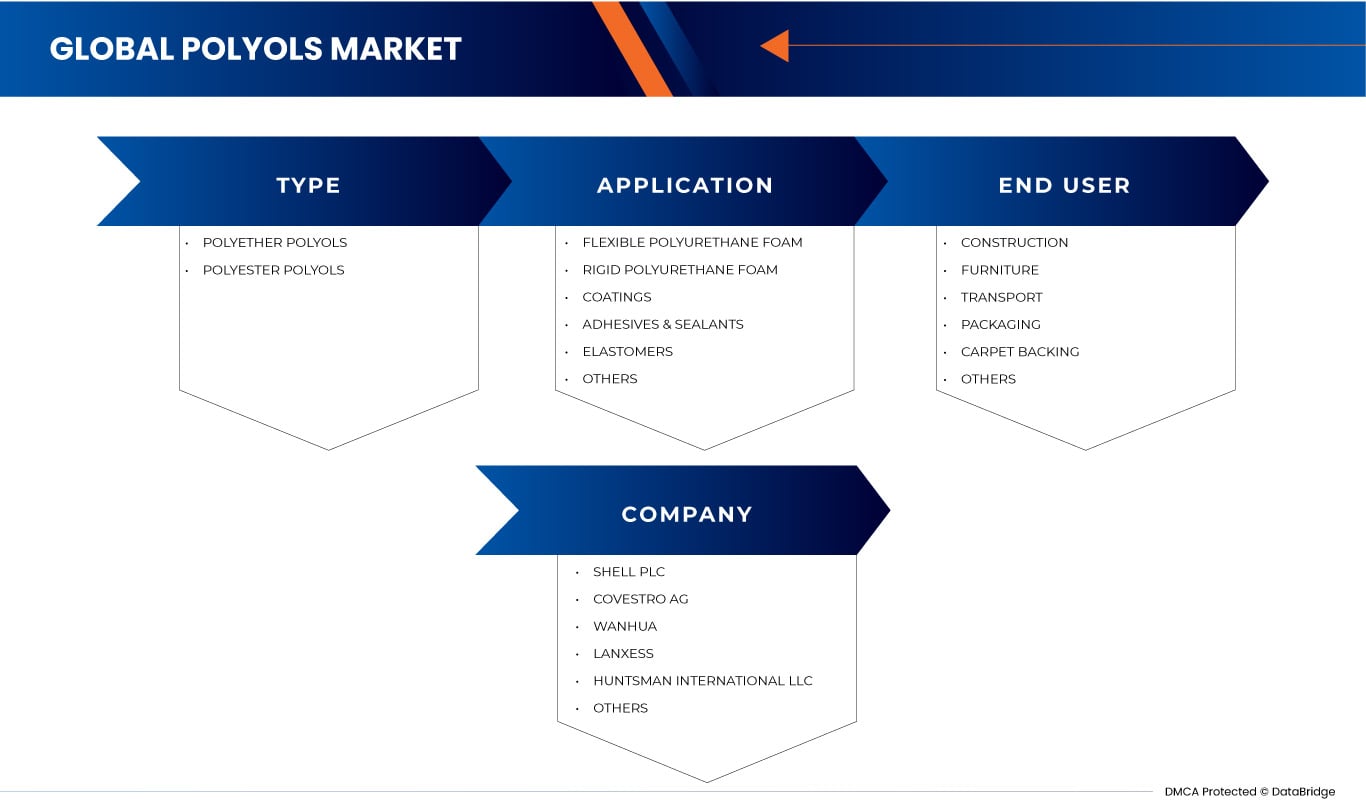
Global Polyols Market, By Type (Polyether Polyols and Polyester Polyols), Application (Flexible Polyurethane Foam, Rigid Polyurethane Foam, Coatings, Adhesive & Sealants, Elastomers, and Others), End User (Construction, Furniture, Transport, Packaging, Carpet Backing, and Others) Industry Trends and Forecast to 2030.
Polyols Market Analysis and Size
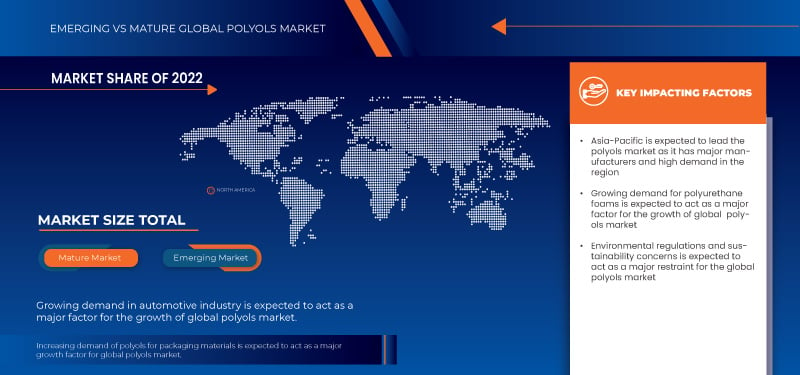
Polyols are organic compounds. This organic compound is a compound that contains carbon covalently bound to other atoms, especially carbon-carbon, and carbon-hydrogen. A class of polyols called sugar alcohols includes those that are derived from sugars. They may occur naturally or produce industrially. The growing demand for polyurethane foams, increasing demand in the construction and infrastructure sector, and increasing focus on energy-efficient insulation materials, and sustainable products are the major factors that act as a driving factor for the global polyols market. However, environmental regulations and sustainability concerns, high costs associated with polyols are acting as a restraining factors for the growth of the global polyols market. Increasing demand for polyols for packaging materials, usage of polyols in insulation applications, and growing demand for bio-based are estimated to provide opportunities for global polyols market growth. However, fluctuations in raw material prices and technological limitations, and performance requirements are creating a challenging environment for the global polyols market growth.
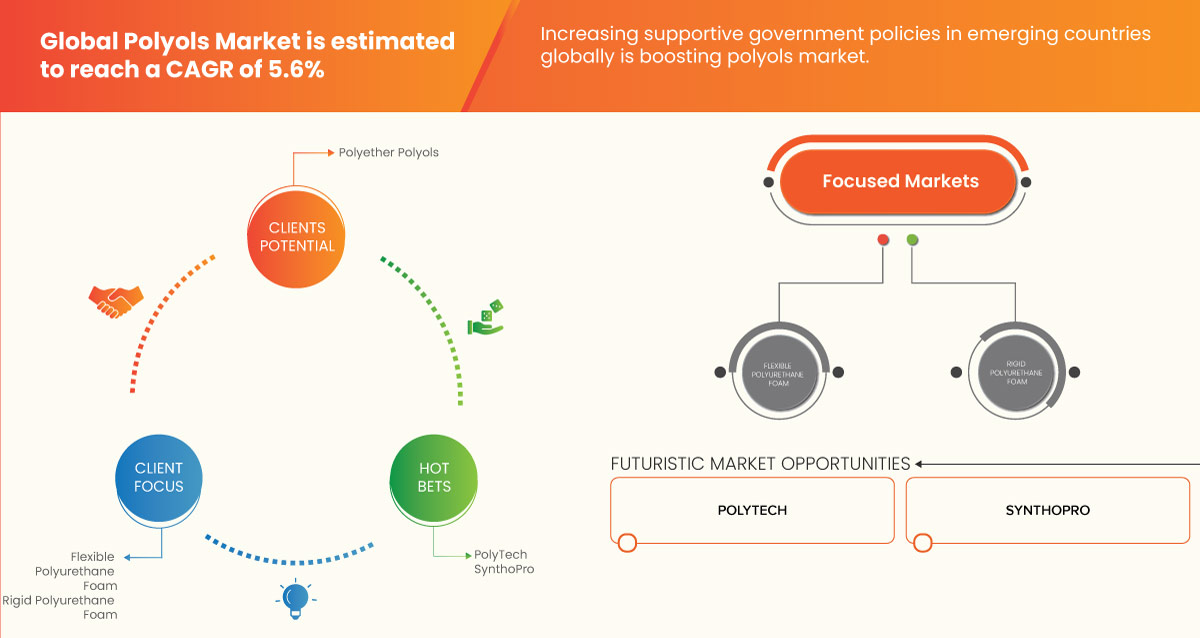
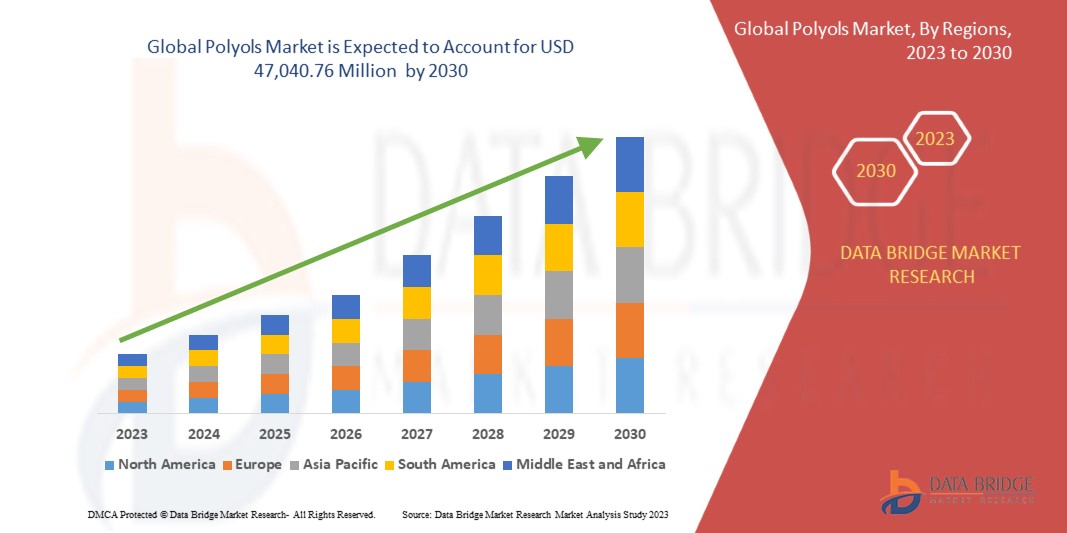
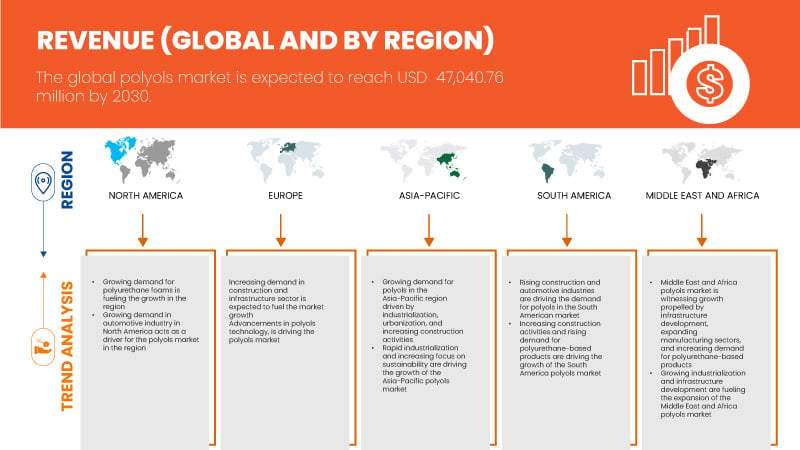
Data Bridge Market Research analyses that the global polyols market is expected to reach a value of USD 47,040.76 million by 2030, at a CAGR of 5.6% during the forecast period. The Global Polyols market report also comprehensively covers pricing analysis, patent analysis, and technological advancements.
|
Report Metric |
Details |
|
Forecast Period |
2023 to 2030 |
|
Base Year |
2022 |
|
Historic Years |
2021 (Customizable to 2015 - 2020) |
|
Quantitative Units |
Revenue in USD Million |
|
Segments Covered |
Type (Polyether Polyols and Polyester Polyols), Application (Flexible Polyurethane Foam, Rigid Polyurethane Foam, Coatings, Adhesive & Sealants, Elastomers, and Others), End User (Construction, Furniture, Transport, Packaging, Carpet Backing, and Others) |
|
Countries Covered |
U.S., Canada, and Mexico. Asia-Pacific market is further segmented into China, Japan, South Korea, India, Australia and New Zealand, Singapore, Indonesia, Thailand, Malaysia, Philippines, and Rest of Asia-Pacific. Europe market is further segmented into Germany, U.K., France, Italy, Netherlands, Spain, Switzerland, Russia, Turkey, Belgium, and Rest of Europe. The Middle East and Africa market is further segmented into U.A.E., Saudi Arabia, Israel, Egypt, South Africa, and Rest of the Middle East and Africa. Also, the South America market is further segmented into Brazil, Argentina, and Rest of South America |
|
Market Players Covered |
Huntsman International LLC, Repsol, Biesterfeld AG, DIC CORPORATION, Tosoh Corporation, Arkema, BASF SE, Dow, Cargill, Incorporated, LANXESS, Shell plc, Mitsubishi Chemical Corporation, Vertellus, Wanhua, Stepan Company, Gulshan Polyols Ltd, Perstorp Holding AB (Subsidiary of PETRONAS Chemicals Group), Emery Oleochemicals LLC, Covestro AG, Coim Group, and Shakun Industries, among others |
Market Definition
Polyols are alcohols with more than one hydroxyl group and they constitute one of the main raw materials for manufacturing polyurethane. They are commonly used as key raw materials in manufacturing various products, such as polyurethane foams, coatings, adhesives, sealants, elastomers, and more. Polyols are primarily derived from petrochemical sources or renewable resources like vegetable oils and sugar derivatives. They can be classified into different types based on their chemical structure, including polyether polyols and polyester polyols. Each type possesses specific properties and is suitable for different applications. The different types of polyols are polyether polyols and polyester polyols. The polyols are being used in different applications in different forms such as flexible polyurethane foam, rigid polyurethane foam, coatings, adhesives & sealants, elastomers, and others. Polyurethanes are versatile, modern, and safe. They have a huge range of applications for creating all kinds of industrial products and consumer basics to make our life more practical, comfortable, and environmentally friendly. Polyurethane is made up of plastic material presented and is available in various forms. It can be used in various forms such as rigid or flexible and is preferred based on material in a wide range of applications. One such polyol is Repsol which offers a portfolio of polyether polyols developed with home-grown technology with a wide range of alternatives.
Global Polyols Market Dynamics
This section deals with understanding the market drivers, advantages, opportunities, restraints, and challenges. All of this is discussed in detail below:
Drivers
- Growing Demand for Polyurethane Foams
Polyols are one of the two main components used in the production of polyurethane foams, with the other component being isocyanates. Polyols are polymeric compounds that contain multiple hydroxyl (-OH) functional groups. They can be derived from various sources, such as petroleum, vegetable oils, or polyesters. In the manufacturing process of polyurethane foam, polyols are reacted with isocyanates to form a polymer network. The growing demand for polyurethane foams is expected to drive the global polyol market. Polyurethane foams are versatile materials used in various industries such as construction, automotive, furniture, and packaging due to their excellent insulation, cushioning, and durability properties.

Opportunity
- Increasing Demand for Polyols for Packaging Materials
The packaging materials are used to enclose, protect, and contain products for storage, distribution, and sale. Packaging serves various functions, including preserving the quality and integrity of products, ensuring their safety during transportation, providing information to consumers, and facilitating convenience in handling and storage. Packaging materials can be made from a wide range of materials, including plastics, paper and cardboard, glass, metals, and composite materials. Packaging materials play a vital role in ensuring the safety, preservation, and presentation of products. They contribute to the overall consumer experience and provide essential information about the product, such as ingredients, nutritional values, and usage instructions. Effective packaging materials help protect products from damage, extend their shelf life, and enhance their marketability
Restraints/Challenges
- High Cost Associated With Polyols
The cost of polyols is dependent on various factors such as raw materials, manufacturing process, and market demand. The prices of raw materials used for the production of polyols, such as propylene oxide and ethylene oxide, are volatile and can fluctuate frequently, leading to an increase in the production cost of polyols. Additionally, the production process for polyols is complex and requires specialized equipment and expertise, leading to higher capital and operating costs.
- Fluctuation in Raw Material Prices
The raw materials for polyol production can vary depending on the type of polyol being produced such as polyether polyols and polyester polyols.
Recent Developments
- In September 2022, Covestro AG announced the launch of polyether polyols based on bio-circular raw materials. The company will be able to offer selective prepolymers for various adhesive applications and their customer base. The main components for polyurethanes will be based on alternative raw materials. This step helps the company to offer substitutes to various industries and enhance its brand image in the market.
- In September 2022, Wanhua announced the launch of a new chemical that has developed a bio-based polyol to reduce its carbon footprint. The new bioproducts have been launched to contribute towards a sustainable environment and to increase production efficiency. This will help the company to enhance its product portfolio for the company.
Global Polyols Market Scope
The global polyols market is segmented into three notable segments based type, application, and end user. The growth amongst these segments will help you analyse meagre growth segments in the industries and provide the users with a valuable market overview and market insights to help them make strategic decisions for identifying core market applications.
Type
- Polyether Polyols
- Polyester Polyols
On the basis of type, the global polyols market is segmented into polyether polyols and polyester polyols.
Application
- Flexible Polyurethane Foam
- Rigid Polyurethane Foam
- Coatings
- Adhesives & Sealants
- Elastomers
- Others
On the basis of application, the global polyols market is segmented into flexible polyurethane foam, rigid polyurethane foam, coatings, adhesives & sealants, elastomers, and others.
End User
- Construction
- Furniture
- Transport
- Packaging
- Carpet Backing
- Others
On the basis of end user, the global polyols market is segmented into construction, furniture, transport, packaging, carpet backing, and others.
Global Polyols Market Regional Analysis/Insights
Global polyols market is analysed, and market size insights and trends are provided by country, type, application, and end-use as referenced above.
On the basis of region, the global polyols market is segmented into North America, Europe, Asia-Pacific, South America, and the Middle East and Africa. The North America market is further segmented into U.S., Canada, and Mexico. Asia-Pacific market is further segmented into China, Japan, South Korea, India, Australia and New Zealand, Singapore, Indonesia, Thailand, Malaysia, Philippines, and Rest of Asia-Pacific. Europe market is further segmented into Germany, U.K., France, Italy, Netherlands, Spain, Switzerland, Russia, Turkey, Belgium, and Rest of Europe. The Middle East and Africa market is further segmented into U.A.E., Saudi Arabia, Israel, Egypt, South Africa, and Rest of the Middle East and Africa. Also, the South America market is further segmented into Brazil, Argentina, and Rest of South America.
The Asia-Pacific polyols market is expected to attain lucrative growth due to the rising consumer demand for comfort, convenience, and improved living standards. China is expected to dominate Asia-Pacific polyols market. Polyol-based flexible foams are widely used in mattresses, furniture, and automotive seating to provide comfort and cushioning. As consumer expectations continue to rise, the demand for high-quality polyol-based products also increases in the region. On the basis of market value U.S., China, and Japan are the top three countries in the market. The US possesses a robust and advanced manufacturing infrastructure, which includes state-of-the-art facilities and technologies. This enables efficient production processes and ensures high-quality polyol products. China has a massive manufacturing capacity and is known as the world's factory. The country has a vast network of production facilities, skilled labor, and cost-effective manufacturing processes. This enables China to produce polyol products in large quantities, meeting both domestic and international demand. Japan is renowned for its technological expertise and innovation across various industries. In the polyol sector, Japanese companies have a strong focus on research and development, leading to the development of advanced polyol formulations, improved production processes, and innovative applications.
The region section of the report also provides individual market-impacting factors and changes in market regulation that impact the current and future trends of the market. Data points like downstream and upstream value chain analysis, technical trends, and Porter’s five forces analysis, case studies are some of the pointers used to forecast the market scenario for individual countries. Also, the presence and availability of Global brands and their challenges faced due to large or scarce competition from local and domestic brands, the impact of domestic tariffs, and trade routes are considered while providing forecast analysis of the region data.
Competitive Landscape and Global Polyols Market Share Analysis
The global polyols market competitive landscape provides details of the competitor. Details included are company overview, company financials, revenue generated, market potential, investment in research and development, new market initiatives, Global presence, production sites and facilities, production capacities, company strengths and weaknesses, product launch, product width and breadth, and application dominance. The above data points provided are only related to the companies' focus related to global polyols market.
Some of the major players operating in the global polyols market are, Huntsman International LLC, Repsol, Biesterfeld AG, DIC CORPORATION, Tosoh Corporation, Arkema, BASF SE, Dow, Cargill, Incorporated, LANXESS, Shell plc, Mitsubishi Chemical Corporation, Vertellus, Wanhua, Stepan Company, Gulshan Polyols Ltd, Perstorp Holding AB (Subsidiary of PETRONAS Chemicals Group), Emery Oleochemicals LLC, Covestro AG, Coim Group, and Shakun Industries, among others.
SKU-
Accédez en ligne au rapport sur le premier cloud mondial de veille économique

- Tableau de bord d'analyse de données interactif
- Tableau de bord d'analyse d'entreprise pour les opportunités à fort potentiel de croissance
- Accès d'analyste de recherche pour la personnalisation et les requêtes
- Analyse de la concurrence avec tableau de bord interactif
- Dernières actualités, mises à jour et analyse des tendances
- Exploitez la puissance de l'analyse comparative pour un suivi complet de la concurrence
Table des matières
1 INTRODUCTION
1.1 OBJECTIFS DE L'ÉTUDE
1.2 DÉFINITION DU MARCHÉ
1.3 APERÇU DU MARCHÉ MONDIAL DES POLYOLS
1.4 MONNAIE ET TARIFS
1.5 LIMITATIONS
1.6 MARCHÉS COUVERTS
2 SEGMENTATION DU MARCHÉ
2.1 MARCHÉS COUVERTS
2,2 ANS CONSIDÉRÉS POUR L'ÉTUDE
2.3 PORTÉE GÉOGRAPHIQUE
2.4 MODÈLE DE VALIDATION DES DONNÉES DU TRÉPIED DBMR
2.5 ENTRETIENS PRIMAIRES AVEC DES LEADERS D'OPINION CLÉS
2.6 GRILLE DE POSITIONNEMENT DU MARCHÉ DBMR
2.7 ANALYSE DES PARTS DES FOURNISSEURS
2.8 MODÉLISATION MULTIVARIÉE
2.9 COURBE DE TYPE
2.1 GRILLE DE COUVERTURE DES APPLICATIONS DU MARCHÉ
2.11 SOURCES SECONDAIRES
2.12 HYPOTHÈSES
3 RÉSUMÉ EXÉCUTIF
4 INFORMATIONS PREMIUM
4.1 DONNÉES D'IMPORT-EXPORT
5 APERÇU DU MARCHÉ
5.1 PILOTES
5.1.1 DEMANDE CROISSANTE DE MOUSSES DE POLYURÉTHANE
5.1.2 DEMANDE CROISSANTE DANS LE SECTEUR DE LA CONSTRUCTION ET DES INFRASTRUCTURES
5.1.3 PROGRÈS DANS LA TECHNOLOGIE DES POLYOLS
5.1.4 DEMANDE CROISSANTE DANS L'INDUSTRIE AUTOMOBILE
5.2 RESTRICTIONS
5.2.1 RÉGLEMENTATIONS ENVIRONNEMENTALES ET PRÉOCCUPATIONS DE DURABILITÉ
5.2.2 COÛT ÉLEVÉ ASSOCIÉ AUX POLYOLS
5.3 OPPORTUNITÉS
5.3.1 DEMANDE CROISSANTE DE POLYOLS POUR LES MATÉRIAUX D'EMBALLAGE
5.3.2 UTILISATION DE POLYOLS DANS LES APPLICATIONS D'ISOLATION
5.3.3 ACCROÎTRE LES PARTENARIATS, LES ACQUISITIONS ET LA COLLABORATION ENTRE LES ACTEURS DU MARCHÉ
5.3.4 FORTE DEMANDE DE POLYOLS BIOSOURCÉS ET DURABLES
5.4 DÉFIS
5.4.1 FLUCTUATION DES PRIX DES MATIÈRES PREMIÈRES
5.4.2 LIMITATIONS TECHNOLOGIQUES ET EXIGENCES DE PERFORMANCE
6 MARCHÉS MONDIAUX DES POLYOLS, PAR TYPE
6.1 APERÇU
6.2 POLYÉTHER POLYOLS
6.3 POLYESTER-POLYOLS
7 MARCHÉS MONDIAUX DES POLYOLS, PAR APPLICATION
7.1 APERÇU
7.2 MOUSSE DE POLYURÉTHANE FLEXIBLE
7.3 MOUSSE DE POLYURÉTHANE RIGIDE
7.4 REVÊTEMENTS
7.5 ADHÉSIFS ET MASTICS
7.6 ÉLASTOMÈRES
7.7 AUTRES
8 MARCHÉ MONDIAL DES POLYOLS, PAR UTILISATEUR FINAL
8.1 APERÇU
8.2 CONSTRUCTION
8.2.1 POLYÉTHER POLYOLS
8.2.2 POLYESTER-POLYOLS
8.3 MEUBLES
8.3.1 POLYÉTHER POLYOLS
8.3.2 POLYESTER-POLYOLS
8.4 TRANSPORT
8.4.1 POLYÉTHER POLYOLS
8.4.2 POLYESTER-POLYOLS
8.5 EMBALLAGE
8.5.1 POLYÉTHER POLYOLS
8.5.2 POLYESTER-POLYOLS
8.6 SUPPORT DE TAPIS
8.6.1 POLYÉTHER POLYOLS
8.6.2 POLYESTER-POLYOLS
8.7 AUTRES
8.7.1 POLYÉTHER POLYOLS
8.7.2 POLYESTER-POLYOLS
9 MARCHÉS MONDIAUX DES POLYOLS, PAR RÉGION
9.1 APERÇU
9.2 ASIE-PACIFIQUE
9.2.1 CHINE
9.2.2 JAPON
9.2.3 CORÉE DU SUD
9.2.4 INDE
9.2.5 AUSTRALIE ET NOUVELLE-ZÉLANDE
9.2.6 SINGAPOUR
9.2.7 MALAISIE
9.2.8 THAÏLANDE
9.2.9 INDONÉSIE
9.2.10 PHILIPPINES
9.2.11 RESTE DE L'ASIE-PACIFIQUE
9.3 AMÉRIQUE DU NORD
9.3.1 États-Unis
9.3.2 CANADA
9.3.3 MEXIQUE
9.4 EUROPE
9.4.1 ALLEMAGNE
9.4.2 FRANCE
9.4.3 ITALIE
9.4.4 PAYS-BAS
9.4.5 Royaume-Uni
9.4.6 ESPAGNE
9.4.7 BELGIQUE
9.4.8 RUSSIE
9.4.9 SUISSE
9.4.10 TURQUIE
9.4.11 RESTE DE L'EUROPE
9.5 MOYEN-ORIENT ET AFRIQUE
9.5.1 ARABIE SAOUDITE
9.5.2 Émirats arabes unis
9.5.3 ÉGYPTE
9.5.4 AFRIQUE DU SUD
9.5.5 ISRAËL
9.5.6 RESTE DU MOYEN-ORIENT ET DE L'AFRIQUE
9.6 AMÉRIQUE DU SUD
9.6.1 BRÉSIL
9.6.2 ARGENTINE
9.6.3 RESTE DE L'AMÉRIQUE DU SUD
10 MARCHÉS MONDIAUX DES POLYOLS, PAYSAGE DES ENTREPRISES
10.1 ANALYSE DES ACTIONS DE L'ENTREPRISE : MONDIALE
10.2 ANALYSE DES ACTIONS DE L'ENTREPRISE : AMÉRIQUE DU NORD
10.3 ANALYSE DES ACTIONS DE L'ENTREPRISE : EUROPE
10.4 ANALYSE DES ACTIONS DE L'ENTREPRISE : ASIE-PACIFIQUE
11 ANALYSE SWOT
12 PROFILS D'ENTREPRISE
12.1 Automate Shell
12.1.1 INSTANTANÉ DE L'ENTREPRISE
12.1.2 ANALYSE DES REVENUS
12.1.3 ANALYSE DES ACTIONS DE L'ENTREPRISE
12.1.4 PORTEFEUILLE DE PRODUITS
12.1.5 ÉVOLUTIONS RÉCENTES
12.2 COVESTRO AG
12.2.1 INSTANTANÉ DE L'ENTREPRISE
12.2.2 ANALYSE DES REVENUS
12.2.3 ANALYSE DES ACTIONS DE L'ENTREPRISE
12.2.4 PORTEFEUILLE DE PRODUITS
12.2.5 ÉVOLUTIONS RÉCENTES
12.3 WANHUA
12.3.1 INSTANTANÉ DE L'ENTREPRISE
12.3.2 ANALYSE DES REVENUS
12.3.3 ANALYSE DES ACTIONS DE L'ENTREPRISE
12.3.4 PORTEFEUILLE DE PRODUITS
12.3.5 ÉVOLUTIONS RÉCENTES
12.4 LANXESS
12.4.1 INSTANTANÉ DE L'ENTREPRISE
12.4.2 ANALYSE DES REVENUS
12.4.3 ANALYSE DES ACTIONS DE L'ENTREPRISE
12.4.4 PORTEFEUILLE DE PRODUITS ET DE SOLUTIONS
12.4.5 ÉVOLUTIONS RÉCENTES
12.5 HUNTSMAN INTERNATIONAL LLC
12.5.1 INSTANTANÉ DE L'ENTREPRISE
12.5.2 ANALYSE DES REVENUS
12.5.3 ANALYSE DES ACTIONS DE L'ENTREPRISE
12.5.4 PORTEFEUILLE DE PRODUITS
12.5.5 ÉVOLUTIONS RÉCENTES
12.6 ARKEMA
12.6.1 INSTANTANÉ DE L'ENTREPRISE
12.6.2 ANALYSE DES REVENUS
12.6.3 PORTEFEUILLE DE PRODUITS
12.6.4 ÉVOLUTION RÉCENTE
12,7 BASF SE
12.7.1 INSTANTANÉ DE L'ENTREPRISE
12.7.2 ANALYSE DES REVENUS
12.7.3 PORTEFEUILLE DE PRODUITS
12.7.4 ÉVOLUTIONS RÉCENTES
12.8 BIESTERFELD AG
12.8.1 INSTANTANÉ DE L'ENTREPRISE
12.8.2 PORTEFEUILLE DE PRODUITS
12.8.3 ÉVOLUTIONS RÉCENTES
12.9 CARGILL, INCORPORÉE.
12.9.1 INSTANTANÉ DE L'ENTREPRISE
12.9.2 PORTEFEUILLE DE PRODUITS ET SERVICES
12.9.3 ÉVOLUTION RÉCENTE
12.1 GROUPE COIM
12.10.1 INSTANTANÉ DE L'ENTREPRISE
12.10.2 PORTEFEUILLE DE PRODUITS
12.10.3 ÉVOLUTIONS RÉCENTES
12.11 DOW
12.11.1 INSTANTANÉ DE L'ENTREPRISE
12.11.2 ANALYSE DES REVENUS
12.11.3 PORTEFEUILLE DE PRODUITS
12.11.4 ÉVOLUTIONS RÉCENTES
12.12 DIC CORPORATION
12.12.1 INSTANTANÉ DE L'ENTREPRISE
12.12.2 ANALYSE DES REVENUS
12.12.3 PORTEFEUILLE DE PRODUITS
12.12.4 ÉVOLUTIONS RÉCENTES
12.13 EMERY OLEOCHEMICALS LLC
12.13.1 INSTANTANÉ DE L'ENTREPRISE
12.13.2 PORTEFEUILLE DE PRODUITS
12.13.3 ÉVOLUTIONS RÉCENTES
12.14 GULSHAN POLYOLS LTD.
12.14.1 INSTANTANÉ DE L'ENTREPRISE
12.14.2 ANALYSE DES REVENUS
12.14.3 PORTEFEUILLE DE PRODUITS
12.14.4 ÉVOLUTION RÉCENTE
12h15 Mitsubishi Chemical Corporation
12.15.1 INSTANTANÉ DE L'ENTREPRISE
12.15.2 ANALYSE DES REVENUS
12.15.3 PORTEFEUILLE DE PRODUITS
12.15.4 ÉVOLUTIONS RÉCENTES
12.16 PERSTORP HOLDING AB (FILIALE DU GROUPE PETRONAS CHEMICALS)
12.16.1 INSTANTANÉ DE L'ENTREPRISE
12.16.2 ANALYSE DES REVENUS
12.16.3 PORTEFEUILLE DE PRODUITS
12.16.4 ÉVOLUTIONS RÉCENTES
12.17 REPSOL
12.17.1 INSTANTANÉ DE L'ENTREPRISE
12.17.2 ANALYSE DES REVENUS
12.17.3 PORTEFEUILLE DE PRODUITS
12.17.4 ÉVOLUTIONS RÉCENTES
12.18 SHAKUN INDUSTRIES
12.18.1 INSTANTANÉ DE L'ENTREPRISE
12.18.2 PRODUCT PORTFOLIO
12.18.3 RECENT DEVELOPMENT
12.19 STEPAN COMPANY
12.19.1 COMPANY SNAPSHOT
12.19.2 REVENUE ANALYSIS
12.19.3 PRODUCT PORTFOLIO
12.19.4 RECENT DEVELOPMENTS
12.2 TOSOH CORPORATION
12.20.1 COMPANY SNAPSHOT
12.20.2 REVENUE ANALYSIS
12.20.3 PRODUCT PORTFOLIO
12.20.4 RECENT DEVELOPMENT
12.21 VERTELLUS
12.21.1 COMPANY SNAPSHOT
12.21.2 PRODUCT PORTFOLIO
12.21.3 RECENT DEVELOPMENT
13 QUESTIONNAIRE
14 RELATED REPORTS
Liste des tableaux
TABLEAU 1 MARCHÉ MONDIAL DES POLYOLS, PAR TYPE, 2021-2030 (EN MILLIONS USD)
TABLEAU 2 MARCHÉ MONDIAL DES POLYOLS, PAR TYPE, 2021-2030 (MT)
TABLEAU 3 MARCHÉ MONDIAL DES POLYOLS DE POLYÉTHER, PAR RÉGION, 2021-2030 (EN MILLIONS USD)
TABLEAU 4 MARCHÉ MONDIAL DES POLYOLS POLYÉTHER, PAR RÉGION, 2021-2030 (MT)
TABLEAU 5 MARCHÉ MONDIAL DES POLYOLS DE POLYESTER, PAR RÉGION, 2021-2030 (EN MILLIONS USD)
TABLEAU 6 MARCHÉ MONDIAL DES POLYOLS DE POLYESTER, PAR RÉGION, 2021-2030 (MT)
TABLEAU 7 MARCHÉ MONDIAL DES POLYOLS, PAR APPLICATION, 2021-2030 (EN MILLIONS USD)
TABLEAU 8 MARCHÉ MONDIAL DE LA MOUSSE DE POLYURÉTHANE FLEXIBLE EN POLYOLS, PAR RÉGION, 2021-2030 (EN MILLIONS USD)
TABLEAU 9 MARCHÉ MONDIAL DE LA MOUSSE DE POLYURÉTHANE RIGIDE EN POLYOLS, PAR RÉGION, 2021-2030 (EN MILLIONS USD)
TABLEAU 10 MARCHÉ MONDIAL DES REVÊTEMENTS EN POLYOLS, PAR RÉGION, 2021-2030 (EN MILLIONS USD)
TABLEAU 11 MARCHÉ MONDIAL DES ADHÉSIFS ET MASTICS À BASE DE POLYOLS, PAR RÉGION, 2021-2030 (EN MILLIONS USD)
TABLEAU 12 MARCHÉ MONDIAL DES ÉLASTOMÈRES DANS LES POLYOLS, PAR RÉGION, 2021-2030 (EN MILLIONS USD)
TABLEAU 13 AUTRES MARCHÉS MONDIAUX DES POLYOLS, PAR RÉGION, 2021-2030 (EN MILLIONS USD)
TABLEAU 14 MARCHÉ MONDIAL DES POLYOLS, PAR UTILISATEUR FINAL, 2021-2030 (EN MILLIONS USD)
TABLEAU 15 MARCHÉ MONDIAL DE LA CONSTRUCTION DES POLYOLS, PAR RÉGION, 2021-2030 (EN MILLIONS USD)
TABLEAU 16 MARCHÉ MONDIAL DE LA CONSTRUCTION DANS LES POLYOLS, PAR TYPE, 2021-2030 (EN MILLIONS USD)
TABLEAU 17 MARCHÉ MONDIAL DES MEUBLES EN POLYOLS, PAR RÉGION, 2021-2030 (EN MILLIONS USD)
TABLEAU 18 MARCHÉ MONDIAL DU MOBILIER EN POLYOLS, PAR TYPE, 2021-2030 (EN MILLIONS USD)
TABLEAU 19 MARCHÉ MONDIAL DES TRANSPORTS SUR LES POLYOLS, PAR RÉGION, 2021-2030 (EN MILLIONS USD)
TABLEAU 20 MARCHÉ MONDIAL DU TRANSPORT DANS LES POLYOLS, PAR TYPE, 2021-2030 (EN MILLIONS USD)
TABLEAU 21 MARCHÉ MONDIAL DES EMBALLAGES EN POLYOLS, PAR RÉGION, 2021-2030 (EN MILLIONS USD)
TABLEAU 22 MARCHÉ MONDIAL DES EMBALLAGES EN POLYOLS, PAR TYPE, 2021-2030 (EN MILLIONS USD)
TABLEAU 23 MARCHÉ MONDIAL DES SUPPORTS DE TAPIS EN POLYOLS, PAR RÉGION, 2021-2030 (EN MILLIONS USD)
TABLEAU 24 MARCHÉ MONDIAL DES SUPPORTS DE TAPIS EN POLYOLS, PAR TYPE, 2021-2030 (EN MILLIONS USD)
TABLEAU 25 AUTRES MARCHÉS MONDIAUX DES POLYOLS, PAR RÉGION, 2021-2030 (EN MILLIONS USD)
TABLEAU 26 AUTRES MARCHÉS MONDIAUX DES POLYOLS, PAR TYPE, 2021-2030 (EN MILLIONS USD)
TABLEAU 27 MARCHÉ MONDIAL DES POLYOLS, PAR RÉGION, 2021-2030 (EN MILLIONS USD)
TABLEAU 28 MARCHÉ MONDIAL DES POLYOLS, PAR RÉGION, 2021-2030 (MT)
TABLEAU 29 MARCHÉ DES POLYOLS EN ASIE-PACIFIQUE, PAR PAYS, 2021-2030 (EN MILLIONS USD)
TABLEAU 30 MARCHÉ DES POLYOLS EN ASIE-PACIFIQUE, PAR PAYS, 2021-2030 (MT)
TABLEAU 31 MARCHÉ DES POLYOLS EN ASIE-PACIFIQUE, PAR TYPE, 2021-2030 (EN MILLIONS USD)
TABLEAU 32 MARCHÉ DES POLYOLS EN ASIE-PACIFIQUE, PAR TYPE, 2021-2030 (MT)
TABLEAU 33 MARCHÉ DES POLYOLS EN ASIE-PACIFIQUE, PAR APPLICATION, 2021-2030 (EN MILLIONS USD)
TABLEAU 34 MARCHÉ DES POLYOLS EN ASIE-PACIFIQUE, PAR UTILISATEUR FINAL, 2021-2030 (EN MILLIONS USD)
TABLEAU 35 MARCHÉ DE LA CONSTRUCTION EN POLYOLS EN ASIE-PACIFIQUE, PAR TYPE, 2021-2030 (EN MILLIONS USD)
TABLEAU 36 MARCHÉ DU MOBILIER EN POLYOLS EN ASIE-PACIFIQUE, PAR TYPE, 2021-2030 (EN MILLIONS USD)
TABLEAU 37 MARCHÉ DES TRANSPORTS EN ASIE-PACIFIQUE SUR LE MARCHÉ DES POLYOLS, PAR TYPE, 2021-2030 (EN MILLIONS USD)
TABLEAU 38 MARCHÉ ASIE-PACIFIQUE DES EMBALLAGES DANS LES POLYOLS, PAR TYPE, 2021-2030 (EN MILLIONS USD)
TABLEAU 39 MARCHÉ DES DOSSIERS DE TAPIS EN POLYOLS EN ASIE-PACIFIQUE, PAR TYPE, 2021-2030 (EN MILLIONS USD)
TABLEAU 40 AUTRES MARCHÉS DES POLYOLS EN ASIE-PACIFIQUE, PAR TYPE, 2021-2030 (EN MILLIONS USD)
TABLEAU 41 MARCHÉ DES POLYOLS EN CHINE, PAR TYPE, 2021-2030 (EN MILLIONS USD)
TABLEAU 42 MARCHÉ DES POLYOLS EN CHINE, PAR TYPE, 2021-2030 (MT)
TABLEAU 43 MARCHÉ DES POLYOLS EN CHINE, PAR APPLICATION, 2021-2030 (EN MILLIONS USD)
TABLEAU 44 MARCHÉ DES POLYOLS EN CHINE, PAR UTILISATEUR FINAL, 2021-2030 (EN MILLIONS USD)
TABLEAU 45 MARCHÉ DE LA CONSTRUCTION EN CHINE DANS LE DOMAINE DES POLYOLS, PAR TYPE, 2021-2030 (EN MILLIONS USD)
TABLEAU 46 MARCHÉ DES MEUBLES EN POLYOLS EN CHINE, PAR TYPE, 2021-2030 (EN MILLIONS USD)
TABLEAU 47 MARCHÉ DES TRANSPORTS EN CHINE SUR LE MARCHÉ DES POLYOLS, PAR TYPE, 2021-2030 (EN MILLIONS USD)
TABLEAU 48 MARCHÉ DES EMBALLAGES EN POLYOLS EN CHINE, PAR TYPE, 2021-2030 (EN MILLIONS USD)
TABLEAU 49 MARCHÉ DES SUPPORTS DE TAPIS EN POLYOLS EN CHINE, PAR TYPE, 2021-2030 (EN MILLIONS USD)
TABLEAU 50 AUTRES ENTREPRISES CHINOISES SUR LE MARCHÉ DES POLYOLS, PAR TYPE, 2021-2030 (EN MILLIONS USD)
TABLEAU 51 MARCHÉ JAPONAIS DES POLYOLS, PAR TYPE, 2021-2030 (EN MILLIONS USD)
TABLEAU 52 MARCHÉ JAPONAIS DES POLYOLS, PAR TYPE, 2021-2030 (MT)
TABLEAU 53 MARCHÉ JAPONAIS DES POLYOLS, PAR APPLICATION, 2021-2030 (EN MILLIONS USD)
TABLEAU 54 MARCHÉ JAPONAIS DES POLYOLS, PAR UTILISATEUR FINAL, 2021-2030 (EN MILLIONS USD)
TABLEAU 55 MARCHÉ JAPONAIS DE LA CONSTRUCTION DANS LES POLYOLS, PAR TYPE, 2021-2030 (EN MILLIONS USD)
TABLEAU 56 MARCHÉ JAPONAIS DU MOBILIER EN POLYOLS, PAR TYPE, 2021-2030 (EN MILLIONS USD)
TABLEAU 57 MARCHÉ JAPONAIS DES TRANSPORTS SUR LE MARCHÉ DES POLYOLS, PAR TYPE, 2021-2030 (EN MILLIONS USD)
TABLEAU 58 MARCHÉ JAPONAIS DES EMBALLAGES DANS LES POLYOLS, PAR TYPE, 2021-2030 (EN MILLIONS USD)
TABLEAU 59 MARCHÉ JAPONAIS DES SUPPORTS DE TAPIS EN POLYOLS, PAR TYPE, 2021-2030 (EN MILLIONS USD)
TABLEAU 60 AUTRES INTERVENANTS SUR LE MARCHÉ DES POLYOLS AU JAPON, PAR TYPE, 2021-2030 (EN MILLIONS USD)
TABLEAU 61 MARCHÉ DES POLYOLS EN CORÉE DU SUD, PAR TYPE, 2021-2030 (EN MILLIONS USD)
TABLEAU 62 MARCHÉ DES POLYOLS EN CORÉE DU SUD, PAR TYPE, 2021-2030 (MT)
TABLEAU 63 MARCHÉ DES POLYOLS EN CORÉE DU SUD, PAR APPLICATION, 2021-2030 (EN MILLIONS USD)
TABLEAU 64 MARCHÉ DES POLYOLS EN CORÉE DU SUD, PAR UTILISATEUR FINAL, 2021-2030 (EN MILLIONS USD)
TABLEAU 65 MARCHÉ DE LA CONSTRUCTION EN CORÉE DU SUD DANS LE DOMAINE DES POLYOLS, PAR TYPE, 2021-2030 (EN MILLIONS USD)
TABLEAU 66 MARCHÉ DES MEUBLES EN POLYOLS EN CORÉE DU SUD, PAR TYPE, 2021-2030 (EN MILLIONS USD)
TABLEAU 67 TRANSPORTS SUR LE MARCHÉ DES POLYOLS EN CORÉE DU SUD, PAR TYPE, 2021-2030 (EN MILLIONS USD)
TABLEAU 68 MARCHÉ DES EMBALLAGES EN POLYOLS EN CORÉE DU SUD, PAR TYPE, 2021-2030 (EN MILLIONS USD)
TABLEAU 69 MARCHÉ DES SUPPORTS DE TAPIS EN POLYOLS EN CORÉE DU SUD, PAR TYPE, 2021-2030 (EN MILLIONS USD)
TABLEAU 70 AUTRES INTERVENANTS SUR LE MARCHÉ DES POLYOLS EN CORÉE DU SUD, PAR TYPE, 2021-2030 (EN MILLIONS USD)
TABLEAU 71 MARCHÉ INDIEN DES POLYOLS, PAR TYPE, 2021-2030 (EN MILLIONS USD)
TABLEAU 72 MARCHÉ INDIEN DES POLYOLS, PAR TYPE, 2021-2030 (MT)
TABLEAU 73 MARCHÉ INDIEN DES POLYOLS, PAR APPLICATION, 2021-2030 (EN MILLIONS USD)
TABLEAU 74 MARCHÉ INDIEN DES POLYOLS, PAR UTILISATEUR FINAL, 2021-2030 (EN MILLIONS USD)
TABLEAU 75 MARCHÉ INDIEN DE LA CONSTRUCTION DANS LE DOMAINE DES POLYOLS, PAR TYPE, 2021-2030 (EN MILLIONS USD)
TABLEAU 76 MARCHÉ INDIEN DU MOBILIER EN POLYOLS, PAR TYPE, 2021-2030 (EN MILLIONS USD)
TABLEAU 77 MARCHÉ INDIEN DES TRANSPORTS SUR LE MARCHÉ DES POLYOLS, PAR TYPE, 2021-2030 (EN MILLIONS USD)
TABLEAU 78 MARCHÉ INDIEN DES EMBALLAGES DANS LES POLYOLS, PAR TYPE, 2021-2030 (EN MILLIONS USD)
TABLEAU 79 MARCHÉ INDIEN DES SUPPORTS DE TAPIS EN POLYOLS, PAR TYPE, 2021-2030 (EN MILLIONS USD)
TABLEAU 80 INDE AUTRES MARCHÉS DES POLYOLS, PAR TYPE, 2021-2030 (EN MILLIONS USD)
TABLEAU 81 MARCHÉ DES POLYOLS EN AUSTRALIE ET EN NOUVELLE-ZÉLANDE, PAR TYPE, 2021-2030 (EN MILLIONS USD)
TABLEAU 82 MARCHÉ DES POLYOLS EN AUSTRALIE ET EN NOUVELLE-ZÉLANDE, PAR TYPE, 2021-2030 (MT)
TABLEAU 83 MARCHÉ DES POLYOLS EN AUSTRALIE ET EN NOUVELLE-ZÉLANDE, PAR APPLICATION, 2021-2030 (EN MILLIONS USD)
TABLEAU 84 MARCHÉ DES POLYOLS EN AUSTRALIE ET EN NOUVELLE-ZÉLANDE, PAR UTILISATEUR FINAL, 2021-2030 (EN MILLIONS USD)
TABLEAU 85 MARCHÉ DE LA CONSTRUCTION EN POLYOLS EN AUSTRALIE ET EN NOUVELLE-ZÉLANDE, PAR TYPE, 2021-2030 (EN MILLIONS USD)
TABLEAU 86 MARCHÉ DES MEUBLES EN POLYOLS EN AUSTRALIE ET EN NOUVELLE-ZÉLANDE, PAR TYPE, 2021-2030 (EN MILLIONS USD)
TABLEAU 87 MARCHÉ DES TRANSPORTS EN AUSTRALIE ET EN NOUVELLE-ZÉLANDE SUR LE MARCHÉ DES POLYOLS, PAR TYPE, 2021-2030 (EN MILLIONS USD)
TABLEAU 88 MARCHÉ DES EMBALLAGES EN POLYOLS EN AUSTRALIE ET EN NOUVELLE-ZÉLANDE, PAR TYPE, 2021-2030 (EN MILLIONS USD)
TABLEAU 89 MARCHÉ DES DOSSIERS DE TAPIS EN POLYOLS EN AUSTRALIE ET EN NOUVELLE-ZÉLANDE, PAR TYPE, 2021-2030 (EN MILLIONS USD)
TABLEAU 90 AUSTRALIE ET NOUVELLE-ZÉLANDE AUTRES MARCHÉS DES POLYOLS, PAR TYPE, 2021-2030 (EN MILLIONS USD)
TABLEAU 91 MARCHÉ DES POLYOLS À SINGAPOUR, PAR TYPE, 2021-2030 (EN MILLIONS USD)
TABLEAU 92 MARCHÉ DES POLYOLS À SINGAPOUR, PAR TYPE, 2021-2030 (MT)
TABLEAU 93 MARCHÉ DES POLYOLS À SINGAPOUR, PAR APPLICATION, 2021-2030 (EN MILLIONS USD)
TABLEAU 94 MARCHÉ DES POLYOLS À SINGAPOUR, PAR UTILISATEUR FINAL, 2021-2030 (EN MILLIONS USD)
TABLEAU 95 MARCHÉ DE LA CONSTRUCTION À SINGAPOUR DANS LE DOMAINE DES POLYOLS, PAR TYPE, 2021-2030 (EN MILLIONS USD)
TABLEAU 96 MARCHÉ DES MEUBLES EN POLYOLS À SINGAPOUR, PAR TYPE, 2021-2030 (EN MILLIONS USD)
TABLEAU 97 TRANSPORT À SINGAPOUR SUR LE MARCHÉ DES POLYOLS, PAR TYPE, 2021-2030 (EN MILLIONS USD)
TABLEAU 98 EMBALLAGES À SINGAPOUR SUR LE MARCHÉ DES POLYOLS, PAR TYPE, 2021-2030 (EN MILLIONS USD)
TABLEAU 99 MARCHÉ DES SUPPORTS DE TAPIS EN POLYOLS À SINGAPOUR, PAR TYPE, 2021-2030 (EN MILLIONS USD)
TABLEAU 100 AUTRES ENTREPRISES DE SINGAPOUR SUR LE MARCHÉ DES POLYOLS, PAR TYPE, 2021-2030 (EN MILLIONS USD)
TABLEAU 101 MARCHÉ DES POLYOLS EN MALAISIE, PAR TYPE, 2021-2030 (EN MILLIONS USD)
TABLEAU 102 MARCHÉ DES POLYOLS EN MALAISIE, PAR TYPE, 2021-2030 (MT)
TABLEAU 103 MARCHÉ DES POLYOLS EN MALAISIE, PAR APPLICATION, 2021-2030 (EN MILLIONS USD)
TABLEAU 104 MARCHÉ DES POLYOLS EN MALAISIE, PAR UTILISATEUR FINAL, 2021-2030 (EN MILLIONS USD)
TABLEAU 105 MARCHÉ DE LA CONSTRUCTION EN MALAISIE DANS LE DOMAINE DES POLYOLS, PAR TYPE, 2021-2030 (EN MILLIONS USD)
TABLEAU 106 MARCHÉ MALAISIEN DES MEUBLES EN POLYOLS, PAR TYPE, 2021-2030 (EN MILLIONS USD)
TABLEAU 107 MARCHÉ DES TRANSPORTS EN MALAISIE SUR LE MARCHÉ DES POLYOLS, PAR TYPE, 2021-2030 (EN MILLIONS USD)
TABLEAU 108 MARCHÉ MALAISIEN DES EMBALLAGES DANS LES POLYOLS, PAR TYPE, 2021-2030 (EN MILLIONS USD)
TABLEAU 109 MARCHÉ MALAISIEN DES SUPPORTS DE TAPIS EN POLYOLS, PAR TYPE, 2021-2030 (EN MILLIONS USD)
TABLEAU 110 MALAISIE AUTRES MARCHÉS DES POLYOLS, PAR TYPE, 2021-2030 (EN MILLIONS USD)
TABLEAU 111 MARCHÉ DES POLYOLS EN THAÏLANDE, PAR TYPE, 2021-2030 (EN MILLIONS USD)
TABLEAU 112 MARCHÉ DES POLYOLS EN THAÏLANDE, PAR TYPE, 2021-2030 (MT)
TABLEAU 113 MARCHÉ DES POLYOLS EN THAÏLANDE, PAR APPLICATION, 2021-2030 (EN MILLIONS USD)
TABLEAU 114 MARCHÉ DES POLYOLS EN THAÏLANDE, PAR UTILISATEUR FINAL, 2021-2030 (EN MILLIONS USD)
TABLEAU 115 MARCHÉ DE LA CONSTRUCTION EN THAÏLANDE DANS LE DOMAINE DES POLYOLS, PAR TYPE, 2021-2030 (EN MILLIONS USD)
TABLEAU 116 MARCHÉ DES MEUBLES EN POLYOLS EN THAÏLANDE, PAR TYPE, 2021-2030 (EN MILLIONS USD)
TABLEAU 117 TRANSPORTS SUR LE MARCHÉ DES POLYOLS EN THAÏLANDE, PAR TYPE, 2021-2030 (EN MILLIONS USD)
TABLEAU 118 EMBALLAGES SUR LE MARCHÉ DES POLYOLS EN THAÏLANDE, PAR TYPE, 2021-2030 (EN MILLIONS USD)
TABLEAU 119 MARCHÉ THAÏLANDAIS DES SUPPORTS DE TAPIS EN POLYOLS, PAR TYPE, 2021-2030 (EN MILLIONS USD)
TABLEAU 120 AUTRES MARCHÉS DES POLYOLS EN THAÏLANDE, PAR TYPE, 2021-2030 (EN MILLIONS USD)
TABLEAU 121 MARCHÉ INDONÉSIEN DES POLYOLS, PAR TYPE, 2021-2030 (EN MILLIONS USD)
TABLEAU 122 MARCHÉ DES POLYOLS EN INDONÉSIE, PAR TYPE, 2021-2030 (MT)
TABLEAU 123 MARCHÉ DES POLYOLS EN INDONÉSIE, PAR APPLICATION, 2021-2030 (EN MILLIONS USD)
TABLEAU 124 MARCHÉ DES POLYOLS EN INDONÉSIE, PAR UTILISATEUR FINAL, 2021-2030 (EN MILLIONS USD)
TABLEAU 125 MARCHÉ INDONÉSIEN DE LA CONSTRUCTION DANS LE DOMAINE DES POLYOLS, PAR TYPE, 2021-2030 (EN MILLIONS USD)
TABLEAU 126 MARCHÉ INDONÉSIEN DES MEUBLES EN POLYOLS, PAR TYPE, 2021-2030 (EN MILLIONS USD)
TABLEAU 127 MARCHÉ DES TRANSPORTS SUR LE MARCHÉ DES POLYOLS EN INDONÉSIE, PAR TYPE, 2021-2030 (EN MILLIONS USD)
TABLEAU 128 MARCHÉ INDONÉSIEN DES EMBALLAGES DANS LES POLYOLS, PAR TYPE, 2021-2030 (EN MILLIONS USD)
TABLEAU 129 MARCHÉ INDONÉSIEN DES SUPPORTS DE TAPIS EN POLYOLS, PAR TYPE, 2021-2030 (EN MILLIONS USD)
TABLEAU 130 INDONÉSIE AUTRES MARCHÉS DES POLYOLS, PAR TYPE, 2021-2030 (EN MILLIONS USD)
TABLEAU 131 MARCHÉ PHILIPPINIEN DES POLYOLS, PAR TYPE, 2021-2030 (EN MILLIONS USD)
TABLEAU 132 MARCHÉ PHILIPPINIEN DES POLYOLS, PAR TYPE, 2021-2030 (MT)
TABLEAU 133 MARCHÉ PHILIPPINIEN DES POLYOLS, PAR APPLICATION, 2021-2030 (EN MILLIONS USD)
TABLEAU 134 MARCHÉ PHILIPPINIEN DES POLYOLS, PAR UTILISATEUR FINAL, 2021-2030 (EN MILLIONS USD)
TABLEAU 135 PHILIPPINES CONSTRUCTION SUR LE MARCHÉ DES POLYOLS, PAR TYPE, 2021-2030 (EN MILLIONS USD)
TABLEAU 136 MARCHÉ PHILIPPIN DU MOBILIER EN POLYOLS, PAR TYPE, 2021-2030 (EN MILLIONS USD)
TABLEAU 137 PHILIPPINES TRANSPORT SUR LE MARCHÉ DES POLYOLS, PAR TYPE, 2021-2030 (EN MILLIONS USD)
TABLEAU 138 PHILIPPINES EMBALLAGES SUR LE MARCHÉ DES POLYOLS, PAR TYPE, 2021-2030 (EN MILLIONS USD)
TABLEAU 139 PHILIPPINES - MARCHÉ DES SUPPORTS DE TAPIS EN POLYOLS, PAR TYPE, 2021-2030 (EN MILLIONS USD)
TABLEAU 140 PHILIPPINES AUTRES MARCHÉS DES POLYOLS, PAR TYPE, 2021-2030 (EN MILLIONS USD)
TABLEAU 141 RESTE DU MARCHÉ DES POLYOLS EN ASIE-PACIFIQUE, PAR TYPE, 2021-2030 (EN MILLIONS USD)
TABLEAU 142 RESTE DU MARCHÉ DES POLYOLS EN ASIE-PACIFIQUE, PAR TYPE, 2021-2030 (MT)
TABLEAU 143 MARCHÉ DES POLYOLS EN AMÉRIQUE DU NORD, PAR PAYS, 2021-2030 (EN MILLIONS USD)
TABLEAU 144 MARCHÉ DES POLYOLS EN AMÉRIQUE DU NORD, PAR PAYS, 2021-2030 (MT)
TABLEAU 145 MARCHÉ DES POLYOLS EN AMÉRIQUE DU NORD, PAR TYPE, 2021-2030 (EN MILLIONS USD)
TABLEAU 146 MARCHÉ DES POLYOLS EN AMÉRIQUE DU NORD, PAR TYPE, 2021-2030 (MT)
TABLEAU 147 MARCHÉ DES POLYOLS EN AMÉRIQUE DU NORD, PAR APPLICATION, 2021-2030 (EN MILLIONS USD)
TABLEAU 148 MARCHÉ DES POLYOLS EN AMÉRIQUE DU NORD, PAR UTILISATEUR FINAL, 2021-2030 (EN MILLIONS USD)
TABLEAU 149 MARCHÉ DE LA CONSTRUCTION EN AMÉRIQUE DU NORD DANS LE DOMAINE DES POLYOLS, PAR TYPE, 2021-2030 (EN MILLIONS USD)
TABLEAU 150 MARCHÉ DES MEUBLES EN POLYOLS EN AMÉRIQUE DU NORD, PAR TYPE, 2021-2030 (EN MILLIONS USD)
TABLEAU 151 MARCHÉ DES TRANSPORTS EN AMÉRIQUE DU NORD SUR LES POLYOLS, PAR TYPE, 2021-2030 (EN MILLIONS USD)
TABLEAU 152 MARCHÉ DES EMBALLAGES EN POLYOLS EN AMÉRIQUE DU NORD, PAR TYPE, 2021-2030 (EN MILLIONS USD)
TABLEAU 153 MARCHÉ DES SUPPORTS DE TAPIS EN POLYOLS EN AMÉRIQUE DU NORD, PAR TYPE, 2021-2030 (EN MILLIONS USD)
TABLEAU 154 AUTRES MARCHÉS DES POLYOLS EN AMÉRIQUE DU NORD, PAR TYPE, 2021-2030 (EN MILLIONS USD)
TABLEAU 155 MARCHÉ DES POLYOLS AUX ÉTATS-UNIS, PAR TYPE, 2021-2030 (EN MILLIONS USD)
TABLEAU 156 MARCHÉ DES POLYOLS AUX ÉTATS-UNIS, PAR TYPE, 2021-2030 (MT)
TABLEAU 157 MARCHÉ DES POLYOLS AUX ÉTATS-UNIS, PAR APPLICATION, 2021-2030 (EN MILLIONS USD)
TABLEAU 158 MARCHÉ DES POLYOLS AUX ÉTATS-UNIS, PAR UTILISATEUR FINAL, 2021-2030 (EN MILLIONS USD)
TABLEAU 159 MARCHÉ DE LA CONSTRUCTION AUX ÉTATS-UNIS DANS LE DOMAINE DES POLYOLS, PAR TYPE, 2021-2030 (EN MILLIONS USD)
TABLEAU 160 MARCHÉ AMÉRICAIN DU MOBILIER EN POLYOLS, PAR TYPE, 2021-2030 (EN MILLIONS USD)
TABLEAU 161 MARCHÉ DES TRANSPORTS AMÉRICAIN DANS LES POLYOLS, PAR TYPE, 2021-2030 (EN MILLIONS USD)
TABLEAU 162 MARCHÉ DES EMBALLAGES AMÉRICAIN DANS LES POLYOLS, PAR TYPE, 2021-2030 (EN MILLIONS USD)
TABLEAU 163 MARCHÉ DES SUPPORTS DE TAPIS EN POLYOLS AUX ÉTATS-UNIS, PAR TYPE, 2021-2030 (EN MILLIONS USD)
TABLEAU 164 AUTRES ACTEURS DU MARCHÉ DES POLYOLS AUX ÉTATS-UNIS, PAR TYPE, 2021-2030 (EN MILLIONS USD)
TABLEAU 165 MARCHÉ CANADIEN DES POLYOLS, PAR TYPE, 2021-2030 (EN MILLIONS USD)
TABLEAU 166 MARCHÉ CANADIEN DES POLYOLS, PAR TYPE, 2021-2030 (MT)
TABLEAU 167 MARCHÉ CANADIEN DES POLYOLS, PAR APPLICATION, 2021-2030 (EN MILLIONS USD)
TABLEAU 168 MARCHÉ CANADIEN DES POLYOLS, PAR UTILISATEUR FINAL, 2021-2030 (EN MILLIONS USD)
TABLEAU 169 MARCHÉ CANADIEN DE LA CONSTRUCTION DANS LE DOMAINE DES POLYOLS, PAR TYPE, 2021-2030 (EN MILLIONS USD)
TABLEAU 170 MARCHÉ CANADIEN DES MEUBLES EN POLYOLS, PAR TYPE, 2021-2030 (EN MILLIONS USD)
TABLEAU 171 MARCHÉ CANADIEN DES TRANSPORTS SUR LE MARCHÉ DES POLYOLS, PAR TYPE, 2021-2030 (EN MILLIONS USD)
TABLEAU 172 MARCHÉ CANADIEN DES EMBALLAGES DANS LES POLYOLS, PAR TYPE, 2021-2030 (EN MILLIONS USD)
TABLEAU 173 MARCHÉ CANADIEN DES SUPPORTS DE TAPIS EN POLYOLS, PAR TYPE, 2021-2030 (EN MILLIONS USD)
TABLEAU 174 AUTRES INTERVENANTS SUR LE MARCHÉ DES POLYOLS AU CANADA, PAR TYPE, 2021-2030 (EN MILLIONS USD)
TABLEAU 175 MARCHÉ MEXICAIN DES POLYOLS, PAR TYPE, 2021-2030 (EN MILLIONS USD)
TABLEAU 176 MARCHÉ MEXICAIN DES POLYOLS, PAR TYPE, 2021-2030 (MT)
TABLEAU 177 MARCHÉ MEXICAIN DES POLYOLS, PAR APPLICATION, 2021-2030 (EN MILLIONS USD)
TABLEAU 178 MARCHÉ MEXICAIN DES POLYOLS, PAR UTILISATEUR FINAL, 2021-2030 (EN MILLIONS USD)
TABLEAU 179 MARCHÉ MEXICAIN DE LA CONSTRUCTION DANS LE DOMAINE DES POLYOLS, PAR TYPE, 2021-2030 (EN MILLIONS USD)
TABLEAU 180 MARCHÉ MEXICAIN DES MEUBLES EN POLYOLS, PAR TYPE, 2021-2030 (EN MILLIONS USD)
TABLEAU 181 TRANSPORT MEXICAIN SUR LE MARCHÉ DES POLYOLS, PAR TYPE, 2021-2030 (EN MILLIONS USD)
TABLEAU 182 EMBALLAGES MEXICAINS SUR LE MARCHÉ DES POLYOLS, PAR TYPE, 2021-2030 (EN MILLIONS USD)
TABLEAU 183 MARCHÉ MEXICAIN DES SUPPORTS DE TAPIS EN POLYOLS, PAR TYPE, 2021-2030 (EN MILLIONS USD)
TABLEAU 184 AUTRES MARCHÉS DES POLYOLS AU MEXIQUE, PAR TYPE, 2021-2030 (EN MILLIONS USD)
TABLEAU 185 MARCHÉ EUROPÉEN DES POLYOLS, PAR PAYS, 2021-2030 (EN MILLIONS USD)
TABLEAU 186 MARCHÉ EUROPÉEN DES POLYOLS, PAR PAYS, 2021-2030 (MT)
TABLEAU 187 MARCHÉ EUROPÉEN DES POLYOLS, PAR TYPE, 2021-2030 (EN MILLIONS USD)
TABLEAU 188 MARCHÉ EUROPÉEN DES POLYOLS, PAR TYPE, 2021-2030 (MT)
TABLEAU 189 MARCHÉ EUROPÉEN DES POLYOLS, PAR APPLICATION, 2021-2030 (EN MILLIONS USD)
TABLEAU 190 MARCHÉ EUROPÉEN DES POLYOLS, PAR UTILISATEUR FINAL, 2021-2030 (EN MILLIONS USD)
TABLEAU 191 MARCHÉ EUROPÉEN DE LA CONSTRUCTION DANS LE DOMAINE DES POLYOLS, PAR TYPE, 2021-2030 (EN MILLIONS USD)
TABLEAU 192 MARCHÉ EUROPÉEN DU MOBILIER EN POLYOLS, PAR TYPE, 2021-2030 (EN MILLIONS USD)
TABLEAU 193 MARCHÉ EUROPÉEN DES TRANSPORTS SUR LE MARCHÉ DES POLYOLS, PAR TYPE, 2021-2030 (EN MILLIONS USD)
TABLEAU 194 MARCHÉ EUROPÉEN DES EMBALLAGES DANS LES POLYOLS, PAR TYPE, 2021-2030 (EN MILLIONS USD)
TABLEAU 195 MARCHÉ EUROPÉEN DES DOSSIERS DE TAPIS EN POLYOLS, PAR TYPE, 2021-2030 (EN MILLIONS USD)
TABLEAU 196 AUTRES MARCHÉS EUROPÉENS SUR LE MARCHÉ DES POLYOLS, PAR TYPE, 2021-2030 (EN MILLIONS USD)
TABLEAU 197 MARCHÉ DES POLYOLS EN ALLEMAGNE, PAR TYPE, 2021-2030 (EN MILLIONS USD)
TABLEAU 198 MARCHÉ DES POLYOLS EN ALLEMAGNE, PAR TYPE, 2021-2030 (MT)
TABLEAU 199 MARCHÉ DES POLYOLS EN ALLEMAGNE, PAR APPLICATION, 2021-2030 (EN MILLIONS USD)
TABLEAU 200 MARCHÉ DES POLYOLS EN ALLEMAGNE, PAR UTILISATEUR FINAL, 2021-2030 (EN MILLIONS USD)
TABLEAU 201 MARCHÉ DE LA CONSTRUCTION EN ALLEMAGNE DANS LE DOMAINE DES POLYOLS, PAR TYPE, 2021-2030 (EN MILLIONS USD)
TABLEAU 202 MARCHÉ ALLEMAND DU MOBILIER EN POLYOLS, PAR TYPE, 2021-2030 (EN MILLIONS USD)
TABLEAU 203 MARCHÉ DES TRANSPORTS EN ALLEMAGNE SUR LE MARCHÉ DES POLYOLS, PAR TYPE, 2021-2030 (EN MILLIONS USD)
TABLEAU 204 MARCHÉ ALLEMAND DES EMBALLAGES DANS LES POLYOLS, PAR TYPE, 2021-2030 (EN MILLIONS USD)
TABLEAU 205 MARCHÉ ALLEMAND DES SUPPORTS DE TAPIS EN POLYOLS, PAR TYPE, 2021-2030 (EN MILLIONS USD)
TABLEAU 206 ALLEMAGNE AUTRES MARCHÉS DES POLYOLS, PAR TYPE, 2021-2030 (EN MILLIONS USD)
TABLEAU 207 MARCHÉ FRANÇAIS DES POLYOLS, PAR TYPE, 2021-2030 (EN MILLIONS USD)
TABLEAU 208 MARCHÉ FRANÇAIS DES POLYOLS, PAR TYPE, 2021-2030 (MT)
TABLEAU 209 MARCHÉ FRANÇAIS DES POLYOLS, PAR APPLICATION, 2021-2030 (EN MILLIONS USD)
TABLEAU 210 MARCHÉ FRANÇAIS DES POLYOLS, PAR UTILISATEUR FINAL, 2021-2030 (EN MILLIONS USD)
TABLEAU 211 MARCHÉ FRANÇAIS DE LA CONSTRUCTION DANS LE DOMAINE DES POLYOLS, PAR TYPE, 2021-2030 (EN MILLIONS USD)
TABLEAU 212 MARCHÉ FRANÇAIS DU MOBILIER EN POLYOLS, PAR TYPE, 2021-2030 (EN MILLIONS USD)
TABLEAU 213 MARCHÉ DES TRANSPORTS EN FRANCE SUR LE MARCHÉ DES POLYOLS, PAR TYPE, 2021-2030 (EN MILLIONS USD)
TABLEAU 214 MARCHÉ FRANÇAIS DES EMBALLAGES DANS LES POLYOLS, PAR TYPE, 2021-2030 (EN MILLIONS USD)
TABLEAU 215 MARCHÉ FRANÇAIS DES SUPPORTS DE TAPIS EN POLYOLS, PAR TYPE, 2021-2030 (EN MILLIONS USD)
TABLEAU 216 FRANCE AUTRES MARCHÉS DES POLYOLS, PAR TYPE, 2021-2030 (EN MILLIONS USD)
TABLEAU 217 MARCHÉ ITALIEN DES POLYOLS, PAR TYPE, 2021-2030 (EN MILLIONS USD)
TABLEAU 218 MARCHÉ ITALIEN DES POLYOLS, PAR TYPE, 2021-2030 (MT)
TABLEAU 219 MARCHÉ ITALIEN DES POLYOLS, PAR APPLICATION, 2021-2030 (EN MILLIONS USD)
TABLEAU 220 MARCHÉ ITALIEN DES POLYOLS, PAR UTILISATEUR FINAL, 2021-2030 (EN MILLIONS USD)
TABLEAU 221 MARCHÉ ITALIEN DE LA CONSTRUCTION DANS LE DOMAINE DES POLYOLS, PAR TYPE, 2021-2030 (EN MILLIONS USD)
TABLEAU 222 MARCHÉ ITALIEN DES MEUBLES EN POLYOLS, PAR TYPE, 2021-2030 (EN MILLIONS USD)
TABLEAU 223 MARCHÉ ITALIEN DES TRANSPORTS SUR LE MARCHÉ DES POLYOLS, PAR TYPE, 2021-2030 (EN MILLIONS USD)
TABLEAU 224 MARCHÉ ITALIEN DES EMBALLAGES DANS LES POLYOLS, PAR TYPE, 2021-2030 (EN MILLIONS USD)
TABLEAU 225 MARCHÉ ITALIEN DES SUPPORTS DE TAPIS EN POLYOLS, PAR TYPE, 2021-2030 (EN MILLIONS USD)
TABLEAU 226 AUTRES MARCHÉS DES POLYOLS EN ITALIE, PAR TYPE, 2021-2030 (EN MILLIONS USD)
TABLEAU 227 MARCHÉ DES POLYOLS AUX PAYS-BAS, PAR TYPE, 2021-2030 (EN MILLIONS USD)
TABLEAU 228 MARCHÉ DES POLYOLS AUX PAYS-BAS, PAR TYPE, 2021-2030 (MT)
TABLEAU 229 MARCHÉ DES POLYOLS AUX PAYS-BAS, PAR APPLICATION, 2021-2030 (EN MILLIONS USD)
TABLEAU 230 MARCHÉ DES POLYOLS AUX PAYS-BAS, PAR UTILISATEUR FINAL, 2021-2030 (EN MILLIONS USD)
TABLEAU 231 MARCHÉ DE LA CONSTRUCTION AUX PAYS-BAS DANS LE DOMAINE DES POLYOLS, PAR TYPE, 2021-2030 (EN MILLIONS USD)
TABLEAU 232 MARCHÉ DES MEUBLES EN POLYOLS AUX PAYS-BAS, PAR TYPE, 2021-2030 (EN MILLIONS USD)
TABLEAU 233 MARCHÉ DES TRANSPORTS AUX PAYS-BAS SUR LE MARCHÉ DES POLYOLS, PAR TYPE, 2021-2030 (EN MILLIONS USD)
TABLEAU 234 PAYS-BAS : MARCHÉ DES EMBALLAGES DANS LES POLYOLS, PAR TYPE, 2021-2030 (EN MILLIONS USD)
TABLEAU 235 MARCHÉ DES DOSSIERS DE TAPIS EN POLYOLS AUX PAYS-BAS, PAR TYPE, 2021-2030 (EN MILLIONS USD)
TABLEAU 236 PAYS-BAS AUTRES INTERVENANTS SUR LE MARCHÉ DES POLYOLS, PAR TYPE, 2021-2030 (EN MILLIONS USD)
TABLEAU 237 MARCHÉ DES POLYOLS AU ROYAUME-UNI, PAR TYPE, 2021-2030 (EN MILLIONS USD)
TABLEAU 238 MARCHÉ DES POLYOLS AU ROYAUME-UNI, PAR TYPE, 2021-2030 (MT)
TABLEAU 239 MARCHÉ DES POLYOLS AU ROYAUME-UNI, PAR APPLICATION, 2021-2030 (EN MILLIONS USD)
TABLEAU 240 MARCHÉ DES POLYOLS AU ROYAUME-UNI, PAR UTILISATEUR FINAL, 2021-2030 (EN MILLIONS USD)
TABLEAU 241 MARCHÉ DE LA CONSTRUCTION AU ROYAUME-UNI DANS LE DOMAINE DES POLYOLS, PAR TYPE, 2021-2030 (EN MILLIONS USD)
TABLEAU 242 MARCHÉ BRITANNIQUE DES MEUBLES EN POLYOLS, PAR TYPE, 2021-2030 (EN MILLIONS USD)
TABLEAU 243 TRANSPORT AU ROYAUME-UNI SUR LE MARCHÉ DES POLYOLS, PAR TYPE, 2021-2030 (EN MILLIONS USD)
TABLEAU 244 EMBALLAGES SUR LE MARCHÉ DES POLYOLS AU ROYAUME-UNI, PAR TYPE, 2021-2030 (EN MILLIONS USD)
TABLEAU 245 MARCHÉ BRITANNIQUE DES SUPPORTS DE TAPIS EN POLYOLS, PAR TYPE, 2021-2030 (EN MILLIONS USD)
TABLEAU 246 AUTRES ENTREPRISES DU MARCHÉ DES POLYOLS AU ROYAUME-UNI, PAR TYPE, 2021-2030 (EN MILLIONS USD)
TABLEAU 247 MARCHÉ ESPAGNOL DES POLYOLS, PAR TYPE, 2021-2030 (EN MILLIONS USD)
TABLEAU 248 MARCHÉ ESPAGNOL DES POLYOLS, PAR TYPE, 2021-2030 (MT)
TABLEAU 249 MARCHÉ ESPAGNOL DES POLYOLS, PAR APPLICATION, 2021-2030 (EN MILLIONS USD)
TABLEAU 250 MARCHÉ ESPAGNOL DES POLYOLS, PAR UTILISATEUR FINAL, 2021-2030 (EN MILLIONS USD)
TABLEAU 251 MARCHÉ DE LA CONSTRUCTION EN ESPAGNE, PAR TYPE, 2021-2030 (EN MILLIONS USD)
TABLEAU 252 MARCHÉ ESPAGNOL DES MEUBLES EN POLYOLS, PAR TYPE, 2021-2030 (EN MILLIONS USD)
TABLEAU 253 MARCHÉ DES TRANSPORTS EN ESPAGNE SUR LE MARCHÉ DES POLYOLS, PAR TYPE, 2021-2030 (EN MILLIONS USD)
TABLEAU 254 EMBALLAGES ESPAGNOLS SUR LE MARCHÉ DES POLYOLS, PAR TYPE, 2021-2030 (EN MILLIONS USD)
TABLEAU 255 MARCHÉ ESPAGNOL DES SUPPORTS DE TAPIS EN POLYOLS, PAR TYPE, 2021-2030 (EN MILLIONS USD)
TABLEAU 256 ESPAGNE AUTRES MARCHÉS DES POLYOLS, PAR TYPE, 2021-2030 (EN MILLIONS USD)
TABLEAU 257 MARCHÉ BELGE DES POLYOLS, PAR TYPE, 2021-2030 (EN MILLIONS USD)
TABLEAU 258 MARCHÉ BELGE DES POLYOLS, PAR TYPE, 2021-2030 (MT)
TABLEAU 259 MARCHÉ BELGE DES POLYOLS, PAR APPLICATION, 2021-2030 (EN MILLIONS USD)
TABLEAU 260 MARCHÉ BELGE DES POLYOLS, PAR UTILISATEUR FINAL, 2021-2030 (EN MILLIONS USD)
TABLEAU 261 MARCHÉ DE LA CONSTRUCTION EN BELGE DANS LE DOMAINE DES POLYOLS, PAR TYPE, 2021-2030 (EN MILLIONS USD)
TABLEAU 262 MARCHÉ BELGE DES MEUBLES EN POLYOLS, PAR TYPE, 2021-2030 (EN MILLIONS USD)
TABLEAU 263 MARCHÉ DES TRANSPORTS EN BELGE SUR LE MARCHÉ DES POLYOLS, PAR TYPE, 2021-2030 (EN MILLIONS USD)
TABLEAU 264 MARCHÉ BELGE DES EMBALLAGES DANS LES POLYOLS, PAR TYPE, 2021-2030 (EN MILLIONS USD)
TABLEAU 265 MARCHÉ BELGE DES SUPPORTS DE TAPIS EN POLYOLS, PAR TYPE, 2021-2030 (EN MILLIONS USD)
TABLEAU 266 AUTRES ENTREPRISES SUR LE MARCHÉ DES POLYOLS EN BELGIQUE, PAR TYPE, 2021-2030 (EN MILLIONS USD)
TABLEAU 267 MARCHÉ RUSSE DES POLYOLS, PAR TYPE, 2021-2030 (EN MILLIONS USD)
TABLEAU 268 MARCHÉ RUSSE DES POLYOLS, PAR TYPE, 2021-2030 (MT)
TABLEAU 269 MARCHÉ RUSSE DES POLYOLS, PAR APPLICATION, 2021-2030 (EN MILLIONS USD)
TABLEAU 270 MARCHÉ RUSSE DES POLYOLS, PAR UTILISATEUR FINAL, 2021-2030 (EN MILLIONS USD)
TABLEAU 271 MARCHÉ RUSSE DE LA CONSTRUCTION SUR LE MARCHÉ DES POLYOLS, PAR TYPE, 2021-2030 (EN MILLIONS USD)
TABLEAU 272 MARCHÉ RUSSE DES MEUBLES EN POLYOLS, PAR TYPE, 2021-2030 (EN MILLIONS USD)
TABLEAU 273 TRANSPORT RUSSE SUR LE MARCHÉ DES POLYOLS, PAR TYPE, 2021-2030 (EN MILLIONS USD)
TABLEAU 274 EMBALLAGES RUSSES SUR LE MARCHÉ DES POLYOLS, PAR TYPE, 2021-2030 (EN MILLIONS USD)
TABLEAU 275 MARCHÉ RUSSE DES SUPPORTS DE TAPIS EN POLYOLS, PAR TYPE, 2021-2030 (EN MILLIONS USD)
TABLEAU 276 AUTRES MARCHÉS RUSSES SUR LE MARCHÉ DES POLYOLS, PAR TYPE, 2021-2030 (EN MILLIONS USD)
TABLEAU 277 MARCHÉ SUISSE DES POLYOLS, PAR TYPE, 2021-2030 (EN MILLIONS USD)
TABLEAU 278 MARCHÉ SUISSE DES POLYOLS, PAR TYPE, 2021-2030 (MT)
TABLEAU 279 MARCHÉ SUISSE DES POLYOLS, PAR APPLICATION, 2021-2030 (EN MILLIONS USD)
TABLEAU 280 MARCHÉ SUISSE DES POLYOLS, PAR UTILISATEUR FINAL, 2021-2030 (EN MILLIONS USD)
TABLEAU 281 MARCHÉ SUISSE DE LA CONSTRUCTION DANS LES POLYOLS, PAR TYPE, 2021-2030 (EN MILLIONS USD)
TABLEAU 282 MARCHÉ SUISSE DES MEUBLES EN POLYOLS, PAR TYPE, 2021-2030 (EN MILLIONS USD)
TABLEAU 283 MARCHÉ DES TRANSPORTS SUISSES SUR LE MARCHÉ DES POLYOLS, PAR TYPE, 2021-2030 (EN MILLIONS USD)
TABLEAU 284 MARCHÉ SUISSE DES EMBALLAGES DANS LES POLYOLS, PAR TYPE, 2021-2030 (EN MILLIONS USD)
TABLEAU 285 MARCHÉ SUISSE DES DOSSIERS DE TAPIS EN POLYOLS, PAR TYPE, 2021-2030 (EN MILLIONS USD)
TABLEAU 286 SUISSE AUTRES MARCHÉS DES POLYOLS, PAR TYPE, 2021-2030 (EN MILLIONS USD)
TABLEAU 287 MARCHÉ DES POLYOLS EN TURQUIE, PAR TYPE, 2021-2030 (EN MILLIONS USD)
TABLEAU 288 MARCHÉ DES POLYOLS EN TURQUIE, PAR TYPE, 2021-2030 (MT)
TABLEAU 289 MARCHÉ DES POLYOLS EN TURQUIE, PAR APPLICATION, 2021-2030 (EN MILLIONS USD)
TABLEAU 290 MARCHÉ DES POLYOLS EN TURQUIE, PAR UTILISATEUR FINAL, 2021-2030 (EN MILLIONS USD)
TABLEAU 291 MARCHÉ DE LA CONSTRUCTION EN TURQUIE DANS LES POLYOLS, PAR TYPE, 2021-2030 (EN MILLIONS USD)
TABLEAU 292 MARCHÉ DES MEUBLES EN POLYOLS EN TURQUIE, PAR TYPE, 2021-2030 (EN MILLIONS USD)
TABLEAU 293 TRANSPORT EN TURQUIE SUR LE MARCHÉ DES POLYOLS, PAR TYPE, 2021-2030 (EN MILLIONS USD)
TABLEAU 294 EMBALLAGES EN TURQUIE SUR LE MARCHÉ DES POLYOLS, PAR TYPE, 2021-2030 (EN MILLIONS USD)
TABLEAU 295 MARCHÉ DES SUPPORTS DE TAPIS EN POLYOLS EN TURQUIE, PAR TYPE, 2021-2030 (EN MILLIONS USD)
TABLEAU 296 AUTRES MARCHÉS DES POLYOLS EN TURQUIE, PAR TYPE, 2021-2030 (EN MILLIONS USD)
TABLEAU 297 MARCHÉ DES POLYOLS DANS LE RESTE DE L'EUROPE, PAR TYPE, 2021-2030 (EN MILLIONS USD)
TABLEAU 298 MARCHÉ DES POLYOLS DANS LE RESTE DE L'EUROPE, PAR TYPE, 2021-2030 (MT)
TABLEAU 299 MARCHÉ DES POLYOLS AU MOYEN-ORIENT ET EN AFRIQUE, PAR PAYS, 2021-2030 (EN MILLIONS USD)
TABLEAU 300 MARCHÉ DES POLYOLS AU MOYEN-ORIENT ET EN AFRIQUE, PAR PAYS, 2021-2030 (MT)
TABLEAU 301 MARCHÉ DES POLYOLS AU MOYEN-ORIENT ET EN AFRIQUE, PAR TYPE, 2021-2030 (EN MILLIONS USD)
TABLEAU 302 MARCHÉ DES POLYOLS AU MOYEN-ORIENT ET EN AFRIQUE, PAR TYPE, 2021-2030 (MT)
TABLEAU 303 MARCHÉ DES POLYOLS AU MOYEN-ORIENT ET EN AFRIQUE, PAR APPLICATION, 2021-2030 (EN MILLIONS USD)
TABLEAU 304 MARCHÉ DES POLYOLS AU MOYEN-ORIENT ET EN AFRIQUE, PAR UTILISATEUR FINAL, 2021-2030 (EN MILLIONS USD)
TABLEAU 305 MARCHÉ DE LA CONSTRUCTION À BASE DE POLYOLS AU MOYEN-ORIENT ET EN AFRIQUE, PAR TYPE, 2021-2030 (EN MILLIONS USD)
TABLEAU 306 MARCHÉ DES MEUBLES EN POLYOLS AU MOYEN-ORIENT ET EN AFRIQUE, PAR TYPE, 2021-2030 (EN MILLIONS USD)
TABLEAU 307 TRANSPORT AU MOYEN-ORIENT ET EN AFRIQUE SUR LE MARCHÉ DES POLYOLS, PAR TYPE, 2021-2030 (EN MILLIONS USD)
TABLEAU 308 MARCHÉ DES EMBALLAGES EN POLYOLS AU MOYEN-ORIENT ET EN AFRIQUE, PAR TYPE, 2021-2030 (EN MILLIONS USD)
TABLEAU 309 MARCHÉ DES SUPPORTS DE TAPIS EN POLYOLS AU MOYEN-ORIENT ET EN AFRIQUE, PAR TYPE, 2021-2030 (EN MILLIONS USD)
TABLEAU 310 AUTRES MARCHÉS DES POLYOLS AU MOYEN-ORIENT ET EN AFRIQUE, PAR TYPE, 2021-2030 (EN MILLIONS USD)
TABLEAU 311 MARCHÉ DES POLYOLS EN ARABIE SAOUDITE, PAR TYPE, 2021-2030 (EN MILLIONS USD)
TABLEAU 312 MARCHÉ DES POLYOLS EN ARABIE SAOUDITE, PAR TYPE, 2021-2030 (MT)
TABLEAU 313 MARCHÉ DES POLYOLS EN ARABIE SAOUDITE, PAR APPLICATION, 2021-2030 (EN MILLIONS USD)
TABLEAU 314 MARCHÉ DES POLYOLS EN ARABIE SAOUDITE, PAR UTILISATEUR FINAL, 2021-2030 (EN MILLIONS USD)
TABLEAU 315 ARABIE SAOUDITE MARCHÉ DE LA CONSTRUCTION EN POLYOLS, PAR TYPE, 2021-2030 (EN MILLIONS USD)
TABLEAU 316 ARABIE SAOUDITE MARCHÉ DES MEUBLES EN POLYOLS, PAR TYPE, 2021-2030 (EN MILLIONS USD)
TABLEAU 317 ARABIE SAOUDITE TRANSPORT SUR LE MARCHÉ DES POLYOLS, PAR TYPE, 2021-2030 (EN MILLIONS USD)
TABLEAU 318 ARABIE SAOUDITE MARCHÉ DES EMBALLAGES DANS LES POLYOLS, PAR TYPE, 2021-2030 (EN MILLIONS USD)
TABLEAU 319 ARABIE SAOUDITE MARCHÉ DES DOSSIERS DE TAPIS EN POLYOLS, PAR TYPE, 2021-2030 (EN MILLIONS USD)
TABLEAU 320 ARABIE SAOUDITE AUTRES MARCHÉS DES POLYOLS, PAR TYPE, 2021-2030 (EN MILLIONS USD)
TABLEAU 321 MARCHÉ DES POLYOLS AUX ÉMIRATS ARABES UNIS, PAR TYPE, 2021-2030 (EN MILLIONS USD)
TABLEAU 322 MARCHÉ DES POLYOLS AUX EAU, PAR TYPE, 2021-2030 (MT)
TABLEAU 323 MARCHÉ DES POLYOLS AUX EAU, PAR APPLICATION, 2021-2030 (EN MILLIONS USD)
TABLEAU 324 MARCHÉ DES POLYOLS AUX EAU, PAR UTILISATEUR FINAL, 2021-2030 (EN MILLIONS USD)
TABLEAU 325 MARCHÉ DE LA CONSTRUCTION AUX ÉMIRATS ARABES UNIS DANS LE DOMAINE DES POLYOLS, PAR TYPE, 2021-2030 (EN MILLIONS USD)
TABLEAU 326 MARCHÉ DES MEUBLES EN POLYOLS AUX ÉMIRATS ARABES UNIS, PAR TYPE, 2021-2030 (EN MILLIONS USD)
TABLEAU 327 TRANSPORTS AUX ÉMIRATS ARABES UNIS SUR LE MARCHÉ DES POLYOLS, PAR TYPE, 2021-2030 (EN MILLIONS USD)
TABLEAU 328 EMBALLAGES SUR LE MARCHÉ DES POLYOLS AUX EAU, PAR TYPE, 2021-2030 (EN MILLIONS USD)
TABLEAU 329 MARCHÉ DES SUPPORTS DE TAPIS EN POLYOLS AUX EAU, PAR TYPE, 2021-2030 (EN MILLIONS USD)
TABLEAU 330 AUTRES INTERVENANTS SUR LE MARCHÉ DES POLYOLS AUX ÉMIRATS ARABES UNIS, PAR TYPE, 2021-2030 (EN MILLIONS USD)
TABLEAU 331 MARCHÉ DES POLYOLS EN ÉGYPTE, PAR TYPE, 2021-2030 (EN MILLIONS USD)
TABLEAU 332 MARCHÉ DES POLYOLS EN ÉGYPTE, PAR TYPE, 2021-2030 (MT)
TABLEAU 333 MARCHÉ DES POLYOLS EN ÉGYPTE, PAR APPLICATION, 2021-2030 (EN MILLIONS USD)
TABLEAU 334 MARCHÉ DES POLYOLS EN ÉGYPTE, PAR UTILISATEUR FINAL, 2021-2030 (EN MILLIONS USD)
TABLEAU 335 MARCHÉ ÉGYPTIEN DE LA CONSTRUCTION DANS LES POLYOLS, PAR TYPE, 2021-2030 (EN MILLIONS USD)
TABLEAU 336 MARCHÉ DES MEUBLES EN POLYOLS EN ÉGYPTE, PAR TYPE, 2021-2030 (EN MILLIONS USD)
TABLEAU 337 MARCHÉ DES TRANSPORTS DE POLYOLS EN ÉGYPTE, PAR TYPE, 2021-2030 (EN MILLIONS USD)
TABLEAU 338 MARCHÉ ÉGYPTIEN DES EMBALLAGES DANS LES POLYOLS, PAR TYPE, 2021-2030 (EN MILLIONS USD)
TABLEAU 339 MARCHÉ DES SUPPORTS DE TAPIS EN POLYOLS EN ÉGYPTE, PAR TYPE, 2021-2030 (EN MILLIONS USD)
TABLEAU 340 ÉGYPTE AUTRES MARCHÉS DES POLYOLS, PAR TYPE, 2021-2030 (EN MILLIONS USD)
TABLEAU 341 MARCHÉ DES POLYOLS EN AFRIQUE DU SUD, PAR TYPE, 2021-2030 (EN MILLIONS USD)
TABLEAU 342 MARCHÉ DES POLYOLS EN AFRIQUE DU SUD, PAR TYPE, 2021-2030 (MT)
TABLEAU 343 MARCHÉ DES POLYOLS EN AFRIQUE DU SUD, PAR APPLICATION, 2021-2030 (EN MILLIONS USD)
TABLEAU 344 MARCHÉ DES POLYOLS EN AFRIQUE DU SUD, PAR UTILISATEUR FINAL, 2021-2030 (EN MILLIONS USD)
TABLEAU 345 MARCHÉ DE LA CONSTRUCTION EN AFRIQUE DU SUD DANS LE DOMAINE DES POLYOLS, PAR TYPE, 2021-2030 (EN MILLIONS USD)
TABLEAU 346 MARCHÉ DES MEUBLES EN POLYOLS EN AFRIQUE DU SUD, PAR TYPE, 2021-2030 (EN MILLIONS USD)
TABLEAU 347 TRANSPORTS EN AFRIQUE DU SUD SUR LE MARCHÉ DES POLYOLS, PAR TYPE, 2021-2030 (EN MILLIONS USD)
TABLEAU 348 MARCHÉ DES EMBALLAGES EN POLYOLS EN AFRIQUE DU SUD, PAR TYPE, 2021-2030 (EN MILLIONS USD)
TABLEAU 349 MARCHÉ DES SUPPORTS DE TAPIS EN POLYOLS EN AFRIQUE DU SUD, PAR TYPE, 2021-2030 (EN MILLIONS USD)
TABLEAU 350 AUTRES EN AFRIQUE DU SUD SUR LE MARCHÉ DES POLYOLS, PAR TYPE, 2021-2030 (EN MILLIONS USD)
TABLEAU 351 MARCHÉ DES POLYOLS EN ISRAËL, PAR TYPE, 2021-2030 (EN MILLIONS USD)
TABLEAU 352 MARCHÉ DES POLYOLS EN ISRAËL, PAR TYPE, 2021-2030 (MT)
TABLEAU 353 MARCHÉ DES POLYOLS EN ISRAËL, PAR APPLICATION, 2021-2030 (EN MILLIONS USD)
TABLEAU 354 MARCHÉ DES POLYOLS EN ISRAËL, PAR UTILISATEUR FINAL, 2021-2030 (EN MILLIONS USD)
TABLEAU 355 MARCHÉ DE LA CONSTRUCTION EN ISRAËL DANS LE DOMAINE DES POLYOLS, PAR TYPE, 2021-2030 (EN MILLIONS USD)
TABLEAU 356 MARCHÉ DES MEUBLES EN POLYOLS EN ISRAËL, PAR TYPE, 2021-2030 (EN MILLIONS USD)
TABLEAU 357 TRANSPORTS ISRAÉLIEN SUR LE MARCHÉ DES POLYOLS, PAR TYPE, 2021-2030 (EN MILLIONS USD)
TABLEAU 358 MARCHÉ ISRAÉLIEN DES EMBALLAGES DANS LES POLYOLS, PAR TYPE, 2021-2030 (EN MILLIONS USD)
TABLEAU 359 MARCHÉ ISRAÉLIEN DES SUPPORTS DE TAPIS EN POLYOLS, PAR TYPE, 2021-2030 (EN MILLIONS USD)
TABLEAU 360 AUTRES ENTREPRISES ISRAÉLIENNES SUR LE MARCHÉ DES POLYOLS, PAR TYPE, 2021-2030 (EN MILLIONS USD)
TABLEAU 361 MARCHÉ DES POLYOLS DU RESTE DU MOYEN-ORIENT ET DE L'AFRIQUE, PAR TYPE, 2021-2030 (EN MILLIONS USD)
TABLEAU 362 MARCHÉ DES POLYOLS EN AMÉRIQUE DU SUD, PAR PAYS, 2021-2030 (EN MILLIONS USD)
TABLEAU 363 MARCHÉ DES POLYOLS EN AMÉRIQUE DU SUD, PAR PAYS, 2021-2030 (MT)
TABLEAU 364 MARCHÉ DES POLYOLS EN AMÉRIQUE DU SUD, PAR TYPE, 2021-2030 (EN MILLIONS USD)
TABLEAU 365 MARCHÉ DES POLYOLS EN AMÉRIQUE DU SUD, PAR TYPE, 2021-2030 (MT)
TABLEAU 366 MARCHÉ DES POLYOLS EN AMÉRIQUE DU SUD, PAR APPLICATION, 2021-2030 (EN MILLIONS USD)
TABLEAU 367 MARCHÉ DES POLYOLS EN AMÉRIQUE DU SUD, PAR UTILISATEUR FINAL, 2021-2030 (EN MILLIONS USD)
TABLEAU 368 MARCHÉ DE LA CONSTRUCTION EN AMÉRIQUE DU SUD DANS LE DOMAINE DES POLYOLS, PAR TYPE, 2021-2030 (EN MILLIONS USD)
TABLEAU 369 MARCHÉ DES MEUBLES EN POLYOLS EN AMÉRIQUE DU SUD, PAR TYPE, 2021-2030 (EN MILLIONS USD)
TABLEAU 370 TRANSPORT EN AMÉRIQUE DU SUD SUR LE MARCHÉ DES POLYOLS, PAR TYPE, 2021-2030 (EN MILLIONS USD)
TABLEAU 371 MARCHÉ DES EMBALLAGES EN AMÉRIQUE DU SUD DANS LES POLYOLS, PAR TYPE, 2021-2030 (EN MILLIONS USD)
TABLEAU 372 MARCHÉ DES SUPPORTS DE TAPIS EN POLYOLS EN AMÉRIQUE DU SUD, PAR TYPE, 2021-2030 (EN MILLIONS USD)
TABLEAU 373 AUTRES MARCHÉS DES POLYOLS EN AMÉRIQUE DU SUD, PAR TYPE, 2021-2030 (EN MILLIONS USD)
TABLEAU 374 MARCHÉ BRÉSILIEN DES POLYOLS, PAR TYPE, 2021-2030 (EN MILLIONS USD)
TABLEAU 375 MARCHÉ BRÉSILIEN DES POLYOLS, PAR TYPE, 2021-2030 (MT)
TABLEAU 376 MARCHÉ BRÉSILIEN DES POLYOLS, PAR APPLICATION, 2021-2030 (EN MILLIONS USD)
TABLEAU 377 MARCHÉ BRÉSILIEN DES POLYOLS, PAR UTILISATEUR FINAL, 2021-2030 (EN MILLIONS USD)
TABLEAU 378 MARCHÉ BRÉSILIEN DE LA CONSTRUCTION DANS LES POLYOLS, PAR TYPE, 2021-2030 (EN MILLIONS USD)
TABLEAU 379 MARCHÉ BRÉSILIEN DES MEUBLES EN POLYOLS, PAR TYPE, 2021-2030 (EN MILLIONS USD)
TABLEAU 380 MARCHÉ BRÉSILIEN DES TRANSPORTS SUR LE MARCHÉ DES POLYOLS, PAR TYPE, 2021-2030 (EN MILLIONS USD)
TABLEAU 381 MARCHÉ BRÉSILIEN DES EMBALLAGES DANS LES POLYOLS, PAR TYPE, 2021-2030 (EN MILLIONS USD)
TABLEAU 382 MARCHÉ BRÉSILIEN DES SUPPORTS DE TAPIS EN POLYOLS, PAR TYPE, 2021-2030 (EN MILLIONS USD)
TABLEAU 383 BRÉSIL AUTRES MARCHÉS DES POLYOLS, PAR TYPE, 2021-2030 (EN MILLIONS USD)
TABLEAU 384 MARCHÉ ARGENTINIEN DES POLYOLS, PAR TYPE, 2021-2030 (EN MILLIONS USD)
TABLEAU 385 MARCHÉ ARGENTINIEN DES POLYOLS, PAR TYPE, 2021-2030 (MT)
TABLEAU 386 MARCHÉ ARGENTINIEN DES POLYOLS, PAR APPLICATION, 2021-2030 (EN MILLIONS USD)
TABLEAU 387 MARCHÉ ARGENTINIEN DES POLYOLS, PAR UTILISATEUR FINAL, 2021-2030 (EN MILLIONS USD)
TABLEAU 388 MARCHÉ ARGENTIN DE LA CONSTRUCTION DANS LE DOMAINE DES POLYOLS, PAR TYPE, 2021-2030 (EN MILLIONS USD)
TABLEAU 389 MARCHÉ ARGENTIN DU MOBILIER EN POLYOLS, PAR TYPE, 2021-2030 (EN MILLIONS USD)
TABLEAU 390 MARCHÉ DES TRANSPORTS SUR LE MARCHÉ DES POLYOLS EN ARGENTINE, PAR TYPE, 2021-2030 (EN MILLIONS USD)
TABLEAU 391 MARCHÉ ARGENTIN DES EMBALLAGES SUR LE MARCHÉ DES POLYOLS, PAR TYPE, 2021-2030 (EN MILLIONS USD)
TABLEAU 392 MARCHÉ ARGENTINAISONS DES SUPPORTS DE TAPIS EN POLYOLS, PAR TYPE, 2021-2030 (EN MILLIONS USD)
TABLEAU 393 ARGENTINE AUTRES MARCHÉS DES POLYOLS, PAR TYPE, 2021-2030 (EN MILLIONS USD)
TABLEAU 394 MARCHÉ DES POLYOLS DU RESTE DE L'AMÉRIQUE DU SUD, PAR TYPE, 2021-2030 (EN MILLIONS USD)
Liste des figures
FIGURE 1 MARCHÉ MONDIAL DES POLYOLS : SEGMENTATION
FIGURE 2 MARCHÉ MONDIAL DES POLYOLS : MODÈLE DE VALIDATION DES DONNÉES DU TRÉPIED DBMR
FIGURE 3 MARCHÉ MONDIAL DES POLYOLS : ANALYSE DROC
FIGURE 4 MARCHÉ MONDIAL DES POLYOLS : ANALYSE DU MARCHÉ MONDIAL ET RÉGIONAL
FIGURE 5 MARCHÉ MONDIAL DES POLYOLS : ANALYSE DE LA RECHERCHE DES ENTREPRISES
FIGURE 6 MARCHÉ MONDIAL DES POLYOLS : DÉMOGRAPHIE DES ENTRETIENS
FIGURE 7 MARCHÉ MONDIAL DES POLYOLS : GRILLE DE POSITIONNEMENT DU MARCHÉ DBMR
FIGURE 8 MARCHÉ MONDIAL DES POLYOLS : ANALYSE DES PARTS DE FOURNISSEURS
FIGURE 9 MARCHÉ MONDIAL DES POLYOLS : MODÉLISATION MULTIVARIÉE
FIGURE 10 MARCHÉ MONDIAL DES POLYOLS : COURBE DE TYPE
FIGURE 11 MARCHÉ MONDIAL DES POLYOLS : GRILLE DE COUVERTURE DES APPLICATIONS DU MARCHÉ
FIGURE 12 MARCHÉ MONDIAL DES POLYOLS : SEGMENTATION
FIGURE 13 L'ASIE-PACIFIQUE DEVRAIT DOMINER ET ÊTRE LA RÉGION À LA CROISSANCE LA PLUS RAPIDE SUR LE MARCHÉ MONDIAL DES POLYOLS AU COURS DE LA PÉRIODE DE PRÉVISION DE 2023 À 2030
FIGURE 14 L'ASIE-PACIFIQUE EST LE MARCHÉ À LA CROISSANCE LA PLUS RAPIDE POUR LES FABRICANTS MONDIAUX DE POLYOLS AU COURS DE LA PÉRIODE DE PRÉVISION DE 2023 À 2030
FIGURE 15 LA DEMANDE CROISSANTE DANS LE SECTEUR DE LA CONSTRUCTION ET DES INFRASTRUCTURES DEVRAIT ÊTRE UN MOTEUR CLÉ DE LA CROISSANCE DU MARCHÉ MONDIAL DES POLYOLS AU COURS DE LA PÉRIODE DE PRÉVISION DE 2023 À 2030
FIGURE 16 LES POLYÉTHER POLYOLS DEVRAIENT REPRÉSENTER LA PLUS GRANDE PART DU MARCHÉ MONDIAL DES POLYOLS DE 2023 À 2030
FIGURE 17 GRAPHIQUE 1 : DONNÉES D'EXPORTATION DES PAYS DU MONDE ENTIER (DE JANVIER À MAI 2023)
FIGURE 18 MOTEURS, CONTRAINTES, OPPORTUNITÉS ET DÉFIS DU MARCHÉ MONDIAL DES POLYOLS
FIGURE 19 MARCHÉ MONDIAL DES POLYOLS : PAR TYPE, 2022
FIGURE 20 MARCHÉ MONDIAL DES POLYOLS : PAR APPLICATION, 2022
FIGURE 21 MARCHÉ MONDIAL DES POLYOLS : PAR UTILISATEUR FINAL, 2022
FIGURE 22 MARCHÉ MONDIAL DES POLYOLS : INSTANTANÉ (2022)
FIGURE 23 MARCHÉ MONDIAL DES POLYOLS : PAR RÉGION (2022)
FIGURE 24 MARCHÉ MONDIAL DES POLYOLS : PAR RÉGION (2023 & 2030)
FIGURE 25 MARCHÉ MONDIAL DES POLYOLS : PAR RÉGION (2022 & 2030)
FIGURE 26 MARCHÉ MONDIAL DES POLYOLS : PAR TYPE (2023 & 2030)
FIGURE 27 MARCHÉ DES POLYOLS EN ASIE-PACIFIQUE : INSTANTANÉ (2022)
FIGURE 28 MARCHÉ DES POLYOLS EN ASIE-PACIFIQUE : PAR PAYS (2022)
FIGURE 29 MARCHÉ DES POLYOLS EN ASIE-PACIFIQUE : PAR PAYS (2023 et 2030)
FIGURE 30 MARCHÉ DES POLYOLS EN ASIE-PACIFIQUE : PAR PAYS (2022 et 2030)
FIGURE 31 MARCHÉ DES POLYOLS EN ASIE-PACIFIQUE : PAR TYPE (2023-2030)
FIGURE 32 MARCHÉ DES POLYOLS EN AMÉRIQUE DU NORD : INSTANTANÉ (2022)
FIGURE 33 MARCHÉ DES POLYOLS EN AMÉRIQUE DU NORD : PAR PAYS (2022)
FIGURE 34 MARCHÉ DES POLYOLS EN AMÉRIQUE DU NORD : PAR PAYS (2023 et 2030)
FIGURE 35 MARCHÉ DES POLYOLS EN AMÉRIQUE DU NORD : PAR PAYS (2022 ET 2030)
FIGURE 36 MARCHÉ DES POLYOLS EN AMÉRIQUE DU NORD : PAR TYPE (2023-2030)
FIGURE 37 MARCHÉ EUROPÉEN DES POLYOLS : INSTANTANÉ (2022)
FIGURE 38 MARCHÉ EUROPÉEN DES POLYOLS : PAR PAYS (2022)
FIGURE 39 MARCHÉ EUROPÉEN DES POLYOLS : PAR PAYS (2023 & 2030)
FIGURE 40 MARCHÉ EUROPÉEN DES POLYOLS : PAR PAYS (2022 & 2030)
FIGURE 41 MARCHÉ EUROPÉEN DES POLYOLS : PAR TYPE (2023-2030)
FIGURE 42 MARCHÉ DES POLYOLS AU MOYEN-ORIENT ET EN AFRIQUE : INSTANTANÉ (2022)
FIGURE 43 MARCHÉ DES POLYOLS AU MOYEN-ORIENT ET EN AFRIQUE : PAR PAYS (2022)
FIGURE 44 MARCHÉ DES POLYOLS AU MOYEN-ORIENT ET EN AFRIQUE : PAR PAYS (2023 ET 2030)
FIGURE 45 MARCHÉ DES POLYOLS AU MOYEN-ORIENT ET EN AFRIQUE : PAR PAYS (2022 ET 2030)
FIGURE 46 MARCHÉ DES POLYOLS AU MOYEN-ORIENT ET EN AFRIQUE : PAR TYPE (2023-2030)
FIGURE 47 MARCHÉ DES POLYOLS EN AMÉRIQUE DU SUD : INSTANTANÉ (2022)
FIGURE 48 MARCHÉ DES POLYOLS EN AMÉRIQUE DU SUD : PAR PAYS (2022)
FIGURE 49 MARCHÉ DES POLYOLS EN AMÉRIQUE DU SUD : PAR PAYS (2023 et 2030)
FIGURE 50 MARCHÉ DES POLYOLS EN AMÉRIQUE DU SUD : PAR PAYS (2022 et 2030)
FIGURE 51 MARCHÉ DES POLYOLS EN AMÉRIQUE DU SUD : PAR TYPE (2023-2030)
FIGURE 52 MARCHÉ MONDIAL DES POLYOLS : PART DE L'ENTREPRISE 2022 (%)
FIGURE 53 MARCHÉ DES POLYOLS EN AMÉRIQUE DU NORD : PART DE L'ENTREPRISE 2022 (%)
FIGURE 54 MARCHÉ EUROPÉEN DES POLYOLS : PART DE L'ENTREPRISE 2022 (%)
FIGURE 55 MARCHÉ DES POLYOLS EN ASIE-PACIFIQUE : PART DE L'ENTREPRISE EN 2022 (%)
Méthodologie de recherche
La collecte de données et l'analyse de l'année de base sont effectuées à l'aide de modules de collecte de données avec des échantillons de grande taille. L'étape consiste à obtenir des informations sur le marché ou des données connexes via diverses sources et stratégies. Elle comprend l'examen et la planification à l'avance de toutes les données acquises dans le passé. Elle englobe également l'examen des incohérences d'informations observées dans différentes sources d'informations. Les données de marché sont analysées et estimées à l'aide de modèles statistiques et cohérents de marché. De plus, l'analyse des parts de marché et l'analyse des tendances clés sont les principaux facteurs de succès du rapport de marché. Pour en savoir plus, veuillez demander un appel d'analyste ou déposer votre demande.
La méthodologie de recherche clé utilisée par l'équipe de recherche DBMR est la triangulation des données qui implique l'exploration de données, l'analyse de l'impact des variables de données sur le marché et la validation primaire (expert du secteur). Les modèles de données incluent la grille de positionnement des fournisseurs, l'analyse de la chronologie du marché, l'aperçu et le guide du marché, la grille de positionnement des entreprises, l'analyse des brevets, l'analyse des prix, l'analyse des parts de marché des entreprises, les normes de mesure, l'analyse globale par rapport à l'analyse régionale et des parts des fournisseurs. Pour en savoir plus sur la méthodologie de recherche, envoyez une demande pour parler à nos experts du secteur.
Personnalisation disponible
Data Bridge Market Research est un leader de la recherche formative avancée. Nous sommes fiers de fournir à nos clients existants et nouveaux des données et des analyses qui correspondent à leurs objectifs. Le rapport peut être personnalisé pour inclure une analyse des tendances des prix des marques cibles, une compréhension du marché pour d'autres pays (demandez la liste des pays), des données sur les résultats des essais cliniques, une revue de la littérature, une analyse du marché des produits remis à neuf et de la base de produits. L'analyse du marché des concurrents cibles peut être analysée à partir d'une analyse basée sur la technologie jusqu'à des stratégies de portefeuille de marché. Nous pouvons ajouter autant de concurrents que vous le souhaitez, dans le format et le style de données que vous recherchez. Notre équipe d'analystes peut également vous fournir des données sous forme de fichiers Excel bruts, de tableaux croisés dynamiques (Fact book) ou peut vous aider à créer des présentations à partir des ensembles de données disponibles dans le rapport.

