


Global Remote Sensing Technology for Agriculture Market, By Component (Hardware, Software, and Service), Application (Yield Monitoring, Field Mapping, Crop Scouting, Weather Tracking & Forecasting, Irrigation Management, Inventory Management, Farm Labour Management, and Others) – Industry Trends and Forecast to 2030.
Remote Sensing Technology for Agriculture Market Analysis and Size
A modern farm and agriculture management approach that employs information technology to ensure that crops and soil receive exactly what they require for optimum health and productivity. Remote sensing technologies in agriculture aims to ensure profitability, sustainability, and environmental protection. The market is also benefiting from access to real-time data on crop, soil, and ambient air conditions, as well as other relevant information such as hyper-local weather forecasts, which is expected to grow the market which will raise revenues during the forecast period 2023-2030.
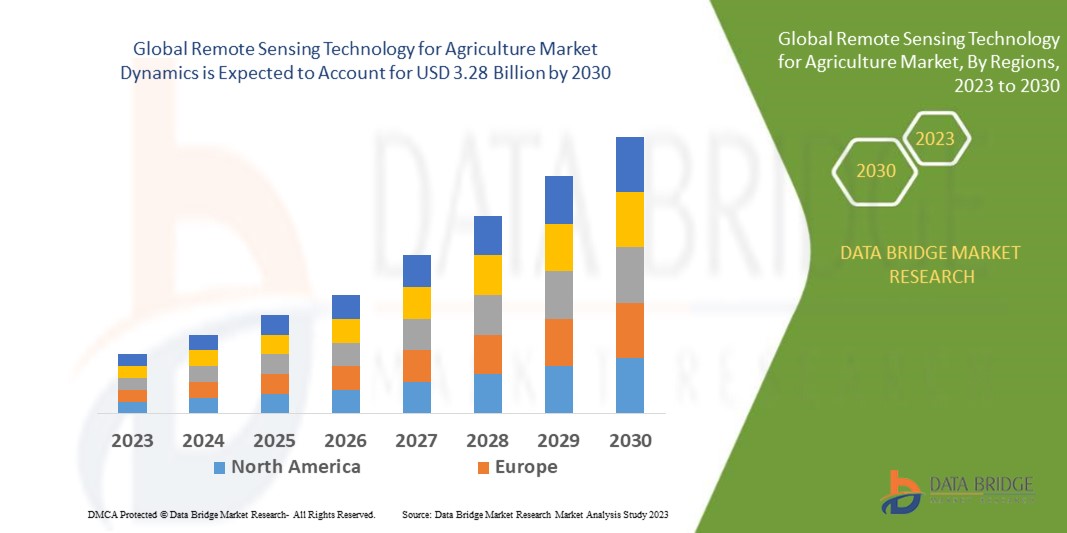
Data Bridge Market Research analyses that the global remote sensing technology for agriculture market was valued at USD 1.81 billion in 2022 and is expected to reach the value of USD 3.28 billion by 2030, at a CAGR of 7.70% during the forecast period of 2023 to 2030. “Hardware segment” is expected to dominate the market due to driving farming communities to use efficient agricultural methods. In addition to the insights on market scenarios such as market value, growth rate, segmentation, geographical coverage, and major players, the market reports curated by the Data Bridge Market Research also include in-depth expert analysis, geographically represented company-wise production and capacity, network layouts of distributors and partners, detailed and updated price trend analysis and deficit analysis of supply chain and demand.
Remote Sensing Technology for Agriculture Market Scope and Segmentation
|
Report Metric |
Details |
|
Forecast Period |
2023 to 2030 |
|
Base Year |
2022 |
|
Historic Years |
2021 (Customizable to 2015-2020) |
|
Quantitative Units |
Revenue in USD Million, Volumes in Units, Pricing in USD |
|
Segments Covered |
Component (Hardware, Software, and Service), Application (Yield Monitoring, Field Mapping, Crop Scouting, Weather Tracking & Forecasting, Irrigation Management, Inventory Management, Farm Labour Management, and Others) |
|
Countries Covered |
U.S., Canada and Mexico in North America, Germany, France, U.K., Netherlands, Switzerland, Belgium, Russia, Italy, Spain, Turkey, Rest of Europe in Europe, China, Japan, India, South Korea, Singapore, Malaysia, Australia, Thailand, Indonesia, Philippines, Rest of Asia-Pacific (APAC) in the Asia-Pacific (APAC), Saudi Arabia, U.A.E, Israel, Egypt, South Africa, Rest of Middle East and Africa (M.E.A.) as a part of Middle East and Africa (M.E.A.), Brazil, Argentina and Rest of South America as part of South America |
|
Market Players Covered |
Yara (Norway), Koch AG & Energy Solutions LLC (U.S.), Coromandel International Limited (India), AGRICULTURE SOLUTIONS INC. (Canada), Hafia Groups (Israel), Sapec Agro S.A. (Portugal), Kugler Company (U.S.), ICL (Israel), Van Iperen International (Netherlands), U.S. AG LLC (U.S.), Levant Power Corporation (U.S.), Honeywell International, Inc. (U.S.), Green Peak Technologies (Netherlands), Fujitsu (Japan), ABB(Switzerland), Texas Instruments Inc. (U.S.), ST Microelectronics (Switzerland) |
|
Market Opportunities |
|
Market Definition
Access to real-time data on crop, soil, and ambient air conditions, as well as other relevant information such as hyper-local weather forecasts, labour costs, and equipment availability, is part of the approach. Data is used by predictive analytics software to advise farmers on crop rotation, optimal planting and harvesting times, and soil management. Sensors in the field measure the moisture content and temperature of the soil as well as the surrounding air. Images can be processed and integrated with sensor and other data to provide guidance for immediate and future decisions, such as which fields to water and when or where to plant a specific crop.
Global Remote Sensing Technology for Agriculture Market Dynamics
Drivers
- Remote Sensing Technology for Agriculture
The primary factor driving farming communities to use efficient agricultural methods is a labour shortage in agricultural practises. High-value crops such as apples, strawberries, and sweet peppers are becoming less economically viable due to rising labour costs and a decrease in the number of skilled workers. Farmers of such fruits are increasingly turning to crop sensing solutions to facilitate effective plucking without causing physical damage to the crop.
- Implementation of Smart Agricultural Practices to Meet Rising Food Demand Globally
Rapid population growth is putting pressure on the agricultural sector around the world to increase productivity in order to meet rising food demand. Farmers are increasingly implementing smart harvest technologies such as harvesting robots, automation, control systems, sensors, and imaging systems to increase profitability and output in less time and at a lower cost. The scarcity of arable land is a major factor driving demand for indoor farming activities and the increased use of remote sensing technologies to reduce labour costs.
Opportunity
- Business growth
Firms in the target industry focuses on business growth through strategies such as advanced product launches, capacity expansion, and heavy production investments in their facilities, which are expected to flourish in the near future as the global remote sensing technology for agriculture market grows. Furthermore, site-specific nutrient management with precision agriculture, increased demand for industrial crops, and investment in agricultural operations in developing countries provide profitable opportunities to market participants.
Restraint/Challenge
- Large investment
The requirement for large initial investments in the production of numerous components is impeding the growth of the remote sensing technology market. Market participants must manufacture components and encrypt data content that meet regulatory organisation standards. This limits market growth opportunities for companies.
Recent Development
- In March 2021, China planned to launch a new satellite with a LiDAR (light detection and ranging) system to monitor CO2 levels in the atmosphere. Since 2016, China has launched three satellites into orbit for CO2 monitoring and research, all equipped with passive optical remote sensing technology.
Global Remote Sensing Technology for Agriculture Market Scope
The global remote sensing technology for agriculture market is on the basis of components and application. The growth amongst these segments will help you analyse meagre growth segments in the industries and provide the users with a valuable market overview and market insights to help them make strategic decisions for identifying core market applications.
Components
- Hardware
- Software
- Services
Application
- Yield Monitoring
- Field Mapping
- Crop Scouting
- Weather Tracking & Forecasting
- Irrigation Management
- Inventory Management
- Farm Labour Management
- Others
Global Remote Sensing Technology for Agriculture Market Regional Analysis/Insights
The global remote sensing technology for agriculture market is analyzed and market size insights and trends are provided by country, components and application as referenced above.
The countries covered in the global remote sensing technology for agriculture market report are U.S., Canada and Mexico in North America, Germany, France, U.K., Netherlands, Switzerland, Belgium, Russia, Italy, Spain, Turkey, Rest of Europe in Europe, China, Japan, India, South Korea, Singapore, Malaysia, Australia, Thailand, Indonesia, Philippines, Rest of Asia-Pacific (APAC) in the Asia-Pacific (APAC), Saudi Arabia, U.A.E, South Africa, Egypt, Israel, Rest of Middle East and Africa (M.E.A.) as a part of Middle East and Africa (M.E.A.), Brazil, Argentina and Rest of South America as part of South America.
North America had the largest market share, accounting for 38.10%. This share is accounted for by the presence of significant market players such as Lockheed Martin Corporation, Esri, and General Dynamics Mission Systems, Inc., among others.
The country section of the report also provides individual market impacting factors and changes in regulation in the market domestically that impacts the current and future trends of the market. Data points like down-stream and upstream value chain analysis, technical trends and porter's five forces analysis, case studies are some of the pointers used to forecast the market scenario for individual countries. Also, the presence and availability of global brands and their challenges faced due to large or scarce competition from local and domestic brands, impact of domestic tariffs and trade routes are considered while providing forecast analysis of the country data.
Competitive Landscape and Global Remote Sensing Technology for Agriculture Market Share Analysis
The global remote sensing technology for agriculture market competitive landscape provides details by competitor. Details included are company overview, company financials, revenue generated, market potential, investment in research and development, new market initiatives, global presence, production sites and facilities, production capacities, company strengths and weaknesses, product launch, product width and breadth, application dominance. The above data points provided are only related to the companies' focus related to global remote sensing technology for agriculture market .
Some of the major players operating in the global remote sensing technology for agriculture market are:
- Yara (Norway)
- Koch AG & Energy Solutions LLC (U.S.)
- Coromandel International Limited (India)
- AGRICULTURE SOLUTIONS INC. (Canada)
- Hafia Groups (Israel)
- Sapec Agro S.A. (Portugal)
- Kugler Company (U.S.)
- ICL (Israel)
- Van Iperen International (Netherlands)
- U.S. AG LLC (U.S.)
- Levant Power Corporation (U.S.)
- Honeywell International, Inc. (U.S.)
- Green Peak Technologies (Netherlands)
- Fujitsu (Japan)
- ABB(Switzerland)
- Texas Instruments Inc. (U.S.)
- ST Microelectronics (Switzerland)
SKU-
Accédez en ligne au rapport sur le premier cloud mondial de veille économique

- Tableau de bord d'analyse de données interactif
- Tableau de bord d'analyse d'entreprise pour les opportunités à fort potentiel de croissance
- Accès d'analyste de recherche pour la personnalisation et les requêtes
- Analyse de la concurrence avec tableau de bord interactif
- Dernières actualités, mises à jour et analyse des tendances
- Exploitez la puissance de l'analyse comparative pour un suivi complet de la concurrence
Table des matières
1. INTRODUCTION
1.1 OBJECTIFS DE L'ÉTUDE
1.2 DÉFINITION DU MARCHÉ
1.3 APERÇU DU MARCHÉ MONDIAL DE LA TECHNOLOGIE DE TÉLÉDÉTECTION POUR L'AGRICULTURE
1.4 MONNAIE ET TARIFS
1.5 LIMITATION
1.6 MARCHÉS COUVERTS
2. SEGMENTATION DU MARCHÉ
2.1 POINTS CLÉS À RETENIR
2.2 ARRIVER SUR LE MARCHÉ MONDIAL DE LA TECHNOLOGIE DE TÉLÉDÉTECTION POUR L'AGRICULTURE
2.2.1 GRILLE DE POSITIONNEMENT DES FOURNISSEURS
2.2.2 COURBE DE LA LIGNE DE VIE TECHNOLOGIQUE
2.2.3 GUIDE DU MARCHÉ
2.2.4 GRILLE DE POSITIONNEMENT DE L'ENTREPRISE
2.2.5 ANALYSE DES PARTS DE MARCHÉ DE L'ENTREPRISE
2.2.6 MODÉLISATION MULTIVARIÉE
2.2.7 ANALYSE DE HAUT EN BAS
2.2.8 NORMES DE MESURE
2.2.9 ANALYSE DES PARTS DES FOURNISSEURS
2.2.10 POINTS DE DONNÉES DES PRINCIPAUX ENTRETIENS
2.2.11 POINTS DE DONNÉES PROVENANT DE BASES DE DONNÉES SECONDAIRES CLÉS
2.3 MARCHÉ MONDIAL DE LA TECHNOLOGIE DE TÉLÉDÉTECTION POUR L'AGRICULTURE : APERÇU DE LA RECHERCHE
2.4 HYPOTHÈSES
3. APERÇU DU MARCHÉ
3.1 PILOTES
3.2 RESTRICTIONS
3.3 OPPORTUNITÉS
3.4 DÉFIS
4. RÉSUMÉ EXÉCUTIF
5. INFORMATIONS PREMIUM
5.1 LES CINQ FORCES DE PORTER
5.2 NORMES RÉGLEMENTAIRES
5.3 TENDANCES TECHNOLOGIQUES
5.4 ANALYSE DES BREVETS
5.5 ÉTUDE DE CAS
5.6 ANALYSE DE LA CHAÎNE DE VALEUR
5.7 ANALYSE COMPARATIVE DES ENTREPRISES
5.8 AVANTAGES DE L'UTILISATION DE LA TECHNOLOGIE DE TÉLÉDÉTECTION DANS L'AGRICULTURE
5.9 L'AVENIR DE LA TÉLÉDÉTECTION DANS L'AGRICULTURE
6. MARCHÉ MONDIAL DE LA TECHNOLOGIE DE TÉLÉDÉTECTION POUR L'AGRICULTURE, PAR TECHNOLOGIE
6.1 APERÇU
6.2 ACTIF
6.2.1 RADAR
6.2.2 SONAR
6.2.3 LASER
6.3 PASSIF
6.3.1 ÉNERGIE INFRAROUGE THERMIQUE
6.3.2 VISIBLE
6.3.3 PROCHE INFRAROUGE
7. MARCHÉ MONDIAL DE LA TECHNOLOGIE DE TÉLÉDÉTECTION POUR L'AGRICULTURE, PAR TYPE DE SYSTÈME
7.1 APERÇU
7.2 DÉTECTION OPTIQUE
7.3 DÉTECTION MULTISPECTRALE
7.4 DÉTECTION HYPERSPECTRALE
7.5 DÉTECTION THERMIQUE
7.6 DÉTECTION RADAR
7.7 DÉTECTION LIDAR
7.8 VÉHICULES AÉRIENS SANS PILOTE (UAV)
7.9 AUTRES
8. TECHNOLOGIE DE TÉLÉDÉTECTION MONDIALE POUR LE MARCHÉ AGRICOLE, PAR MÉCANISME DE PRODUIT
8.1 APERÇU
8.2 IMAGES PHOTOGRAPHIQUES
8.3 IMAGES NUMÉRIQUES
9. TECHNOLOGIE DE TÉLÉDÉTECTION MONDIALE POUR LE MARCHÉ AGRICOLE, PAR RÉSOLUTION D'IMAGE
9.1 APERÇU
9.2 RESSOURCE À FAIBLE RÉSOLUTION SPATIALE (> 30 MÈTRES)
9.3 SATELLITE À RÉSOLUTION MOYENNE (5-30 MÈTRES)
9.4 INDUSTRIE HAUTE RÉSOLUTION (1-5 MÈTRES)
9.5 INDUSTRIE TRÈS HAUTE RÉSOLUTION (< 1 MÈTRE)
10. MARCHÉ MONDIAL DE LA TECHNOLOGIE DE TÉLÉDÉTECTION POUR L'AGRICULTURE, PAR APPLICATION
10.1 APERÇU
10.2 SURVEILLANCE DU RENDEMENT
10.3 CARTOGRAPHIE DE CHAMP
10.4 RECHERCHE DE CULTURES
10.5 SUIVI ET PRÉVISIONS MÉTÉOROLOGIQUES
10.6 GESTION DE L'IRRIGATION
10.7 GESTION DES STOCKS
10.8 GESTION DE LA MAIN-D'ŒUVRE AGRICOLE
10.9 OBSERVATION DES CONDITIONS DU SOL
10.10 GESTION DES MAUVAISES HERBES
10.11 AUTRES
11. MARCHÉ MONDIAL DE LA TECHNOLOGIE DE TÉLÉDÉTECTION POUR L'AGRICULTURE, PAR ZONE GÉOGRAPHIQUE
MARCHÉ MONDIAL DE LA TECHNOLOGIE DE TÉLÉDÉTECTION POUR L'AGRICULTURE (TOUTES LES SEGMENTATIONS FOURNIES CI-DESSUS SONT REPRÉSENTÉES DANS CE CHAPITRE PAR PAYS)
11.1 AMÉRIQUE DU NORD
11.1.1 États-Unis
11.1.2 CANADA
11.1.3 MEXIQUE
11.2 EUROPE
11.2.1 ALLEMAGNE
11.2.2 FRANCE
11.2.3 Royaume-Uni
11.2.4 ITALIE
11.2.5 ESPAGNE
11.2.6 RUSSIE
11.2.7 TURQUIE
11.2.8 BELGIQUE
11.2.9 PAYS-BAS
11.2.10 NORVÈGE
11.2.11 FINLAND
11.2.12 SUISSE
11.2.13 DANEMARK
11.2.14 SUÈDE
11.2.15 POLOGNE
11.2.16 RESTE DE L'EUROPE
11.3 ASIE-PACIFIQUE
11.3.1 JAPON
11.3.2 CHINE
11.3.3 CORÉE DU SUD
11.3.4 INDE
11.3.5 AUSTRALIE
11.3.6 NOUVELLE-ZÉLANDE
11.3.7 SINGAPOUR
11.3.8 THAÏLANDE
11.3.9 MALAISIE
11.3.10 INDONÉSIE
11.3.11 PHILIPPINES
11.3.12 TAÏWAN
11.3.13 VIETNAM
11.3.14 RESTE DE L'ASIE-PACIFIQUE
11.4 AMÉRIQUE DU SUD
11.4.1 BRÉSIL
11.4.2 ARGENTINE
11.4.3 RESTE DE L'AMÉRIQUE DU SUD
11.5 MOYEN-ORIENT ET AFRIQUE
11.5.1 AFRIQUE DU SUD
11.5.2 ÉGYPTE
11.5.3 ARABIE SAOUDITE
11.5.4 Émirats arabes unis
11.5.5 OMAN
11.5.6 BAHREÏN
11.5.7 ISRAËL
11.5.8 KOWEÏT
11.5.9 QATAR
11.5.10 RESTE DU MOYEN-ORIENT ET DE L'AFRIQUE
11.6 PRINCIPALES INFORMATIONS : PAR PRINCIPAUX PAYS
12. TECHNOLOGIE DE TÉLÉDÉTECTION MONDIALE POUR LE MARCHÉ AGRICOLE, PAYSAGE DES ENTREPRISES
12.1 ANALYSE DES ACTIONS DE L'ENTREPRISE : MONDIALE
12.2 ANALYSE DES ACTIONS DE L'ENTREPRISE : AMÉRIQUE DU NORD
12.3 ANALYSE DES ACTIONS DE L'ENTREPRISE : EUROPE
12.4 ANALYSE DES ACTIONS DE L'ENTREPRISE : ASIE-PACIFIQUE
12.5 FUSIONS ET ACQUISITIONS
12.6 DÉVELOPPEMENT ET APPROBATIONS DE NOUVEAUX PRODUITS
12.7 EXTENSION
12.8 MODIFICATIONS RÉGLEMENTAIRES
12.9 PARTENARIAT ET AUTRES DÉVELOPPEMENTS STRATÉGIQUES
13. TECHNOLOGIE DE TÉLÉDÉTECTION MONDIALE POUR LE MARCHÉ AGRICOLE, ANALYSE SWOT ET DBMR
14. TECHNOLOGIE MONDIALE DE TÉLÉDÉTECTION POUR LE MARCHÉ AGRICOLE, PROFIL DE L'ENTREPRISE
14.1 NORTHROP GRUMMAN.
14.1.1 INSTANTANÉ DE L'ENTREPRISE
14.1.2 ANALYSE DES REVENUS
14.1.3 PRÉSENCE GÉOGRAPHIQUE
14.1.4 PORTEFEUILLE DE PRODUITS
14.1.5 ÉVOLUTION RÉCENTE
14.2 SOCIÉTÉ KUGLER
14.2.1 INSTANTANÉ DE L'ENTREPRISE
14.2.2 ANALYSE DES REVENUS
14.2.3 PRÉSENCE GÉOGRAPHIQUE
14.2.4 PORTEFEUILLE DE PRODUITS
14.2.5 ÉVOLUTION RÉCENTE
14.3 ICL
14.3.1 INSTANTANÉ DE L'ENTREPRISE
14.3.2 ANALYSE DES REVENUS
14.3.3 PRÉSENCE GÉOGRAPHIQUE
14.3.4 PORTEFEUILLE DE PRODUITS
14.3.5 ÉVOLUTION RÉCENTE
14.4 HUMMINGBIRD TECHNOLOGIES LIMITÉE
14.4.1 INSTANTANÉ DE L'ENTREPRISE
14.4.2 ANALYSE DES REVENUS
14.4.3 PRÉSENCE GÉOGRAPHIQUE
14.4.4 PORTEFEUILLE DE PRODUITS
14.4.5 ÉVOLUTION RÉCENTE
14.5 SATYUKT ANALYTICS PRIVATE LIMITED
14.5.1 INSTANTANÉ DE L'ENTREPRISE
14.5.2 ANALYSE DES REVENUS
14.5.3 PRÉSENCE GÉOGRAPHIQUE
14.5.4 PORTEFEUILLE DE PRODUITS
14.5.5 ÉVOLUTION RÉCENTE
14.6 HONEYWELL INTERNATIONAL INC
14.6.1 INSTANTANÉ DE L'ENTREPRISE
14.6.2 ANALYSE DES REVENUS
14.6.3 PRÉSENCE GÉOGRAPHIQUE
14.6.4 PORTEFEUILLE DE PRODUITS
14.6.5 ÉVOLUTION RÉCENTE
14.7 FARMERS EDGE INC
14.7.1 INSTANTANÉ DE L'ENTREPRISE
14.7.2 ANALYSE DES REVENUS
14.7.3 PRÉSENCE GÉOGRAPHIQUE
14.7.4 PORTEFEUILLE DE PRODUITS
14.7.5 ÉVOLUTION RÉCENTE
14.8 AIRBUS
14.8.1 INSTANTANÉ DE L'ENTREPRISE
14.8.2 ANALYSE DES REVENUS
14.8.3 PRÉSENCE GÉOGRAPHIQUE
14.8.4 PORTEFEUILLE DE PRODUITS
14.8.5 ÉVOLUTION RÉCENTE
14.9 LEICA GEOSYSTEMS AG (PARTIE D'HEXAGON)
14.9.1 INSTANTANÉ DE L'ENTREPRISE
14.9.2 ANALYSE DES REVENUS
14.9.3 PRÉSENCE GÉOGRAPHIQUE
14.9.4 PORTEFEUILLE DE PRODUITS
14.9.5 ÉVOLUTION RÉCENTE
14.10 MAXAR TECHNOLOGIES
14.10.1 INSTANTANÉ DE L'ENTREPRISE
14.10.2 ANALYSE DES REVENUS
14.10.3 PRÉSENCE GÉOGRAPHIQUE
14.10.4 PORTEFEUILLE DE PRODUITS
14.10.5 ÉVOLUTION RÉCENTE
14.11 GROUPE SCANEX
14.11.1 INSTANTANÉ DE L'ENTREPRISE
14.11.2 ANALYSE DES REVENUS
14.11.3 PRÉSENCE GÉOGRAPHIQUE
14.11.4 PORTEFEUILLE DE PRODUITS
14.11.5 ÉVOLUTION RÉCENTE
14.12 SATELLITE IMAGING CORPORATION
14.12.1 INSTANTANÉ DE L'ENTREPRISE
14.12.2 ANALYSE DES REVENUS
14.12.3 PRÉSENCE GÉOGRAPHIQUE
14.12.4 PORTEFEUILLE DE PRODUITS
14.12.5 ÉVOLUTION RÉCENTE
14.13 PLANET LABS PBC
14.13.1 INSTANTANÉ DE L'ENTREPRISE
14.13.2 ANALYSE DES REVENUS
14.13.3 PRÉSENCE GÉOGRAPHIQUE
14.13.4 PORTEFEUILLE DE PRODUITS
14.13.5 ÉVOLUTION RÉCENTE
14.14 SKY LAND MANAGEMENT PTY LTD
14.14.1 INSTANTANÉ DE L'ENTREPRISE
14.14.2 ANALYSE DES REVENUS
14.14.3 PRÉSENCE GÉOGRAPHIQUE
14.14.4 PORTEFEUILLE DE PRODUITS
14.14.5 ÉVOLUTION RÉCENTE
14.15 SATELLITE IMAGING CORPORATION
14.15.1 INSTANTANÉ DE L'ENTREPRISE
14.15.2 ANALYSE DES REVENUS
14.15.3 PRÉSENCE GÉOGRAPHIQUE
14.15.4 PORTEFEUILLE DE PRODUITS
14.15.5 ÉVOLUTIONS RÉCENTES
14.16 ESRI AGRICULTURE
14.16.1 INSTANTANÉ DE L'ENTREPRISE
14.16.2 ANALYSE DES REVENUS
14.16.3 PRÉSENCE GÉOGRAPHIQUE
14.16.4 PORTEFEUILLE DE PRODUITS
14.16.5 ÉVOLUTIONS RÉCENTES
14.17 CORTEVA
14.17.1 INSTANTANÉ DE L'ENTREPRISE
14.17.2 ANALYSE DES REVENUS
14.17.3 PRÉSENCE GÉOGRAPHIQUE
14.17.4 PORTEFEUILLE DE PRODUITS
14.17.5 ÉVOLUTIONS RÉCENTES
14.18 SYNGENTA
14.18.1 INSTANTANÉ DE L'ENTREPRISE
14.18.2 ANALYSE DES REVENUS
14.18.3 PRÉSENCE GÉOGRAPHIQUE
14.18.4 PORTEFEUILLE DE PRODUITS
14.18.5 ÉVOLUTIONS RÉCENTES
14.19 BAYER AG
14.19.1 INSTANTANÉ DE L'ENTREPRISE
14.19.2 ANALYSE DES REVENUS
14.19.3 PRÉSENCE GÉOGRAPHIQUE
14.19.4 PORTEFEUILLE DE PRODUITS
14.19.5 ÉVOLUTIONS RÉCENTES
14.20 CARGILL, INCORPORÉE
14.20.1 INSTANTANÉ DE L'ENTREPRISE
14.20.2 ANALYSE DES REVENUS
14.20.3 PRÉSENCE GÉOGRAPHIQUE
14.20.4 PORTEFEUILLE DE PRODUITS
14.20.5 ÉVOLUTIONS RÉCENTES
14.21 SEMIOS
14.21.1 INSTANTANÉ DE L'ENTREPRISE
14.21.2 ANALYSE DES REVENUS
14.21.3 PRÉSENCE GÉOGRAPHIQUE
14.21.4 PORTEFEUILLE DE PRODUITS
14.21.5 ÉVOLUTIONS RÉCENTES
14.22 CLIMAT LLC.
14.22.1 INSTANTANÉ DE L'ENTREPRISE
14.22.2 ANALYSE DES REVENUS
14.22.3 PRÉSENCE GÉOGRAPHIQUE
14.22.4 PORTEFEUILLE DE PRODUITS
14.22.5 ÉVOLUTIONS RÉCENTES
14,23 MÈTRES
14.23.1 INSTANTANÉ DE L'ENTREPRISE
14.23.2 ANALYSE DES REVENUS
14.23.3 PRÉSENCE GÉOGRAPHIQUE
14.23.4 PORTEFEUILLE DE PRODUITS
14.23.5 ÉVOLUTIONS RÉCENTES
14.24 SENTERA
14.24.1 INSTANTANÉ DE L'ENTREPRISE
14.24.2 ANALYSE DES REVENUS
14.24.3 PRÉSENCE GÉOGRAPHIQUE
14.24.4 PORTEFEUILLE DE PRODUITS
14.24.5 ÉVOLUTIONS RÉCENTES
15. CONCLUSION
16. QUESTIONNAIRE
17. RAPPORTS CONNEXES

Méthodologie de recherche
La collecte de données et l'analyse de l'année de base sont effectuées à l'aide de modules de collecte de données avec des échantillons de grande taille. L'étape consiste à obtenir des informations sur le marché ou des données connexes via diverses sources et stratégies. Elle comprend l'examen et la planification à l'avance de toutes les données acquises dans le passé. Elle englobe également l'examen des incohérences d'informations observées dans différentes sources d'informations. Les données de marché sont analysées et estimées à l'aide de modèles statistiques et cohérents de marché. De plus, l'analyse des parts de marché et l'analyse des tendances clés sont les principaux facteurs de succès du rapport de marché. Pour en savoir plus, veuillez demander un appel d'analyste ou déposer votre demande.
La méthodologie de recherche clé utilisée par l'équipe de recherche DBMR est la triangulation des données qui implique l'exploration de données, l'analyse de l'impact des variables de données sur le marché et la validation primaire (expert du secteur). Les modèles de données incluent la grille de positionnement des fournisseurs, l'analyse de la chronologie du marché, l'aperçu et le guide du marché, la grille de positionnement des entreprises, l'analyse des brevets, l'analyse des prix, l'analyse des parts de marché des entreprises, les normes de mesure, l'analyse globale par rapport à l'analyse régionale et des parts des fournisseurs. Pour en savoir plus sur la méthodologie de recherche, envoyez une demande pour parler à nos experts du secteur.
Personnalisation disponible
Data Bridge Market Research est un leader de la recherche formative avancée. Nous sommes fiers de fournir à nos clients existants et nouveaux des données et des analyses qui correspondent à leurs objectifs. Le rapport peut être personnalisé pour inclure une analyse des tendances des prix des marques cibles, une compréhension du marché pour d'autres pays (demandez la liste des pays), des données sur les résultats des essais cliniques, une revue de la littérature, une analyse du marché des produits remis à neuf et de la base de produits. L'analyse du marché des concurrents cibles peut être analysée à partir d'une analyse basée sur la technologie jusqu'à des stratégies de portefeuille de marché. Nous pouvons ajouter autant de concurrents que vous le souhaitez, dans le format et le style de données que vous recherchez. Notre équipe d'analystes peut également vous fournir des données sous forme de fichiers Excel bruts, de tableaux croisés dynamiques (Fact book) ou peut vous aider à créer des présentations à partir des ensembles de données disponibles dans le rapport.











