Middle East and Africa Accounts Payable Automation Market, By Component (Solutions and Services), Organization Size (Large Enterprise and Small and Medium Enterprise), Process (Invoice Capture, Invoice Approval, Payment Authorization, Payment Execution, and Export), Deployment Mode (Cloud and On-Premise), Vertical (Manufacturing, Consumer Goods and Retail, Energy and Utilities, Healthcare, Banking, Financial Services, and Insurance, IT and Telecom, Government, Automotive, and Others) – Industry Trends and Forecast to 2029
Middle East and Africa Accounts Payable Automation Market Analysis and Size
Account payable is important to ensure payment of bills on a timely basis, which improves the company's credit rating. This increasing demand for account payable bill generation is due to the timely payment of invoices, ensuring an uninterrupted flow of supplies and services. Timely payment avoids overdue payments and penalties. The Middle East and Africa accounts payable automation market is growing rapidly due to AL, ML, and cloud services. The companies are even launching new software to gain a larger market share.
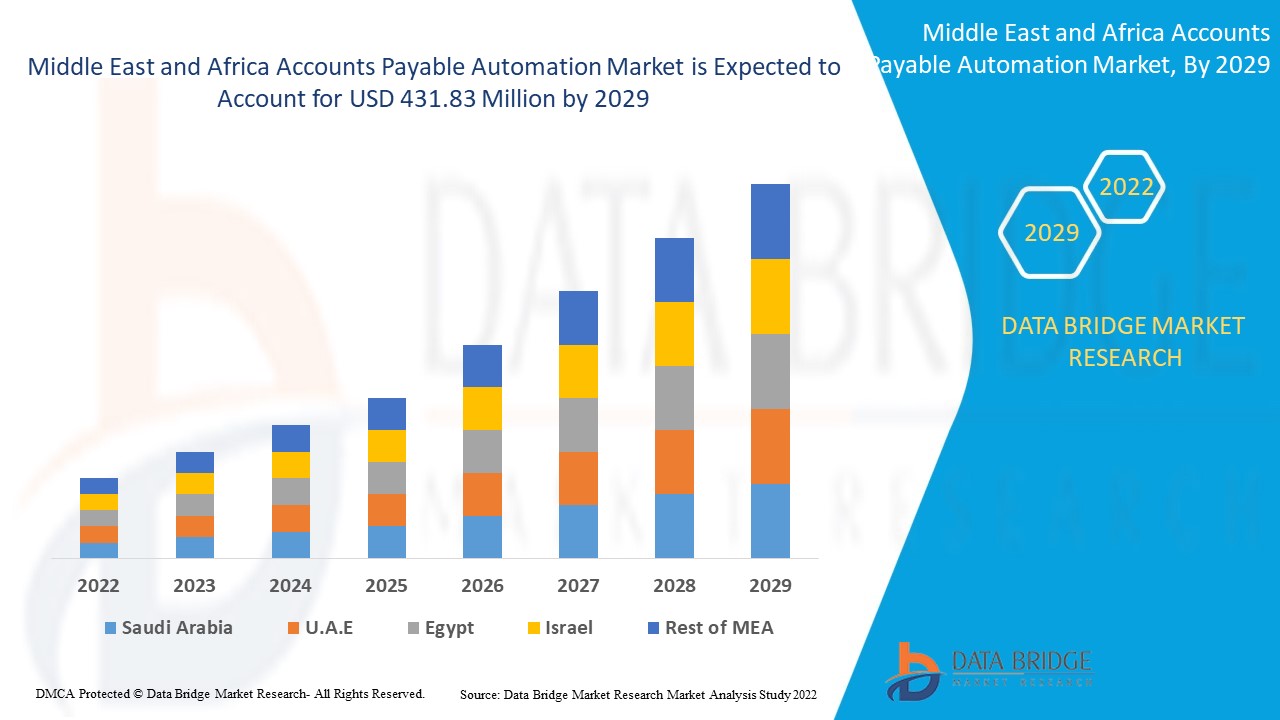
Data Bridge Market Research analyses that the accounts payable automation market are expected to reach USD 431.83 million by 2029, at a CAGR of 10.1% from 2022 to 2029. "Solutions" accounts for the most prominent modules mode segment.
|
Report Metric |
Details |
|
Forecast Period |
2022 to 2029 |
|
Base Year |
2021 |
|
Historic Years |
2020 (Customizable to 2019 - 2014) |
|
Quantitative Units |
USD Million in 2022 |
|
Segments Covered |
By Components (Solution and Services), Organization Size (Large Enterprise and Small and Medium Enterprise), Process (Invoice Capture, Invoice Approval, Payment Authorization, Payment Execution, and Export), Deployment Mode (Cloud and On-Premise), Vertical (Manufacturing, Consumer Goods and Retail, Energy and Utilities, Healthcare, Banking, Financial Services, and Insurance, IT and Telecom, Government, Automotive, and Others) |
|
Countries Covered |
UAE, Saudi Arabia, Israel, South Africa, Egypt, the Rest of the Middle East and Africa |
|
Market Players Covered |
|
Market Definition
Accounts Payable (AP) Automation is the act of processing invoices in a digital format and through a touchless process using an AP automation solution. In an ideal situation, 100% of invoices a company receives can be processed automatically without human intervention. AP automation is more than just Optical Character Recognition (OCR). It is automation across the entire AP process, from data capture using OCR or digital invoice formats (such as EDI and e-invoices) through AP workflow, such as routing, coding, reviewing, and approving invoices and automatically matching them to Purchase Orders (PO), to the seamless integration with your Enterprise Resource Planning system.
The Middle East and Africa Accounts Payable Automation Market Dynamics
This section deals with understanding the market drivers, advantages, opportunities, restraints, and challenges. All of this is discussed in detail below:
Drivers
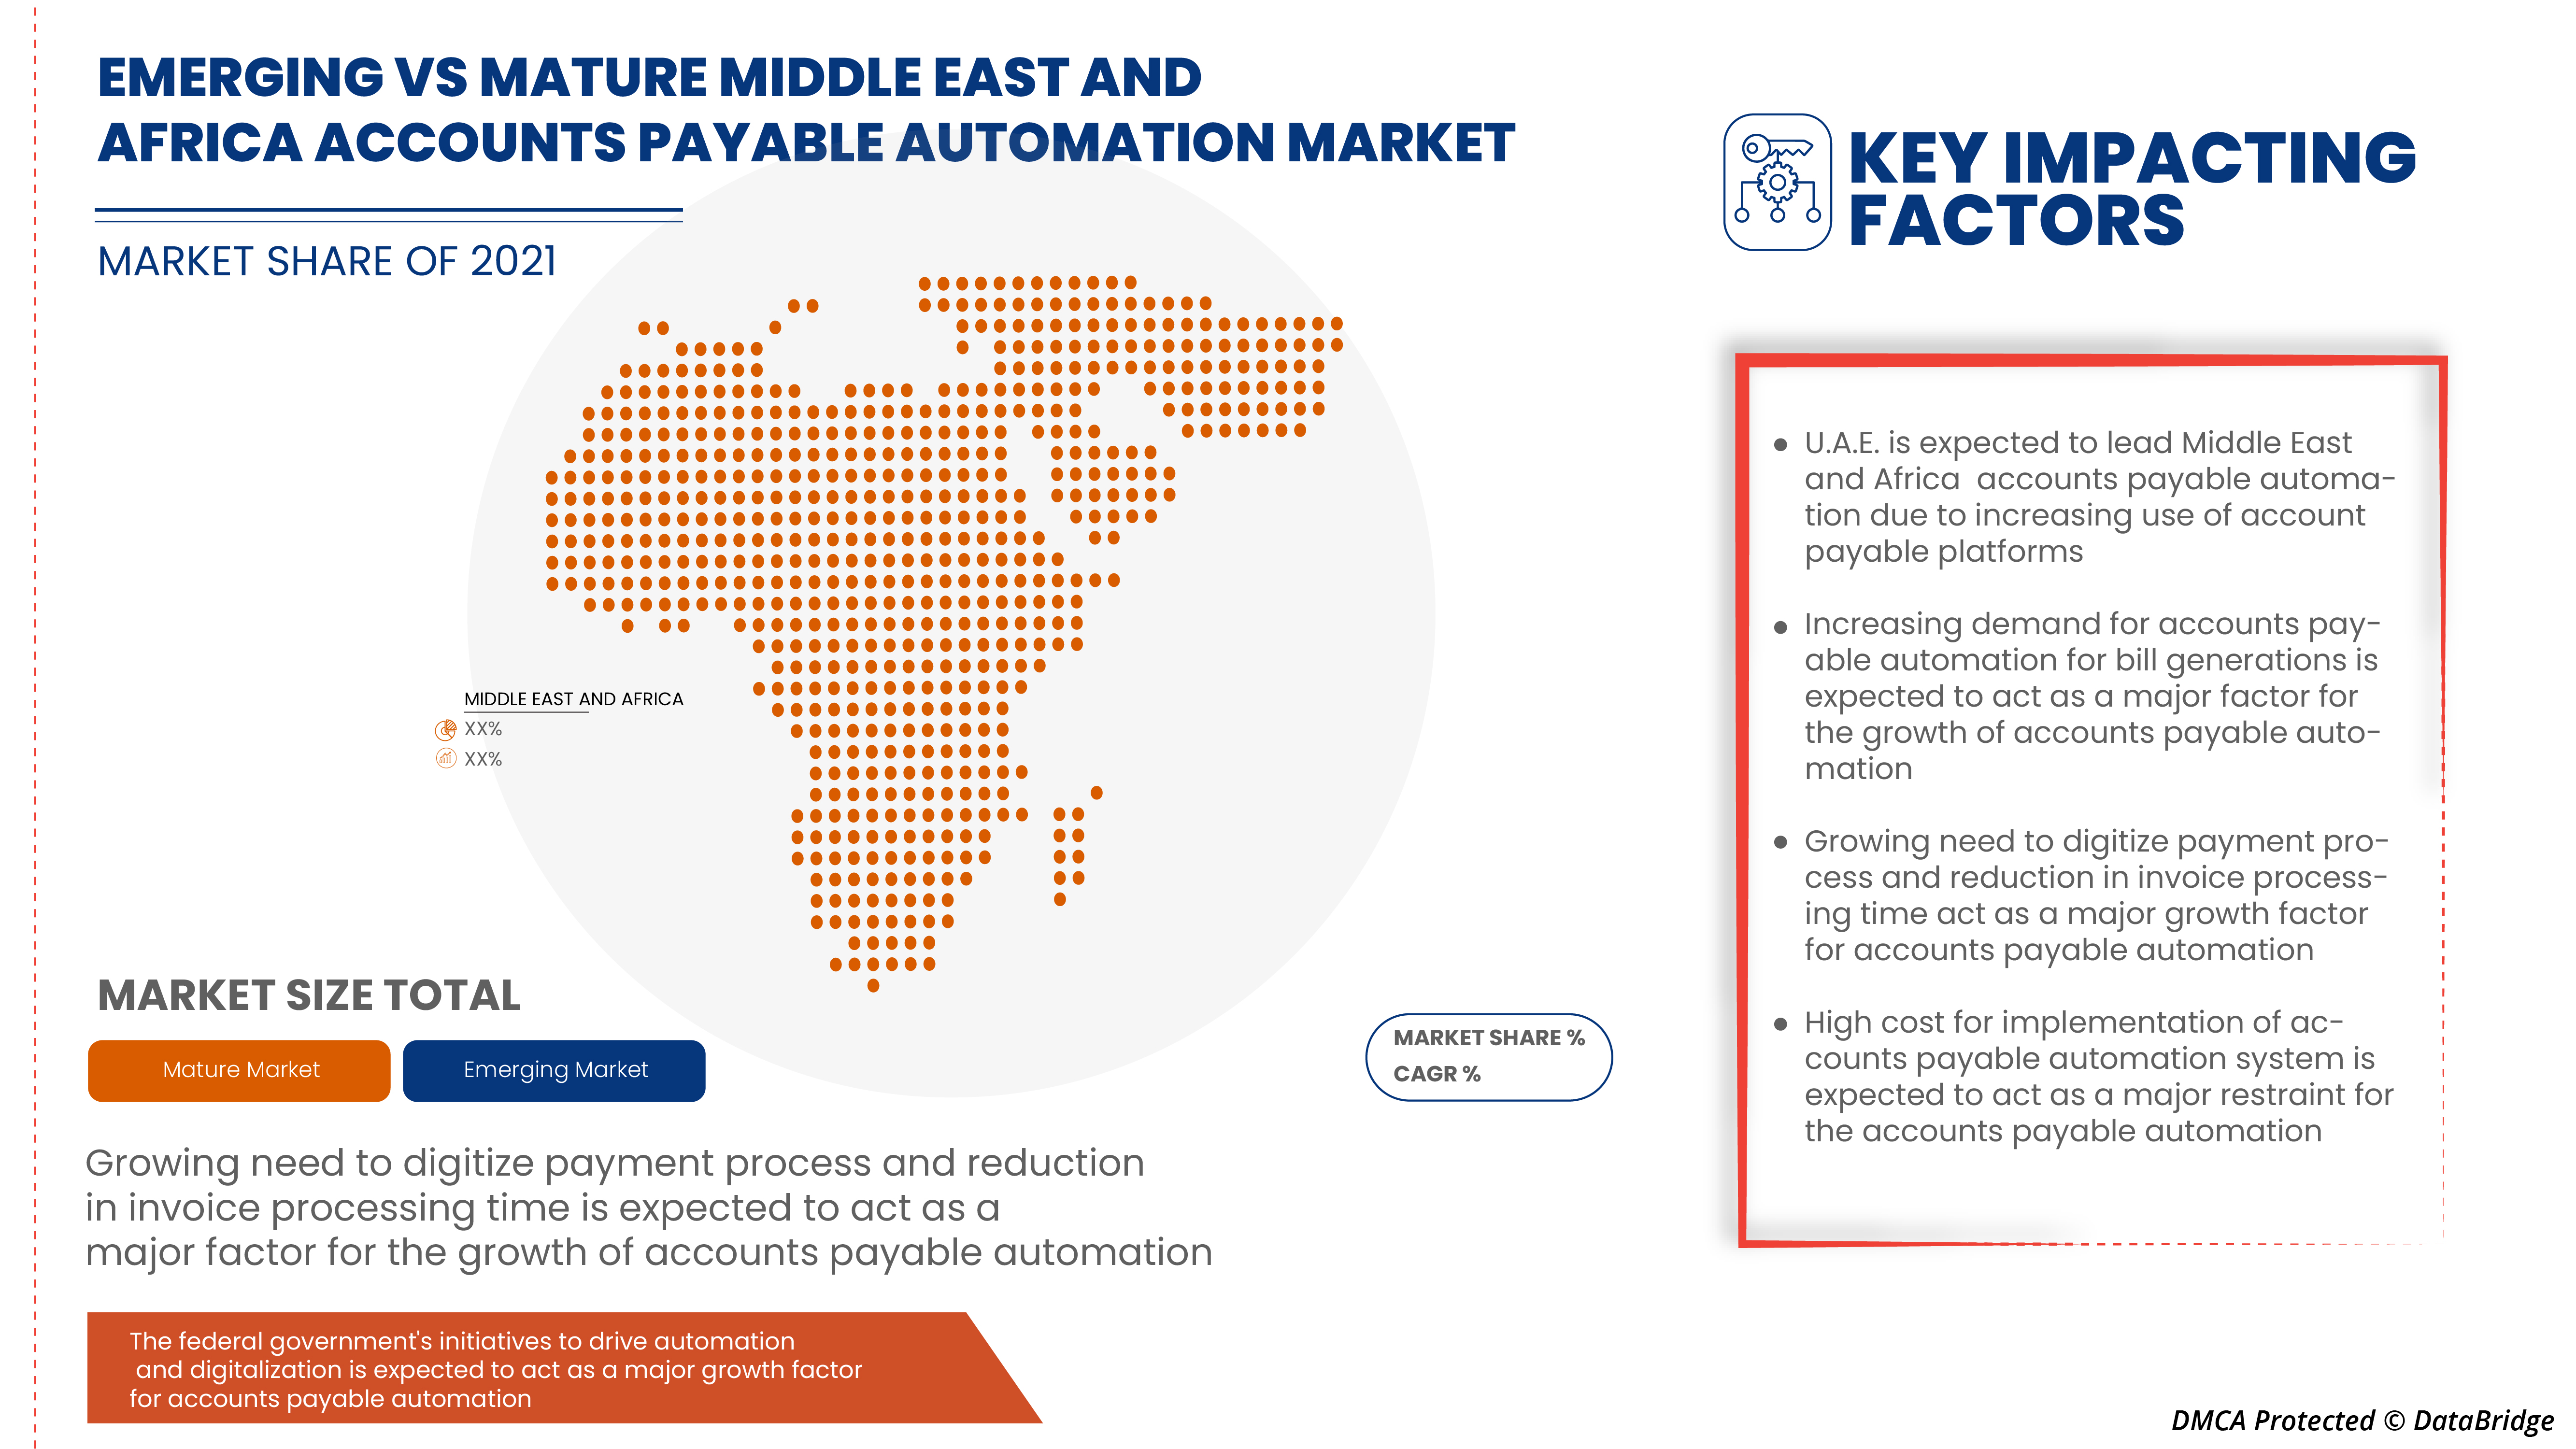
- Growth in the need to digitize the payment process and reduction in invoice processing time
The growth of digitalization is revolutionizing the interaction between customers and businesses and building a new platform for the interaction of ideas. Digitalization is the process of converting information into digital information by using various data and software. Since 2009 there has been a transformation of financial institutions towards digitalization by integrating digital technologies. Digital transformation has provided automation, better services, and efficiency to financial processes. Even the customers are inclined more towards digital platforms for the transaction of their financial assets; this has even boosted up more during this pandemic. The increasing need to digitize payment processes and reduce invoice time is thus leading to the growth of the global account payable automation market.
- Increasing demand for account payable automation for bill generation
Account payable is important to ensure payment of bills on a timely basis, which improves the company's credit rating. This increasing demand for account payable bill generation due to the timely payment of invoices ensures an uninterrupted flow of supplies and services. Timely payment avoids overdue payments, penalties, and other late fees among organizations, thus creating huge growth for the global account payable automation market.
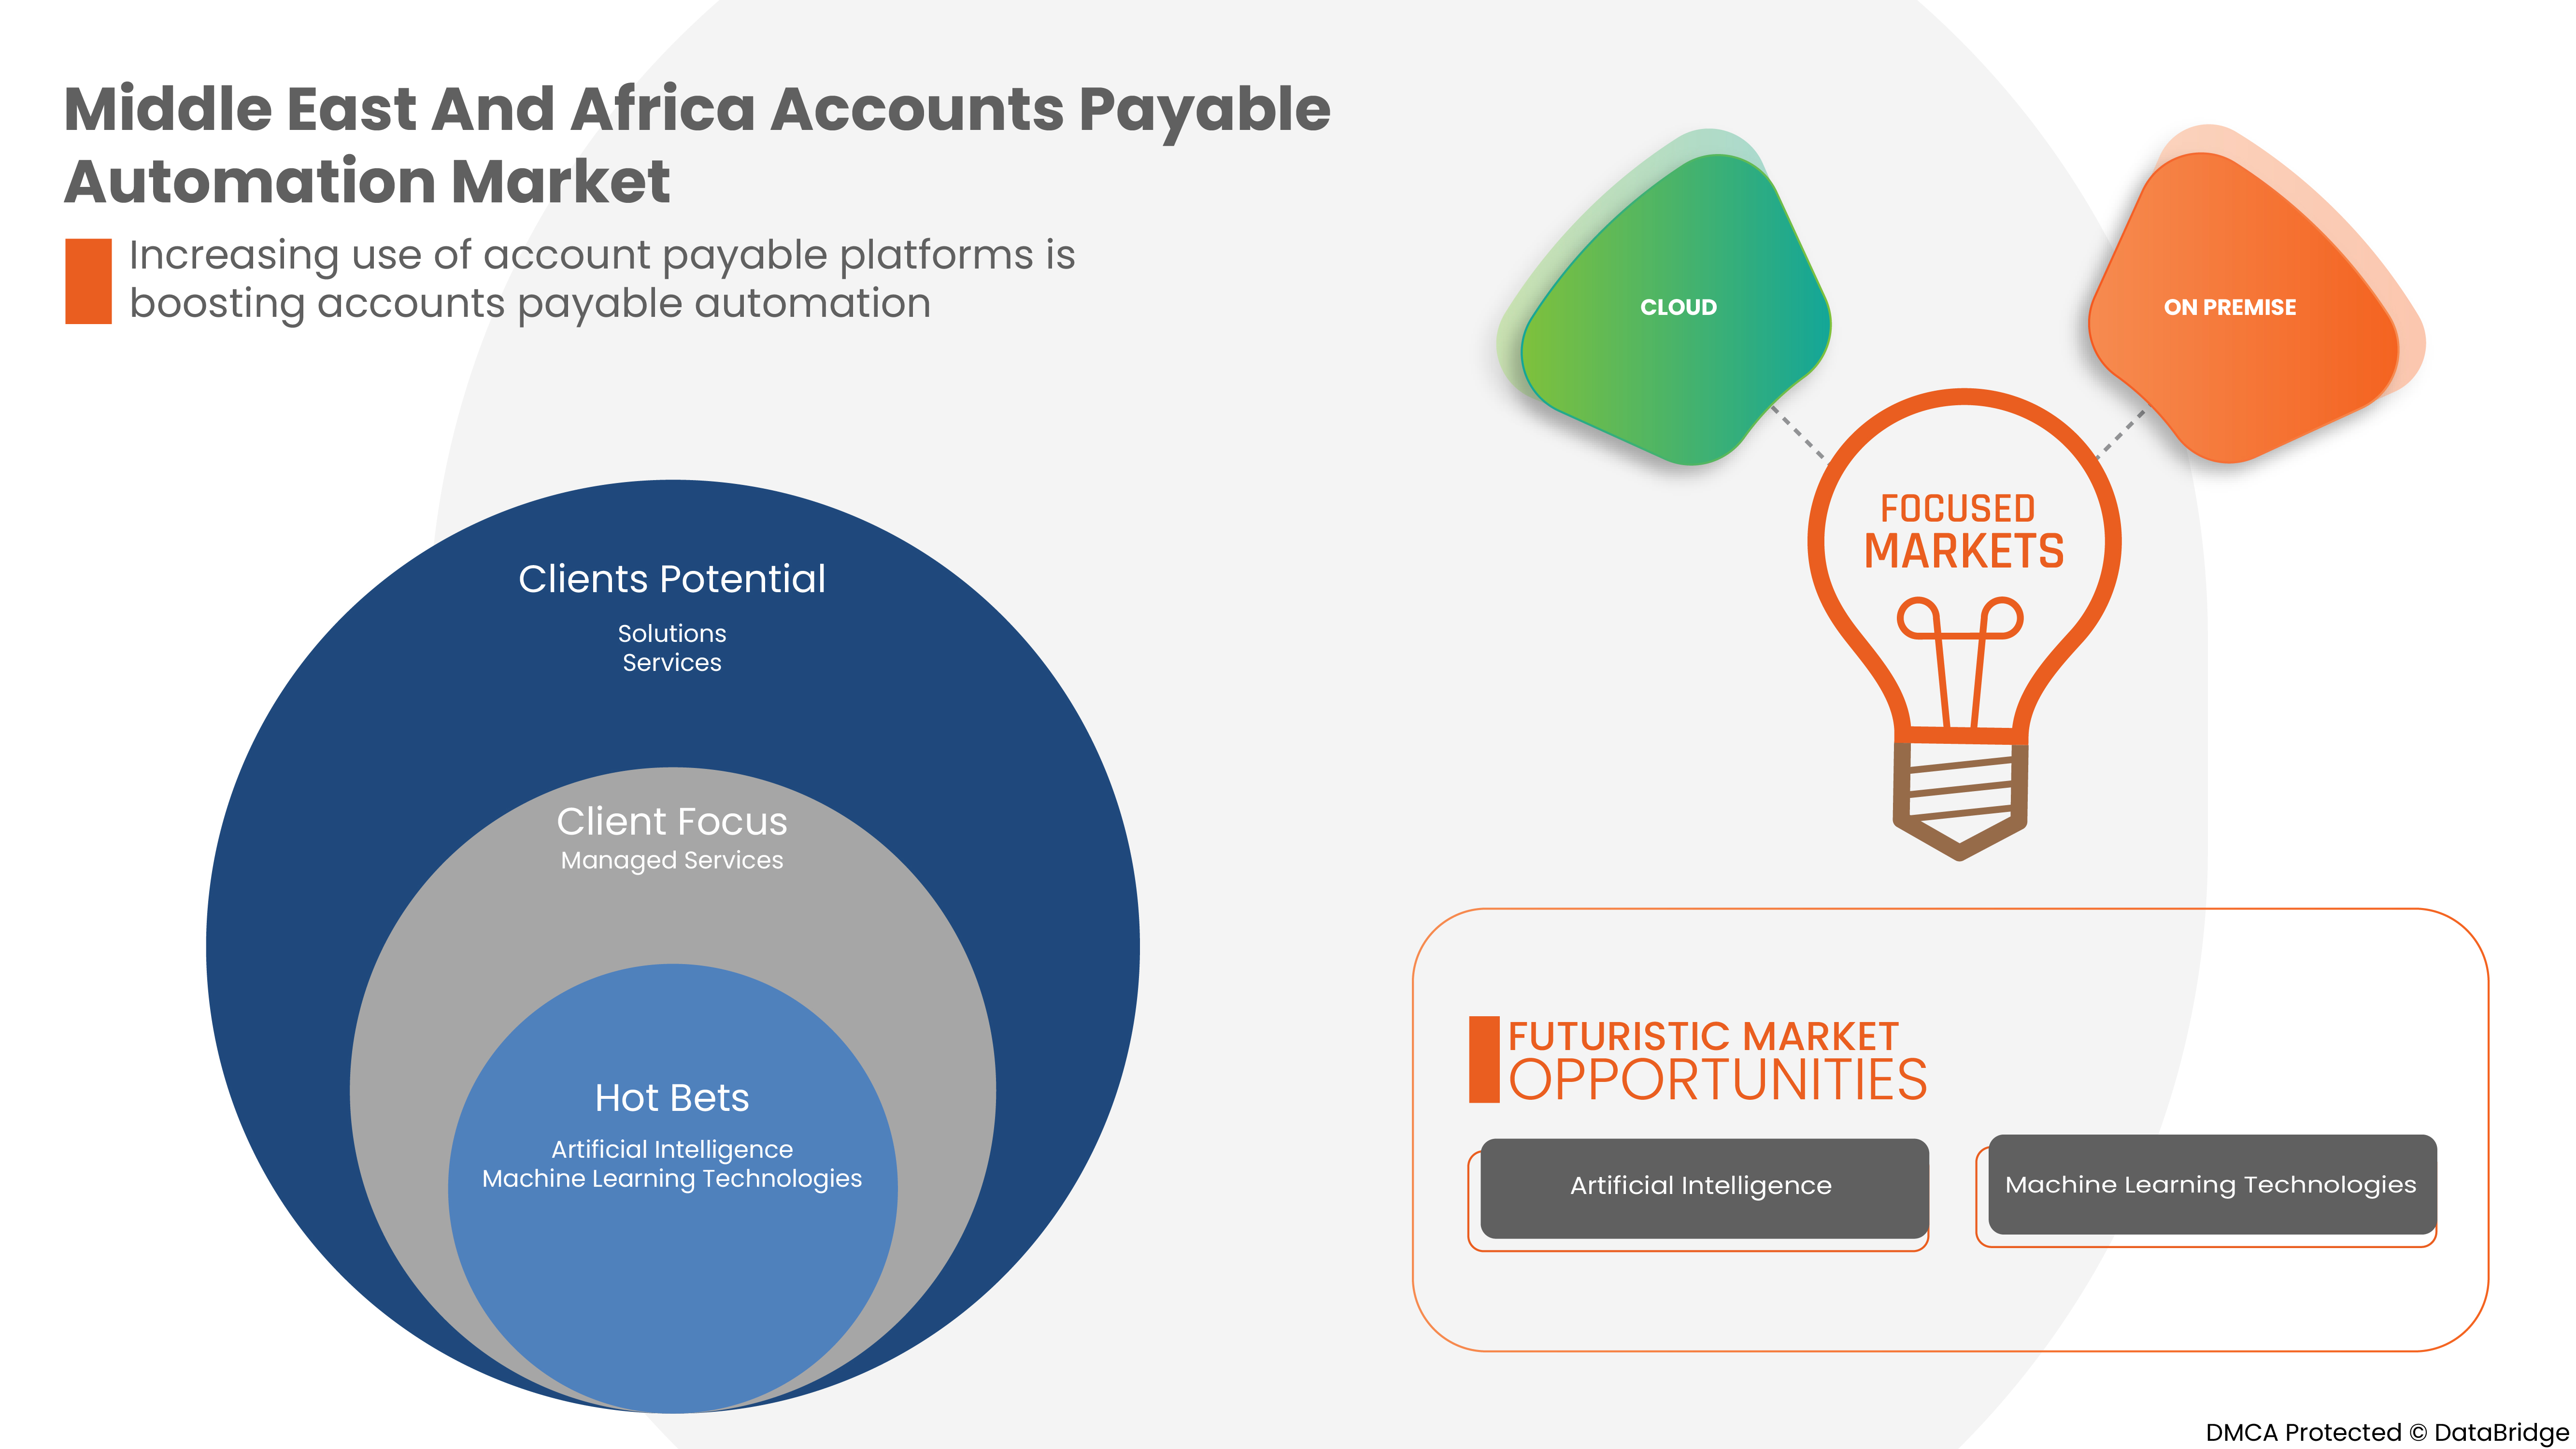
- Increase in the use of account payable platforms
Individual companies are getting more accustomed to account payable platforms for making transactions for their basic usage, such as gaining basic information, buying goods, or using it as a platform for their business.
Restraints/Challenges
- Higher cost for implementation of account payable automation systems
Generally, the cost of account payable automation depends on the specific needs and application. However, purchasing and implementing automation software in various systems for streamlining the transaction processes can seem daunting and expensive. Hence the higher cost can raise an issue in some companies, where the budget allocated for the system set up by the company remains unvaried.
- Rise in complexities of payable automation systems in large enterprises
Payable automation systems and software have been implemented across the globe to benefit from decreasing the necessity for human staff and to perform repetitive tasks by implementing automated machine processes instead. But the higher the system's complexity, the greater the risk that a system failure would seriously affect payable-related functioning. Many critical system failures, especially involving the assembly lines, would require restoring manual procedures for managing data and payment information of different clients. Although in most companies, it is found that resources are a limiting factor for development. A traditional way to manage the bills and coordinate schedules of payments to the supplier's connections manually.
Post COVID-19 Impact on Middle East and Africa Accounts Payable Automation Market
The confinement and lockdown period during the COVID-19 crisis has shown the importance of good, reliable internet connectivity in a large industry. A high-speed connection in the large industry has allowed efficient teleworking, maintaining entertainment habits, and keeping close contacts. Data traffic in all networks has increased significantly during the pandemic period. COVID-19 has increased the demand for data integration in the market. Fixed broadband networks have gained immense popularity for keeping the world connected. Traffic grew 30-40% overnight, driven primarily by working from large industries (video conferencing and collaboration, VPNs), learning from large industries (video conferencing and collaboration, e-learning platforms), and entertainment (online gaming, video streaming, social media). Moreover, limited supply and shortage of software have significantly affected data integration in the market. The flow of new equipment, such as computers, servers, switches, and Customer Premise Equipment (CPE), has either been fully stopped or delayed, with lead times of up to 12 months for different items.
Manufacturers are making various strategic decisions to bounce back post-COVID-19. The players are conducting multiple research and development activities to improve the technology involved in data integration. With this, the companies will bring advanced data integration to the market.
Recent Development
- In January 2022, SAP SE partnered with Icertis to deliver enterprise contract intelligence. The partnership took place to expand solution portfolio of contract management. The partnership will leverage the company's technology to deliver more valuable services to their customer base
- In November 2021, Oracle Corporation launched an oracle fusion ERP analytics instrument for financial insights. This solution was designed to enable data process easier. This solution was a reliable solution for large-sized and mid-sized businesses, thereby helping the company to expand its market
Middle East and Africa Accounts Payable Automation Market Scope
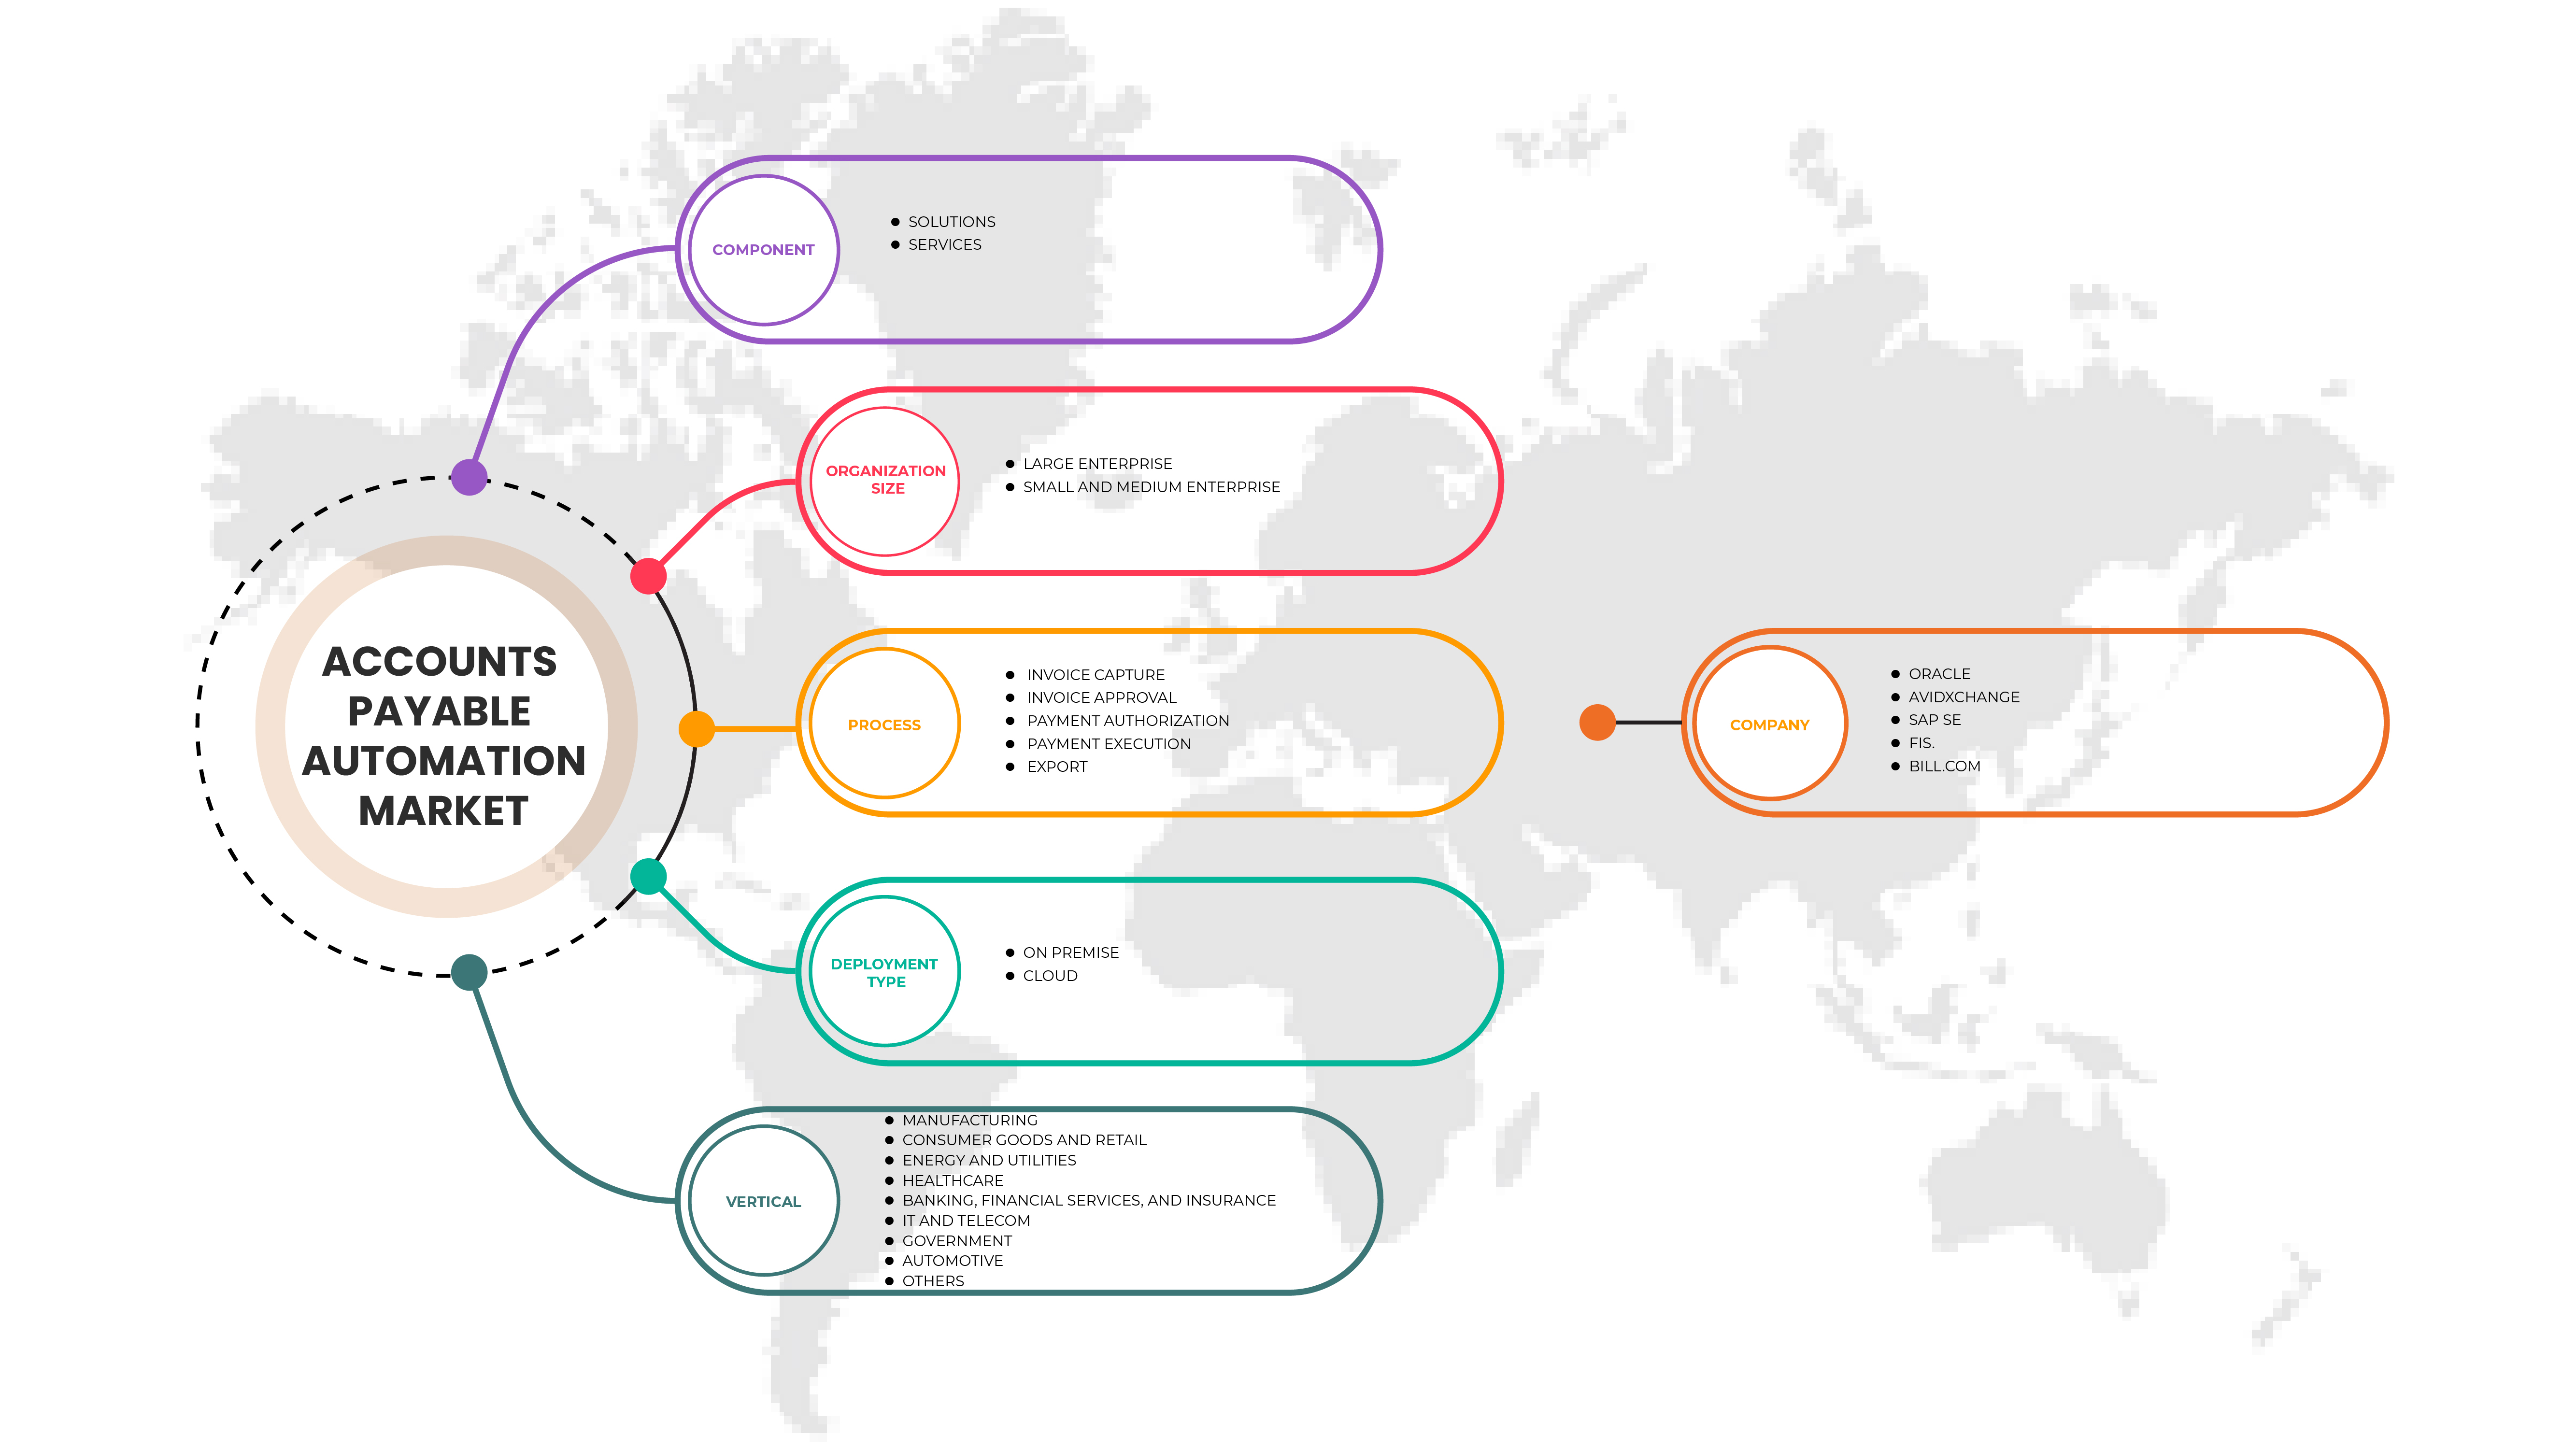
The Middle East and Africa accounts payable automation market is segmented based on components, organization size, deployment modes, vertical, and process. The growth amongst these segments will help you analyze meager growth segments in the industries and provide the users with a valuable market overview and market insights to help them make strategic decisions for identifying core market applications.
By Component
- Solutions
- Services
On the basis of component, the Middle East and Africa accounts payable automation market is segmented into solutions and services.
By Organization Size
- Large Enterprise
- Small And Medium Enterprise
On the basis of organization size, the Middle East and Africa accounts payable automation market has been segmented into large enterprise and small and medium enterprise.
By Process
- Invoice Capture,
- Invoice Approval
- Payment Authorization
- Payment Execution
- Export
On the basis of process, the Middle East and Africa account payable automation market has been segmented into invoice capture, invoice approval, payment authorization, payment execution, and export.
By Delpoyment Mode
- Cloud
- On-Premise
On the basis of deployment mode, the Middle East and Africa accounts payable automation market has been segmented into cloud and on-premise.
By Vertical
- Manufacturing
- Consumer Goods And Retail
- Energy and Utilities
- Healthcare
- Banking, Financial Services
- Insurance
- IT and Telecom
- Government
- Automotive
- Others
On the basis of vertical, the Middle East and Africa accounts payable automation market has been segmented into manufacturing, consumer goods and retail, energy and utilities, healthcare, banking, financial services and insurance, IT and telecom, government, automotive, and others.
Middle East and Africa Accounts Payable Automation Market Regional Analysis/Insights
The Middle East and Africa accounts payable automation market is analyzed. As referenced above, market size insights and trends are provided by country, organization size, deployment mode, component, vertical, and process, as referenced above.
The countries covered in the Middle East and Africa accounts payable automation market report are UAE, Saudi Arabia, Israel, South Africa, Egypt, and the Rest of Middle East and Africa.
UAE is expected to dominate the Middle East and Africa accounts payable automation market as the country is witnessing increasing Hybrid automation has been in use lately due to its ability to connect applications, data files, and business partners across cloud and on-premises systems and also accounts payable automation compliance program is a set of regulations or rules that a financial institution, companies such as large enterprises, small enterprises, and medium enterprises must follow to prevent data loss and the growth of the country in the Middle East and Africa accounts payable automation market.
The country section of the report also provides individual market-impacting factors and market regulation changes that impact the market's current and future trends. Data points like downstream and upstream value chain analysis, technical trends, porter's five forces analysis, and case studies are some of the pointers used to forecast the market scenario for individual countries. Also, the presence and availability of Global brands and their challenges faced due to large or scarce competition from local and domestic brands, the impact of domestic tariffs, and trade routes are considered while providing forecast analysis of the country data.
Competitive Landscape and Middle East and Africa Accounts Payable Automation Market Share Analysis
The Middle East and Africa accounts payable automation market competitive landscape provides details by competitors. Details include company overview, company financials, revenue generated, market potential, investment in research and development, new market initiatives, Global presence, production sites and facilities, production capacities, company strengths and weaknesses, product launch, product width and breadth, and application dominance. The above data points provided are only related to the companies' focus related to Middle East and Africa accounts payable automation market.
Some of the major players operating in the Middle East and Africa accounts payable automation market are:
- Oracle Corporation
- AvidXchange
- SAP SE
- FIS.
- FLEETCOR TECHNOLOGIES, INC.
- Kofax Inc.
- Coupa Software Inc.
- FreshBooks
- Zycus Inc.
- Comarch SA.
- Zoho Corporation Pvt. Ltd.
- Bottomline Technologies, Inc.
SKU-
Accédez en ligne au rapport sur le premier cloud mondial de veille économique

- Tableau de bord d'analyse de données interactif
- Tableau de bord d'analyse d'entreprise pour les opportunités à fort potentiel de croissance
- Accès d'analyste de recherche pour la personnalisation et les requêtes
- Analyse de la concurrence avec tableau de bord interactif
- Dernières actualités, mises à jour et analyse des tendances
- Exploitez la puissance de l'analyse comparative pour un suivi complet de la concurrence
Table des matières
1 INTRODUCTION
1.1 OBJECTIFS DE L'ÉTUDE
1.2 DÉFINITION DU MARCHÉ
1.3 APERÇU DU MARCHÉ DE L'AUTOMATISATION DES COMPTES FOURNISSEURS AU MOYEN-ORIENT ET EN AFRIQUE
1.4 MONNAIE ET TARIFS
1.5 LIMITATIONS
1.6 MARCHÉS COUVERTS
2 SEGMENTATION DU MARCHÉ
2.1 MARCHÉS COUVERTS
2,2 ANS CONSIDÉRÉS POUR L'ÉTUDE
2.3 PORTÉE GÉOGRAPHIQUE
2.4 MODÈLE DE VALIDATION DES DONNÉES DU TRÉPIED DBMR
2.5 ENTRETIENS PRIMAIRES AVEC DES LEADERS D'OPINION CLÉS
2.6 GRILLE DE POSITIONNEMENT DU MARCHÉ DBMR
2.7 ANALYSE DES PARTS DES FOURNISSEURS
2.8 GRILLE DE COUVERTURE VERTICALE DU MARCHÉ
2.9 MODÉLISATION MULTIVARIÉE
2.1 COURBE DES COMPOSANTES
2.11 MATRICE DE DÉFIS
2.12 SOURCES SECONDAIRES
2.13 HYPOTHÈSES
3 RÉSUMÉ EXÉCUTIF
4 INFORMATIONS PREMIUM
5 RÉSUMÉ RÉGIONAL : MARCHÉ DE L'AUTOMATISATION DES COMPTES FOURNISSEURS AU MOYEN-ORIENT ET EN AFRIQUE
6 ANALYSE DBMR
6.1 FORCE :
6.2 MENACE :
6.3 OPPORTUNITÉ :
6.4 FAIBLESSE :
7 APERÇU DU MARCHÉ
7.1 PILOTES
7.1.1 CROISSANCE DU BESOIN DE NUMÉRISATION DU PROCESSUS DE PAIEMENT ET RÉDUCTION DU TEMPS DE TRAITEMENT DES FACTURES
7.1.2 DEMANDE ACCRUE D'AUTOMATISATION DES COMPTES FOURNISSEURS POUR LA GÉNÉRATION DE FACTURES
7.1.3 AUGMENTATION DE L'UTILISATION DES PLATEFORMES DE COMPTES FOURNISSEURS
7.2 RESTRICTIONS
7.2.1 COÛT PLUS ÉLEVÉ DE MISE EN ŒUVRE DE SYSTÈMES D'AUTOMATISATION DES COMPTES FOURNISSEURS
7.2.2 AUGMENTATION DE LA COMPLEXITÉ DES SYSTÈMES D'AUTOMATISATION DES PAIEMENTS DANS LES GRANDES ENTREPRISES
7.3 OPPORTUNITÉS
7.3.1 EMERGENCE OF AI, ML, AND RPA TECHNOLOGY TO HANDLE REPETITIVE AND LABOR-INTENSIVE TASK
7.3.2 ARTIFICIAL INTELLIGENCE (AI) AND MACHINE LEARNING (ML) APPLICATIONS
7.3.3 ROBOTIC PROCESS AUTOMATION (RPA)
7.3.4 ADOPTION OF CLOUD-BASED AUTOMATION PAYABLE SOLUTIONS
7.3.5 GOVERNMENT INITIATIVES TO DRIVE AUTOMATION AND DIGITALIZATION
7.4 CHALLENGES
7.4.1 INTEROPERABILITY OF MULTIPLE SYSTEM COMPONENTS FROM DIFFERENT SOLUTION PROVIDERS
7.4.2 LESS AWARENESS AMONG ORGANIZATIONS ABOUT THE VIRTUES OF AP AUTOMATION
8 MIDDLE EAST & AFRICA ACCOUNTS PAYABLE AUTOMATION MARKET, BY COMPONENT
8.1 OVERVIEW
8.2 SOLUTIONS
8.3 SERVICES
8.3.1 MANAGED SERVICES
8.3.2 IMPLEMENTATION AND INTEGRATION
8.3.3 PROFESSIONAL SERVICES
8.3.4 SUPPORT AND MAINTENANCE
8.3.5 ADVISORY
9 MIDDLE EAST & AFRICA ACCOUNTS PAYABLE AUTOMATION MARKET, BY ORGANIZATION SIZE
9.1 OVERVIEW
9.2 LARGE ENTERPRISE
9.3 SMALL AND MEDIUM ENTERPRISE
10 MIDDLE EAST & AFRICA ACCOUNTS PAYABLE AUTOMATION MARKET, BY PROCESS
10.1 OVERVIEW
10.2 INVOICE CAPTURE
10.2.1 OPTICAL CHARACTER RECOGNITION (OCR)
10.2.2 COMPUTER VISION
10.2.3 INTELLIGENT DOCUMENT PROCESSING (IDP)
10.2.4 OTHERS
10.3 INVOICE APPROVAL
10.4 PAYMENT AUTHORIZATION
10.5 PAYMENT EXECUTION
10.6 EXPORT
11 MIDDLE EAST & AFRICA ACCOUNTS PAYABLE AUTOMATION MARKET, BY DEPLOYMENT TYPE
11.1 OVERVIEW
11.2 ON PREMISE
11.3 CLOUD
11.3.1 PUBLIC
11.3.2 PRIVATE
12 MIDDLE EAST & AFRICA ACCOUNTS PAYABLE AUTOMATION MARKET, BY VERTICAL
12.1 OVERVIEW
12.2 MANUFACTURING
12.3 CONSUMER GOODS AND RETAIL
12.4 ENERGY AND UTILITIES
12.5 HEALTHCARE
12.6 BANKING, FINANCIAL SERVICES, AND INSURANCE
12.7 IT AND TELECOM
12.8 GOVERNMENT
12.9 AUTOMOTIVE
12.1 OTHERS
13 MIDDLE EAST & AFRICA ACCOUNTS PAYABLE AUTOMATION MARKET, BY REGION
13.1 MIDDLE EAST AND AFRICA
13.1.1 U.A.E.
13.1.2 SOUTH AFRICA
13.1.3 SAUDI ARABIA
13.1.4 ISRAEL
13.1.5 EGYPT
13.1.6 REST OF MIDDLE EAST AND AFRICA
14 MIDDLE EAST & AFRICA ACCOUNTS PAYABLE AUTOMATION MARKET, COMPANY LANDSCAPE
14.1 COMPANY SHARE ANALYSIS: MIDDLE EAST & AFRICA
15 SWOT ANALYSIS
16 COMPANY PROFILE
16.1 ORACLE
16.1.1 COMPANY SNAPSHOT
16.1.2 REVENUE ANALYSIS
16.1.3 COMPANY SHARE ANALYSIS
16.1.4 PRODUCT PORTFOLIO
16.1.5 RECENT DEVELOPMENTS
16.2 AVIDXCHANGE
16.2.1 COMPANY SNAPSHOT
16.2.2 REVENUE ANALYSIS
16.2.3 PRODUCT PORTFOLIO
16.2.4 RECENT DEVELOPMENT
16.3 SAP SE
16.3.1 COMPANY SNAPSHOT
16.3.2 REVENUE ANALYSIS
16.3.3 COMPANY SHARE ANALYSIS
16.3.4 PRODUCT PORTFOLIO
16.3.5 RECENT DEVELOPMENTS
16.4 FIS.
16.4.1 COMPANY SNAPSHOT
16.4.2 REVENUE ANALYSIS
16.4.3 COMPANY SHARE ANALYSIS
16.4.4 SOLUTION PORTFOLIO
16.4.5 RECENT DEVELOPMENTS
16.5 BILL.COM
16.5.1 COMPANY SNAPSHOT
16.5.2 REVENUE ANALYSIS
16.5.3 COMPANY SHARE ANALYSIS
16.5.4 PRODUCT PORTFOLIO
16.5.5 RECENT DEVELOPMENT
16.6 AIRBASE INC.
16.6.1 COMPANY SNAPSHOT
16.6.2 PRODUCT PORTFOLIO
16.6.3 RECENT DEVELOPMENT
16.7 BOTTOMLINE TECHNOLOGIES, INC.
16.7.1 COMPANY SNAPSHOT
16.7.2 REVENUE ANALYSIS
16.7.3 PRODUCT PORTFOLIO
16.7.4 RECENT DEVELOPMENT
16.8 COMARCH SA.
16.8.1 COMPANY SNAPSHOT
16.8.2 REVENUE ANALYSIS
16.8.3 SOLUTION & PRODUCT PORTFOLIO
16.8.4 ÉVOLUTION RÉCENTE
16.9 COUPA SOFTWARE INC.
16.9.1 INSTANTANÉ DE L'ENTREPRISE
16.9.2 ANALYSE DES REVENUS
16.9.3 PORTEFEUILLE DE SOLUTIONS ET DE PRODUITS
16.9.4 ÉVOLUTION RÉCENTE
16.1 FINANCIALFORCE
16.10.1 INSTANTANÉ DE L'ENTREPRISE
16.10.2 PORTEFEUILLE DE PRODUITS
16.10.3 ÉVOLUTIONS RÉCENTES
16.11 FLEETCOR TECHNOLOGIES, INC.
16.11.1 INSTANTANÉ DE L'ENTREPRISE
16.11.2 ANALYSE DES REVENUS
16.11.3 PORTEFEUILLE DE PRODUITS
16.11.4 ÉVOLUTION RÉCENTE
16.12 FRESHBOOKS
16.12.1 INSTANTANÉ DE L'ENTREPRISE
16.12.2 PORTEFEUILLE DE PRODUITS
16.12.3 ÉVOLUTION RÉCENTE
16.13 KOFAX INC.
16.13.1 INSTANTANÉ DE L'ENTREPRISE
16.13.2 PORTEFEUILLE DE PRODUITS
16.13.3 ÉVOLUTIONS RÉCENTES
16.14 MINERALTREE
16.14.1 INSTANTANÉ DE L'ENTREPRISE
16.14.2 PORTEFEUILLE DE PRODUITS
16.14.3 ÉVOLUTIONS RÉCENTES
16h15 AUTOMATISATION MHC
16.15.1 INSTANTANÉ DE L'ENTREPRISE
16.15.2 PORTEFEUILLE DE PRODUITS
16.15.3 ÉVOLUTIONS RÉCENTES
16.16 PROCURIFY TECHNOLOGIES INC.
16.16.1 INSTANTANÉ DE L'ENTREPRISE
16.16.2 PORTEFEUILLE DE PRODUITS
16.16.3 ÉVOLUTION RÉCENTE
16.17 SAGE GROUP PLC
16.17.1 INSTANTANÉ DE L'ENTREPRISE
16.17.2 ANALYSE DES REVENUS
16.17.3 PORTEFEUILLE DE SOLUTIONS
16.17.4 ÉVOLUTIONS RÉCENTES
16.18 TIPALTI INC.
16.18.1 INSTANTANÉ DE L'ENTREPRISE
16.18.2 PORTEFEUILLE DE SOLUTIONS
16.18.3 ÉVOLUTIONS RÉCENTES
16.19 ZOHO CORPORATION PVT. LTD.
16.19.1 INSTANTANÉ DE L'ENTREPRISE
16.19.2 PORTEFEUILLE DE PRODUITS
16.19.3 ÉVOLUTIONS RÉCENTES
16.2 ZYCUS INC.
16.20.1 INSTANTANÉ DE L'ENTREPRISE
16.20.2 PORTEFEUILLE DE SOLUTIONS
16.20.3 ÉVOLUTIONS RÉCENTES
17 QUESTIONNAIRE
18 RAPPORTS CONNEXES
Liste des tableaux
TABLEAU 1 MARCHÉ DE L'AUTOMATISATION DES COMPTES FOURNISSEURS AU MOYEN-ORIENT ET EN AFRIQUE, PAR COMPOSANTE, 2020-2029 (EN MILLIONS USD)
TABLEAU 2 SOLUTIONS DU MOYEN-ORIENT ET DE L'AFRIQUE SUR LE MARCHÉ DE L'AUTOMATISATION DES COMPTES FOURNISSEURS, PAR RÉGION, 2020-2029 (EN MILLIONS USD)
TABLEAU 3 SERVICES DU MOYEN-ORIENT ET DE L'AFRIQUE SUR LE MARCHÉ DE L'AUTOMATISATION DES COMPTES FOURNISSEURS, PAR RÉGION, 2020-2029 (EN MILLIONS USD)
TABLEAU 4 SERVICES AU MOYEN-ORIENT ET EN AFRIQUE SUR LE MARCHÉ DE L'AUTOMATISATION DES COMPTES FOURNISSEURS, PAR TYPE, 2020-2029 (EN MILLIONS USD)
TABLEAU 5 MARCHÉ DE L'AUTOMATISATION DES COMPTES FOURNISSEURS AU MOYEN-ORIENT ET EN AFRIQUE, PAR TAILLE D'ORGANISATION, 2020-2029 (EN MILLIONS USD)
TABLEAU 6 GRANDES ENTREPRISES DU MOYEN-ORIENT ET D'AFRIQUE SUR LE MARCHÉ DE L'AUTOMATISATION DES COMPTES FOURNISSEURS, PAR RÉGION, 2020-2029 (EN MILLIONS USD)
TABLEAU 7 PETITES ET MOYENNES ENTREPRISES AU MOYEN-ORIENT ET EN AFRIQUE SUR LE MARCHÉ DE L'AUTOMATISATION DES COMPTES FOURNISSEURS, PAR RÉGION, 2020-2029 (EN MILLIONS USD)
TABLEAU 8 MARCHÉ DE L'AUTOMATISATION DES COMPTES FOURNISSEURS AU MOYEN-ORIENT ET EN AFRIQUE, PAR PROCESSUS, 2020-2029 (EN MILLIONS USD)
TABLEAU 9 CAPTURE DE FACTURES AU MOYEN-ORIENT ET EN AFRIQUE SUR LE MARCHÉ DE L'AUTOMATISATION DES COMPTES FOURNISSEURS, PAR RÉGION, 2020-2029 (EN MILLIONS USD)
TABLEAU 10 CAPTURE DE FACTURES AU MOYEN-ORIENT ET EN AFRIQUE SUR LE MARCHÉ DE L'AUTOMATISATION DES COMPTES FOURNISSEURS, PAR MÉTHODE, 2020-2029 (EN MILLIONS USD)
TABLEAU 11 APPROBATION DES FACTURES AU MOYEN-ORIENT ET EN AFRIQUE SUR LE MARCHÉ DE L'AUTOMATISATION DES COMPTES FOURNISSEURS, PAR RÉGION, 2020-2029 (EN MILLIONS USD)
TABLEAU 12 AUTORISATION DE PAIEMENT AU MOYEN-ORIENT ET EN AFRIQUE SUR LE MARCHÉ DE L'AUTOMATISATION DES COMPTES FOURNISSEURS, PAR RÉGION, 2020-2029 (EN MILLIONS USD)
TABLEAU 13 EXÉCUTION DES PAIEMENTS AU MOYEN-ORIENT ET EN AFRIQUE SUR LE MARCHÉ DE L'AUTOMATISATION DES COMPTES FOURNISSEURS, PAR RÉGION, 2020-2029 (EN MILLIONS USD)
TABLEAU 14 EXPORTATIONS DU MOYEN-ORIENT ET DE L'AFRIQUE SUR LE MARCHÉ DE L'AUTOMATISATION DES COMPTES FOURNISSEURS, PAR RÉGION, 2020-2029 (EN MILLIONS USD)
TABLEAU 15 MARCHÉ DE L'AUTOMATISATION DES COMPTES FOURNISSEURS AU MOYEN-ORIENT ET EN AFRIQUE, PAR TYPE DE DÉPLOIEMENT, 2020-2029 (EN MILLIONS USD)
TABLEAU 16 MOYEN-ORIENT ET AFRIQUE MARCHÉ DE L'AUTOMATISATION DES COMPTES FOURNISSEURS SUR SITE, PAR RÉGION, 2020-2029 (EN MILLIONS USD)
TABLEAU 17 NUAGE AU MOYEN-ORIENT ET EN AFRIQUE SUR LE MARCHÉ DE L'AUTOMATISATION DES COMPTES FOURNISSEURS, PAR RÉGION, 2020-2029 (EN MILLIONS USD)
TABLEAU 18 NUAGE AU MOYEN-ORIENT ET EN AFRIQUE SUR LE MARCHÉ DE L'AUTOMATISATION DES COMPTES FOURNISSEURS, PAR TYPE, 2020-2029 (EN MILLIONS USD)
TABLEAU 19 MARCHÉ DE L'AUTOMATISATION DES COMPTES FOURNISSEURS AU MOYEN-ORIENT ET EN AFRIQUE, PAR SECTEUR VERTICAL, 2020-2029 (EN MILLIONS USD)
TABLEAU 20 MARCHÉ DE L'AUTOMATISATION DES COMPTES FOURNISSEURS AU MOYEN-ORIENT ET EN AFRIQUE, PAR RÉGION, 2020-2029 (EN MILLIONS USD)
TABLEAU 21 MARCHÉ DE L'AUTOMATISATION DES COMPTES FOURNISSEURS ET DES BIENS DE CONSOMMATION AU MOYEN-ORIENT ET EN AFRIQUE, PAR RÉGION, 2020-2029 (EN MILLIONS USD)
TABLEAU 22 ÉNERGIE ET SERVICES PUBLICS AU MOYEN-ORIENT ET EN AFRIQUE SUR LE MARCHÉ DE L'AUTOMATISATION DES COMPTES FOURNISSEURS, PAR RÉGION, 2020-2029 (EN MILLIONS USD)
TABLEAU 23 MARCHÉ DE L'AUTOMATISATION DES COMPTES FOURNISSEURS AU MOYEN-ORIENT ET EN AFRIQUE, PAR RÉGION, 2020-2029 (EN MILLIONS USD)
TABLEAU 24 MARCHÉ DE L'AUTOMATISATION DES COMPTES FOURNISSEURS AU MOYEN-ORIENT ET EN AFRIQUE, 2020-2029 (EN MILLIONS USD)
TABLEAU 25 MOYEN-ORIENT ET AFRIQUE : MARCHÉ DE L'AUTOMATISATION DES COMPTES FOURNISSEURS DANS LES TIC ET LES TÉLÉCOMMUNICATIONS, PAR RÉGION, 2020-2029 (EN MILLIONS USD)
TABLE 26 MIDDLE EAST & AFRICA GOVERNMENT IN ACCOUNTS PAYABLE AUTOMATION MARKET, BY REGION, 2020-2029 (USD MILLION)
TABLE 27 MIDDLE EAST & AFRICA AUTOMOTIVE IN ACCOUNTS PAYABLE AUTOMATION MARKET, BY REGION, 2020-2029 (USD MILLION)
TABLE 28 MIDDLE EAST & AFRICA OTHERS IN ACCOUNTS PAYABLE AUTOMATION MARKET, BY REGION, 2020-2029 (USD MILLION)
TABLE 29 MIDDLE EAST AND AFRICA ACCOUNTS PAYABLE AUTOMATION MARKET, BY COUNTRY, 2020-2029 (USD MILLION)
TABLE 30 MIDDLE EAST AND AFRICA ACCOUNTS PAYABLE AUTOMATION MARKET, BY COMPONENT, 2020-2029 (USD MILLION)
TABLE 31 MIDDLE EAST AND AFRICA SERVICES IN ACCOUNTS PAYABLE AUTOMATION MARKET, BY TYPE, 2020-2029 (USD MILLION)
TABLE 32 MIDDLE EAST AND AFRICA ACCOUNTS PAYABLE AUTOMATION MARKET, BY ORGANIZATION SIZE, 2020-2029 (USD MILLION)
TABLE 33 MIDDLE EAST AND AFRICA ACCOUNTS PAYABLE AUTOMATION MARKET, BY PROCESS, 2020-2029 (USD MILLION)
TABLE 34 MIDDLE EAST AND AFRICA INVOICE CAPTURE IN ACCOUNTS PAYABLE AUTOMATION MARKET, BY METHOD, 2020-2029 (USD MILLION)
TABLE 35 MIDDLE EAST AND AFRICA ACCOUNTS PAYABLE AUTOMATION MARKET, BY DEPLOYMENT TYPE, 2020-2029 (USD MILLION)
TABLE 36 MIDDLE EAST AND AFRICA CLOUD IN ACCOUNTS PAYABLE AUTOMATION MARKET, BY TYPE, 2020-2029 (USD MILLION)
TABLE 37 MIDDLE EAST AND AFRICA ACCOUNTS PAYABLE AUTOMATION MARKET, BY VERTICAL, 2020-2029 (USD MILLION)
TABLE 38 U.A.E. ACCOUNTS PAYABLE AUTOMATION MARKET, BY COMPONENT, 2020-2029 (USD MILLION)
TABLE 39 U.A.E. SERVICES IN ACCOUNTS PAYABLE AUTOMATION MARKET, BY TYPE, 2020-2029 (USD MILLION)
TABLE 40 U.A.E. ACCOUNTS PAYABLE AUTOMATION MARKET, BY ORGANIZATION SIZE, 2020-2029 (USD MILLION)
TABLE 41 U.A.E. ACCOUNTS PAYABLE AUTOMATION MARKET, BY PROCESS, 2020-2029 (USD MILLION)
TABLE 42 U.A.E. INVOICE CAPTURE IN ACCOUNTS PAYABLE AUTOMATION MARKET, BY METHOD, 2020-2029 (USD MILLION)
TABLE 43 U.A.E. ACCOUNTS PAYABLE AUTOMATION MARKET, BY DEPLOYMENT TYPE, 2020-2029 (USD MILLION)
TABLE 44 U.A.E. CLOUD IN ACCOUNTS PAYABLE AUTOMATION MARKET, BY TYPE, 2020-2029 (USD MILLION)
TABLE 45 U.A.E. ACCOUNTS PAYABLE AUTOMATION MARKET, BY VERTICAL, 2020-2029 (USD MILLION)
TABLE 46 SOUTH AFRICA ACCOUNTS PAYABLE AUTOMATION MARKET, BY COMPONENT, 2020-2029 (USD MILLION)
TABLE 47 SOUTH AFRICA SERVICES IN ACCOUNTS PAYABLE AUTOMATION MARKET, BY TYPE, 2020-2029 (USD MILLION)
TABLE 48 SOUTH AFRICA ACCOUNTS PAYABLE AUTOMATION MARKET, BY ORGANIZATION SIZE, 2020-2029 (USD MILLION)
TABLE 49 SOUTH AFRICA ACCOUNTS PAYABLE AUTOMATION MARKET, BY PROCESS, 2020-2029 (USD MILLION)
TABLE 50 SOUTH AFRICA INVOICE CAPTURE IN ACCOUNTS PAYABLE AUTOMATION MARKET, BY METHOD, 2020-2029 (USD MILLION)
TABLE 51 SOUTH AFRICA ACCOUNTS PAYABLE AUTOMATION MARKET, BY DEPLOYMENT TYPE, 2020-2029 (USD MILLION)
TABLE 52 SOUTH AFRICA CLOUD IN ACCOUNTS PAYABLE AUTOMATION MARKET, BY TYPE, 2020-2029 (USD MILLION)
TABLE 53 SOUTH AFRICA ACCOUNTS PAYABLE AUTOMATION MARKET, BY VERTICAL, 2020-2029 (USD MILLION)
TABLE 54 SAUDI ARABIA ACCOUNTS PAYABLE AUTOMATION MARKET, BY COMPONENT, 2020-2029 (USD MILLION)
TABLEAU 55 ARABIE SAOUDITE SERVICES SUR LE MARCHÉ DE L'AUTOMATISATION DES COMPTES FOURNISSEURS, PAR TYPE, 2020-2029 (EN MILLIONS USD)
TABLEAU 56 MARCHÉ DE L'AUTOMATISATION DES COMPTES FOURNISSEURS EN ARABIE SAOUDITE, PAR TAILLE D'ORGANISATION, 2020-2029 (EN MILLIONS USD)
TABLEAU 57 MARCHÉ DE L'AUTOMATISATION DES COMPTES FOURNISSEURS EN ARABIE SAOUDITE, PAR PROCESSUS, 2020-2029 (EN MILLIONS USD)
TABLEAU 58 ARABIE SAOUDITE CAPTURE DE FACTURES SUR LE MARCHÉ DE L'AUTOMATISATION DES COMPTES FOURNISSEURS, PAR MÉTHODE, 2020-2029 (EN MILLIONS USD)
TABLEAU 59 MARCHÉ DE L'AUTOMATISATION DES COMPTES FOURNISSEURS EN ARABIE SAOUDITE, PAR TYPE DE DÉPLOIEMENT, 2020-2029 (EN MILLIONS USD)
TABLEAU 60 ARABIE SAOUDITE : NUAGE SUR LE MARCHÉ DE L'AUTOMATISATION DES COMPTES FOURNISSEURS, PAR TYPE, 2020-2029 (EN MILLIONS USD)
TABLEAU 61 MARCHÉ DE L'AUTOMATISATION DES COMPTES FOURNISSEURS EN ARABIE SAOUDITE, PAR SECTEUR VERTICAL, 2020-2029 (EN MILLIONS USD)
TABLEAU 62 MARCHÉ DE L'AUTOMATISATION DES COMPTES FOURNISSEURS EN ISRAËL, PAR COMPOSANT, 2020-2029 (EN MILLIONS USD)
TABLEAU 63 SERVICES ISRAÉLIENS SUR LE MARCHÉ DE L'AUTOMATISATION DES COMPTES FOURNISSEURS, PAR TYPE, 2020-2029 (EN MILLIONS USD)
TABLEAU 64 MARCHÉ DE L'AUTOMATISATION DES COMPTES FOURNISSEURS EN ISRAËL, PAR TAILLE D'ORGANISATION, 2020-2029 (EN MILLIONS USD)
TABLEAU 65 MARCHÉ DE L'AUTOMATISATION DES COMPTES FOURNISSEURS EN ISRAËL, PAR PROCESSUS, 2020-2029 (EN MILLIONS USD)
TABLEAU 66 CAPTURE DE FACTURES EN ISRAËL SUR LE MARCHÉ DE L'AUTOMATISATION DES COMPTES FOURNISSEURS, PAR MÉTHODE, 2020-2029 (EN MILLIONS USD)
TABLEAU 67 MARCHÉ DE L'AUTOMATISATION DES COMPTES FOURNISSEURS EN ISRAËL, PAR TYPE DE DÉPLOIEMENT, 2020-2029 (EN MILLIONS USD)
TABLEAU 68 NUAGE ISRAÉLIEN SUR LE MARCHÉ DE L'AUTOMATISATION DES COMPTES FOURNISSEURS, PAR TYPE, 2020-2029 (EN MILLIONS USD)
TABLEAU 69 MARCHÉ DE L'AUTOMATISATION DES COMPTES FOURNISSEURS EN ISRAËL, PAR SECTEUR VERTICAL, 2020-2029 (EN MILLIONS USD)
TABLEAU 70 MARCHÉ ÉGYPTIEN DE L'AUTOMATISATION DES COMPTES FOURNISSEURS, PAR COMPOSANTE, 2020-2029 (EN MILLIONS USD)
TABLEAU 71 SERVICES ÉGYPTIENS SUR LE MARCHÉ DE L'AUTOMATISATION DES COMPTES FOURNISSEURS, PAR TYPE, 2020-2029 (EN MILLIONS USD)
TABLEAU 72 MARCHÉ ÉGYPTIEN DE L'AUTOMATISATION DES COMPTES FOURNISSEURS, PAR TAILLE D'ORGANISATION, 2020-2029 (EN MILLIONS USD)
TABLEAU 73 MARCHÉ DE L'AUTOMATISATION DES COMPTES FOURNISSEURS EN ÉGYPTE, PAR PROCESSUS, 2020-2029 (EN MILLIONS USD)
TABLEAU 74 CAPTURE DE FACTURES SUR LE MARCHÉ DE L'AUTOMATISATION DES COMPTES FOURNISSEURS EN ÉGYPTE, PAR MÉTHODE, 2020-2029 (EN MILLIONS USD)
TABLEAU 75 MARCHÉ ÉGYPTIEN DE L'AUTOMATISATION DES COMPTES FOURNISSEURS, PAR TYPE DE DÉPLOIEMENT, 2020-2029 (EN MILLIONS USD)
TABLEAU 76 NUAGE ÉGYPTE SUR LE MARCHÉ DE L'AUTOMATISATION DES COMPTES FOURNISSEURS, PAR TYPE, 2020-2029 (EN MILLIONS USD)
TABLEAU 77 MARCHÉ DE L'AUTOMATISATION DES COMPTES FOURNISSEURS EN ÉGYPTE, PAR SECTEUR VERTICAL, 2020-2029 (EN MILLIONS USD)
TABLEAU 78 RESTE DU MARCHÉ DE L'AUTOMATISATION DES COMPTES FOURNISSEURS AU MOYEN-ORIENT ET EN AFRIQUE, PAR COMPOSANTE, 2020-2029 (EN MILLIONS USD)
Liste des figures
FIGURE 1 MARCHÉ DE L'AUTOMATISATION DES COMPTES FOURNISSEURS AU MOYEN-ORIENT ET EN AFRIQUE : SEGMENTATION
FIGURE 2 MARCHÉ DE L'AUTOMATISATION DES COMPTES FOURNISSEURS AU MOYEN-ORIENT ET EN AFRIQUE : TRIANGULATION DES DONNÉES
FIGURE 3 MARCHÉ DE L'AUTOMATISATION DES COMPTES FOURNISSEURS AU MOYEN-ORIENT ET EN AFRIQUE : ANALYSE DROC
FIGURE 4 MARCHÉ DE L'AUTOMATISATION DES COMPTES FOURNISSEURS AU MOYEN-ORIENT ET EN AFRIQUE : ANALYSE DU MARCHÉ RÉGIONAL ET DU MOYEN-ORIENT
FIGURE 5 MARCHÉ DE L'AUTOMATISATION DES COMPTES FOURNISSEURS AU MOYEN-ORIENT ET EN AFRIQUE : ANALYSE DE LA RECHERCHE DES ENTREPRISES
FIGURE 6 MARCHÉ DE L'AUTOMATISATION DES COMPTES FOURNISSEURS AU MOYEN-ORIENT ET EN AFRIQUE : DÉMOGRAPHIE DES ENTRETIENS
FIGURE 7 MARCHÉ DE L'AUTOMATISATION DES COMPTES FOURNISSEURS AU MOYEN-ORIENT ET EN AFRIQUE : GRILLE DE POSITIONNEMENT DU MARCHÉ DBMR
FIGURE 8 MARCHÉ DE L'AUTOMATISATION DES COMPTES FOURNISSEURS AU MOYEN-ORIENT ET EN AFRIQUE : ANALYSE DE LA PART DES FOURNISSEURS
FIGURE 9 MARCHÉ DE L'AUTOMATISATION DES COMPTES FOURNISSEURS AU MOYEN-ORIENT ET EN AFRIQUE : GRILLE DE COUVERTURE VERTICALE DU MARCHÉ
FIGURE 10 MARCHÉ DE L'AUTOMATISATION DES COMPTES FOURNISSEURS AU MOYEN-ORIENT ET EN AFRIQUE : SEGMENTATION
FIGURE 11 LE BESOIN CROISSANT DE NUMÉRISATION DU PROCESSUS DE PAIEMENT ET LA RÉDUCTION DU TEMPS DE TRAITEMENT DES FACTURES DEVRAIENT ÊTRE LE MOTEUR CLÉ DU MARCHÉ DE L'AUTOMATISATION DES COMPTES FOURNISSEURS AU MOYEN-ORIENT ET EN AFRIQUE AU COURS DE LA PÉRIODE DE PRÉVISION DE 2022 À 2029
FIGURE 12 LE SEGMENT DE SOLUTIONS DEVRAIT REPRÉSENTER LA PLUS GRANDE PART DU MARCHÉ DE L'AUTOMATISATION DES COMPTES FOURNISSEURS AU MOYEN-ORIENT ET EN AFRIQUE DE 2022 À 2029
FIGURE 13 MOTEURS, CONTRAINTES, OPPORTUNITÉS ET DÉFIS DU MARCHÉ DE L'AUTOMATISATION DES COMPTES FOURNISSEURS AU MOYEN-ORIENT ET EN AFRIQUE
FIGURE 14 MARCHÉ DE L'AUTOMATISATION DES COMPTES FOURNISSEURS AU MOYEN-ORIENT ET EN AFRIQUE : PAR COMPOSANT, 2021
FIGURE 15 MARCHÉ DE L'AUTOMATISATION DES COMPTES FOURNISSEURS AU MOYEN-ORIENT ET EN AFRIQUE : PAR TAILLE D'ORGANISATION, 2021
FIGURE 16 MARCHÉ DE L'AUTOMATISATION DES COMPTES FOURNISSEURS AU MOYEN-ORIENT ET EN AFRIQUE : PAR PROCESSUS, 2021
FIGURE 17 MARCHÉ DE L'AUTOMATISATION DES COMPTES FOURNISSEURS AU MOYEN-ORIENT ET EN AFRIQUE : PAR TYPE DE DÉPLOIEMENT, 2021
FIGURE 18 MARCHÉ DE L'AUTOMATISATION DES COMPTES FOURNISSEURS AU MOYEN-ORIENT ET EN AFRIQUE : PAR SECTEUR VERTICAL, 2021
FIGURE 19 MARCHÉ DE L'AUTOMATISATION DES COMPTES FOURNISSEURS AU MOYEN-ORIENT ET EN AFRIQUE : INSTANTANÉ (2021)
FIGURE 20 MARCHÉ DE L'AUTOMATISATION DES COMPTES FOURNISSEURS AU MOYEN-ORIENT ET EN AFRIQUE : PAR PAYS (2021)
FIGURE 21 MARCHÉ DE L'AUTOMATISATION DES COMPTES FOURNISSEURS AU MOYEN-ORIENT ET EN AFRIQUE : PAR PAYS (2022 ET 2029)
FIGURE 22 MARCHÉ DE L'AUTOMATISATION DES COMPTES FOURNISSEURS AU MOYEN-ORIENT ET EN AFRIQUE : PAR PAYS (2021 ET 2029)
FIGURE 23 MARCHÉ DE L'AUTOMATISATION DES COMPTES FOURNISSEURS AU MOYEN-ORIENT ET EN AFRIQUE : PAR COMPOSANTE (2022-2029)
FIGURE 24 MARCHÉ DE L'AUTOMATISATION DES COMPTES FOURNISSEURS AU MOYEN-ORIENT ET EN AFRIQUE : PART DE L'ENTREPRISE EN 2021 (%)
Méthodologie de recherche
La collecte de données et l'analyse de l'année de base sont effectuées à l'aide de modules de collecte de données avec des échantillons de grande taille. L'étape consiste à obtenir des informations sur le marché ou des données connexes via diverses sources et stratégies. Elle comprend l'examen et la planification à l'avance de toutes les données acquises dans le passé. Elle englobe également l'examen des incohérences d'informations observées dans différentes sources d'informations. Les données de marché sont analysées et estimées à l'aide de modèles statistiques et cohérents de marché. De plus, l'analyse des parts de marché et l'analyse des tendances clés sont les principaux facteurs de succès du rapport de marché. Pour en savoir plus, veuillez demander un appel d'analyste ou déposer votre demande.
La méthodologie de recherche clé utilisée par l'équipe de recherche DBMR est la triangulation des données qui implique l'exploration de données, l'analyse de l'impact des variables de données sur le marché et la validation primaire (expert du secteur). Les modèles de données incluent la grille de positionnement des fournisseurs, l'analyse de la chronologie du marché, l'aperçu et le guide du marché, la grille de positionnement des entreprises, l'analyse des brevets, l'analyse des prix, l'analyse des parts de marché des entreprises, les normes de mesure, l'analyse globale par rapport à l'analyse régionale et des parts des fournisseurs. Pour en savoir plus sur la méthodologie de recherche, envoyez une demande pour parler à nos experts du secteur.
Personnalisation disponible
Data Bridge Market Research est un leader de la recherche formative avancée. Nous sommes fiers de fournir à nos clients existants et nouveaux des données et des analyses qui correspondent à leurs objectifs. Le rapport peut être personnalisé pour inclure une analyse des tendances des prix des marques cibles, une compréhension du marché pour d'autres pays (demandez la liste des pays), des données sur les résultats des essais cliniques, une revue de la littérature, une analyse du marché des produits remis à neuf et de la base de produits. L'analyse du marché des concurrents cibles peut être analysée à partir d'une analyse basée sur la technologie jusqu'à des stratégies de portefeuille de marché. Nous pouvons ajouter autant de concurrents que vous le souhaitez, dans le format et le style de données que vous recherchez. Notre équipe d'analystes peut également vous fournir des données sous forme de fichiers Excel bruts, de tableaux croisés dynamiques (Fact book) ou peut vous aider à créer des présentations à partir des ensembles de données disponibles dans le rapport.

