Us Optic Neuritis Market
Taille du marché en milliards USD
TCAC :
% 
 USD
5.04 Million
USD
7.44 Million
2025
2033
USD
5.04 Million
USD
7.44 Million
2025
2033
| 2026 –2033 | |
| USD 5.04 Million | |
| USD 7.44 Million | |
| % | |
U.S. Optic Neuritis Market, By Treatment (Corticosteroids, IV Immunoglobulin, Supplements, and Others), Diagnosis (MRI Scan, Lumbar Puncture, Occular Coherence Tomography, Blood Test, and Others), Route of Administration (Parenteral, and Oral), End User (Hospitals, Clinics, Academics & Research Institutes, and Others), Distribution Channel (Hospital Pharmacy, Retail Pharmacy, and Others). Industry Trends and Forecast to 2029.
U.S. Optic Neuritis Market Analysis and Size
The growing prevalence of eye disorders in the region and the rise in the geriatric population has enhanced the demand of the market. The rising healthcare expenditure for better health services is also attributed to the growth of the market. The major market players are highly focused on product launches and approvals during this crucial period. In addition, the government and regulatory bodies are supporting market players by product approval due to the surging emergence.
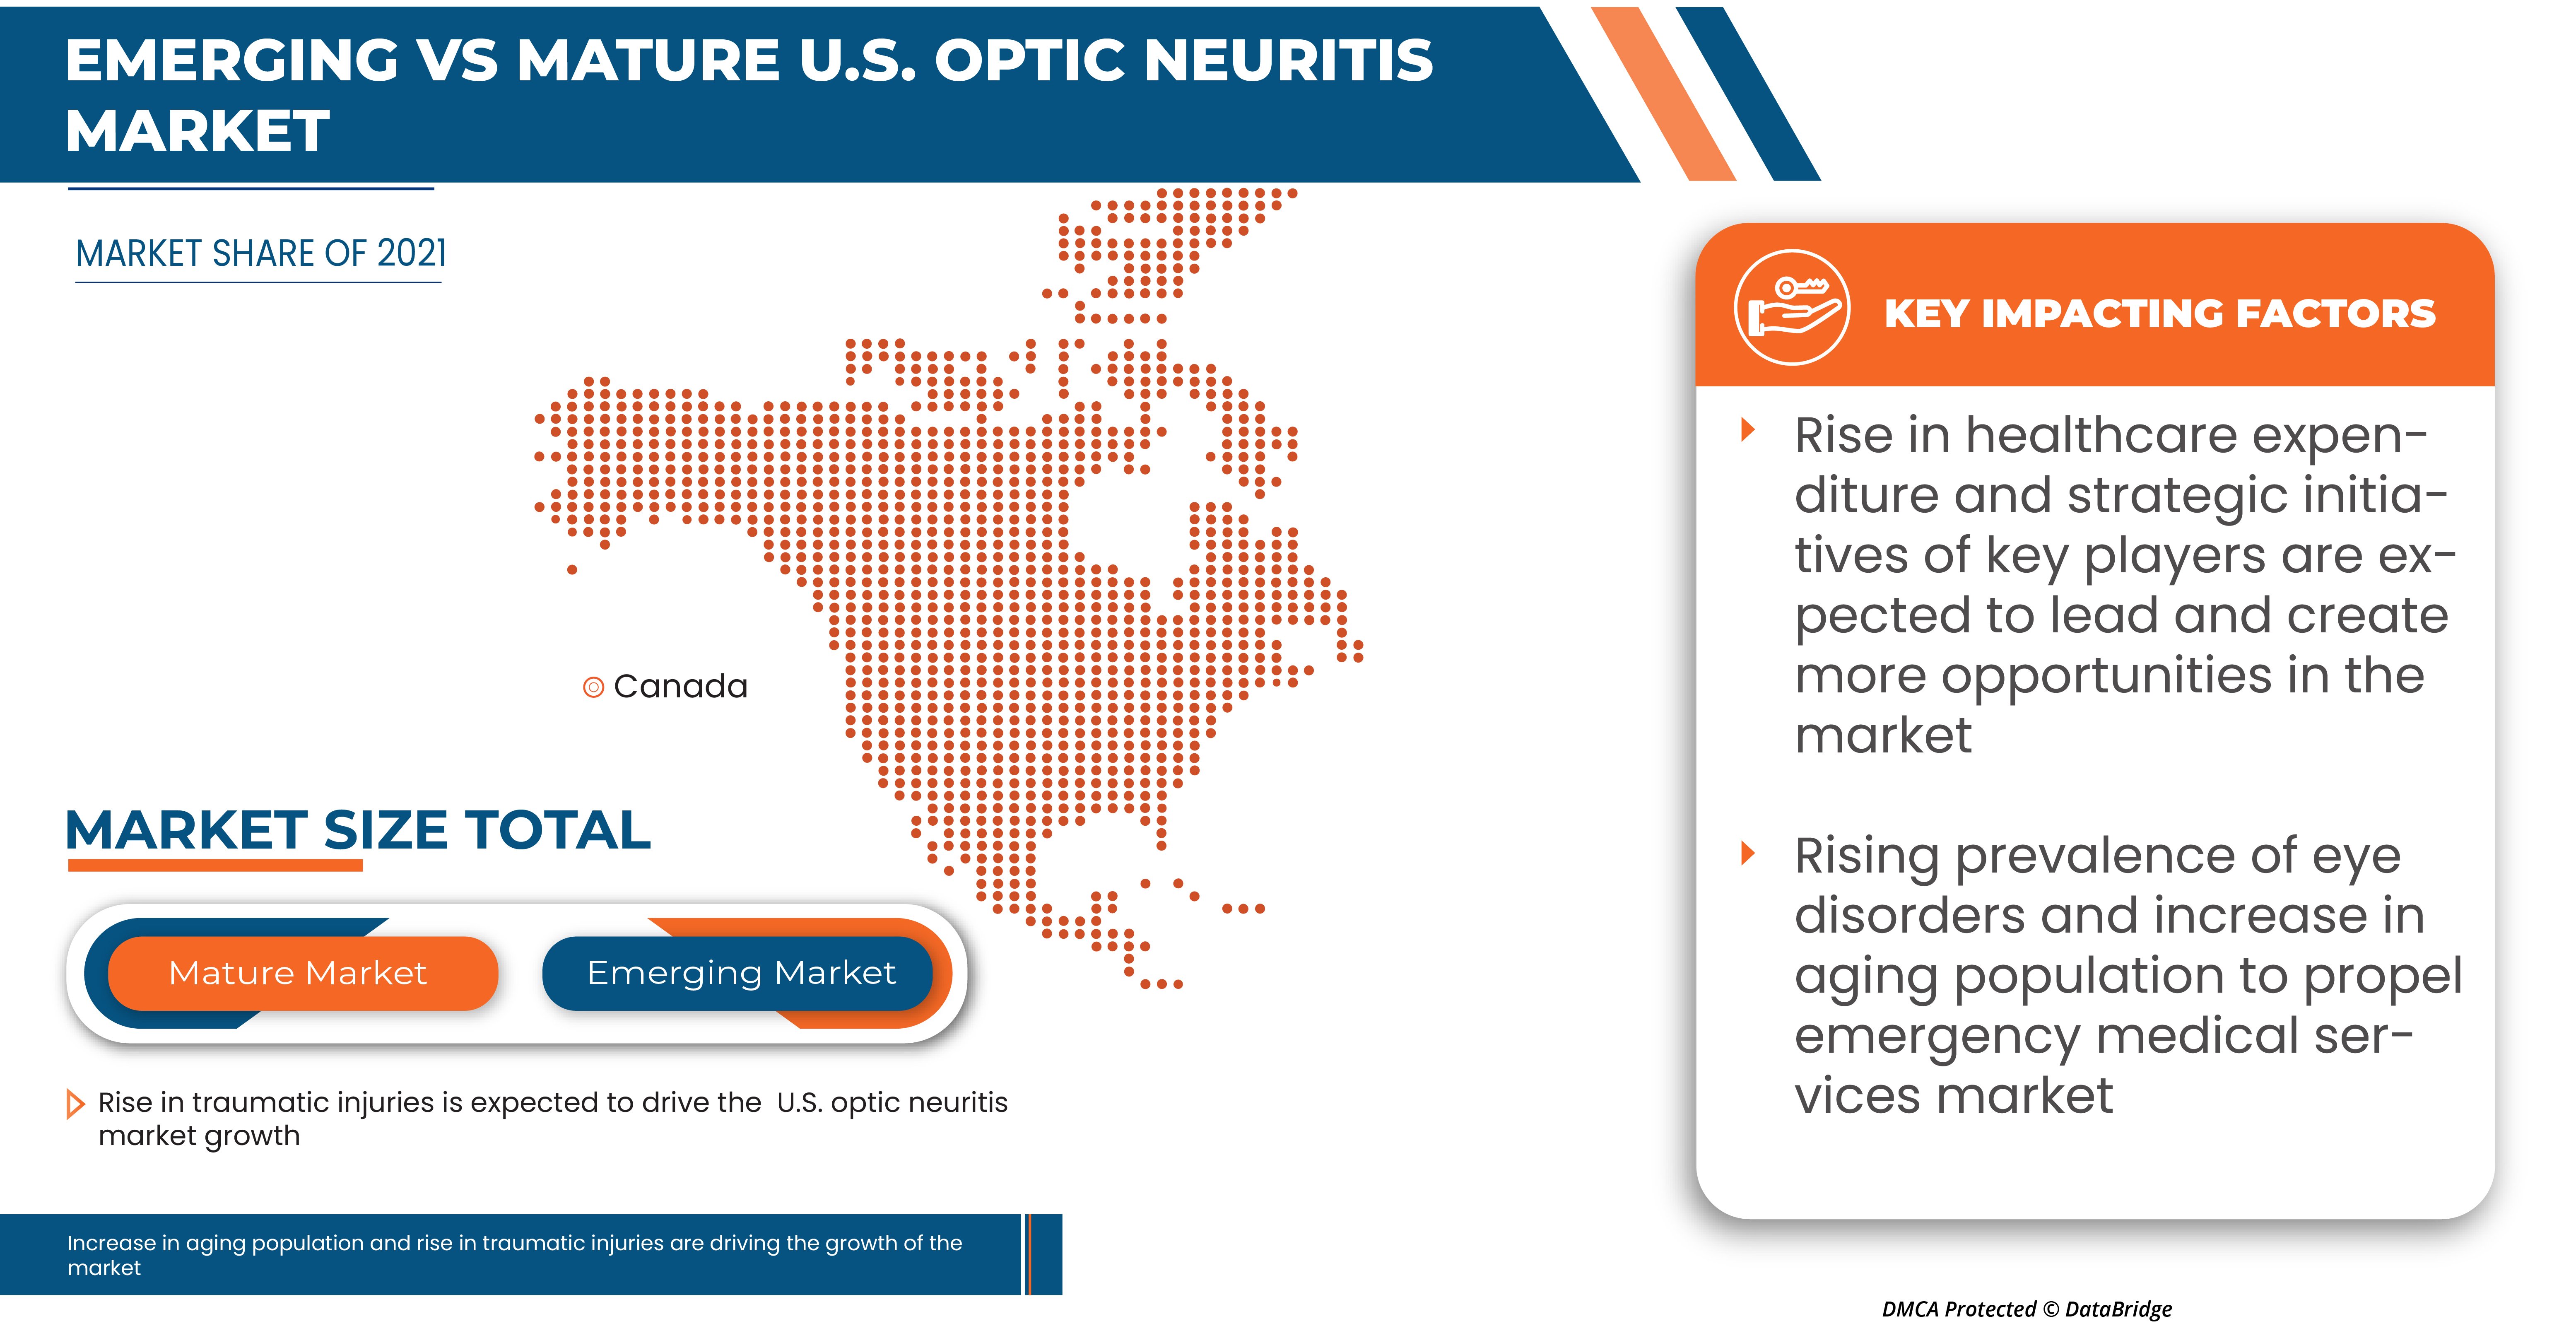

The U.S. optic neuritis market is expected to reach USD 6.11 million by 2029 from USD 4.15 million in 2021, growing at a CAGR of 5.0% in the forecast period of 2022 to 2029.
|
Report Metric |
Details |
|
Forecast Period |
2022 to 2029 |
|
Base Year |
2021 |
|
Historic Years |
2020 (Customizable to 2019 - 2015) |
|
Quantitative Units |
Revenue in USD Million |
|
Segments Covered |
By Treatment (Corticosteroids, IV Immunoglobulin, Supplements, and Others), Diagnosis (MRI Scan, Lumbar Puncture, Ocular Coherence Tomography, Blood Test, and Others), Route of Administration (Parenteral, and Oral), End User (Hospitals, Clinics, Academics & Research Institutes, and Others), Distribution Channel (Hospital Pharmacy, Retail Pharmacy, and Others) |
|
Countries Covered |
U.S. |
|
Market Players Covered |
AbbVie Inc., Bausch & Lomb Incorporated, Boehringer Ingelheim International GmbH, Novartis AG, Merck & Co., Inc., Hikma Pharmaceuticals PLC, Fresenius Kabi USA, Teva Pharmaceuticals Industries Ltd., GSK plc, Pfizer, Akorn Operating Company LLC, AdvaCare Pharma, Bristol- Myers Squibb Company, Jubilant Cadista Pharmaceuticals Inc., Amneal Pharmaceuticals LLC., Viatris Inc., and Novitium Pharma, among others. The pipeline companies that are in this market are Accure Therapeutics, Noveome Biotherapeutics, Inc., Biogen, Mallinckrodt, and Acorda Therapeutics, Sanofi, among others. |
Market Definition
Optic neuritis is characterized as a swelling or inflammation that occurs in the optic nerve. It is also commonly termed as optic papillitis and retro tubular neuritis. The optic nerves is a nerve fibres that has the capability of transmitting visual information from the eye to the brain. The inflammation usually leads to damage in the optic nerve and temporary vision loss in only one eye typically. Pediatric optic neuritis and adult optic neuritis and are two types which is based on the age group of patients diagnosed with optic neuritis. The common way to diagnose the optic neuritis is through a physical exam and medical history. The treatment becomes essential at an early stage due to the lifetime risk of losing human eye vision in this disorder. The most common symptoms associated with optic neuritis include pain with eye movement and dyschromatopsia or inability to see colors correctly. For instance, as per an article in the Journal of Neurology stated that the annual incidence of optic neuritis in the U.S. is found to be around 5/1,000,000, with an estimated prevalence of 115/1,000,000.
Optic Neuritis Market Dynamics
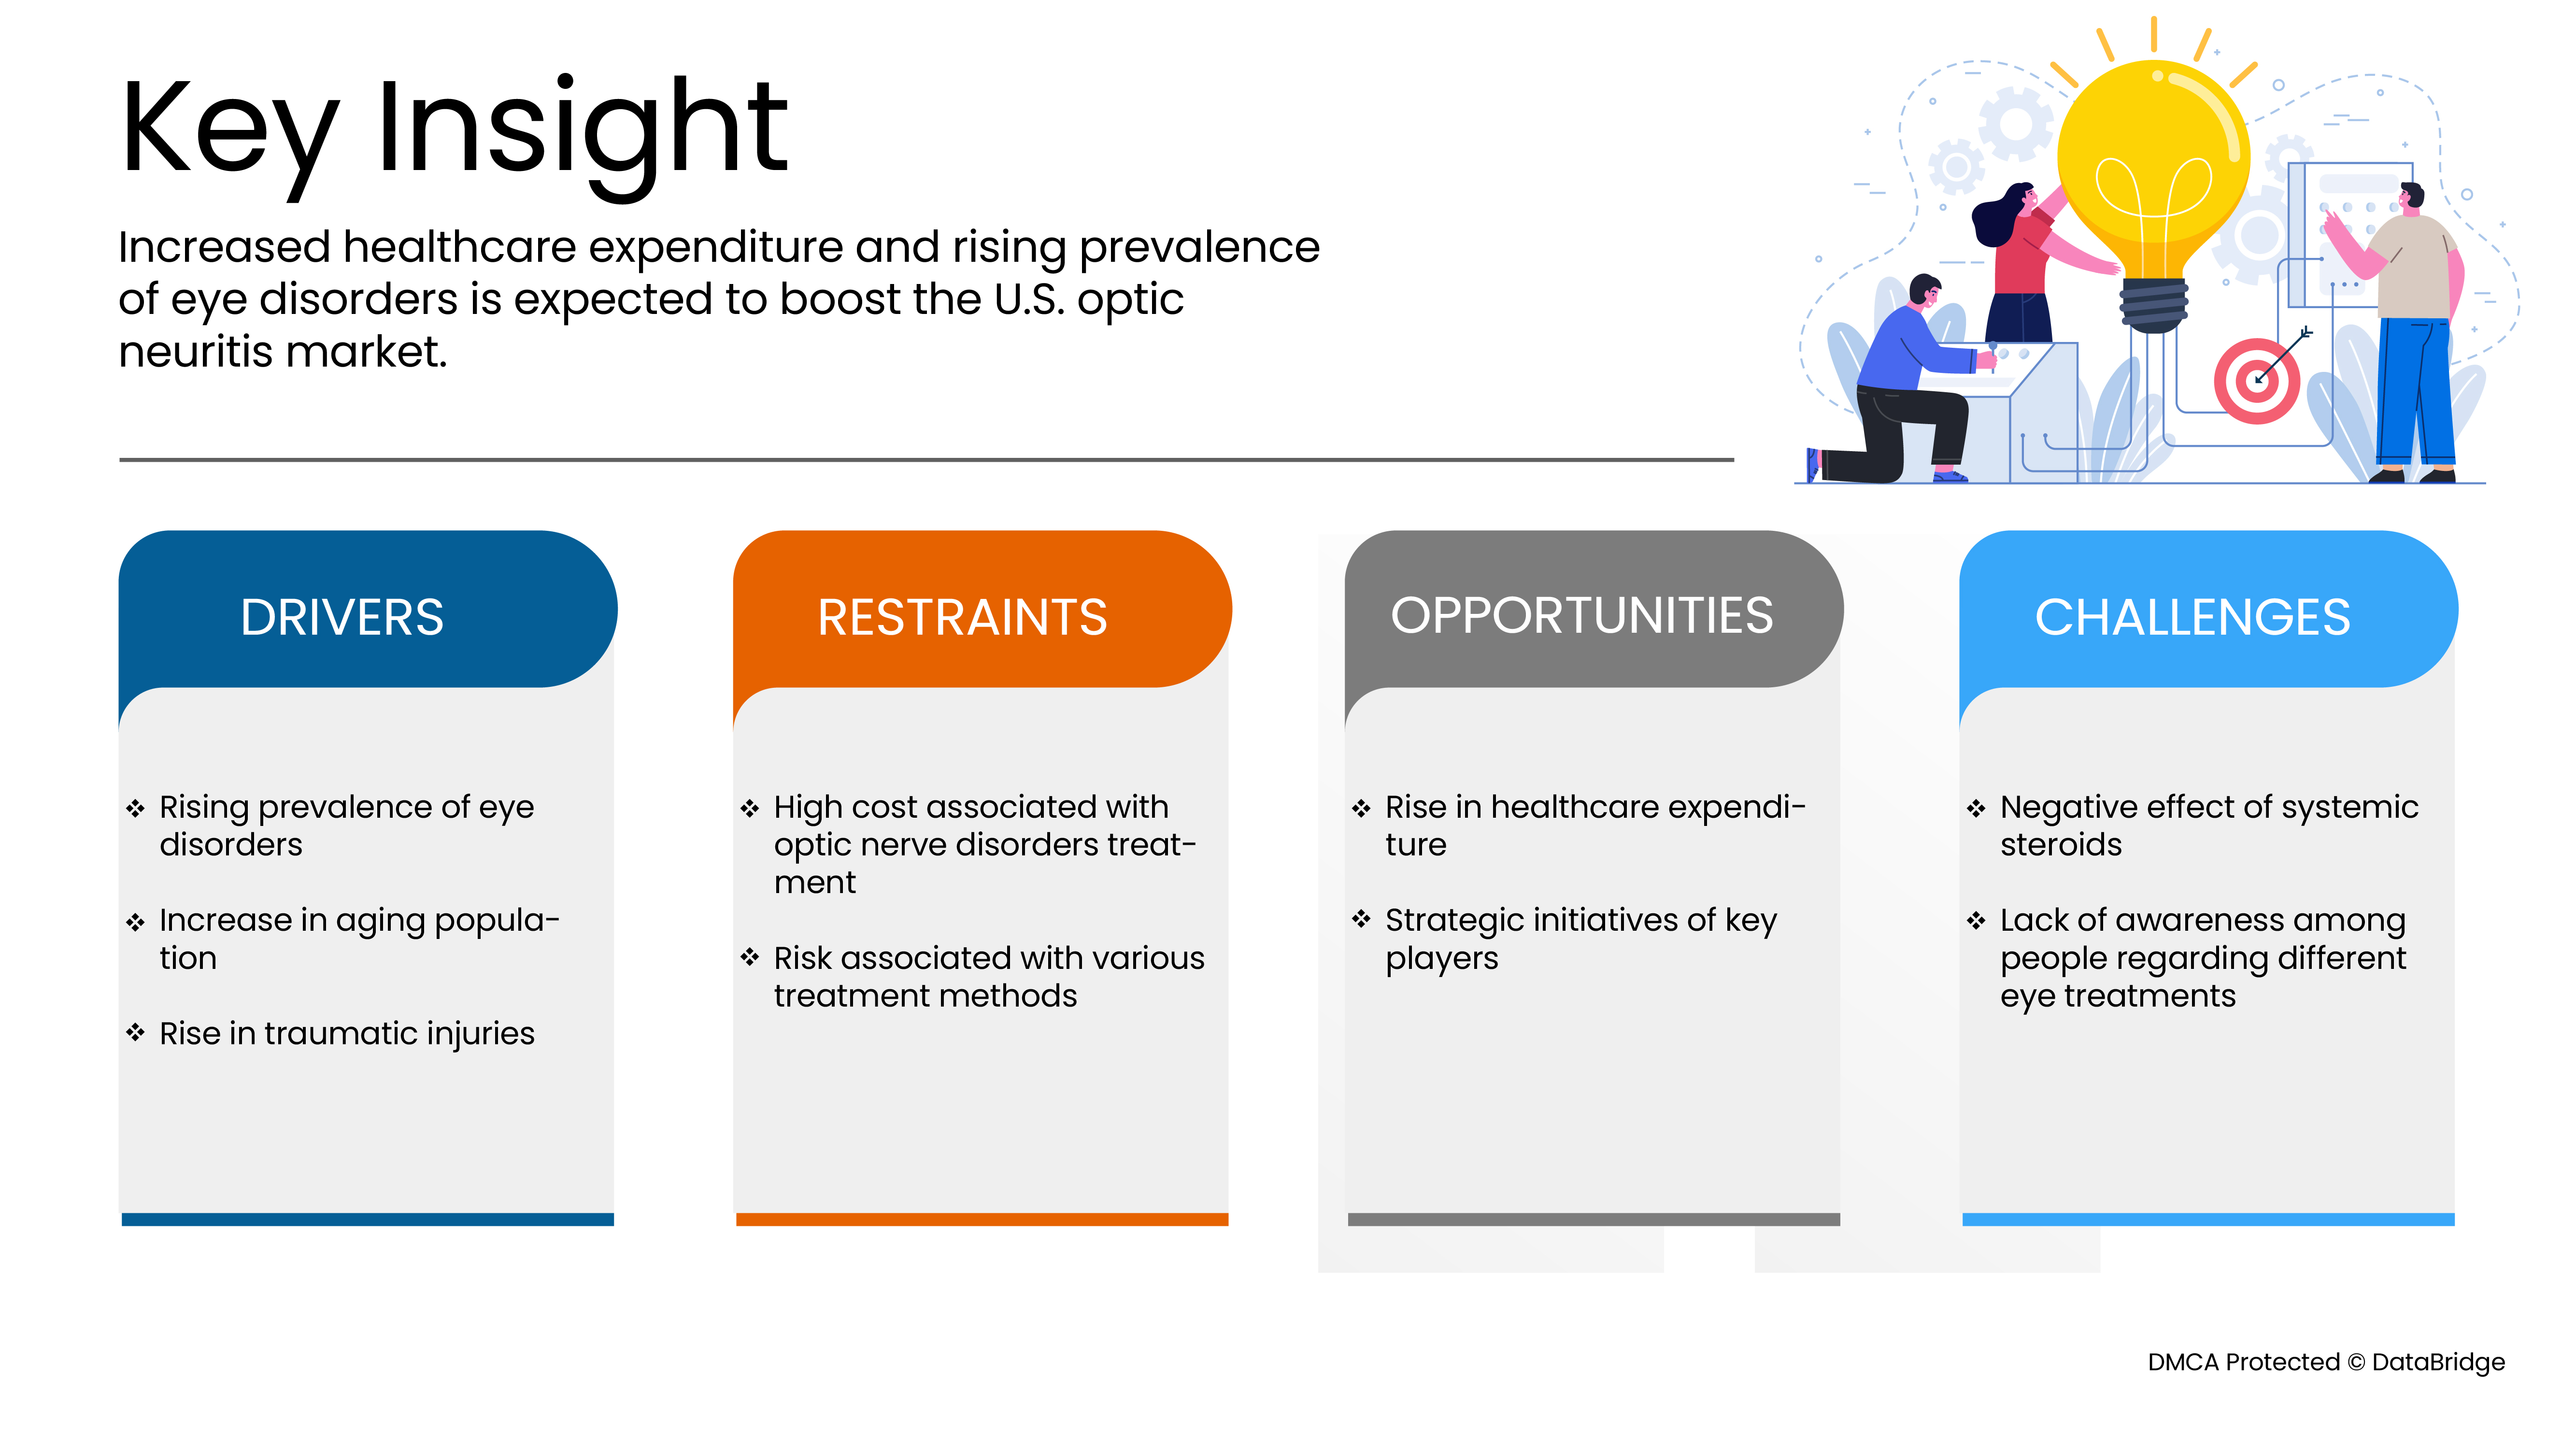
This section deals with understanding the market drivers, opportunities, restraints, and challenges. All of this is discussed in detail as below:
Drivers
-
Rising prevalence of eye disorders
With the increased prevalence and optic neuritis worldwide, there is an increase in the awareness about the disease. Therefore, rising patient awareness of optic neuritis is expected to act as a driver for the growth of the optic neuritis market.
-
Rise in traumatic injuries
Another significant factor influencing the growth rate of the optic neuritis market is the increasing prevalence of the disease in the region.
-
Increase in aging population
An increase in the aging population, rise in the multiple sclerosis patient pool, growing awareness, and affordable prices are the major factors propelling the market.
Opportunities
-
Strategic initiatives of key players
The dramatic rise in the quality of research and increasing research opportunities is because of various strategic initiatives taken by the key market players in the optic neuritis market. They are taking initiatives such as product launches, collaborations, mergers, acquisitions, and many more over the years and are expected to lead and create more opportunities in the market.
Also, the rise in healthcare expenditure will provide structural integrity and future opportunities for the optic neuritis market in the forecast period of 2022-2029.
Restraints/Challenges
- High cost associated with optic nerve disorders treatment
However, the high cost of therapies and side effects and complications of various drugs and therapies will impede the growth rate of the optic neuritis market. Additionally, stringent rules and regulations will further challenge the market in the forecast period mentioned above.
This optic neuritis market report provides details of new recent developments, trade regulations, import-export analysis, production analysis, value chain optimization, market share, the impact of domestic and localized market players, analyses opportunities in terms of emerging revenue pockets, changes in market regulations, strategic market growth analysis, market size, category market growths, application niches and dominance, product approvals, product launches, geographic expansions, technological innovations in the market. For more info on the optic neuritis market, contact Data Bridge Market Research for an Analyst Brief. Our team will help you to make an informed market decision to achieve market growth.
Recent Development
Sanofi is recently working on a single oral doses study of nerispirdine on visual function in patients with multiple sclerosis.
The U.S. Optic Neuritis Market Scope
The U.S. optic neuritis market is segmented into treatment, diagnosis, route of administration, end users, and distribution channel. The growth amongst these segments will help you analyze meager growth segments in the industries and provide the users with a valuable market overview and market insights to make strategic decisions to identify core market applications.
Treatment
- Corticosteroids
- IV Immunoglobulin
- Supplements
- Others
On the basis of treatment, the U.S. optic neuritis market is segmented into corticosteroids, IV Immunoglobulin, Supplements, and Others.
Diagnosis
- MRI Scan
- Lumbar Puncture
- Ocular Coherence Tomography
- Blood Test
- Others
On the basis of diagnosis, the U.S. optic neuritis market is segmented into MRI scans, lumbar puncture, ocular coherence tomography, blood test, and others.
Route of Administration
- Parenteral
- Oral
On the basis of route of administration, the U.S. optic neuritis market is segmented into parenteral, and oral.
End User
- Hospitals
- Clinics
- Academic & Research Institutes
- Others
On the basis of end-user, the U.S. optic neuritis market is segmented into hospitals, clinics, academic and research institutes, and others.
Distribution Channel
- Hospital Pharmacy
- Retail Pharmacy
- Others
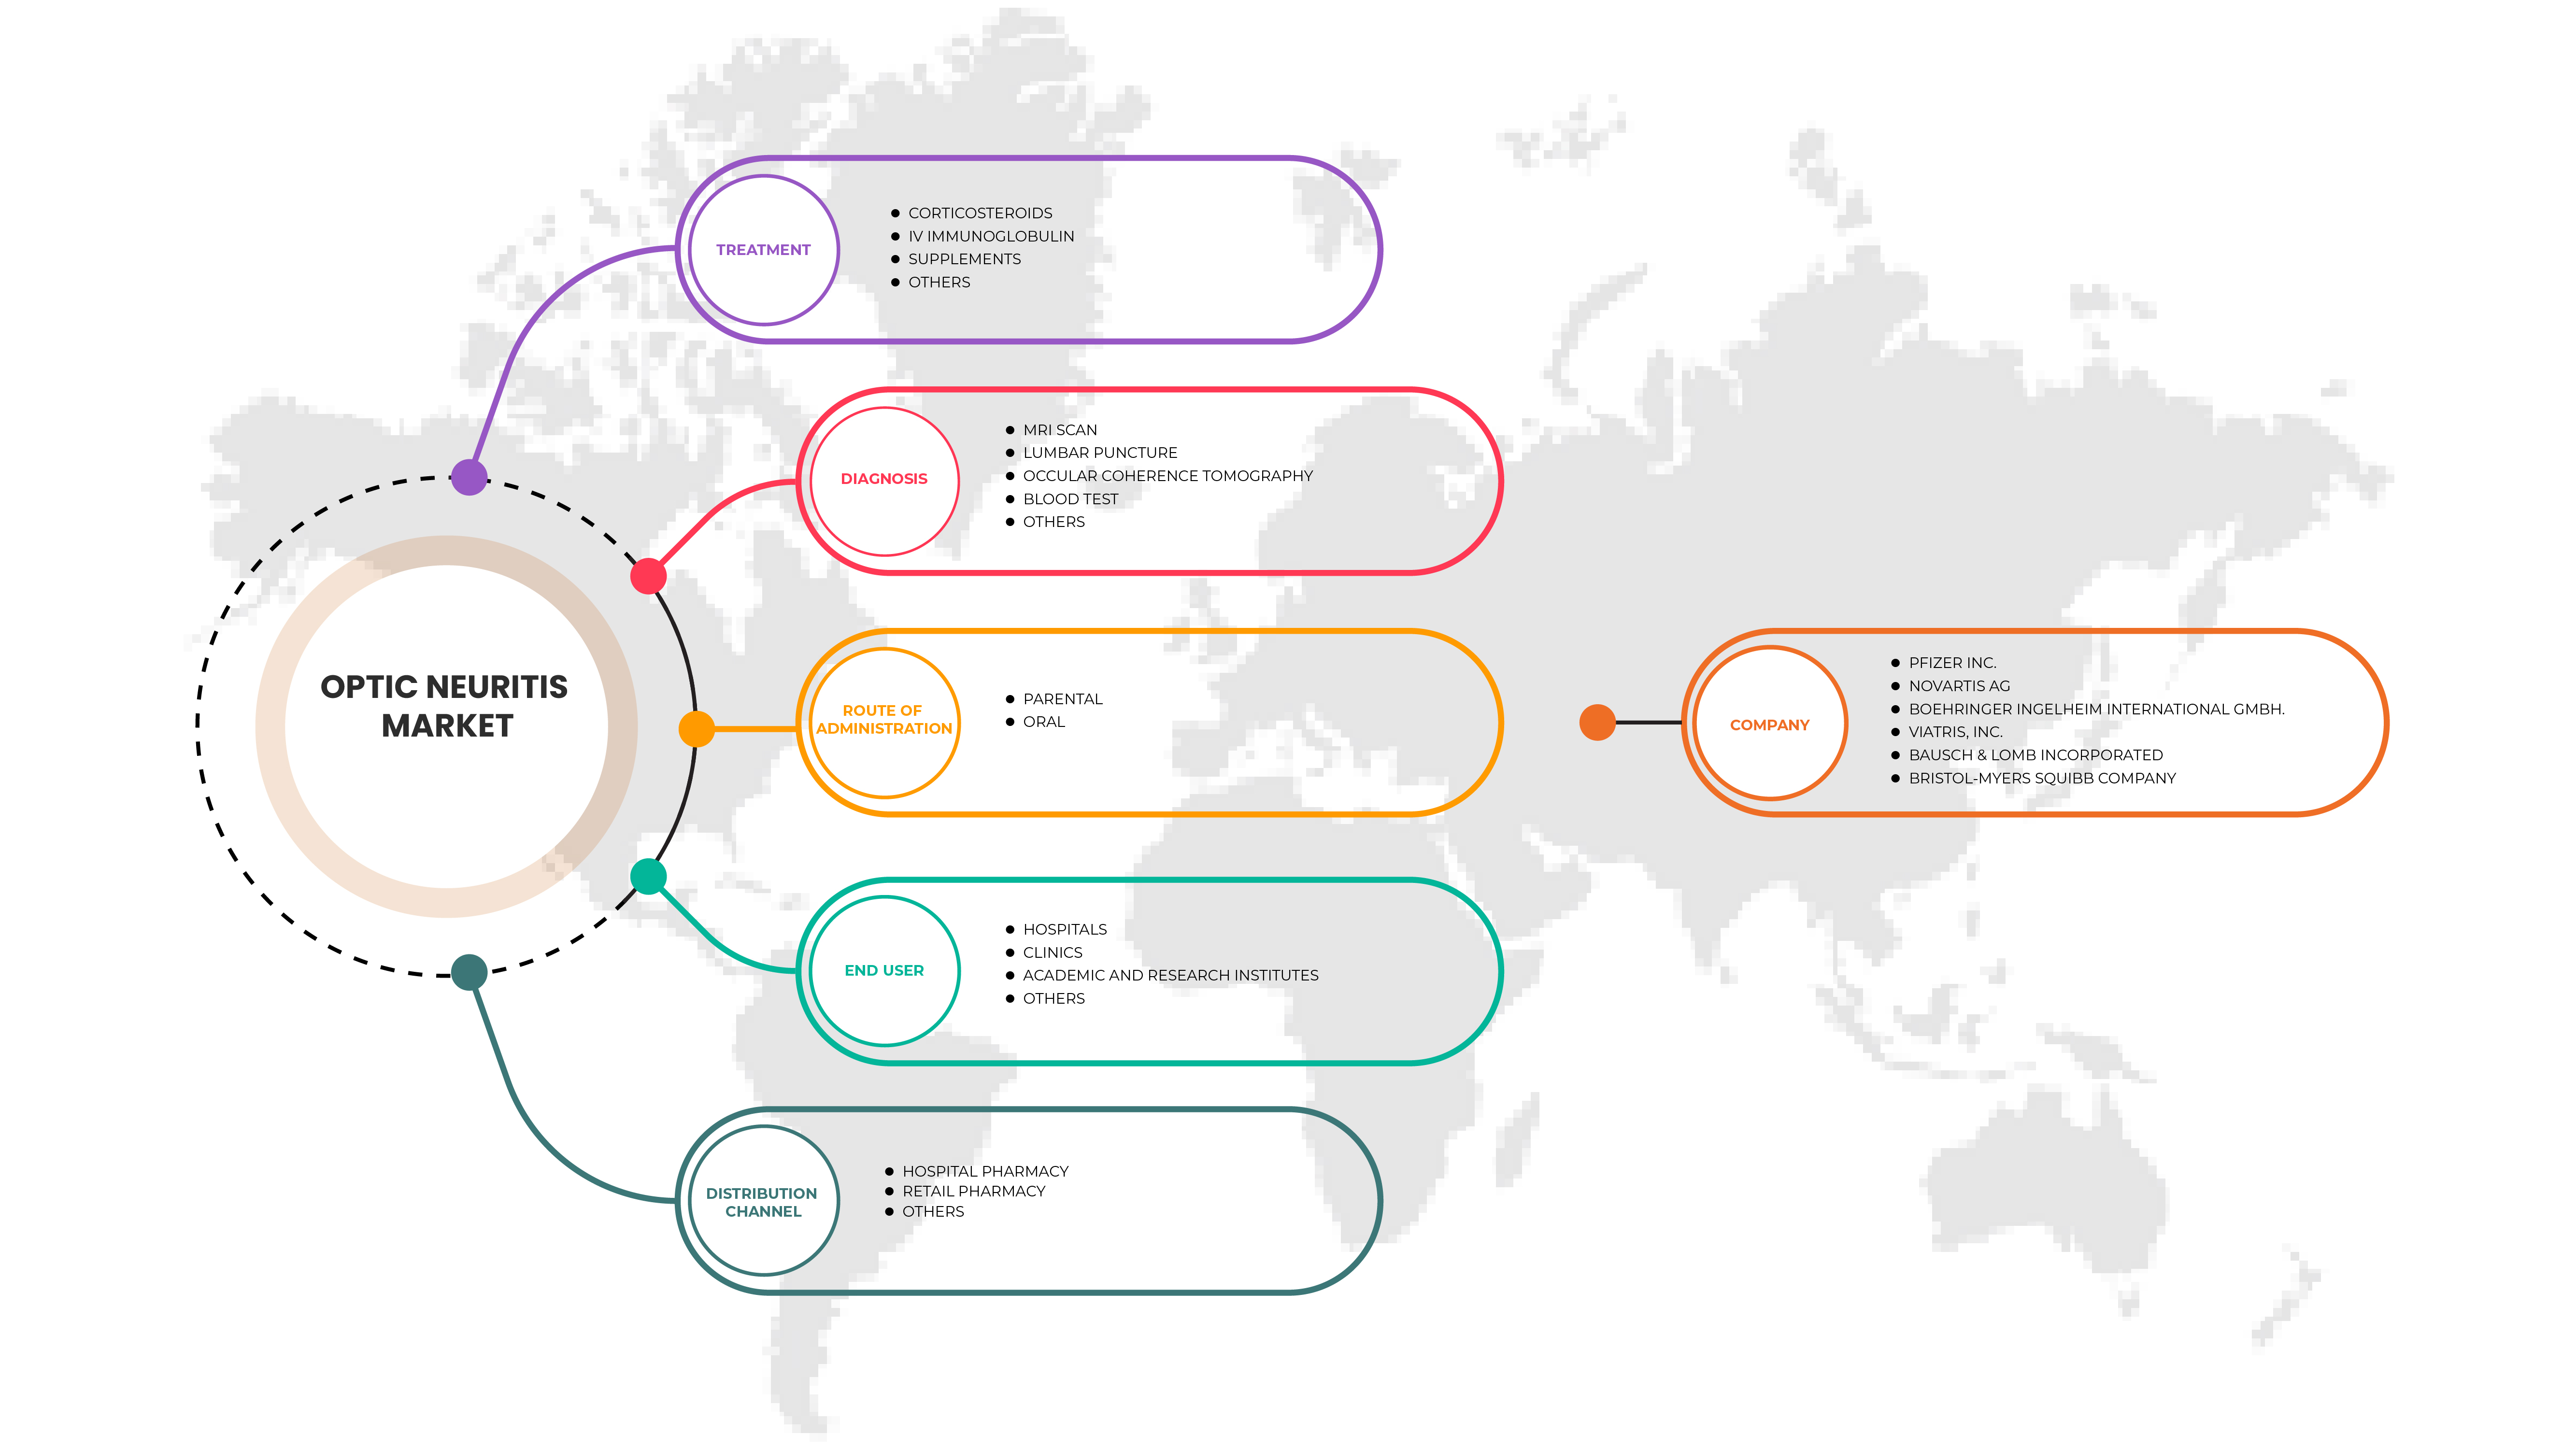
On the basis of distribution channel, the U.S. optic neuritis market is segmented into hospital pharmacy, retail pharmacy, and others.
Optic Neuritis Market Regional Analysis/Insights
The optic neuritis market is analyzed, and market size insights and trends are provided by country, treatment, diagnosis, route of administration, end user, and distribution channel, as referenced above.
The U.S. dominates the optic neuritis market in terms of market share and market revenue and will continue to flourish its dominance during the forecast period. This is due to implementing awareness programs regarding the diagnosis and treatments of optic neuritis, and research and development in the drugs for optic neuritis in the U.S. region further improves this market growth.
The country section of the report also provides individual market-impacting factors and changes in regulations in the market that impact the current and future trends of the market. Data points, such as new and replacement sales, country demographics, disease epidemiology, and import-export tariffs, are some of the major pointers used to forecast the market scenario for individual countries. In addition, the presence and availability of global brands and their challenges faced due to high competition from local and domestic brands, and the impact of sales channels are considered while providing forecast analysis of the country data.
Competitive Landscape and Optic Neuritis Market Share Analysis
The optic neuritis market competitive landscape provides details by the competitors. Details include company overview, company financials, revenue generated, market potential, investment in research and development, new market initiatives, global presence, production sites and facilities, production capacities, company strengths and weaknesses, product launch, product width and breadth, and application dominance. The above data points provided are only related to the companies' focus on the optic neuritis market.
Some of the major players operating in the optic neuritis market are AbbVie Inc., Bausch & Lomb Incorporated, Boehringer Ingelheim International GmbH, Novartis AG, Merck & Co., Inc., Hikma Pharmaceuticals PLC, Fresenius Kabi USA, Teva Pharmaceuticals Industries Ltd., GSK plc, Pfizer, Akorn Operating Company LLC, AdvaCare Pharma, Bristol- Myers Squibb Company, Jubilant Cadista Pharmaceuticals Inc., Amneal Pharmaceuticals LLC., Viatris Inc., and Novitium Pharma, among others. The pipeline companies that are in this market are Accure Therapeutics, Noveome Biotherapeutics, Inc., Biogen, Mallinckrodt, Acorda Therapeutics, and Sanofi, among others.
Research Methodology
Data collection and base year analysis are done using data collection modules with large sample sizes. The market data is analysed and estimated using market statistical and coherent models. In addition, market share analysis and key trend analysis are the major success factors in the market report. The key research methodology used by DBMR research team is data triangulation which involves data mining, analysis of the impact of data variables on the market, and primary (industry expert) validation. Apart from this, data models include the Vendor Positioning Grid, Market Time Line Analysis, Market Overview and Guide, Company Positioning Grid, Company Market Share Analysis, Standards of Measurement, U.S. vs. Regional, and Vendor Share Analysis. Please request an analyst call in case of further inquiry.
SKU-
Accédez en ligne au rapport sur le premier cloud mondial de veille économique

- Tableau de bord d'analyse de données interactif
- Tableau de bord d'analyse d'entreprise pour les opportunités à fort potentiel de croissance
- Accès d'analyste de recherche pour la personnalisation et les requêtes
- Analyse de la concurrence avec tableau de bord interactif
- Dernières actualités, mises à jour et analyse des tendances
- Exploitez la puissance de l'analyse comparative pour un suivi complet de la concurrence
Table des matières
1 INTRODUCTION
1.1 OBJECTIFS DE L'ÉTUDE
1.2 DÉFINITION DU MARCHÉ
1.3 APERÇU DU MARCHÉ AMÉRICAIN DE LA NÉVRIT OPTIQUE
1.4 LIMITATIONS
1,5 MARCHÉS COUVERTS
2 SEGMENTATION DU MARCHÉ
2.1 MARCHÉS COUVERTS
2.2 PORTÉE GÉOGRAPHIQUE
2,3 ANS CONSIDÉRÉS POUR L'ÉTUDE
2.4 MONNAIE ET TARIFS
2.5 MODÈLE DE VALIDATION DES DONNÉES DU TRÉPIED DBMR
2.6 MODÉLISATION MULTIVARIÉE
2.7 COURBE DE VIE DU TRAITEMENT
2.8 ENTRETIENS PRIMAIRES AVEC DES LEADERS D'OPINION CLÉS
2.9 GRILLE DE POSITIONNEMENT DU MARCHÉ DBMR
2.1 GRILLE DE COUVERTURE DES UTILISATEURS FINAUX DU MARCHÉ
2.11 ANALYSE DES PARTS DES FOURNISSEURS
2.12 SOURCES SECONDAIRES
2.13 HYPOTHÈSES
3 RÉSUMÉ EXÉCUTIF
4 INFORMATIONS PREMIUM
4.1 PESTEL
4.2 MODÈLE DES CINQ FORCES DE PORTER
5 ÉPIDÉMIOLOGIE
6 APERÇUS DE L'INDUSTRIE
6.1 ANALYSE DES BREVETS
6.2 TAUX DE TRAITEMENT MÉDICAMENTEUX PAR MARCHÉS MATURES
6.3 TENDANCES DÉMOGRAPHIQUES : IMPACTS SUR TOUS LES TAUX D'INCIDENCE
6.4 DIAGRAMME DE FLUX DE PATIENTS
6.5 STRATÉGIES DE TARIFICATION CLÉS
6.6 STRATÉGIES CLÉS D'INSCRIPTION DES PATIENTS
7 ANALYSE DU PIPELINE
8 MARCHÉ DE LA NÉVRITIO OPTIQUE AUX ÉTATS-UNIS : RÉGLEMENTATION
8.1 RÉGLEMENTATION AUX ÉTATS-UNIS :
9 APERÇU DU MARCHÉ
9.1 PILOTES
9.1.1 PRÉVALENCE AUGMENTANTE DES TROUBLES OCULAIRES
9.1.2 AUGMENTATION DU VIEILLISSEMENT DE LA POPULATION
9.1.3 AUGMENTATION DES BLESSURES TRAUMATIQUES
9.2 RESTRICTIONS
9.2.1 COÛT ÉLEVÉ ASSOCIÉ AU TRAITEMENT DES TROUBLES DU NERF OPTIQUE
9.2.2 RISQUES ASSOCIÉS AUX DIFFÉRENTES MÉTHODES DE TRAITEMENT
9.3 OPPORTUNITÉS
9.3.1 AUGMENTATION DES DÉPENSES DE SANTÉ
9.3.2 INITIATIVES STRATÉGIQUES DES ACTEURS CLÉS
9.4 DÉFIS
9.4.1 EFFETS NÉGATIFS DES STÉROÏDES SYSTÉMIQUES
9.4.2 MANQUE DE SENSIBILISATION DES GENS CONCERNANT LES DIFFÉRENTS TRAITEMENTS OCULAIRES
10 MARCHÉS AMÉRICAINS DE LA NÉVRIT OPTIQUE, PAR TRAITEMENT
10.1 APERÇU
10.2 CORTICOSTÉROÏDES
10.2.1 MÉTHYLPREDNISOLONE
10.2.2 PREDNISONE
10.2.3 AUTRES
10.3 IMMUNOGLOBULINE IV
10.4 SUPPLÉMENTS
10,5 AUTRES
11 MARCHÉ DE LA NÉVRITIO OPTIQUE AUX ÉTATS-UNIS, PAR DIAGNOSTIC
11.1 APERÇU
11.2 IRM
11.3 TEST SANGUIN
11.4 TOMOGRAPHIE PAR COHÉRENCE OCULAIRE
11.5 PONCTION LOMBAIRE
11.6 AUTRES
12 MARCHÉ DE LA NÉVRITIO OPTIQUE AUX ÉTATS-UNIS, PAR VOIE D'ADMINISTRATION
12.1 APERÇU
12.2 PARENTÉRALE
12.3 ORALE
13 MARCHÉ DE LA NÉVRITIO OPTIQUE AUX ÉTATS-UNIS, PAR UTILISATEUR FINAL
13.1 APERÇU
13.2 HÔPITAUX
13.3 CLINIQUES
13.4 INSTITUTS UNIVERSITAIRES ET DE RECHERCHE
13,5 AUTRES
14 MARCHÉ DE LA NÉVRITIE OPTIQUE AUX ÉTATS-UNIS, PAR CANAL DE DISTRIBUTION
14.1 APERÇU
14.2 PHARMACIE DE L'HÔPITAL
14.3 PHARMACIE DE DÉTAIL
14.4 AUTRES
15 MARCHÉ DE LA NÉVRITIO OPTIQUE AUX ÉTATS-UNIS : PAYSAGE DES ENTREPRISES
15.1 ANALYSE DES ACTIONS DE L'ENTREPRISE : ÉTATS-UNIS
16 ANALYSE SWOT
17 PROFIL DE L'ENTREPRISE
17.1 PFIZER INC.
17.1.1 INSTANTANÉ DE L'ENTREPRISE
17.1.2 ANALYSE DES REVENUS
17.1.3 PORTEFEUILLE DE PRODUITS
17.1.4 ÉVOLUTION RÉCENTE
17.2 NOVARTIS SA
17.2.1 INSTANTANÉ DE L'ENTREPRISE
17.2.2 ANALYSE DES REVENUS
17.2.3 PORTEFEUILLE DE PRODUITS
17.2.4 ÉVOLUTION RÉCENTE
17.3 BOEHRINGER INGELHEIM INTERNATIONAL GMBH.
17.3.1 INSTANTANÉ DE L'ENTREPRISE
17.3.2 ANALYSE DES REVENUS
17.3.3 PORTEFEUILLE DE PRODUITS
17.3.4 ÉVOLUTION RÉCENTE
17.4 VIATRIS INC.
17.4.1 INSTANTANÉ DE L'ENTREPRISE
17.4.2 ANALYSE DES REVENUS
17.4.3 PORTEFEUILLE DE PRODUITS
17.4.4 ÉVOLUTION RÉCENTE
17,5 BAUSCH & LOMB INCORPORATED
17.5.1 INSTANTANÉ DE L'ENTREPRISE
17.5.2 ANALYSE DES REVENUS
17.5.3 PORTEFEUILLE DE PRODUITS
17.5.4 ÉVOLUTIONS RÉCENTES
17.6 BRISTOL – MYERS SQUIBB COMPANY
17.6.1 INSTANTANÉ DE L'ENTREPRISE
17.6.2 ANALYSE DES REVENUS
17.6.3 PORTEFEUILLE DE PRODUITS
17.6.4 ÉVOLUTION RÉCENTE
17.7 FRESENIUS KABI États-Unis
17.7.1 INSTANTANÉ DE L'ENTREPRISE
17.7.2 ANALYSE DES REVENUS
17.7.3 PORTEFEUILLE DE PRODUITS
17.7.4 ÉVOLUTION RÉCENTE
17,8 ABBVIE INC.
17.8.1 INSTANTANÉ DE L'ENTREPRISE
17.8.2 ANALYSE DES REVENUS
17.8.3 PORTEFEUILLE DE PRODUITS
17.8.4 ÉVOLUTION RÉCENTE
17.9 ADVACAREPHARMA
17.9.1 INSTANTANÉ DE L'ENTREPRISE
17.9.2 PORTEFEUILLE DE PRODUITS
17.9.3 ÉVOLUTION RÉCENTE
17.1 SOCIÉTÉ D'EXPLOITATION AKORN LLC.
17.10.1 INSTANTANÉ DE L'ENTREPRISE
17.10.2 PORTEFEUILLE DE PRODUITS
17.10.3 ÉVOLUTION RÉCENTE
17.11 AMNEAL PHARMACEUTICALS LLC
17.11.1 INSTANTANÉ DE L'ENTREPRISE
17.11.2 ANALYSE DES REVENUS
17.11.3 PORTEFEUILLE DE PRODUITS
17.11.4 ÉVOLUTION RÉCENTE
17.12 GSK PLC
17.12.1 INSTANTANÉ DE L'ENTREPRISE
17.12.2 ANALYSE DES REVENUS
17.12.3 PORTEFEUILLE DE PRODUITS
17.12.4 ÉVOLUTION RÉCENTE
17.13 HIKMA PHARMACEUTICALS PLC
17.13.1 INSTANTANÉ DE L'ENTREPRISE
17.13.2 ANALYSE DES REVENUS
17.13.3 PORTEFEUILLE DE PRODUITS
17.13.4 ÉVOLUTION RÉCENTE
17.14 JUBILANT CADISTA
17.14.1 INSTANTANÉ DE L'ENTREPRISE
17.14.2 PORTEFEUILLE DE PRODUITS
17.14.3 ÉVOLUTION RÉCENTE
17.15 MERCK & CO., INC.
17.15.1 INSTANTANÉ DE L'ENTREPRISE
17.15.2 ANALYSE DES REVENUS
17.15.3 PORTEFEUILLE DE PRODUITS
17.15.4 ÉVOLUTIONS RÉCENTES
17.16 NOVITIUM PHARMA
17.16.1 INSTANTANÉ DE L'ENTREPRISE
17.16.2 PORTEFEUILLE DE PRODUITS
17.16.3 ÉVOLUTION RÉCENTE
17.17 TEVA PHARMACEUTICAL INDUSTRIES LTD.
17.17.1 INSTANTANÉ DE L'ENTREPRISE
17.17.2 ANALYSE DES REVENUS
17.17.3 PORTEFEUILLE DE PRODUITS
17.17.4 ÉVOLUTION RÉCENTE
17.18 ACCURE THERAPEUTIC
17.18.1 INSTANTANÉ DE L'ENTREPRISE
17.18.2 PORTEFEUILLE DE PRODUITS
17.18.3 ÉVOLUTION RÉCENTE
17.19 ACORDA THÉRAPEUTIQUES INC.
17.19.1 INSTANTANÉ DE L'ENTREPRISE
17.19.2 ANALYSE DES REVENUS
17.19.3 PORTEFEUILLE DE PRODUITS
17.19.4 ÉVOLUTION RÉCENTE
17.2 BIOGEN INC.
17.20.1 INSTANTANÉ DE L'ENTREPRISE
17.20.2 ANALYSE DES REVENUS
17.20.3 PORTEFEUILLE DE PRODUITS
17.20.4 ÉVOLUTION RÉCENTE
17.21 MALLINCKRDOT PHARMACEUTICALS
17.21.1 INSTANTANÉ DE L'ENTREPRISE
17.21.2 ANALYSE DES REVENUS
17.21.3 PORTEFEUILLE DE PRODUITS
17.21.4 ÉVOLUTION RÉCENTE
17.22 NOVEOME BIOTHERAPEUTICS, INC.
17.22.1 INSTANTANÉ DE L'ENTREPRISE
17.22.2 PORTEFEUILLE DE PRODUITS
17.22.3 ÉVOLUTION RÉCENTE
17.23 SANOFI
17.23.1 INSTANTANÉ DE L'ENTREPRISE
17.23.2 ANALYSE DES REVENUS
17.23.3 PORTEFEUILLE DE PRODUITS
17.23.4 ÉVOLUTIONS RÉCENTES
18 QUESTIONNAIRE
19 RAPPORTS CONNEXES
Liste des tableaux
TABLEAU 1 MARCHÉ DE LA NÉVRITIO OPTIQUE AUX ÉTATS-UNIS, ANALYSE DU PIPELINE
TABLEAU 2 MARCHÉ DE LA NÉVRIT OPTIQUE AUX ÉTATS-UNIS, PAR TRAITEMENT, 2020-2029 (EN MILLIONS USD)
TABLEAU 3 MARCHÉ DE LA NÉVRIT OPTIQUE AUX ÉTATS-UNIS, PAR TRAITEMENT, 2020-2029 (VOLUME EN MILLIONS)
TABLEAU 4 : MARCHÉ DES CORTICOSTÉROÏDES SUR LE MARCHÉ DE LA NÉVRIT OPTIQUE AUX ÉTATS-UNIS, PAR TRAITEMENT, 2020-2029 (EN MILLIONS USD)
TABLEAU 5 MARCHÉ DE LA NÉVRITIO OPTIQUE AUX ÉTATS-UNIS, PAR DIAGNOSTIC, 2020-2029 (EN MILLIONS USD)
TABLEAU 6 MARCHÉ DE LA NÉVRITIO OPTIQUE AUX ÉTATS-UNIS, PAR VOIE D'ADMINISTRATION, 2020-2029 (EN MILLIONS USD)
TABLEAU 7 MARCHÉ DE LA NÉVRITIOLOGIE OPTIQUE AUX ÉTATS-UNIS, PAR UTILISATEUR FINAL, 2020-2029 (EN MILLIONS USD)
TABLEAU 8 MARCHÉ AMÉRICAIN DE LA NÉVRIT OPTIQUE, PAR CANAL DE DISTRIBUTION, 2020-2029 (EN MILLIONS USD)
Liste des figures
FIGURE 1 MARCHÉ DE LA NÉVRITIO OPTIQUE AUX ÉTATS-UNIS : SEGMENTATION
FIGURE 2 MARCHÉ AMÉRICAIN DE LA NÉVRIT OPTIQUE : TRIANGULATION DES DONNÉES
FIGURE 3 MARCHÉ DE LA NÉVRITIOLOGIE OPTIQUE AUX ÉTATS-UNIS : ANALYSE DROC
FIGURE 4 MARCHÉ AMÉRICAIN DE LA NÉVRIT OPTIQUE : ANALYSE DU MARCHÉ MONDIAL ET RÉGIONAL
FIGURE 5 MARCHÉ DE LA NÉVRITIOLOGIE OPTIQUE AUX ÉTATS-UNIS : ANALYSE DE LA RECHERCHE DES ENTREPRISES
FIGURE 6 MARCHÉ DE LA NÉVRITIOLOGIE OPTIQUE AUX ÉTATS-UNIS : DONNÉES DÉMOGRAPHIQUES DES ENTRETIENS
FIGURE 7 MARCHÉ DE LA NÉVRITIOLOGIE OPTIQUE AUX ÉTATS-UNIS : GRILLE DE POSITIONNEMENT DU MARCHÉ DBMR
FIGURE 8 MARCHÉ DE LA NÉVRITIE OPTIQUE AUX ÉTATS-UNIS : GRILLE DE COUVERTURE DES UTILISATEURS FINAUX DU MARCHÉ
FIGURE 9 MARCHÉ DE LA NÉVRITIOLOGIE OPTIQUE AUX ÉTATS-UNIS : ANALYSE DES PARTS DE FOURNISSEURS
FIGURE 10 MARCHÉ DE LA NÉVRITIO OPTIQUE AUX ÉTATS-UNIS : SEGMENTATION
FIGURE 11 LA PRÉVALENCE CROISSANTE DES TROUBLES OCULAIRES ET L'AUGMENTATION DE LA POPULATION GÉRIATRIQUE DEVRAIENT STIMULER LE MARCHÉ DE LA NÉVRIT OPTIQUE AUX ÉTATS-UNIS AU COURS DE LA PÉRIODE DE PRÉVISION DE 2022 À 2029
FIGURE 12 LE SEGMENT DES CORTICOSTÉROÏDES DEVRAIT REPRÉSENTER LA PLUS GRANDE PART DU MARCHÉ DE LA NÉVRIT OPTIQUE AUX ÉTATS-UNIS EN 2022 ET 2029
FIGURE 13 MOTEURS, CONTRAINTES, OPPORTUNITÉS ET DÉFIS DU MARCHÉ AMÉRICAIN DE LA NÉVRIT OPTIQUE
FIGURE 14 MARCHÉ DE LA NÉVRIT OPTIQUE AUX ÉTATS-UNIS : PAR TRAITEMENT, 2021
FIGURE 15 MARCHÉ DE LA NÉVRITIO OPTIQUE AUX ÉTATS-UNIS : PAR TRAITEMENT, 2022-2029 (EN MILLIONS USD)
FIGURE 16 MARCHÉ DE LA NÉVRITIO OPTIQUE AUX ÉTATS-UNIS : PAR TRAITEMENT, TCAC (2022-2029)
FIGURE 17 MARCHÉ DE LA NÉVRIT OPTIQUE AUX ÉTATS-UNIS : PAR TRAITEMENT, COURBE DE LIGNE DE VIE
FIGURE 18 MARCHÉ DE LA NÉVRITIE OPTIQUE AUX ÉTATS-UNIS : PAR DIAGNOSTIC, 2021
FIGURE 19 MARCHÉ DE LA NÉVRITIOLOGIE OPTIQUE AUX ÉTATS-UNIS : PAR DIAGNOSTIC, 2022-2029 (EN MILLIONS USD)
FIGURE 20 MARCHÉ DE LA NÉVRITIOLOGIE OPTIQUE AUX ÉTATS-UNIS : PAR DIAGNOSTIC, TCAC (2022-2029)
FIGURE 21 MARCHÉ DE LA NÉVRIT OPTIQUE AUX ÉTATS-UNIS : PAR DIAGNOSTIC, COURBE DE LIGNE DE VIE
FIGURE 22 MARCHÉ DE LA NÉVRITIO OPTIQUE AUX ÉTATS-UNIS : PAR VOIE D'ADMINISTRATION, 2021
FIGURE 23 MARCHÉ DE LA NÉVRITIOLOGIE OPTIQUE AUX ÉTATS-UNIS : PAR VOIE D'ADMINISTRATION, 2022-2029 (EN MILLIONS USD)
FIGURE 24 MARCHÉ DE LA NÉVRITIOLOGIE OPTIQUE AUX ÉTATS-UNIS : PAR VOIE D'ADMINISTRATION, TCAC (2022-2029)
FIGURE 25 MARCHÉ DE LA NÉVRIT OPTIQUE AUX ÉTATS-UNIS : PAR VOIE D'ADMINISTRATION, COURBE DE LIGNE DE VIE
FIGURE 26 MARCHÉ DE LA NÉVRITIOLOGIE OPTIQUE AUX ÉTATS-UNIS : PAR UTILISATEUR FINAL, 2021
FIGURE 27 MARCHÉ DE LA NÉVRITIOLOGIE OPTIQUE AUX ÉTATS-UNIS : PAR UTILISATEUR FINAL, 2022-2029 (EN MILLIONS USD)
FIGURE 28 MARCHÉ DE LA NÉVRITIOLOGIE OPTIQUE AUX ÉTATS-UNIS : PAR UTILISATEUR FINAL, TCAC (2022-2029)
FIGURE 29 MARCHÉ DE LA NÉVRITIE OPTIQUE AUX ÉTATS-UNIS : PAR UTILISATEUR FINAL, COURBE DE LIGNE DE VIE
FIGURE 30 MARCHÉ DE LA NÉVRITIE OPTIQUE AUX ÉTATS-UNIS : PAR CANAL DE DISTRIBUTION, 2021
FIGURE 31 MARCHÉ DE LA NÉVRITIOLOGIE OPTIQUE AUX ÉTATS-UNIS : PAR CANAL DE DISTRIBUTION, 2022-2029 (EN MILLIONS USD)
FIGURE 32 MARCHÉ DE LA NÉVRITIE OPTIQUE AUX ÉTATS-UNIS : PAR CANAL DE DISTRIBUTION, TCAC (2022-2029)
FIGURE 33 MARCHÉ DE LA NÉVRITIE OPTIQUE AUX ÉTATS-UNIS : PAR CANAL DE DISTRIBUTION, COURBE DE LIGNE DE VIE
FIGURE 34 MARCHÉ DE LA NÉVRITIOLOGIE OPTIQUE AUX ÉTATS-UNIS : PART DE L'ENTREPRISE EN 2021 (%)
Méthodologie de recherche
La collecte de données et l'analyse de l'année de base sont effectuées à l'aide de modules de collecte de données avec des échantillons de grande taille. L'étape consiste à obtenir des informations sur le marché ou des données connexes via diverses sources et stratégies. Elle comprend l'examen et la planification à l'avance de toutes les données acquises dans le passé. Elle englobe également l'examen des incohérences d'informations observées dans différentes sources d'informations. Les données de marché sont analysées et estimées à l'aide de modèles statistiques et cohérents de marché. De plus, l'analyse des parts de marché et l'analyse des tendances clés sont les principaux facteurs de succès du rapport de marché. Pour en savoir plus, veuillez demander un appel d'analyste ou déposer votre demande.
La méthodologie de recherche clé utilisée par l'équipe de recherche DBMR est la triangulation des données qui implique l'exploration de données, l'analyse de l'impact des variables de données sur le marché et la validation primaire (expert du secteur). Les modèles de données incluent la grille de positionnement des fournisseurs, l'analyse de la chronologie du marché, l'aperçu et le guide du marché, la grille de positionnement des entreprises, l'analyse des brevets, l'analyse des prix, l'analyse des parts de marché des entreprises, les normes de mesure, l'analyse globale par rapport à l'analyse régionale et des parts des fournisseurs. Pour en savoir plus sur la méthodologie de recherche, envoyez une demande pour parler à nos experts du secteur.
Personnalisation disponible
Data Bridge Market Research est un leader de la recherche formative avancée. Nous sommes fiers de fournir à nos clients existants et nouveaux des données et des analyses qui correspondent à leurs objectifs. Le rapport peut être personnalisé pour inclure une analyse des tendances des prix des marques cibles, une compréhension du marché pour d'autres pays (demandez la liste des pays), des données sur les résultats des essais cliniques, une revue de la littérature, une analyse du marché des produits remis à neuf et de la base de produits. L'analyse du marché des concurrents cibles peut être analysée à partir d'une analyse basée sur la technologie jusqu'à des stratégies de portefeuille de marché. Nous pouvons ajouter autant de concurrents que vous le souhaitez, dans le format et le style de données que vous recherchez. Notre équipe d'analystes peut également vous fournir des données sous forme de fichiers Excel bruts, de tableaux croisés dynamiques (Fact book) ou peut vous aider à créer des présentations à partir des ensembles de données disponibles dans le rapport.

