
Global Mri Scanner Market
Market Size in USD Billion
 USD
6.88 Billion
USD
10.15 Billion
2024
2032
USD
6.88 Billion
USD
10.15 Billion
2024
2032
| 2025 - 2032 | |
| USD 6.88 Billion | |
| USD 10.15 Billion | |
| % | |
|
MRI Scanner Market Analysis
Growing geriatric population and rising per capita income are the major drivers which have propelled the demand of the MRI scanner market in the forecast period.
MRI Scanner Market Size
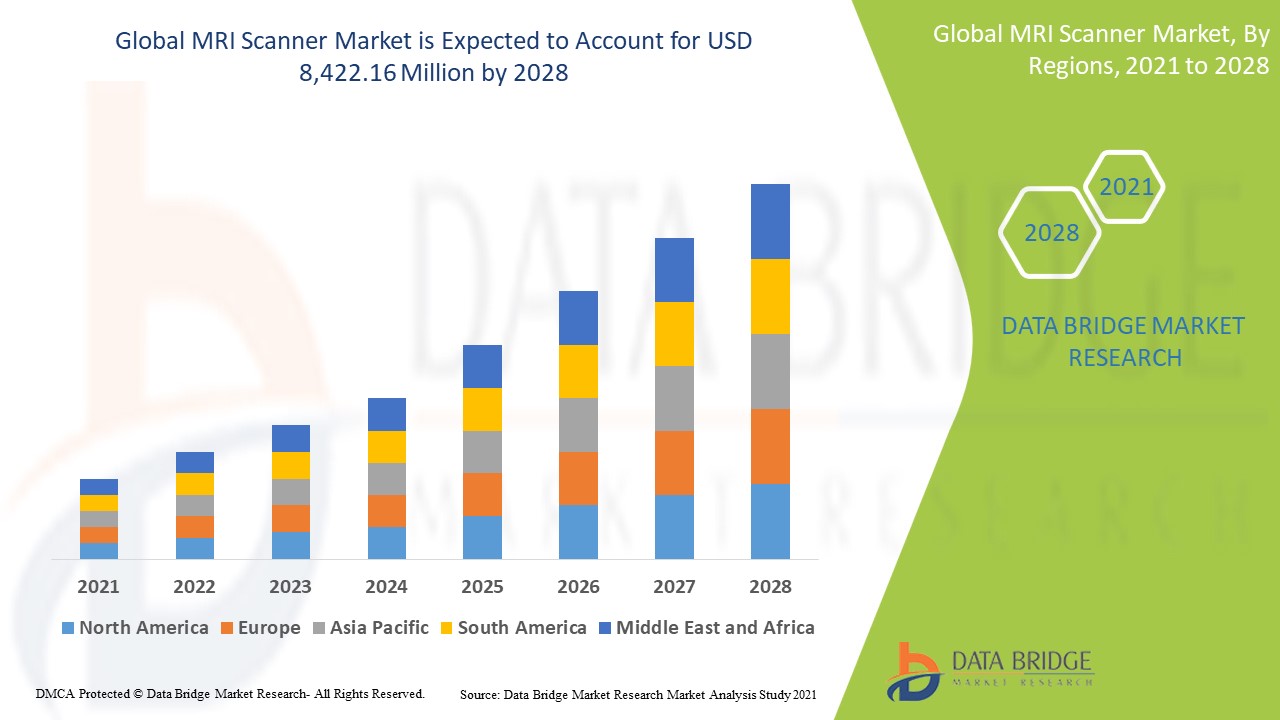
The global MRI scanner market size was valued at USD 6.88 billion in 2024 and is projected to reach USD 10.15 billion by 2032, with a CAGR of 4.98% during the forecast period of 2025 to 2032. In addition to the insights on market scenarios such as market value, growth rate, segmentation, geographical coverage, and major players, the market reports curated by the Data Bridge Market Research also include depth expert analysis, patient epidemiology, pipeline analysis, pricing analysis, and regulatory framework.
Report Scope and MRI Scanner Market Segmentation
|
Attributes |
MRI Scanner Key Market Insights |
|
Segments Covered |
|
|
Countries Covered |
U.S., Canada and Mexico in North America, Germany, France, U.K., Netherlands, Switzerland, Belgium, Russia, Italy, Spain, Turkey, Rest of Europe in Europe, China, Japan, India, South Korea, Singapore, Malaysia, Australia, Thailand, Indonesia, Philippines, Rest of Asia-Pacific (APAC) in the Asia-Pacific (APAC), Saudi Arabia, U.A.E., South Africa, Egypt, Israel, Rest of Middle East and Africa (MEA) as a part of Middle East and Africa (MEA), Brazil, Argentina and Rest of South America as part of South America. |
|
Key Market Players |
Aspect Imaging (Israel), CANON MEDICAL SYSTEMS CORPORATION (a subsidiary of Canon Inc.) (Japan), Siemens Healthcare GmbH (Germany), GE Healthcare (U.S.), Hitachi, Ltd. (Japan), Koninklijke Philips N.V. (Netherlands), Neusoft Corporation (China), ESAOTE SPA (Italy), FONAR Corp. (U.S.), Synaptive Medical (Canada), AllTech Medical Systems (China), Shanghai United Imaging Medical Technology Co., Ltd. (China), Medonica Co. LTD (South Korea), IMRIS (U.S.), Promaxo (U.S.), Aurora Healthcare US Corp (U.S.), SG HealthCare (South Korea), Elekta AB (Sweden), Beijing Wandong Medical Technology Co., Ltd. (China), ASG Superconductors spa (Italy), MinFound Medical Systems Co., Ltd. (China), Hyperfine (U.S.), SternMed GmbH (Germany), Time Medical Holding (Hong Kong) |
|
Value Added Data Infosets |
In addition to the insights on market scenarios such as market value, growth rate, segmentation, geographical coverage, and major players, the market reports curated by the Data Bridge Market Research also include depth expert analysis, patient epidemiology, pipeline analysis, pricing analysis, and regulatory framework. |
MRI Scanner Market Definition
MRI scanner is a type of advanced medical imaging technique which uses magnetic fields, magnetic field gradients and radio waves to capture the images of patients’ inner body. MRI Scanner has several advantages as compared to other imaging modalities. The MRI scanner includes an electromagnetic field and large static magnetic field to produce detailed images.
MRI Scanner Market Dynamics
Drivers
Increasing prevalence chronic diseases is acting as a driver for the growth of the MRI scanner market. Increase in use of refurbished and reused MRI products is acting as a restraint for the MRI scanner market.
Opportunities
Increasing healthcare expenditure and infrastructure across the world is acting as an opportunity for the MRI scanner market.
Restraints/Challenges
Strict regulations and standards for the approval and commercialization of MRI devices are acting as challenge for the MRI scanner market.
This market report provides details of new recent developments, trade regulations, import-export analysis, production analysis, value chain optimization, market share, impact of domestic and localized market players, analyses opportunities in terms of emerging revenue pockets, changes in market regulations, strategic market growth analysis, market size, category market growths, application niches and dominance, product approvals, product launches, geographic expansions, technological innovations in the market. To gain more info on the market contact Data Bridge Market Research for an Analyst Brief, our team will help you take an informed market decision to achieve market growth.
MRI Scanner Market Scope
The market is segmented on the basis of type, product, application, end user and distribution channel. The growth amongst these segments will help you analyse meagre growth segments in the industries and provide the users with a valuable market overview and market insights to help them make strategic decisions for identifying core market applications.
Type
- Portable Type
- Desktop Type
Product
- Closed MRI Systems
- Open MRI Systems
Application
- Oncology
- Neurology
- Cardiology
- Pelvic and Abdominal
- Musculoskeletal
- Other Applications
End User
- Hospital
- Clinic
- Ambulatory Surgical Centers
- Scientific Research
- Other
Distribution Channel
- Direct Tender
- Retail Sales
MRI Scanner Market Regional Analysis
The market is analysed and market size insights and trends are provided by country, type, product, application, end user and distribution channel as referenced above.
The countries covered in the market report are U.S., Canada and Mexico in North America, Germany, France, U.K., Netherlands, Switzerland, Belgium, Russia, Italy, Spain, Turkey, Rest of Europe in Europe, China, Japan, India, South Korea, Singapore, Malaysia, Australia, Thailand, Indonesia, Philippines, Rest of Asia-Pacific (APAC) in the Asia-Pacific (APAC), Saudi Arabia, U.A.E., South Africa, Egypt, Israel, Rest of Middle East and Africa (MEA) as a part of Middle East and Africa (MEA), Brazil, Argentina and Rest of South America as part of South America.
The U.S. is dominating in the North America MRI scanner market as the desktop type segment in North America region is expected to grow with the highest growth rate in the forecast period of 2025 to 2032 owing to growing usage of MRI scanner during diagnosis. Japan is the leading country in the growth of the Asia-Pacific MRI scanner market due to growing geriatric population as well as technological advancements in the healthcare sector. The U.K. is dominating in the Europe MRI scanner market owing to escalation in healthcare expenditure in the region.
The country section of the report also provides individual market impacting factors and changes in regulation in the market domestically that impacts the current and future trends of the market. Data points such as down-stream and upstream value chain analysis, technical trends and porter's five forces analysis, case studies are some of the pointers used to forecast the market scenario for individual countries. Also, the presence and availability of global brands and their challenges faced due to large or scarce competition from local and domestic brands, impact of domestic tariffs and trade routes are considered while providing forecast analysis of the country data.
MRI Scanner Market Share
The market competitive landscape provides details by competitor. Details included are company overview, company financials, revenue generated, market potential, investment in research and development, new market initiatives, global presence, production sites and facilities, production capacities, company strengths and weaknesses, product launch, product width and breadth, application dominance. The above data points provided are only related to the companies' focus related to market.
MRI Scanner Market Leaders Operating in the Market Are:
- Aspect Imaging (Israel)
- CANON MEDICAL SYSTEMS CORPORATION (a subsidiary of Canon Inc.) (Japan)
- Siemens Healthcare GmbH (Germany)
- GE Healthcare (U.S.)
- Hitachi, Ltd. (Japan)
- Koninklijke Philips N.V. (Netherlands)
- Neusoft Corporation (China)
- ESAOTE SPA (Italy)
- FONAR Corp. (U.S.)
- Synaptive Medical (Canada)
- AllTech Medical Systems (China)
- Shanghai United Imaging Medical Technology Co., Ltd. (China)
- Medonica Co. LTD (South Korea)
- IMRIS (U.S.)
- Promaxo (U.S.)
- Aurora Healthcare US Corp (U.S.)
- SG HealthCare (South Korea)
- Elekta AB (Sweden)
- Beijing Wandong Medical Technology Co., Ltd. (China)
- ASG Superconductors spa (Italy)
- MinFound Medical Systems Co., Ltd. (China)
- Hyperfine (U.S.)
- SternMed GmbH (Germany)
- Time Medical Holding (Hong Kong)
Latest Developments in MRI Scanner Market
- In December 2019, Siemens Healthcare GmbH announced that they have launched multiple software assistants based on artificial intelligence (AI) which are specially designed to free radiologists from the burden of performing routine activities during magnetic resonance imaging (MRI) examinations. After launching such type of innovative software for magnetic resonance imaging (MRI), the company enhanced the credibility of their product portfolio.
SKU-

- Interactive Data Analysis Dashboard
- Company Analysis Dashboard for high growth potential opportunities
- Research Analyst Access for customization & queries
- Competitor Analysis with Interactive dashboard
- Latest News, Updates & Trend analysis
- Harness the Power of Benchmark Analysis for Comprehensive Competitor Tracking
Data collection and base year analysis are done using data collection modules with large sample sizes. The stage includes obtaining market information or related data through various sources and strategies. It includes examining and planning all the data acquired from the past in advance. It likewise envelops the examination of information inconsistencies seen across different information sources. The market data is analysed and estimated using market statistical and coherent models. Also, market share analysis and key trend analysis are the major success factors in the market report. To know more, please request an analyst call or drop down your inquiry.
The key research methodology used by DBMR research team is data triangulation which involves data mining, analysis of the impact of data variables on the market and primary (industry expert) validation. Data models include Vendor Positioning Grid, Market Time Line Analysis, Market Overview and Guide, Company Positioning Grid, Patent Analysis, Pricing Analysis, Company Market Share Analysis, Standards of Measurement, Global versus Regional and Vendor Share Analysis. To know more about the research methodology, drop in an inquiry to speak to our industry experts.
Data Bridge Market Research is a leader in advanced formative research. We take pride in servicing our existing and new customers with data and analysis that match and suits their goal. The report can be customized to include price trend analysis of target brands understanding the market for additional countries (ask for the list of countries), clinical trial results data, literature review, refurbished market and product base analysis. Market analysis of target competitors can be analyzed from technology-based analysis to market portfolio strategies. We can add as many competitors that you require data about in the format and data style you are looking for. Our team of analysts can also provide you data in crude raw excel files pivot tables (Fact book) or can assist you in creating presentations from the data sets available in the report.


