アジア太平洋地域の電気集塵機市場規模、シェア、トレンド分析レポート
Market Size in USD Billion
CAGR :
% 
 USD
2.29 Billion
USD
3.54 Billion
2024
2032
USD
2.29 Billion
USD
3.54 Billion
2024
2032
| 2025 –2032 | |
| USD 2.29 Billion | |
| USD 3.54 Billion | |
| % | |
|
アジア太平洋地域の電気集塵機市場:タイプ別(乾式ESPおよび湿式ESP)、提供製品別(ハードウェア、ソフトウェア、サービス)、用途別(石炭火力発電、電気アーク炉、ガスタービン、固形廃棄物焼却炉、産業用発電、その他)、エンドユーザー別(発電、金属加工、セメント、製造、化学、石油化学、海洋、その他) - 2032年までの業界動向と予測
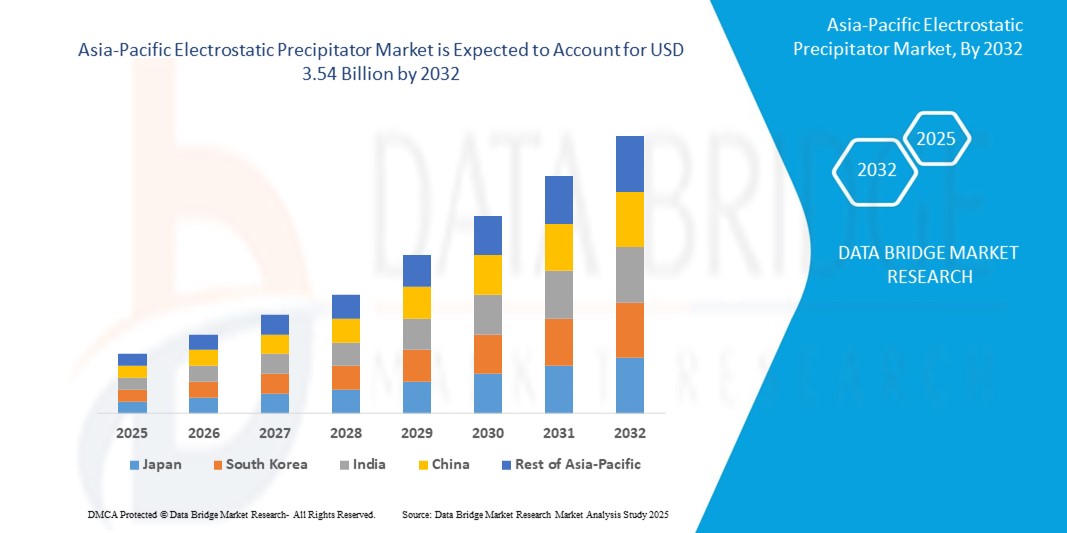
アジア太平洋地域の電気集塵機市場規模
- アジア太平洋地域の電気集塵機市場規模は2024年に22億9000万米ドルと評価され、予測期間中に5.60%のCAGRで成長し、2032年には35億4000万米ドル に達すると予想されています 。
- 市場の成長は、主要経済国における大気汚染規制の強化、発電やセメント製造を含む産業インフラの拡大、地域全体の公衆衛生と環境の質を向上させるための粒子状物質の排出削減に対する政府の重点化によって主に促進されている。
- さらに、大気汚染の健康への影響に関する国民の意識の高まりと、インド、中国、東南アジアなどの新興国における高度な排出制御技術の導入の増加により、市場の成長軌道が大幅に加速しています。
アジア太平洋地域の電気集塵機市場分析
- アジア太平洋地域の電気集塵機市場は、発電やセメント製造などの産業分野における高度な空気ろ過の需要増加により、着実な成長を遂げています。
- 製造ユニット全体の汚染制御システムの近代化への投資により、この地域では電気集塵機の導入が着実に進んでいる。
- 中国は、大規模な産業活動、エネルギー需要の増加、厳格な大気質管理政策に牽引され、2024年にアジア太平洋地域の電気集塵機市場で最大の市場収益シェアを占めました。
- 日本は、厳しい環境規制、クリーン技術への強い重点、エネルギー効率が高く排出ガスの少ない機器で産業施設を近代化する取り組みの増加により、アジア太平洋地域の電気集塵機市場で最も高い複合年間成長率(CAGR)を達成すると予想されています。
- 乾式ESPセグメントは、発電所、セメント窯、製鉄所などの高温産業用途での広範な利用を背景に、2024年には68.5%という最大の収益シェアで市場を席巻しました。乾式ESPは、水を使用せずに排ガスから微粒子を除去するのに効果的であり、廃棄物処理の問題を最小限に抑え、メンテナンスコストを削減します。石炭ベースのエネルギー生産における効率的な微粒子制御に対する強い需要は、引き続きこのセグメントの成長を支えています。
レポートの範囲とアジア太平洋地域の電気集塵機市場のセグメンテーション
|
属性 |
アジア太平洋地域の電気集塵機の主要市場分析 |
|
対象セグメント |
|
|
対象国 |
アジア太平洋
|
|
主要な市場プレーヤー |
|
|
市場機会 |
• 排出基準を満たすための海運・鉄道部門での利用増加 |
|
付加価値データ情報セット |
データブリッジマーケットリサーチがまとめた市場レポートには、市場価値、成長率、セグメンテーション、地理的範囲、主要企業などの市場シナリオに関する洞察に加えて、専門家による詳細な分析、地理的に表された企業別の生産量と生産能力、販売業者とパートナーのネットワークレイアウト、詳細かつ最新の価格動向分析、サプライチェーンと需要の不足分析も含まれています。 |
アジア太平洋地域の電気集塵機市場動向
「産業用途におけるハイブリッド電気集塵装置への移行の拡大」
- 静電ろ過と機械ろ過を統合したハイブリッド静電集塵機(ESP)は、超微粒子を効率的に除去する能力があるため、ますます採用が進んでいます。
- 例えば、インドの発電所に設置されたハイブリッドESPは、PM2.5の捕捉において顕著な改善を示している。
- ハイブリッドESPは、排出量が多いことからセメントや火力発電などの分野で需要が急増しています。東南アジアの大手セメントメーカーは、新たな排出規制に準拠するため、ハイブリッドユニットへのアップグレードを開始しています。
- ハイブリッドシステムは、プラントの出力が変動してもより一貫した粒子除去を提供するため、運用負荷が変動する施設に最適です。
- 中国やインドなどの国では、大気質規制が厳しくなり、業界は規制を遵守するためにハイブリッドESPなどの先進的なソリューションを導入するよう迫られています。
- 地域全体の産業界は、効率性を向上させ、進化する環境基準を満たすために、古いESPをハイブリッド技術で改造することに投資している。
アジア太平洋地域の電気集塵機市場の動向
ドライバ
「産業大気汚染抑制に向けた規制圧力の強化」
- アジア太平洋地域の電気集塵機市場は、主に中国、インド、インドネシアなどの急速に発展している国々における産業大気汚染を抑制するための取り組みの強化によって牽引されています。
- 中国のブルースカイ保護キャンペーンやインドの国家クリーンエアプログラム(NCAP)などの規制枠組みでは、汚染度の高いセクター全体にESPを含む高度な排出制御技術の導入を義務付けている。
- 発電、セメント、金属加工、化学などの産業は、排出基準を満たし、規制上の罰金を回避するためにろ過システムをアップグレードするよう、ますます圧力を受けています。
- 超微粒子(PM2.5以下)を捕捉できるシステムへの需要の高まりにより、公共施設と民間施設の両方で高効率ESPの導入が加速しています。
- 環境持続可能性への取り組みとESG目標は、企業にクリーンテクノロジーへの投資を促し、国内のESPメーカーは地域のニーズを満たし、コスト障壁を減らすために提供を拡大しています。
抑制/挑戦
「高額な資本コストと維持費が導入を阻んでいる」
- 電気集塵機(ESP)システムの高額な資本コストは、アジア太平洋市場、特にコストに敏感な中小規模の産業にとって依然として大きな課題となっています。
- ESP、特に先進型やハイブリッド型のものは、高電圧電源装置、放電電極、高度な制御システムなどの部品に多額の投資が必要となり、初期調達コストが上昇する。
- 発展途上国の中小企業は、環境規制にもかかわらず、これらの費用を正当化するのに苦労することが多く、抵抗や導入の遅れにつながっています。
- 特に鉄鋼やセメント製造などの粉塵の多い用途では、熟練した労働力、定期的なシステムメンテナンス、電極などの重要な部品の交換が必要となるため、運用コストはさらに高くなります。
- 電力インフラの信頼性が低い地域では、不安定な電力供給によりESPの性能と寿命が損なわれる可能性があり、一部の業界では、メンテナンスが容易だが時間の経過とともに粒子除去効率が低下するバグハウスフィルターなどのより安価な代替手段を選択するようになっています。
アジア太平洋地域の電気集塵機市場の展望
アジア太平洋地域の電気集塵装置市場は、タイプ、提供、用途、およびエンドユーザーに基づいて区分されています。
- タイプ別
アジア太平洋地域の電気集塵機市場は、種類別に乾式ESPと湿式ESPに分類されます。乾式ESPセグメントは、発電所、セメント窯、製鉄所などの高温産業用途での幅広い使用を背景に、2024年には68.5%という最大の収益シェアで市場を席巻しました。乾式ESPは、水を使用せずに排ガスから微粒子を除去する効果があり、廃棄物処理の問題を最小限に抑え、メンテナンスコストを削減します。石炭火力発電における効率的な微粒子制御に対する強い需要が、このセグメントの成長を支え続けています。
湿式ESPセグメントは、廃棄物焼却、金属精錬、化学製造などの産業における粘着性粒子や湿潤粒子の処理に適していることから、2025年から2032年にかけて最も高い成長率を示すと予想されています。湿式ESPは、サブミクロン粒子、酸性ミスト、ヒュームの捕捉において優れた性能を発揮し、地域全体の厳しい排出規制に対応します。
- 提供することで
アジア太平洋地域の電気集塵機市場は、提供内容に基づき、ハードウェア、ソフトウェア、サービスの3つに分類されます。エネルギー分野および産業分野における電気集塵機ユニットの継続的な導入に支えられ、ハードウェア分野は2024年に最大の収益シェアを獲得しました。老朽化したESPインフラを高度なハードウェアソリューションに置き換えるニーズの高まりが、成長をさらに加速させています。
サービス分野は、排出基準の遵守を確保し、機器の寿命を延ばすための定期的なメンテナンス、改修、パフォーマンスの最適化の需要の増加により、2025年から2032年にかけて最も高い成長率を示すことが予想されています。
- アプリケーション別
アジア太平洋地域の電気集塵装置市場は、用途別に石炭火力発電、電気アーク炉、ガスタービン、固形廃棄物焼却炉、産業用発電、その他に分類されます。中国やインドなどの国々で稼働中の火力発電所が多数あるため、2024年には石炭火力発電セグメントが市場を席巻しました。電気集塵装置は、これらの発電所からの粒子状物質の排出を削減する上で重要な役割を果たし、地域の汚染規制に準拠しています。
固形廃棄物焼却炉セグメントは、都市化の進展と効果的な廃棄物発電ソリューションへの需要の高まりを背景に、2025年から2032年にかけて最も高い成長率を達成すると予想されています。各国政府がよりクリーンな焼却技術への投資を進めるにつれ、高性能ESPシステムへの需要は着実に高まっています。
- エンドユーザー別
アジア太平洋地域の電気集塵機市場は、エンドユーザー別に、発電、金属加工、セメント、製造、化学、石油化学、海洋、その他に分類されます。発電分野は、石炭火力発電施設における粒子状物質の排出削減にESPが広く利用されているため、2024年には最大の市場シェアを占めました。排出に関する厳格な規制枠組みは、電力会社による効率的なESPシステムのアップグレードまたは導入を促しています。
化学分野は、よりクリーンな生産方法と汚染制御への関心の高まりを背景に、2025年から2032年にかけて最も高い成長率を達成すると予想されています。化学工場では、地域の環境政策の進化に合わせて、微粒子、酸性ミスト、プロセス蒸気の排出を制御するためにESP(電気集塵装置)を導入しています。
アジア太平洋地域の電気集塵機市場の地域分析
- 中国は、大規模な産業活動、エネルギー需要の増加、厳格な大気質管理政策に牽引され、2024年にアジア太平洋地域の電気集塵機市場で最大の市場収益シェアを占めました。
- 中国政府はクリーンエア・イニシアチブの一環として産業排出削減に積極的に取り組んでおり、セメント、金属、発電部門で電気集塵機の普及を促進している。
- 国内大手メーカーの存在と進行中のインフラ開発プロジェクトが需要をさらに高めています。さらに、大気汚染の健康への影響に対する意識の高まりも、公共部門と民間部門の両方で導入を加速させています。
日本における電気集塵機市場の洞察
日本の電気集塵機市場は、同国の厳格な環境コンプライアンス基準と、エネルギー効率が高くクリーンな産業慣行への注力により、2025年から2032年にかけて最も高い成長率を達成すると予想されています。技術主導型国家である日本は、高度な排出ガス制御システムを備えた産業インフラの近代化に重点を置いています。特に発電部門と製造部門における環境に配慮した生産への移行は、市場拡大を後押ししています。さらに、政府主導の粒子状物質排出量削減策や既存発電所の改修への投資は、日本市場における電気集塵機の普及にプラスの影響を与えています。
アジア太平洋地域の電気集塵機市場シェア
アジア太平洋地域の電気集塵機業界は、主に次のような老舗企業によって牽引されています。
- サーマックス・リミテッド(インド)
- 住友重機械工業株式会社(日本)
- 福建龍京有限公司(中国)
- 三菱パワー株式会社(日本)
- KCコトレル(韓国)
- KLEAN(韓国)
- バーラト・ヘビー・エレクトリカルズ・リミテッド(インド)
- ペナー・インダストリーズ・リミテッド(インド)
SKU-
世界初のマーケットインテリジェンスクラウドに関するレポートにオンラインでアクセスする

- インタラクティブなデータ分析ダッシュボード
- 成長の可能性が高い機会のための企業分析ダッシュボード
- カスタマイズとクエリのためのリサーチアナリストアクセス
- インタラクティブなダッシュボードによる競合分析
- 最新ニュース、更新情報、トレンド分析
- 包括的な競合追跡のためのベンチマーク分析のパワーを活用
目次
- 導入
- 研究の目的
- 市場定義
- アジア太平洋地域の電気集塵機市場の概要
- 通貨と価格
- 制限事項
- 対象市場
- 市場セグメンテーション
- 対象市場
- 地理的範囲
- 研究対象年数
- DBMR TRIPODデータ検証モデル
- 主要オピニオンリーダーとの一次インタビュー
- DBMR マーケットポジショングリッド
- ベンダーシェア分析
- マーケットタイプ カバレッジグリッド
- 多変量モデリング
- タイムラインカーブを入力する
- 二次資料
- 仮定
- エグゼクティブサマリー
- プレミアムインサイト
- 市場概要
- ドライバー
- 世界中で建設活動が増加
- 排出ガス制御ソリューションにおける技術的進歩
- 急速な都市化により新興国における電力需要が増加
- 拘束具
- 厳格な政府規制
- ESPの設置コストが高い
- 機会
- 組織間の戦略的提携とパートナーシップ
- 政府による汚染防止プログラムの取り組みの増加
- 政府による大規模な研究開発投資
- 課題
- 排出ガス制御システムに関する認識不足
- 操作上の課題とデバイスの故障
- 不利な経済状況と代替エネルギー源の出現
- COVID-19による市場への影響分析
- 電気集塵機市場の余波
- COVID-19パンデミック後の市場機会
- 供給、需要、価格への影響
- 結論
- アジア太平洋地域の電気集塵機市場(タイプ別)
- 概要
- ドライESP
- 特に濡れた
- アジア太平洋地域の電気集塵機市場、提供製品別
- 概要
- ハードウェアとソフトウェア
- 放電電極
- 高電圧電気システム
- 集電電極
- ラッパー
- ホッパーズ
- シェル
- その他
- サービス
- アジア太平洋地域の静電集塵機市場(用途別)
- 概要
- 石炭火力発電
- 電気アーク炉
- ガスタービン
- 産業用電力
- 固形廃棄物焼却炉
- その他
- アジア太平洋地域の電気集塵機市場(エンドユーザー別)
- 概要
- 発電
- タイプ別
- 石炭火力発電所
- 石油精製所および発電所
- ESPタイプ別
- ドライESP
- ウェットESP
- 金属加工
- タイプ別
- 鉄鋼製造
- 非鉄金属の生産と加工
- 鋳造所
- アルミニウム製錬
- ESPタイプ別
- ドライESP
- ウェットESP
- セメント
- ESPタイプ別
- ドライESP
- ウェットESP
- 化学および石油化学
- タイプ別
- 基礎化学製品
- 特殊化学品メーカー
- 消費財メーカー
- ESPタイプ別
- ドライESP
- ウェットESP
- 製造
- ESPタイプ別
- ドライESP
- ウェットESP
- マリン
- ESPタイプ別
- ドライESP
- ウェットESP
- その他
- アジア太平洋地域の電気集塵機市場(国別)
- 中国
- インド
- 日本
- 韓国
- インドネシア
- オーストラリア
- タイ
- マレーシア
- フィリピン
- シンガポール
- その他のアジア太平洋地域
- アジア太平洋地域の電気集塵機市場:企業の展望
- 企業シェア分析:アジア太平洋地域
- SWOT分析
- 会社概要
- 福建龍王株式会社
- 会社概要
- ビジネスポートフォリオ
- 最近の開発
- 三菱パワー株式会社(三菱重工業株式会社の子会社)
- 会社概要
- 収益分析
- 製品ポートフォリオ
- 最近の動向
- バーラト・ヘビー・エレクトリカルズ・リミテッド
- 会社概要
- 収益分析
- 製品ポートフォリオ
- 最近の動向
- 住友重機械工業株式会社
- 会社概要
- 収益分析
- 製品ポートフォリオ
- 最近の動向
- ゼネラル・エレクトリック
- 会社概要
- 収益分析
- 製品ポートフォリオ
- 最近の開発
- バブコック&ウィルコックスエンタープライズ社
- 会社概要
- 収益分析
- 製品ポートフォリオ
- 最近の動向
- フラッシュミッドス
- 会社概要
- 収益分析
- 製品ポートフォリオ
- 最近の動向
- GEAグループ株式会社
- 会社概要
- 収益分析
- 製品ポートフォリオ
- 最近の開発
- ジョン・ウッド・グループPLC
- 会社概要
- 収益分析
- 製品ポートフォリオ
- 最近の開発
- KC コートレル
- 会社概要
- 収益分析
- 製品ポートフォリオ
- 最近の開発
- クリーン
- 会社概要
- 製品ポートフォリオ
- 最近の開発
- ペナー・インダストリーズ・リミテッド
- 会社概要
- 収益分析
- 製品ポートフォリオ
- 最近の開発
- シーメンスエナジー
- 会社概要
- 収益分析
- 製品ポートフォリオ
- 最近の動向
- サ・ハモン
- 会社概要
- 収益分析
- 製品ポートフォリオ
- 最近の動向
- サーマックス株式会社
- 会社概要
- 収益分析
- 製品ポートフォリオ
- 最近の開発
- アンケート
- 関連レポート
表のリスト
表1 石炭火力発電所の排出基準
表2 発電所における電気集塵装置の平均コスト
表3 アジア太平洋地域の電気集塵機市場、タイプ別、2019年~2028年(千米ドル)
表4 アジア太平洋地域の静電集塵機市場(提供製品別)、2019年~2028年(千米ドル)
表5:アジア太平洋地域の電気集塵機市場におけるハードウェアおよびソフトウェア、タイプ別、2019年~2028年(千米ドル)
表6 アジア太平洋地域の静電集塵機市場、用途別、2019年~2028年(千米ドル)
表7 アジア太平洋地域の電気集塵機市場、エンドユーザー別、2019年~2028年(千米ドル)
表8 アジア太平洋地域の電気集塵機市場(タイプ別)、2019年~2028年(千米ドル)
表9 アジア太平洋地域の電気集塵機市場(ESPタイプ別)、2019年~2028年(千米ドル)
表10 アジア太平洋地域の金属加工用電気集塵機市場、タイプ別、2019年~2028年(千米ドル)
表11 アジア太平洋地域の金属加工用電気集塵機市場、ESPタイプ別、2019年~2028年(千米ドル)
表12 アジア太平洋地域の電気集塵機市場、ESPタイプ別、2019-2028年(千米ドル)
表13 アジア太平洋地域の化学・石油化学産業向け電気集塵機市場、タイプ別、2019年~2028年(千米ドル)
表14 アジア太平洋地域の化学・石油化学産業向け電気集塵機市場、ESPタイプ別、2019年~2028年(千米ドル)
表15 アジア太平洋地域の電気集塵機市場における製造業、ESPタイプ別、2019-2028年(千米ドル)
表16 アジア太平洋地域の海洋用電気集塵機市場、ESPタイプ別、2019年~2028年(千米ドル)
表17 アジア太平洋地域の電気集塵機市場、国別、2019年~2028年(千米ドル)
表18 中国電気集塵機市場、タイプ別、2019年~2028年(千米ドル)
表19 中国電気集塵機市場、製品別、2019年~2028年(単位:千米ドル)
表20 中国電気集塵機市場におけるハードウェアとソフトウェア、タイプ別、2019-2028年(千米ドル)
表21 中国電気集塵機市場、用途別、2019年~2028年(千米ドル)
表22 中国電気集塵機市場、エンドユーザー別、2019年~2028年(千米ドル)
表23 中国における電気集塵機市場(タイプ別)、2019年~2028年(千米ドル)
表24 中国における電気集塵機市場、ESPタイプ別、2019年~2028年(単位:千米ドル)
表25 中国電気集塵機市場における金属加工、タイプ別、2019年~2028年(千米ドル)
表26 中国電気集塵機市場における金属加工、ESPタイプ別、2019-2028年(千米ドル)
表27 中国セメントの電気集塵機市場、ESPタイプ別、2019-2028年(千米ドル)
表28 中国化学・石油化学工業用電気集塵機市場、タイプ別、2019年~2028年(単位:千米ドル)
表29 中国化学・石油化学工業用電気集塵機市場、ESPタイプ別、2019年~2028年(単位:千米ドル)
表30 中国における電気集塵機市場、ESPタイプ別、2019年~2028年(単位:千米ドル)
表31 中国海洋向け電気集塵機市場、ESPタイプ別、2019年~2028年(単位:千米ドル)
表32 インドの電気集塵機市場、タイプ別、2019年~2028年(千米ドル)
表33 インドの電気集塵機市場、製品別、2019年~2028年(単位:千米ドル)
表34 インドの電気集塵機市場におけるハードウェアとソフトウェア、タイプ別、2019-2028年(千米ドル)
表35 インドの電気集塵機市場、用途別、2019年~2028年(千米ドル)
表36 インドの電気集塵機市場、エンドユーザー別、2019年~2028年(千米ドル)
表37 インドの電気集塵機市場(タイプ別)、2019年~2028年(千米ドル)
表38 インドの電気集塵機市場における発電、ESPタイプ別、2019-2028年(千米ドル)
表39 インドの電気集塵機市場における金属加工、タイプ別、2019年~2028年(千米ドル)
表40 インドの電気集塵機市場における金属加工、ESPタイプ別、2019年~2028年(単位:千米ドル)
表41 インドの電気集塵機市場、ESPタイプ別、2019年~2028年(単位:千米ドル)
表42 インドの化学・石油化学電気集塵機市場、タイプ別、2019年~2028年(単位:千米ドル)
表43 インドの化学・石油化学製品の電気集塵機市場、ESPタイプ別、2019年~2028年(単位:千米ドル)
表44 インドの電気集塵機市場における製造業、ESPタイプ別、2019-2028年(千米ドル)
表45 インドの海洋向け電気集塵機市場、ESPタイプ別、2019年~2028年(単位:千米ドル)
表46 日本電気集塵機市場、タイプ別、2019年~2028年(千米ドル)
表47 日本電気集塵機市場、製品別、2019年~2028年(千米ドル)
表48 日本電気集塵機市場におけるハードウェアとソフトウェア、タイプ別、2019年~2028年(単位:千米ドル)
表49 日本電気集塵機市場、用途別、2019年~2028年(千米ドル)
表50 日本電気集塵機市場、エンドユーザー別、2019年~2028年(千米ドル)
表51 日本における電気集塵機市場、タイプ別、2019年~2028年(千米ドル)
表52 日本における電気集塵機市場、ESPタイプ別、2019年~2028年(単位:千米ドル)
表53 日本における電気集塵機市場における金属加工、タイプ別、2019年~2028年(千米ドル)
表54 日本における電気集塵機市場における金属加工、ESPタイプ別、2019年~2028年(単位:千米ドル)
表55 日本セメントの電気集塵機市場、ESPタイプ別、2019年~2028年(千米ドル)
表56 日本化学・石油化学工業用電気集塵機市場、タイプ別、2019年~2028年(単位:千米ドル)
表57 日本化学・石油化学産業の電気集塵機市場、ESPタイプ別、2019年~2028年(単位:千米ドル)
表58 電気集塵機市場における日本の製造業、ESPタイプ別、2019年~2028年(千米ドル)
表59 日本海洋電気集塵機市場、ESPタイプ別、2019年~2028年(単位:千米ドル)
表60 韓国の電気集塵機市場、タイプ別、2019年~2028年(千米ドル)
表61 韓国の電気集塵機市場、製品別、2019年~2028年(単位:千米ドル)
表62 韓国の電気集塵機市場におけるハードウェアとソフトウェア、タイプ別、2019年~2028年(単位:千米ドル)
表63 韓国の電気集塵機市場、用途別、2019年~2028年(千米ドル)
表64 韓国の電気集塵機市場、エンドユーザー別、2019年~2028年(千米ドル)
表65 韓国の電気集塵機市場(タイプ別)、2019年~2028年(千米ドル)
表66 韓国の電気集塵機市場(ESPタイプ別)、2019年~2028年(千米ドル)
表67 韓国の電気集塵機市場における金属加工、タイプ別、2019年~2028年(千米ドル)
表68 韓国の電気集塵機市場における金属加工、ESPタイプ別、2019年~2028年(単位:千米ドル)
表69 韓国の電気集塵機市場におけるセメント、ESPタイプ別、2019年~2028年(千米ドル)
表70 韓国の化学・石油化学産業における電気集塵機市場、タイプ別、2019年~2028年(単位:千米ドル)
表71 韓国の化学・石油化学産業における電気集塵機市場、ESPタイプ別、2019年~2028年(単位:千米ドル)
表72 韓国の電気集塵機市場における製造業、ESPタイプ別、2019年~2028年(単位:千米ドル)
表73 韓国の海洋電気集塵機市場、ESPタイプ別、2019年~2028年(単位:千米ドル)
表74 インドネシアの電気集塵機市場、タイプ別、2019年~2028年(千米ドル)
表75 インドネシアの電気集塵機市場、製品別、2019年~2028年(単位:千米ドル)
表76 インドネシアの電気集塵機市場におけるハードウェアとソフトウェア、タイプ別、2019-2028年(千米ドル)
表77 インドネシアの電気集塵機市場、用途別、2019年~2028年(千米ドル)
表78 インドネシアの電気集塵機市場、エンドユーザー別、2019-2028年(千米ドル)
表79 インドネシアの電気集塵機市場(タイプ別)、2019年~2028年(千米ドル)
表80 インドネシアの電気集塵機市場における発電量、ESPタイプ別、2019年~2028年(単位:千米ドル)
表81 インドネシアの電気集塵機市場における金属加工、タイプ別、2019年~2028年(千米ドル)
表82 インドネシアの電気集塵機市場における金属加工、ESPタイプ別、2019-2028年(千米ドル)
表83 インドネシアの電気集塵機市場におけるセメント、ESPタイプ別、2019-2028年(千米ドル)
表84 インドネシアの電気集塵機市場における化学・石油化学製品、タイプ別、2019年~2028年(単位:千米ドル)
表85 インドネシアの電気集塵機市場における化学・石油化学製品、ESPタイプ別、2019年~2028年(単位:千米ドル)
表86 インドネシアの電気集塵機市場におけるESPタイプ別製造、2019-2028年(千米ドル)
表87 インドネシア海洋用電気集塵機市場、ESPタイプ別、2019年~2028年(単位:千米ドル)
表88 オーストラリアの電気集塵機市場、タイプ別、2019年~2028年(千米ドル)
表89 オーストラリアの電気集塵機市場、製品別、2019年~2028年(単位:千米ドル)
表90 オーストラリアの電気集塵機市場におけるハードウェアとソフトウェア、タイプ別、2019-2028年(千米ドル)
表91 オーストラリアの電気集塵機市場、用途別、2019年~2028年(千米ドル)
表92 オーストラリアの電気集塵機市場、エンドユーザー別、2019年~2028年(千米ドル)
表93 オーストラリアの電気集塵機市場(タイプ別)、2019年~2028年(千米ドル)
表94 オーストラリアの電気集塵機市場、ESPタイプ別、2019年~2028年(単位:千米ドル)
表95 オーストラリアの電気集塵機市場における金属加工、タイプ別、2019年~2028年(千米ドル)
表96 オーストラリアの電気集塵機市場における金属加工、ESPタイプ別、2019年~2028年(単位:千米ドル)
表97 オーストラリアの電気集塵機市場、ESPタイプ別、2019年~2028年(単位:千米ドル)
表98 オーストラリアの化学・石油化学電気集塵機市場、タイプ別、2019年~2028年(単位:千米ドル)
表99 オーストラリアの化学・石油化学産業向け電気集塵機市場、ESPタイプ別、2019年~2028年(単位:千米ドル)
表100 オーストラリアの電気集塵機市場におけるESPタイプ別製造、2019-2028年(千米ドル)
表101 オーストラリア海洋用電気集塵機市場、ESPタイプ別、2019年~2028年(単位:千米ドル)
表102 タイの電気集塵機市場、タイプ別、2019年~2028年(千米ドル)
表103 タイの電気集塵機市場、製品別、2019年~2028年(単位:千米ドル)
表104 タイの電気集塵機市場におけるハードウェアとソフトウェア、タイプ別、2019-2028年(千米ドル)
表105 タイの電気集塵機市場、用途別、2019年~2028年(千米ドル)
表106 タイの電気集塵機市場、エンドユーザー別、2019年~2028年(千米ドル)
表107 タイの電気集塵機市場(タイプ別)、2019年~2028年(千米ドル)
表108 タイの電気集塵機市場(ESPタイプ別)、2019年~2028年(単位:千米ドル)
表109 タイの電気集塵機市場における金属加工、タイプ別、2019年~2028年(単位:千米ドル)
表110 タイの電気集塵機市場における金属加工、ESPタイプ別、2019年~2028年(単位:千米ドル)
表111 タイの電気集塵機市場、ESPタイプ別、2019年~2028年(単位:千米ドル)
表112 タイの化学・石油化学電気集塵機市場、タイプ別、2019年~2028年(単位:千米ドル)
表113 タイの化学・石油化学産業向け電気集塵機市場、ESPタイプ別、2019年~2028年(単位:千米ドル)
表114 タイの電気集塵機市場における製造業、ESPタイプ別、2019-2028年(千米ドル)
表115 タイの海洋電気集塵機市場、ESPタイプ別、2019年~2028年(単位:千米ドル)
表116 マレーシアの電気集塵機市場、タイプ別、2019年~2028年(千米ドル)
表117 マレーシアの電気集塵機市場、製品別、2019年~2028年(単位:千米ドル)
表118 マレーシアの電気集塵機市場におけるハードウェアとソフトウェア、タイプ別、2019-2028年(千米ドル)
表119 マレーシアの電気集塵機市場、用途別、2019年~2028年(千米ドル)
表120 マレーシアの電気集塵機市場、エンドユーザー別、2019-2028年(千米ドル)
表121 マレーシアの電気集塵機市場(タイプ別)、2019年~2028年(千米ドル)
表122 マレーシアの電気集塵機市場、ESPタイプ別、2019年~2028年(単位:千米ドル)
表123 マレーシアの電気集塵機市場における金属加工、タイプ別、2019年~2028年(千米ドル)
表124 マレーシアの電気集塵機市場における金属加工、ESPタイプ別、2019-2028年(千米ドル)
表125 マレーシアの電気集塵機市場、ESPタイプ別、2019-2028年(千米ドル)
表126 マレーシアの化学・石油化学電気集塵機市場、タイプ別、2019年~2028年(単位:千米ドル)
表127 マレーシアの化学・石油化学製品の電気集塵機市場、ESPタイプ別、2019年~2028年(単位:千米ドル)
表128 マレーシアの電気集塵機市場におけるESPタイプ別製造、2019-2028年(千米ドル)
表129 マレーシア海洋用電気集塵機市場、ESPタイプ別、2019年~2028年(単位:千米ドル)
表130 フィリピンの電気集塵機市場、タイプ別、2019-2028年(千米ドル)
表131 フィリピンの電気集塵機市場、製品別、2019年~2028年(千米ドル)
表132 フィリピンの電気集塵機市場におけるハードウェアとソフトウェア、タイプ別、2019-2028年(千米ドル)
表133 フィリピンの電気集塵機市場、用途別、2019年~2028年(千米ドル)
表134 フィリピンの電気集塵機市場、エンドユーザー別、2019-2028年(千米ドル)
表135 フィリピンの電気集塵機市場(タイプ別)、2019年~2028年(千米ドル)
表136 フィリピンの電気集塵機市場、ESPタイプ別、2019年~2028年(単位:千米ドル)
表137 フィリピンの電気集塵機市場における金属加工、タイプ別、2019-2028年(千米ドル)
表138 フィリピンの電気集塵機市場における金属加工、ESPタイプ別、2019年~2028年(単位:千米ドル)
表139 フィリピンの電気集塵機市場、ESPタイプ別、2019-2028年(千米ドル)
表140 フィリピンの化学・石油化学電気集塵機市場、タイプ別、2019年~2028年(単位:千米ドル)
表141 フィリピンの化学・石油化学産業における電気集塵機市場、ESPタイプ別、2019年~2028年(単位:千米ドル)
表142 フィリピンの電気集塵機市場におけるESPタイプ別製造、2019-2028年(千米ドル)
表143 フィリピンの海洋電気集塵機市場、ESPタイプ別、2019-2028年(千米ドル)
表144 シンガポールの電気集塵機市場、タイプ別、2019年~2028年(千米ドル)
表145 シンガポールの電気集塵機市場、製品別、2019年~2028年(単位:千米ドル)
表146 シンガポールの電気集塵機市場におけるハードウェアとソフトウェア、タイプ別、2019年~2028年(単位:千米ドル)
表147 シンガポールの電気集塵機市場、用途別、2019年~2028年(千米ドル)
表148 シンガポールの電気集塵機市場、エンドユーザー別、2019年~2028年(千米ドル)
表149 シンガポールの電気集塵機市場(タイプ別)、2019年~2028年(千米ドル)
表150 シンガポールの電気集塵機市場、ESPタイプ別、2019年~2028年(単位:千米ドル)
表151 シンガポールの電気集塵機市場における金属加工、タイプ別、2019年~2028年(単位:千米ドル)
表152 シンガポールの電気集塵機市場における金属加工、ESPタイプ別、2019年~2028年(単位:千米ドル)
表153 シンガポールの電気集塵機市場、ESPタイプ別、2019年~2028年(単位:千米ドル)
表154 シンガポールの化学・石油化学製品の電気集塵機市場、タイプ別、2019年~2028年(単位:千米ドル)
表155 シンガポールの化学・石油化学産業における電気集塵機市場、ESPタイプ別、2019年~2028年(単位:千米ドル)
表156 シンガポールの電気集塵機市場における製造業、ESPタイプ別、2019-2028年(千米ドル)
表157 シンガポール海洋電気集塵機市場、ESPタイプ別、2019年~2028年(単位:千米ドル)
表158 アジア太平洋地域のその他の地域の電気集塵機市場、タイプ別、2019年~2028年(単位:千米ドル)
図表一覧
図1 アジア太平洋地域の静電集塵機市場のセグメンテーション
図2 アジア太平洋地域の電気集塵機市場:データの三角測量
図3 アジア太平洋地域の電気集塵機市場:DROC分析
図4 アジア太平洋地域の電気集塵機市場:地域別・国別市場分析
図5 アジア太平洋地域の電気集塵機市場:企業調査分析
図6 アジア太平洋地域の電気集塵機市場:インタビュー人口統計
図7 アジア太平洋地域の電気集塵機市場:DBMR市場ポジショングリッド
図8 アジア太平洋地域の電気集塵機市場:ベンダーシェア分析
図9 アジア太平洋地域の電気集塵機市場:タイプ別カバー範囲グリッド
図10 アジア太平洋地域の電気集塵機市場のセグメンテーション
図11 世界中で建設活動の増加がアジア太平洋地域の電気集塵機市場を牽引すると予想される 予測期間:2021~2028年
図12 乾式ESPセグメントは、2021年と2028年にアジア太平洋地域の電気集塵機市場で最大のシェアを占めると予想されています。
図13 アジア太平洋地域の電気集塵機市場の推進要因、抑制要因、機会、課題
図14 2020年の様々な産業からのエネルギー関連の二酸化炭素排出量(パーセント)
図15 アジア太平洋地域における主要な石炭火力発電能力の貢献者(2018年)
図16 アジア太平洋地域の電気集塵機市場(タイプ別、2020年)
図17 アジア太平洋地域の電気集塵機市場(提供製品別、2020年)
図18 アジア太平洋地域の電気集塵機市場(用途別、2020年)
図19 アジア太平洋地域の電気集塵機市場(エンドユーザー別、2020年)
図20 アジア太平洋地域の電気集塵機市場:スナップショット(2020年)
図21 アジア太平洋地域の電気集塵機市場:国別(2020年)
図22 アジア太平洋地域の電気集塵機市場:国別(2021年および2028年)
図23 アジア太平洋地域の電気集塵機市場:国別(2020年と2028年)
図24 アジア太平洋地域の電気集塵機市場:タイプ別(2021~2028年)
図25 アジア太平洋地域の電気集塵機市場:企業シェア2020(%)
調査方法
データ収集と基準年分析は、大規模なサンプル サイズのデータ収集モジュールを使用して行われます。この段階では、さまざまなソースと戦略を通じて市場情報または関連データを取得します。過去に取得したすべてのデータを事前に調査および計画することも含まれます。また、さまざまな情報ソース間で見られる情報の不一致の調査も含まれます。市場データは、市場統計モデルと一貫性モデルを使用して分析および推定されます。また、市場シェア分析と主要トレンド分析は、市場レポートの主要な成功要因です。詳細については、アナリストへの電話をリクエストするか、お問い合わせをドロップダウンしてください。
DBMR 調査チームが使用する主要な調査方法は、データ マイニング、データ変数が市場に与える影響の分析、および一次 (業界の専門家) 検証を含むデータ三角測量です。データ モデルには、ベンダー ポジショニング グリッド、市場タイムライン分析、市場概要とガイド、企業ポジショニング グリッド、特許分析、価格分析、企業市場シェア分析、測定基準、グローバルと地域、ベンダー シェア分析が含まれます。調査方法について詳しくは、お問い合わせフォームから当社の業界専門家にご相談ください。
カスタマイズ可能
Data Bridge Market Research は、高度な形成的調査のリーダーです。当社は、既存および新規のお客様に、お客様の目標に合致し、それに適したデータと分析を提供することに誇りを持っています。レポートは、対象ブランドの価格動向分析、追加国の市場理解 (国のリストをお問い合わせください)、臨床試験結果データ、文献レビュー、リファービッシュ市場および製品ベース分析を含めるようにカスタマイズできます。対象競合他社の市場分析は、技術ベースの分析から市場ポートフォリオ戦略まで分析できます。必要な競合他社のデータを、必要な形式とデータ スタイルでいくつでも追加できます。当社のアナリスト チームは、粗い生の Excel ファイル ピボット テーブル (ファクト ブック) でデータを提供したり、レポートで利用可能なデータ セットからプレゼンテーションを作成するお手伝いをしたりすることもできます。

