世界のガラス製品市場規模、シェア、トレンド分析レポート
Market Size in USD Billion
CAGR :
% 
 USD
2.88 Billion
USD
4.36 Billion
2024
2032
USD
2.88 Billion
USD
4.36 Billion
2024
2032
| 2025 –2032 | |
| USD 2.88 Billion | |
| USD 4.36 Billion | |
| % | |
|
世界のガラス製品市場のセグメンテーション、材質別(ソーダ石灰ガラス、鉛ガラス、耐熱ガラス、その他)、スタイル別(ステムレスグラス、ステムウェア、日常使用、その他)、流通チャネル別(B2B、専門店、スーパーマーケット/ハイパーマーケット、Eコマース、その他)、価格帯別(中価格、高級、エコノミー)、最終用途別(ホテル・レストラン、バー・カフェ、家庭用、企業食堂、その他) - 2032年までの業界動向と予測
ガラス製品市場規模
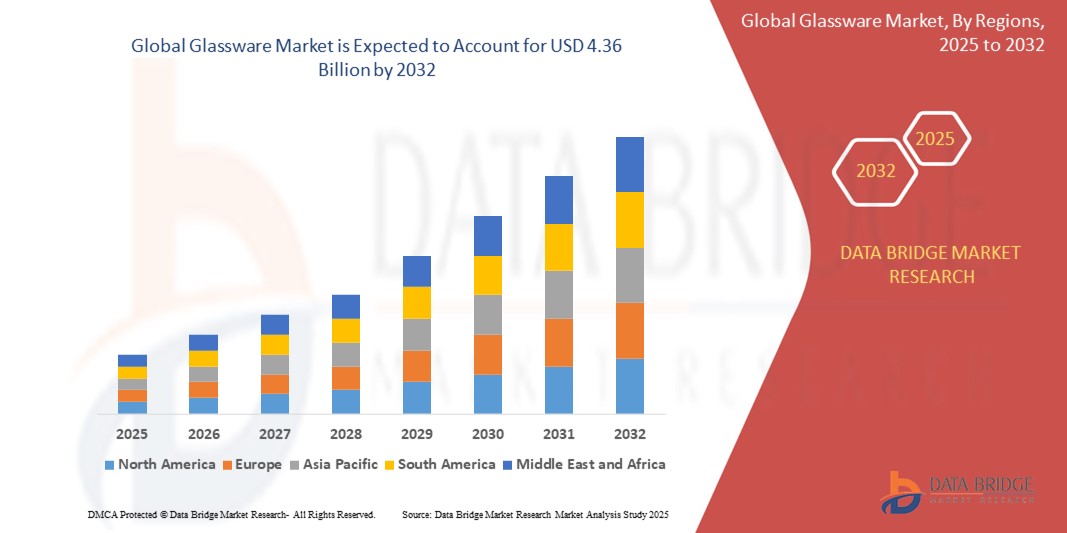
- 世界のガラス製品市場規模は2024年に28億8000万米ドルと評価され、予測期間中に5.30%のCAGRで成長し、2032年までに43億6000万米ドル に達すると予想されています 。
- 市場の成長は、高級ダイニングおよびキッチン製品の需要の増加、プラスチックに代わる環境に優しく再利用可能な代替品に対する消費者の嗜好の高まり、そして世界的な食品サービスおよびホスピタリティ部門の拡大によって主に推進されています。
- さらに、オンライン小売チャネルとインテリアインフルエンサーの台頭により、都市部と準都市部の両方でデザイナーやカスタマイズされたガラス製品の認知度と入手しやすさが大幅に向上しています。
ガラス製品市場分析
- 家庭での食事のトレンドと美的魅力に牽引され、住宅環境でスタイリッシュで耐久性のあるガラス製品の採用が増加しており、これが市場の成長に大きく貢献しています。
- 食品サービスとホスピタリティ業界は、レストラン、バー、ホテルが顧客体験を向上させるために高品質のグラス製品に投資しており、引き続き大きな収益源となっています。
- 北米は、高級ダイニングの美観に対する消費者の嗜好の高まり、再利用可能な家庭用品の需要の増加、プラスチックからの移行の増加により、2024年には世界のガラス製品市場を支配し、36.8%の最大の収益シェアを獲得しました。
- アジア太平洋地域は、都市化の進展、可処分所得の増加、中国、インド、東南アジア諸国などの新興国における現代的な家庭用品や高級ダイニング製品の需要の急増により、世界のガラス製品市場で最も高い成長率を示すことが予想されています。
- ソーダライムガラスは、その手頃な価格、加工性、そして透明な外観から、日常のガラス製品に広く使用されているため、2024年には市場収益シェアで最大のシェアを占めました。住宅用および商業用の用途において、タンブラー、皿、その他汎用ガラス製品に最も多く使用されている素材です。
レポートの範囲とガラス製品市場のセグメンテーション
|
属性 |
ガラス製品の主要市場分析 |
|
対象セグメント |
|
|
対象国 |
北米
ヨーロッパ
アジア太平洋
中東およびアフリカ
南アメリカ
|
|
主要な市場プレーヤー |
|
|
市場機会 |
|
|
付加価値データ情報セット |
データブリッジマーケットリサーチがまとめた市場レポートには、市場価値、成長率、セグメンテーション、地理的範囲、主要プレーヤーなどの市場シナリオに関する洞察に加えて、輸出入分析、生産能力の概要、生産消費分析、価格動向分析、気候変動シナリオ、サプライチェーン分析、バリューチェーン分析、原材料/消耗品の概要、ベンダー選択基準、PESTLE分析、ポーター分析、規制枠組みも含まれています。 |
ガラス製品市場の動向
「手作りのガラス製品と職人技のガラス製品の人気の高まり」
- 消費者は大量生産品から離れ、個人の好み、独自性、文化遺産を反映した手作りの職人技のガラス製品にますます惹かれるようになっている。
- これらの製品は、地元の職人技、伝統的なガラス吹き技術、そして国内外のバイヤーにアピールする独特の地域スタイルを特徴としています。
- 職人の手によるガラス製品は、美学とストーリーテリングが全体的な顧客体験の一部であると考えられる高級ダイニング体験で人気が高まっています。
- オンラインプラットフォーム、インテリアインフルエンサー、ライフスタイルブロガーは、手作りガラス製品の認知度と需要を高める上で重要な役割を果たしている。
- カスタマイズされた限定版のガラス製品は、特別な機会、高級ギフト、室内装飾によく使用されます。
- 例えば、社会的な目的を持った手吹きキャンドルを販売するGlassybaby(米国)や、手作りのバーウェアで知られるLSA International(英国)などのブランドは、オンラインやブティックのチャネルを通じて消費者の関心を持続的に得ています。
ガラス製品市場の動向
ドライバ
「プラスチックに代わる環境に優しく再利用可能な代替品への需要の高まり」
- 環境意識の高まりにより、消費者と機関はリサイクル性、耐久性、不活性特性からプラスチックよりもガラスを選択するようになっています。
- ボトル、保存瓶、ランチ容器などのガラス製品は、特にミレニアル世代とZ世代の間で、環境に配慮した家庭の必需品になりつつあります。
- 使い捨てプラスチックの禁止を含む地域全体の規制措置により、メーカーや小売業者は持続可能なガラス製品の提供を拡大するよう求められている。
- 食品サービス業界の企業は、環境基準に準拠し、ブランドイメージを向上させるために、再利用可能なガラス製のドリンクウェアやサービングアイテムに移行しています。
- 強化ガラスやホウケイ酸ガラスの技術革新により、製品の安全性と寿命が向上し、ガラス製品は日常使用にとってより実用的になりました。
- EUの使い捨てプラスチック指令に従い、ドイツとフランスの大手スーパーマーケットチェーンは乳製品や調味料のプラスチック包装をガラス容器に置き換え、ヨーロッパ全体でガラス製品の需要を押し上げた。
抑制/挑戦
「輸送中および使用中に壊れやすく、破損するリスクが高い」
- ガラス製品は本質的に壊れやすく、輸送、取り扱い、洗浄中に、特に人通りの多い環境では割れたり砕けたりする可能性があります。
- 流通業者や小売業者は、物流コストを増加させ、利益率を低下させる、頑丈で衝撃を吸収する梱包材に投資する必要がある。
- 割れたガラスによる怪我や賠償責任のリスクがあるため、一部の商業施設では、より耐衝撃性の高い素材よりもガラスを採用することを躊躇している。
- 子供や高齢者がいる家庭の消費者は、安全上の懸念からガラス製品を避けることが多く、家族層での魅力が制限されています。
- ガラス製品に対する標準化された保険や交換ポリシーがないため、特にコストに敏感な市場では大量注文が抑制される。
- 例えば、東南アジアの独立系レストランやカフェでは、輸入ガラス製品の破損が頻繁に報告されており、美観を犠牲にしても、日常業務でメラミンやポリカーボネートの代替品を選択している。
ガラス製品市場の展望
市場は、材質、スタイル、流通チャネル、価格帯、最終用途に基づいてセグメント化されています。
• 素材別
ガラス製品市場は、材質別にソーダ石灰ガラス、鉛ガラス、耐熱ガラス、その他に分類されます。ソーダ石灰ガラスは、その手頃な価格、加工性、そして透明な外観から、日常のガラス製品に広く使用されているため、2024年には最大の市場収益シェアを占めました。住宅用および商業用の用途において、タンブラー、皿、その他汎用ガラス製品に最も多く使用されている素材です。
耐熱ガラス製品は、電子レンジ対応で耐久性のあるガラス製品に対する消費者需要の高まりを背景に、2025年から2032年にかけて最も高い成長率を示すと予想されています。高い熱ストレスに耐える性能により、ベーキング、調理、食品保存など、多機能調理器具を重視する都市部の家庭や業務用厨房に適しています。
• スタイル別
グラス製品市場は、スタイルに基づいて、ステムレスグラス、ステムウェア、日常使い、その他に分類されます。日常使いセグメントは、家庭、オフィス、ホスピタリティスペースなど、幅広い用途で使用されているため、2024年には市場を席巻しました。消費者は、汎用性、お手入れのしやすさ、スタッキング可能なデザインなど、これらの実用的な製品を高く評価しています。
ステムウェアセグメントは、ワインやカクテルの消費量の増加と、食卓の美的感覚への関心の高まりに支えられ、2025年から2032年にかけて最も高い成長率を記録すると予想されています。高級レストラン、バー、そして一般家庭では、テーブルプレゼンテーションとユーザーエクスペリエンスを向上させるために、高級ステムウェアへの投資が進んでいます。
• 流通チャネル別
流通チャネルに基づいて、ガラス製品市場はB2B、専門店、スーパーマーケット/ハイパーマーケット、eコマース、その他に分類されます。B2Bセグメントは、主にホテル、レストラン、企業ケータリング業者からの大量調達によって、2024年には最大の市場シェアを占めました。
2025年から2032年にかけて、eコマース分野は最も高い成長率を記録すると予想されています。これは、オンライン購入の利便性、より幅広いデザインへのアクセス、そしてデジタル小売プラットフォームの成長によるものです。インフルエンサーマーケティングやオンラインギフトのトレンドも、ガラス製品のオンライン販売を加速させています。
•価格帯別
価格帯に基づいて、ガラス製品市場はミディアム、プレミアム、エコノミーの3つに分類されます。ミディアムセグメントは、品質と手頃な価格のバランスが取れており、中間所得層の消費者層に訴求力があるため、2024年には最大のシェアを占めました。
プレミアムセグメントは、ギフト、フォーマルな食事、特別な機会のためのブランドやデザイナーグラスコレクションの需要の高まりにより、2025年から2032年にかけて最も高い成長率を記録すると予想されています。高級ホスピタリティ業界におけるエレガントな卓上製品への傾向も、このトレンドを後押ししています。
• 最終用途別
最終用途に基づいて、市場はホテル・レストラン、バー・カフェ、家庭用、企業食堂、その他に分類されます。家庭向けセグメントは、在宅飲食、オンラインフードデリバリー、ギフト志向の高まりに牽引され、2024年には最大の収益シェアで市場を牽引するでしょう。
バー&カフェセグメントは、カジュアルダイニングチェーンの世界的な拡大と社交的な外出の増加に支えられ、2025年から2032年にかけて最も高い成長率を記録すると予想されています。これらの施設では、機能性だけでなく、ブランドイメージと雰囲気の統一感を演出するためにも、グラスウェアを重視しています。
ガラス製品市場の地域分析
- 北米は、高級ダイニングの美観に対する消費者の嗜好の高まり、再利用可能な家庭用品の需要の増加、プラスチックからの移行の増加により、2024年には世界のガラス製品市場を支配し、36.8%の最大の収益シェアを獲得しました。
- この地域の消費者は機能性とデザインの両方を重視し、家庭用および業務用として強化ガラス、鉛フリーガラス、耐熱ガラス製品を好んでいます。
- 市場は、レストラン、ホテル、カフェからの強い需要、高い可処分所得、そして持続可能でエレガントな食器を重視するライフスタイルトレンドの影響からも恩恵を受けている。
米国ガラス製品市場インサイト
米国のガラス製品市場は、在宅勤務の増加、料理の実験、高級キッチン用品の購入の増加に支えられ、2024年には北米最大の売上高シェアとなる79.4%を占めると予測されています。パーソナライズされた職人技が光るガラス製品への需要は、特にeコマースプラットフォームや専門店を通じて引き続き高まっています。ガラス容器や再利用可能なドリンクウェアの使用など、環境に配慮した習慣の普及も市場拡大に貢献しています。ホスピタリティ業界がプレゼンテーション基準の向上に注力していることも、高品質なガラス製品への需要をさらに高めています。
ヨーロッパのガラス製品市場の洞察
ヨーロッパのガラス製品市場は、2025年から2032年にかけて最も高い成長率を記録すると予想されています。これは、ワインやスピリッツの消費文化が定着し、高品質な脚付きグラスの需要が高まっていることが背景にあります。持続可能性に関する規制と消費者意識の高まりにより、リサイクル可能な素材の使用が促進されており、多くのヨーロッパの家庭やレストランでは、耐久性と美しさを兼ね備えたガラス製品が選ばれています。特に、深く根付いた食文化と、再利用可能で美しい製品を好むライフスタイルのトレンドが進化している国々では、成長が顕著です。
英国のガラス製品市場の洞察
英国のガラス製品市場は、eコマースの売上増加、食習慣の変化、そしてホームデコレーションやキッチン用品のトレンドの高まりに牽引され、2025年から2032年にかけて最も高い成長率を達成すると予想されています。消費者は、パーソナルなダイニングセットやキッチンのアップグレードなど、家庭での体験への投資を増やしており、手頃な価格でありながらスタイリッシュなガラス製品への需要が高まっています。独立系ブランドや職人技のガラス製品メーカーも、特にギフトや高級家庭用品の分野で注目を集めています。
ドイツのガラス製品市場の洞察
ドイツのガラス製品市場は、強固な製造基盤、高品質な職人技、そして消費者の持続可能で機能的なデザインへの関心の高さに支えられ、2025年から2032年にかけて最も高い成長率を達成すると予想されています。精密ガラス製造における長年の実績を持つドイツ企業は、家庭用および業務用ガラス製品のイノベーションにおいて、引き続きリードし続けています。また、再利用可能で耐熱性のあるガラス製品が食品サービス業界で好まれていることも、あらゆるセクターの需要を牽引する上で重要な役割を果たしています。
アジア太平洋地域のガラス製品市場に関する洞察
アジア太平洋地域のガラス製品市場は、都市化の進展、可処分所得の増加、そしてホスピタリティ・食品サービス産業の拡大を背景に、2025年から2032年にかけて最も高い成長率を記録すると予想されています。中国、インド、日本などの市場では、消費者の嗜好の変化に伴い、日常使いのガラス製品と高級ガラス製品の両方に対する需要が堅調に推移しています。また、持続可能な包装や食事のソリューションを奨励する政府規制も、企業や家庭にガラス製品の代替品への移行を促しています。
日本ガラス製品市場インサイト
日本のガラス製品市場は、ミニマルな美学、高品質な家庭用品、そして伝統的な職人技への関心の高まりにより、2025年から2032年にかけて最も高い成長率を記録すると予想されています。単身世帯や共働き世帯の増加に伴い、コンパクトでエレガント、かつ多用途に使えるキッチン用品への投資が増加しています。さらに、料理の盛り付けを重視する文化も、手作りで耐久性の高いガラス製品など、洗練された美的感覚を持つテーブルウェアへの安定した需要を支えています。
中国ガラス製品市場インサイト
中国のガラス製品市場は、強力な製造エコシステム、拡大する中間層、そして持続可能なライフスタイル製品への嗜好の高まりに後押しされ、2024年にはアジア太平洋地域最大の収益シェアを獲得しました。国内ブランドは、個人用と贈答用の両方において、装飾性と機能性を兼ね備えたガラス製品への需要の高まりを捉えています。国内観光とホスピタリティ産業の発展の急増は、ホテル、レストラン、カフェなどにおける業務用ガラス製品への強い需要を生み出しています。
ガラス製品の市場シェア
ガラス製品業界は、主に次のような老舗企業によって牽引されています。
- コーニングインコーポレイテッド(米国)
- OIグラス(米国)
- Ardagh Group SA(ルクセンブルク)
- ビドララ(スペイン)
- ヴェラリア(フランス)
- 日本山村硝子株式会社(日本)
- AGC株式会社(日本)
- ゲルレスハイマーAG(ドイツ)
- ヴェトロパック・ホールディングス(スイス)
- シュトゥールツレガラスグループ(オーストリア)
- KOA GLASS CO., LTD.(韓国)
- ヒンダスタン・ナショナル・グラス・アンド・インダストリーズ・リミテッド(インド)
- 日本板硝子株式会社(英国)
- ショットAG(ドイツ)
- PGPグラス(インド)
- サンゴバン(フランス)
- ボルミオリ・ルイージSpA(イタリア)
- ヒンダスタン・ナショナル・グラス・アンド・インダストリーズ(インド)
- ビトロ(メキシコ)
- ゲルレスハイマーAG(ドイツ)
世界のガラス製品市場の最新動向
- チーフウェイは2022年4月、マレーシア初のスマートガラス製造施設の設立を発表しました。これは、持続可能でインテリジェントな住宅ソリューションへの高まる需要に対応するための戦略的開発です。新工場は、環境に優しいガラス製品の現地供給を促進し、輸入への依存を減らし、地域のスマートホーム市場の成長を支援することが期待されています。この開発により、マレーシアはスマートマテリアル分野における地位を強化し、世界的な持続可能性のトレンドにも合致することになります。
- セーバーグラスは2022年6月、アメリカ大陸からの需要増加に対応するため、2023年までにガラス瓶の生産能力を拡張する計画を発表しました。この拡張により、サプライチェーンの効率性が向上し、北米および中南米の顧客へのリードタイムが短縮されるとともに、高級ガラス容器市場における主要プレーヤーとしての地位が強化されます。この拡張は、この地域で成長を続ける飲料および高級品業界を大きく支援すると期待されています。
SKU-
世界初のマーケットインテリジェンスクラウドに関するレポートにオンラインでアクセスする

- インタラクティブなデータ分析ダッシュボード
- 成長の可能性が高い機会のための企業分析ダッシュボード
- カスタマイズとクエリのためのリサーチアナリストアクセス
- インタラクティブなダッシュボードによる競合分析
- 最新ニュース、更新情報、トレンド分析
- 包括的な競合追跡のためのベンチマーク分析のパワーを活用
目次
- 導入
- 研究の目的
- 市場定義
- 世界のガラス製品市場の概要
- 制限事項
- 対象市場
- 市場セグメンテーション
- 対象市場
- 地理的範囲
- 研究対象年数
- 通貨と価格
- DBMR TRIPODデータ検証モデル
- 製品 ライフラインカーブ
- 多変量モデリング
- 主要オピニオンリーダーとの一次インタビュー
- DBMR マーケットポジショングリッド
- 市場アプリケーションカバレッジグリッド
- DBMR市場課題マトリックス
- ベンダーシェア分析
- 輸出入データ
- 二次資料
- 仮定
- エグゼクティブサマリー
- プレミアムインサイト
- グローバル
- アジア太平洋
- 中東とアフリカ
- 北米
- 南アメリカ
- ヨーロッパ
- 市場概要
- ドライバー
- ホテルおよびケータリング業界への投資の増加
- 消費者のライフスタイルの変化
- 世界中で高級レストランの人気が高まっている
- 高級装飾ガラス製品の需要増加
- 拘束具
- 安価で高品質な製品の入手可能性
- スチール製および紙製のドリンクウェアの需要増加
- ガラス製品のメンテナンスの難しさ
- 機会
- ガラス製品製造技術の進歩
- 病院や法医学研究所における臨床用ガラス製品の需要増加
- 課題
- ガラス製品の製造における複雑さ
- ガラス製品のリサイクルの難しさの高まり
- COVID-19が世界のガラス製品市場に与える影響
- COVID-19が世界のガラス製品市場に与える影響に関する分析
- COVID-19の余波と世界のガラス製品市場を活性化させる政府の取り組み
- COVID-19後のメーカーが競争力のある市場シェアを獲得するための戦略的意思決定
- 価格への影響
- オンデマンドのインパクト
- サプライチェーンへの影響
- 結論
- 世界のガラス製品市場(材質別)
- 概要
- ソーダライムガラス
- 鉛ガラス
- 耐熱性
- その他
- 世界のガラス製品市場、スタイル別
- 概要
- 脚付きグラス
- 赤ワイングラス
- ボルドー
- カベルネ
- ジンファンデル
- ブルゴーニュ
- ピノ・ノワール
- 薔薇
- 白ワイングラス
- スパークリング
- シャルドネ
- ヴィオニエ
- 甘口ワイン
- ビンテージ
- ステムレスガラス
- 酒グラス
- ビールグラス
- 日常的な使用
- その他
- 世界のガラス製品市場(流通チャネル別)
- 概要
- B2B
- 専門店
- スーパーマーケット/ハイパーマーケット
- Eコマース
- その他
- 世界のガラス製品市場(価格帯別)
- 概要
- 中くらい
- プレミアム
- 経済
- 世界のガラス製品市場(最終用途別)
- 概要
- ホテル&レストラン
- バー&カフェ
- 家庭
- 企業食堂
- その他
- 世界のガラス製品市場(地域別)
- 概要
- アジア太平洋
- 中国
- インド
- 日本
- 韓国
- シンガポール
- マレーシア
- タイ
- オーストラリアとニュージーランド
- インドネシア
- フィリピン
- 香港
- 台湾
- その他のアジア太平洋地域
- ヨーロッパ
- ドイツ
- フランス
- イタリア
- イギリス
- 七面鳥
- スイス
- スペイン
- ロシア
- オランダ
- ベルギー
- その他のヨーロッパ
- 北米
- 私たち
- カナダ
- メキシコ
- 南アメリカ
- ブラジル
- アルゼンチン
- 南アメリカの残りの地域
- 中東およびアフリカ
- アラブ首長国連邦
- サウジアラビア
- 南アフリカ
- エジプト
- イスラエル
- 中東およびアフリカの残りの地域
- 世界のガラス製品市場、企業の状況
- 企業株分析:グローバル
- 企業株分析:北米
- 企業株分析:ヨーロッパ
- 企業シェア分析:アジア太平洋地域
- 合併と買収
- 新製品開発
- 賞
- パートナーシップ
- SWOT分析
- 企業プロフィール
- リビー株式会社
- 会社概要
- 収益分析
- 企業株分析
- 製品ポートフォリオ
- 最近の更新
- ライフタイムブランド株式会社
- 会社概要
- 収益分析
- 企業株分析
- 製品ポートフォリオ
- 最近の更新
- ビレロイ&ボッホ
- 会社概要
- 収益分析
- 企業株分析
- 製品ポートフォリオ
- 最近の更新
- WMF GmbH
- 会社概要
- 収益分析
- 企業株分析
- 製品ポートフォリオ
- 最近の更新
- フィスカースオーストラリア株式会社
- 会社概要
- 収益分析
- 企業株分析
- 製品ポートフォリオ
- 最近の更新
- ボルミオリ・ロッコ SpA
- 会社概要
- 製品ポートフォリオ
- 最近の更新
- カンブリアクリスタル
- 会社概要
- 製品ポートフォリオ
- 最近の更新
- ドグレヌ
- 会社概要
- 製品ポートフォリオ
- 最近の更新
- フラストニク1860
- 会社概要
- 製品ポートフォリオ
- 最近の更新
- レノックスコーポレーション
- 会社概要
- 製品ポートフォリオ
- 最近の更新
- ノリタケチナ
- 会社概要
- 収益分析
- 製品ポートフォリオ
- 最近の更新
- シュテルツレ・ラウジッツGmbH
- 会社概要
- 製品ポートフォリオ
- 最近の更新
- オナイダグループ株式会社
- 会社概要
- 製品ポートフォリオ
- 最近の更新
- ズリケカンパニー株式会社
- 会社スナップ
- 製品ポートフォリオ
- 最近の更新
- アンケート
- 関連レポート
表のリスト
表1 輸入データ 飲用グラス(ガラスセラミック製グラス、鉛クリスタル製グラス、脚付きグラスを除く) HSコード - 701337 (千米ドル)
表2 飲用グラス(ガラスセラミック製または鉛クリスタル製のグラスおよび脚付きグラスを除く)の輸出データ HSコード - 701337 (千米ドル)
表3 米国の消費者が飲み物に好む再利用可能なカップの種類(2015年)
表4 世界のガラス製品市場、材質別、2019-2028年(千米ドル)
表5 世界のガラス製品市場、材質別、2019年~2028年(千個)
表6 世界のガラス製品市場におけるソーダ石灰ガラス、地域別、2019-2028年(千米ドル)
表7 世界のガラス製品市場におけるソーダ石灰ガラス、地域別、2019-2028年(千個)
表8 ガラス製品における鉛ガラスの世界市場、地域別、2019-2028年(千米ドル)
表9 ガラス製品市場における鉛ガラスの世界市場、地域別、2019年~2028年(千個)
表10 世界の耐熱ガラス製品市場、地域別、2019-2028年(千米ドル)
表11 世界の耐熱ガラス製品市場、地域別、2019年~2028年(千台)
表12 世界のガラス製品市場におけるその他、地域別、2019年~2028年(千米ドル)
表13 世界のガラス製品市場におけるその他、地域別、2019年~2028年(千台)
表14 世界のガラス製品市場、スタイル別、2019年~2028年(千米ドル)
表15 世界のステムウェア市場(地域別)、2019年~2028年(千米ドル)
表16 世界のステムウェア市場(種類別)、2019年~2028年(千米ドル)
表17 世界の赤ワイングラス市場(種類別、2019年~2028年)(千米ドル)
表18 世界の白ワイングラス市場(種類別、2019年~2028年)(千米ドル)
表19 世界のステムレスガラス製グラス市場、地域別、2019年~2028年(千米ドル)
表20 世界のステムレスガラス製グラス市場、タイプ別、2019年~2028年(千米ドル)
表21 世界の日常使用ガラス製品市場、地域別、2019-2028年(千米ドル)
表22 世界のガラス製品市場(地域別、2019年~2028年)(千米ドル)
表23 世界のガラス製品市場、流通チャネル別、2019年~2028年(千米ドル)
表24 世界のガラス製品市場におけるB2B、地域別、2019-2028年(千米ドル)
表25 ガラス製品市場における世界の専門店、地域別、2019-2028年(千米ドル)
表26 世界のスーパーマーケット/ハイパーマーケットにおけるガラス製品市場、地域別、2019-2028年(千米ドル)
表27 ガラス製品市場における世界の電子商取引、地域別、2019-2028年(千米ドル)
表28 世界のガラス製品市場におけるその他、地域別、2019年~2028年(千米ドル)
表29 世界のガラス製品市場、価格帯別、2019年~2028年(千米ドル)
表30 世界のガラス製品市場(地域別)、2019年~2028年(千米ドル)
表31 ガラス製品市場における世界のプレミアム、地域別、2019-2028年(千米ドル)
表32 ガラス製品市場における世界経済、地域別、2019-2028年(千米ドル)
表33 世界のガラス製品市場、用途別、2019年~2028年(千米ドル)
表34 世界のホテル・レストラン向けグラスウェア市場、地域別、2019年~2028年(千米ドル)
表35 世界のバー&カフェのグラスウェア市場、地域別、2019-2028年(千米ドル)
表36 世界の家庭用ガラス製品市場、地域別、2019-2028年(千米ドル)
表37 世界の企業食堂用ガラス製品市場、地域別、2019年~2028年(千米ドル)
表38 世界のガラス製品市場(地域別、2019年~2028年)(千米ドル)
表39 世界のガラス製品市場、地域別、2019-2028年(千米ドル)
表40 世界のガラス製品市場、地域別、2019-2028年(千個)
表41 アジア太平洋地域のガラス製品市場、国別、2019年~2028年(千米ドル)
表42 アジア太平洋地域のガラス製品市場、国別、2019年~2028年(千個)
表43 アジア太平洋地域のガラス製品市場、材質別、2019年~2028年(単位:千米ドル)
表44 アジア太平洋地域のガラス製品市場、材質別、2019年~2028年(千個)
表45 アジア太平洋地域のガラス製品市場、スタイル別、2019年~2028年(単位:千米ドル)
表46 アジア太平洋地域のグラス製品市場(種類別)、2019年~2028年(単位:千米ドル)
表47 アジア太平洋地域のガラス製品市場における赤ワイングラス、種類別、2019年~2028年(単位:千米ドル)
表48 アジア太平洋地域の白ワイングラス市場、種類別、2019年~2028年(単位:千米ドル)
表49 アジア太平洋地域のステムレスガラス製品市場、タイプ別、2019年~2028年(単位:千米ドル)
表50 アジア太平洋地域のガラス製品市場、流通チャネル別、2019年~2028年(千米ドル)
表51 アジア太平洋地域のガラス製品市場、価格帯別、2019年~2028年(単位:千米ドル)
表52 アジア太平洋地域のガラス製品市場、用途別、2019年~2028年(単位:千米ドル)
表53 中国ガラス製品市場、材質別、2019-2028年(千米ドル)
表54 中国ガラス製品市場、材質別、2019-2028年(千個)
表55 中国ガラス製品市場、スタイル別、2019年~2028年(千米ドル)
表56 中国グラス製品市場における脚付きグラス、種類別、2019年~2028年(単位:千米ドル)
表57 中国ガラス製品市場における赤ワイングラス、種類別、2019年~2028年(千米ドル)
表58 中国ガラス製品市場における白ワイングラス、種類別、2019年~2028年(単位:千米ドル)
表59 中国ガラス製品市場におけるステムレスガラス、種類別、2019年~2028年(単位:千米ドル)
表60 中国ガラス製品市場、流通チャネル別、2019年~2028年(千米ドル)
表61 中国ガラス製品市場、価格帯別、2019年~2028年(単位:千米ドル)
表62 中国ガラス製品市場、用途別、2019年~2028年(千米ドル)
表63 インドのガラス製品市場、材質別、2019年~2028年(千米ドル)
表64 インドのガラス製品市場、材質別、2019-2028年(千個)
表65 インドのガラス製品市場、スタイル別、2019-2028年(千米ドル)
表66 インド グラス製品市場における脚付きグラス、種類別、2019年~2028年(単位:千米ドル)
表67 インドのガラス製品市場における赤ワイングラス、種類別、2019年~2028年(単位:千米ドル)
表68 インド ガラス製品市場における白ワイングラス、種類別、2019年~2028年(単位:千米ドル)
表69 インド ガラス製品市場におけるステムレスガラス、種類別、2019年~2028年(千米ドル)
表70 インドのガラス製品市場、流通チャネル別、2019年~2028年(千米ドル)
表71 インドのガラス製品市場、価格帯別、2019年~2028年(単位:千米ドル)
表72 インドのガラス製品市場、用途別、2019年~2028年(千米ドル)
表73 日本ガラス製品市場、材質別、2019年~2028年(千米ドル)
表74 日本ガラス製品市場、材質別、2019年~2028年(千個)
表75 日本ガラス製品市場、スタイル別、2019年~2028年(千米ドル)
表76 日本 グラスウェア市場(種類別)、2019年~2028年(千米ドル)
表77 日本 赤ワイングラス市場、種類別、2019年~2028年(単位:千米ドル)
表78 日本 ガラス製品市場における白ワイングラスの種類別、2019年~2028年(単位:千米ドル)
表79 日本 ステムレスグラス ガラス製品市場、種類別、2019年~2028年(単位:千米ドル)
表80 日本ガラス製品市場、流通チャネル別、2019年~2028年(千米ドル)
表81 日本ガラス製品市場、価格帯別、2019年~2028年(単位:千米ドル)
表82 日本ガラス製品市場、用途別、2019年~2028年(千米ドル)
表83 韓国ガラス製品市場、材質別、2019年~2028年(千米ドル)
表84 韓国ガラス製品市場、材質別、2019年~2028年(千個)
表85 韓国のガラス製品市場、スタイル別、2019年~2028年(千米ドル)
表86 韓国のグラス製品市場(種類別)、2019年~2028年(千米ドル)
表87 韓国のガラス製品市場における赤ワイングラス、種類別、2019年~2028年(単位:千米ドル)
表88 韓国のガラス製品市場における白ワイングラス、種類別、2019年~2028年(単位:千米ドル)
表89 韓国のガラス製品市場におけるステムレスグラス、種類別、2019年~2028年(単位:千米ドル)
表90 韓国ガラス製品市場、流通チャネル別、2019年~2028年(千米ドル)
表91 韓国のガラス製品市場、価格帯別、2019年~2028年(単位:千米ドル)
表92 韓国ガラス製品市場、用途別、2019年~2028年(千米ドル)
表93 シンガポールのガラス製品市場、材質別、2019年~2028年(千米ドル)
表94 シンガポールガラス製品市場、材質別、2019-2028年(千個)
表95 シンガポールのガラス製品市場、スタイル別、2019年~2028年(千米ドル)
表96 シンガポールのグラス製品市場における脚付きグラス、種類別、2019年~2028年(単位:千米ドル)
表97 シンガポールのガラス製品市場における赤ワイングラス、種類別、2019年~2028年(単位:千米ドル)
表98 シンガポールのガラス製品市場における白ワイングラス、種類別、2019年~2028年(単位:千米ドル)
表99 シンガポールのガラス製品市場におけるステムレスグラス、種類別、2019年~2028年(単位:千米ドル)
表100 シンガポールのガラス製品市場、流通チャネル別、2019年~2028年(千米ドル)
表101 シンガポールのガラス製品市場、価格帯別、2019年~2028年(単位:千米ドル)
表102 シンガポールのガラス製品市場、用途別、2019年~2028年(千米ドル)
表103 マレーシアのガラス製品市場、材質別、2019年~2028年(単位:千米ドル)
表104 マレーシアのガラス製品市場、材質別、2019年~2028年(千個)
表105 マレーシアのガラス製品市場、スタイル別、2019年~2028年(単位:千米ドル)
表106 マレーシアのグラス製品市場における脚付きグラス、種類別、2019年~2028年(単位:千米ドル)
表107 マレーシアのガラス製品市場における赤ワイングラス、種類別、2019年~2028年(単位:千米ドル)
表108 マレーシアのガラス製品市場における白ワイングラス、種類別、2019年~2028年(単位:千米ドル)
表109 マレーシアのガラス製品市場におけるステムレスグラス、種類別、2019年~2028年(単位:千米ドル)
表110 マレーシアのガラス製品市場、流通チャネル別、2019年~2028年(千米ドル)
表111 マレーシアのガラス製品市場、価格帯別、2019年~2028年(単位:千米ドル)
表112 マレーシアのガラス製品市場、用途別、2019年~2028年(単位:千米ドル)
表113 タイのガラス製品市場、材質別、2019年~2028年(単位:千米ドル)
表114 タイのガラス製品市場、材質別、2019年~2028年(千個)
表115 タイのガラス製品市場、スタイル別、2019年~2028年(単位:千米ドル)
表116 タイのグラス製品市場における脚付きグラス、種類別、2019年~2028年(単位:千米ドル)
表117 タイのガラス製品市場における赤ワイングラス、種類別、2019年~2028年(単位:千米ドル)
表118 タイのガラス製品市場における白ワイングラス、種類別、2019年~2028年(単位:千米ドル)
表119 タイのガラス製品市場におけるステムレスガラス、種類別、2019年~2028年(単位:千米ドル)
表120 タイのガラス製品市場、流通チャネル別、2019年~2028年(単位:千米ドル)
表121 タイのガラス製品市場、価格帯別、2019年~2028年(単位:千米ドル)
表122 タイのガラス製品市場、用途別、2019年~2028年(単位:千米ドル)
表123 オーストラリアとニュージーランドのガラス製品市場、材質別、2019-2028年(千米ドル)
表124 オーストラリアとニュージーランドのガラス製品市場、材質別、2019-2028年(千個)
表125 オーストラリアとニュージーランドのガラス製品市場、スタイル別、2019-2028年(千米ドル)
表126 オーストラリアとニュージーランドのグラス製品市場における脚付きグラス、タイプ別、2019年~2028年(千米ドル)
表127 オーストラリアとニュージーランドのガラス製品市場における赤ワイングラス、種類別、2019年~2028年(千米ドル)
表128 オーストラリアとニュージーランドのガラス製品市場における白ワイングラス、種類別、2019年~2028年(単位:千米ドル)
表129 オーストラリアとニュージーランドのガラス製品市場におけるステムレスグラス、タイプ別、2019年~2028年(千米ドル)
表130 オーストラリアとニュージーランドのガラス製品市場、流通チャネル別、2019年~2028年(千米ドル)
表131 オーストラリアとニュージーランドのガラス製品市場、価格帯別、2019年~2028年(千米ドル)
表132 オーストラリアとニュージーランドのガラス製品市場、用途別、2019年~2028年(千米ドル)
表133 インドネシアのガラス製品市場、材質別、2019年~2028年(千米ドル)
表134 インドネシアのガラス製品市場、材質別、2019-2028年(千個)
表135 インドネシアのガラス製品市場、スタイル別、2019-2028年(千米ドル)
表136 インドネシアのグラス製品市場(種類別)、2019年~2028年(千米ドル)
表137 インドネシアのガラス製品市場における赤ワイングラス、種類別、2019年~2028年(単位:千米ドル)
表138 インドネシアのガラス製品市場における白ワイングラス、種類別、2019年~2028年(単位:千米ドル)
表139 インドネシアのガラス製品市場におけるステムレスガラス、種類別、2019年~2028年(単位:千米ドル)
表140 インドネシアのガラス製品市場、流通チャネル別、2019年~2028年(千米ドル)
表141 インドネシアのガラス製品市場、価格帯別、2019年~2028年(単位:千米ドル)
表142 インドネシアのガラス製品市場、用途別、2019年~2028年(単位:千米ドル)
表143 フィリピンのガラス製品市場、材質別、2019-2028年(千米ドル)
表144 フィリピンのガラス製品市場、材質別、2019-2028年(千個)
表145 フィリピンのガラス製品市場、スタイル別、2019年~2028年(千米ドル)
表146 フィリピン グラスウェア市場における脚付きグラス、種類別、2019年~2028年(単位:千米ドル)
表147 フィリピンのガラス製品市場における赤ワイングラス、種類別、2019年~2028年(単位:千米ドル)
表148 フィリピンのガラス製品市場における白ワイングラス、種類別、2019年~2028年(単位:千米ドル)
表149 フィリピンのガラス製品市場におけるステムレスグラス、種類別、2019年~2028年(単位:千米ドル)
表150 フィリピンのガラス製品市場、流通チャネル別、2019年~2028年(千米ドル)
表151 フィリピンのガラス製品市場、価格帯別、2019年~2028年(千米ドル)
表152 フィリピンのガラス製品市場、用途別、2019年~2028年(千米ドル)
表153 香港ガラス製品市場、材質別、2019年~2028年(単位:千米ドル)
表154 香港ガラス製品市場、材質別、2019年~2028年(千個)
表155 香港ガラス製品市場、スタイル別、2019年~2028年(単位:千米ドル)
表156 香港のグラス製品市場における脚付きグラス、種類別、2019年~2028年(単位:千米ドル)
表157 香港のガラス製品市場における赤ワイングラス、種類別、2019年~2028年(単位:千米ドル)
表158 香港のガラス製品市場における白ワイングラス、種類別 2019-2028 (千米ドル)
表159 香港のガラス製品市場におけるステムレスグラス、種類別、2019年~2028年(単位:千米ドル)
表160 香港ガラス製品市場、流通チャネル別、2019年~2028年(千米ドル)
表161 香港ガラス製品市場、価格帯別、2019年~2028年(単位:千米ドル)
表162 香港ガラス製品市場、用途別、2019年~2028年(単位:千米ドル)
表163 台湾ガラス製品市場、材質別、2019年~2028年(単位:千米ドル)
表164 台湾ガラス製品市場、材質別、2019年~2028年(千個)
表165 台湾ガラス製品市場、スタイル別、2019年~2028年(単位:千米ドル)
表166 台湾のグラス製品市場(種類別)、2019年~2028年(千米ドル)
表167 台湾のガラス製品市場における赤ワイングラス、種類別、2019年~2028年(単位:千米ドル)
表168 台湾のガラス製品市場における白ワイングラス、種類別 2019-2028年 (単位:千米ドル)
表169 台湾のガラス製品市場におけるステムレスガラス、種類別、2019年~2028年(単位:千米ドル)
表170 台湾ガラス製品市場、流通チャネル別、2019年~2028年(千米ドル)
表171 台湾ガラス製品市場、価格帯別、2019年~2028年(単位:千米ドル)
表172 台湾ガラス製品市場、用途別、2019年~2028年(単位:千米ドル)
表173 アジア太平洋地域のその他の地域におけるガラス製品市場、材質別、2019年~2028年(単位:千米ドル)
表174 その他のアジア太平洋地域のガラス製品市場、材質別、2019年~2028年(千個)
表175 ヨーロッパのガラス製品市場、国別、2019-2028年(千米ドル)
表176 ヨーロッパのガラス製品市場、国別、2019-2028年(千個)
表177 ヨーロッパのガラス製品市場、材質別、2019-2028年(千米ドル)
表178 ヨーロッパのガラス製品市場、材質別、2019-2028年(千個)
表179 ヨーロッパのガラス製品市場、スタイル別、2019-2028年(千米ドル)
表180 ヨーロッパのグラス製品市場(種類別)、2019年~2028年(千米ドル)
表181 ヨーロッパのガラス製品市場における赤ワイングラス、種類別、2019年~2028年(単位:千米ドル)
表182 ヨーロッパのガラス製品市場における白ワイングラス、種類別、2019年~2028年(単位:千米ドル)
表183 ヨーロッパのステムレスガラス製品市場、タイプ別、2019年~2028年(単位:千米ドル)
表184 ヨーロッパのガラス製品市場、流通チャネル別、2019年~2028年(千米ドル)
表185 ヨーロッパのガラス製品市場、価格帯別、2019年~2028年(単位:千米ドル)
表186 ヨーロッパのガラス製品市場、用途別、2019年~2028年(単位:千米ドル)
表187 ドイツのガラス製品市場、材質別、2019-2028年(千米ドル)
表188 ドイツのガラス製品市場、材質別、2019-2028年(千個)
表189 ドイツのガラス製品市場、スタイル別、2019年~2028年(千米ドル)
表190 ドイツのグラス製品市場における脚付きグラス、種類別、2019年~2028年(単位:千米ドル)
表191 ドイツ産赤ワイングラス市場、種類別、2019年~2028年(単位:千米ドル)
表192 ドイツのガラス製品市場における白ワイングラスの種類別、2019年~2028年(単位:千米ドル)
表193 ドイツのガラス製品市場におけるステムレスガラス、種類別、2019年~2028年(単位:千米ドル)
表194 ドイツのガラス製品市場、流通チャネル別、2019年~2028年(千米ドル)
表195 ドイツのガラス製品市場、価格帯別、2019年~2028年(単位:千米ドル)
表196 ドイツのガラス製品市場、用途別、2019年~2028年(千米ドル)
表197 フランスのガラス製品市場、材質別、2019-2028年(千米ドル)
表198 フランスのガラス製品市場、材質別、2019-2028年(千個)
表199 フランスのガラス製品市場、スタイル別、2019年~2028年(千米ドル)
表200 フランスのグラス製品市場における脚付きグラス、種類別、2019年~2028年(単位:千米ドル)
表201 フランス産赤ワイングラスのガラス製品市場、種類別、2019年~2028年(単位:千米ドル)
表202 フランス産白ワイングラスのガラス製品市場、種類別、2019年~2028年(単位:千米ドル)
表203 フランスのガラス製品市場におけるステムレスグラス、種類別、2019年~2028年(単位:千米ドル)
表204 フランスのガラス製品市場、流通チャネル別、2019年~2028年(千米ドル)
表205 フランスのガラス製品市場、価格帯別、2019年~2028年(単位:千米ドル)
表206 フランスのガラス製品市場、用途別、2019年~2028年(千米ドル)
表207 イタリアのガラス製品市場、材質別、2019-2028年(千米ドル)
表208 イタリアのガラス製品市場、材質別、2019-2028年(千個)
表209 イタリアのガラス製品市場、スタイル別、2019年~2028年(千米ドル)
表210 イタリアのグラス製品市場における脚付きグラス、種類別、2019年~2028年(単位:千米ドル)
表211 イタリア産赤ワイングラス市場(種類別)、2019年~2028年(単位:千米ドル)
表212 イタリア産白ワイングラス市場(種類別)、2019年~2028年(単位:千米ドル)
表213 イタリアのガラス製品市場におけるステムレスグラス、種類別、2019年~2028年(単位:千米ドル)
表214 イタリアのガラス製品市場、流通チャネル別、2019年~2028年(千米ドル)
表215 イタリアのガラス製品市場、価格帯別、2019-2028年(千米ドル)
表216 イタリアのガラス製品市場、用途別、2019年~2028年(千米ドル)
表217 英国のガラス製品市場、材質別、2019-2028年(千米ドル)
表218 英国のガラス製品市場、材質別、2019-2028年(千個)
表219 英国のガラス製品市場、スタイル別、2019年~2028年(千米ドル)
表220 英国のグラス製品市場における脚付きグラスの種類別、2019年~2028年(単位:千米ドル)
表221 英国のガラス製品市場における赤ワイングラスの種類別、2019年~2028年(単位:千米ドル)
表222 英国のガラス製品市場における白ワイングラスの種類別、2019年~2028年(単位:千米ドル)
表223 英国のステムレスグラス市場(種類別)、2019年~2028年(千米ドル)
表224 英国のガラス製品市場、流通チャネル別、2019年~2028年(千米ドル)
表225 英国のガラス製品市場、価格帯別、2019年~2028年(単位:千米ドル)
表226 英国ガラス製品市場、用途別、2019年~2028年(千米ドル)
表227 トルコのガラス製品市場、材質別、2019-2028年(千米ドル)
表228 トルコのガラス製品市場、材質別、2019-2028年(千個)
表229 トルコのガラス製品市場、スタイル別、2019-2028年(千米ドル)
表230 トルコ製脚付きグラス(ガラス製品市場)、種類別、2019年~2028年(単位:千米ドル)
表231 トルコ産赤ワイングラスのガラス製品市場、種類別、2019年~2028年(単位:千米ドル)
表232 トルコ産白ワイングラスのガラス製品市場、種類別、2019年~2028年(単位:千米ドル)
表233 トルコのガラス製品市場におけるステムレスグラス、種類別、2019年~2028年(単位:千米ドル)
表234 トルコのガラス製品市場、流通チャネル別、2019-2028年(千米ドル)
表235 トルコのガラス製品市場、価格帯別、2019-2028年(千米ドル)
表236 トルコのガラス製品市場、用途別、2019年~2028年(単位:千米ドル)
表237 スイスのガラス製品市場、材質別、2019年~2028年(千米ドル)
表238 スイスのガラス製品市場、材質別、2019-2028年(千個)
表239 スイスのガラス製品市場、スタイル別、2019年~2028年(千米ドル)
表240 スイスのグラス製品市場における脚付きグラス、種類別、2019年~2028年(単位:千米ドル)
表241 スイスのガラス製品市場における赤ワイングラスの種類別、2019年~2028年(単位:千米ドル)
表242 スイスのガラス製品市場における白ワイングラスの種類別、2019年~2028年(単位:千米ドル)
表243 スイスのガラス製品市場におけるステムレスガラス、種類別、2019年~2028年(単位:千米ドル)
表244 スイスのガラス製品市場、流通チャネル別、2019年~2028年(千米ドル)
表245 スイスのガラス製品市場、価格帯別、2019年~2028年(千米ドル)
表246 スイスのガラス製品市場、用途別、2019年~2028年(千米ドル)
表247 スペインのガラス製品市場、材質別、2019-2028年(千米ドル)
表248 スペインのガラス製品市場、材質別、2019-2028年(千個)
表249 スペインのガラス製品市場、スタイル別、2019-2028年(千米ドル)
表250 スペインのグラス製品市場における脚付きグラス、種類別、2019年~2028年(単位:千米ドル)
表251 スペインのガラス製品市場における赤ワイングラス、種類別、2019年~2028年(単位:千米ドル)
表252 スペインのガラス製品市場における白ワイングラス、種類別、2019年~2028年(単位:千米ドル)
表253 スペインのガラス製品市場におけるステムレスグラス、種類別、2019年~2028年(千米ドル)
表254 スペインのガラス製品市場、流通チャネル別、2019年~2028年(千米ドル)
表255 スペインのガラス製品市場、価格帯別、2019-2028年(千米ドル)
表256 スペインのガラス製品市場、用途別、2019年~2028年(千米ドル)
表257 ロシアのガラス製品市場、材質別、2019-2028年(千米ドル)
表258 ロシアのガラス製品市場、材質別、2019-2028年(千個)
表259 ロシアのガラス製品市場、スタイル別、2019-2028年(千米ドル)
表260 ロシアのグラス製品市場における脚付きグラス、種類別、2019年~2028年(単位:千米ドル)
表261 ロシアのガラス製品市場における赤ワイングラス、種類別、2019年~2028年(単位:千米ドル)
表262 ロシアのガラス製品市場における白ワイングラスの種類別、2019年~2028年(単位:千米ドル)
表263 ロシアのガラス製品市場におけるステムレスガラス、種類別、2019年~2028年(単位:千米ドル)
表264 ロシアのガラス製品市場、流通チャネル別、2019年~2028年(千米ドル)
表265 ロシアのガラス製品市場、価格帯別、2019-2028年(千米ドル)
表266 ロシアのガラス製品市場、用途別、2019年~2028年(千米ドル)
表267 オランダのガラス製品市場、材質別、2019-2028年(千米ドル)
表268 オランダのガラス製品市場、材質別、2019-2028年(千個)
表269 オランダのガラス製品市場、スタイル別、2019-2028年(千米ドル)
表270 オランダのグラス製品市場における脚付きグラス、種類別、2019年~2028年(単位:千米ドル)
表271 オランダのガラス製品市場における赤ワイングラスの種類別、2019年~2028年(単位:千米ドル)
表272 オランダのガラス製品市場における白ワイングラスの種類別、2019年~2028年(単位:千米ドル)
表273 オランダのガラス製品市場におけるステムレスガラス、種類別、2019年~2028年(単位:千米ドル)
表274 オランダのガラス製品市場、流通チャネル別、2019年~2028年(千米ドル)
表275 オランダのガラス製品市場、価格帯別、2019-2028年(千米ドル)
表276 オランダのガラス製品市場、用途別、2019年~2028年(千米ドル)
表277 ベルギーのガラス製品市場、材質別、2019-2028年(千米ドル)
表278 ベルギーのガラス製品市場、材質別、2019-2028年(千個)
表279 ベルギーのガラス製品市場、スタイル別、2019-2028年(千米ドル)
表280 ベルギーのグラス製品市場における脚付きグラス、種類別、2019年~2028年(単位:千米ドル)
表281 ベルギー産赤ワイングラスのガラス製品市場、種類別、2019年~2028年(単位:千米ドル)
表282 ベルギー産白ワイングラスのガラス製品市場、種類別、2019年~2028年(単位:千米ドル)
表283 ベルギーのステムレスグラス製品市場、種類別、2019年~2028年(単位:千米ドル)
表284 ベルギーのガラス製品市場、流通チャネル別、2019-2028年(千米ドル)
表285 ベルギーのガラス製品市場、価格帯別、2019-2028年(千米ドル)
表286 ベルギーのガラス製品市場、用途別、2019年~2028年(千米ドル)
表287 ヨーロッパのその他の地域のガラス製品市場、材質別、2019-2028年(千米ドル)
表288 ヨーロッパのその他の地域のガラス製品市場、材質別、2019-2028年(千個)
表289 北米ガラス製品市場、国別、2019-2028年(千米ドル)
表290 北米ガラス製品市場、国別、2019-2028年(千個)
表291 北米ガラス製品市場、材質別、2019年~2028年(単位:千米ドル)
表292 北米ガラス製品市場、材質別、2019-2028年(千個)
表293 北米ガラス製品市場、スタイル別、2019年~2028年(千米ドル)
表294 北米のグラス製品市場(種類別)、2019年~2028年(単位:千米ドル)
表295 北米のガラス製品市場における赤ワイングラスの種類別、2019年~2028年(単位:千米ドル)
表296 北米のガラス製品市場における白ワイングラスの種類別、2019年~2028年(単位:千米ドル)
表297 北米のステムレスガラス製品市場、タイプ別、2019年~2028年(単位:千米ドル)
表298 北米ガラス製品市場、流通チャネル別、2019年~2028年(千米ドル)
表299 北米ガラス製品市場、価格帯別、2019年~2028年(単位:千米ドル)
表300 北米ガラス製品市場、用途別、2019年~2028年(単位:千米ドル)
表301 米国ガラス製品市場、材質別、2019年~2028年(千米ドル)
表302 米国ガラス製品市場、材質別、2019年~2028年(千個)
表303 米国ガラス製品市場、スタイル別、2019年~2028年(単位:千米ドル)
表304 米国のグラス製品市場における脚付きグラス、種類別、2019年~2028年(単位:千米ドル)
表305 米国のガラス製品市場における赤ワイングラスの種類別、2019年~2028年(単位:千米ドル)
表306 米国のガラス製品市場における白ワイングラスの種類別、2019年~2028年(単位:千米ドル)
表307 米国のガラス製品市場におけるステムレスガラス、種類別、2019年~2028年(単位:千米ドル)
表308 米国ガラス製品市場、流通チャネル別、2019年~2028年(千米ドル)
表309 米国ガラス製品市場、価格帯別、2019年~2028年(単位:千米ドル)
表310 米国ガラス製品市場、用途別、2019年~2028年(単位:千米ドル)
表311 カナダのガラス製品市場、材質別、2019年~2028年(千米ドル)
表312 カナダのガラス製品市場、材質別、2019年~2028年(千個)
表313 カナダのガラス製品市場、スタイル別、2019年~2028年(単位:千米ドル)
表314 カナダのグラス製品市場における脚付きグラス、種類別、2019年~2028年(単位:千米ドル)
表315 カナダのガラス製品市場における赤ワイングラス、種類別、2019年~2028年(単位:千米ドル)
表316 カナダのガラス製品市場における白ワイングラス、種類別、2019年~2028年(単位:千米ドル)
表317 カナダのガラス製品市場におけるステムレスグラス、種類別、2019年~2028年(単位:千米ドル)
表318 カナダのガラス製品市場、流通チャネル別、2019年~2028年(千米ドル)
表319 カナダのガラス製品市場、価格帯別、2019年~2028年(単位:千米ドル)
表320 カナダのガラス製品市場、用途別、2019年~2028年(単位:千米ドル)
表321 メキシコガラス製品市場、材質別、2019-2028年(千米ドル)
表322 メキシコガラス製品市場、材質別、2019-2028年(千個)
表323 メキシコガラス製品市場、スタイル別、2019-2028年(千米ドル)
表324 メキシコ グラス製品市場における脚付きグラス、種類別、2019年~2028年(単位:千米ドル)
表325 メキシコのガラス製品市場における赤ワイングラス、種類別、2019年~2028年(千米ドル)
表326 メキシコのガラス製品市場における白ワイングラス、種類別、2019年~2028年(単位:千米ドル)
表327 メキシコ ガラス製品市場におけるステムレスグラス、種類別、2019年~2028年(千米ドル)
表328 メキシコガラス製品市場、流通チャネル別、2019年~2028年(千米ドル)
表329 メキシコのガラス製品市場、価格帯別、2019年~2028年(単位:千米ドル)
表330 メキシコガラス製品市場、用途別、2019年~2028年(単位:千米ドル)
表331 南米ガラス製品市場、国別、2019-2028年(千米ドル)
表332 南米ガラス製品市場、国別、2019-2028年(千個)
表333 南米ガラス製品市場、材質別、2019-2028年(単位:千米ドル)
表334 南米ガラス製品市場、材質別、2019-2028年(千個)
表335 南米ガラス製品市場、スタイル別、2019-2028年(単位:千米ドル)
表336 南米のグラスウェア市場(種類別)、2019年~2028年(単位:千米ドル)
表337 南米のガラス製品市場における赤ワイングラス、種類別、2019年~2028年(単位:千米ドル)
表338 南米のガラス製品市場における白ワイングラス、種類別、2019年~2028年(単位:千米ドル)
表339 南米のガラス製品市場におけるステムレスガラス、種類別、2019年~2028年(単位:千米ドル)
表340 南米ガラス製品市場、流通チャネル別、2019年~2028年(単位:千米ドル)
表341 南米ガラス製品市場、価格帯別、2019年~2028年(単位:千米ドル)
表342 南米ガラス製品市場、用途別、2019年~2028年(単位:千米ドル)
表343 ブラジルのガラス製品市場、材質別、2019-2028年(千米ドル)
表344 ブラジルのガラス製品市場、材質別、2019-2028年(千個)
表345 ブラジルのガラス製品市場、スタイル別、2019-2028年(千米ドル)
表346 ブラジルのグラス製品市場における脚付きグラス、種類別、2019年~2028年(単位:千米ドル)
表347 ブラジル産赤ワイングラス市場(種類別)、2019年~2028年(単位:千米ドル)
表348 ブラジル産白ワイングラス市場(種類別、2019年~2028年)(単位:千米ドル)
表349 ブラジルのガラス製品市場におけるステムレスガラス、種類別、2019年~2028年(単位:千米ドル)
表350 ブラジルのガラス製品市場、流通チャネル別、2019年~2028年(千米ドル)
表351 ブラジルのガラス製品市場、価格帯別、2019年~2028年(単位:千米ドル)
表352 ブラジルのガラス製品市場、用途別、2019年~2028年(単位:千米ドル)
表353 アルゼンチンガラス製品市場、材質別、2019-2028年(千米ドル)
表354 アルゼンチンガラス製品市場、材質別、2019-2028年(千個)
表355 アルゼンチンのガラス製品市場、スタイル別、2019-2028年(千米ドル)
表356 アルゼンチンのグラス製品市場における脚付きグラス、種類別、2019年~2028年(単位:千米ドル)
表357 アルゼンチンのガラス製品市場における赤ワイングラス、種類別、2019年~2028年(単位:千米ドル)
表358 アルゼンチンのガラス製品市場における白ワイングラス、種類別、2019年~2028年(単位:千米ドル)
表359 アルゼンチンのガラス製品市場におけるステムレスグラス、種類別、2019年~2028年(単位:千米ドル)
表360 アルゼンチンのガラス製品市場、流通チャネル別、2019年~2028年(千米ドル)
表361 アルゼンチンのガラス製品市場、価格帯別、2019年~2028年(単位:千米ドル)
表362 アルゼンチンガラス製品市場、用途別、2019年~2028年(単位:千米ドル)
表363 南米その他の地域のガラス製品市場、材質別、2019-2028年(単位:千米ドル)
表364 南米その他の地域のガラス製品市場、材質別、2019-2028年(千個)
表365 中東およびアフリカのガラス製品市場、国別、2019-2028年(千米ドル)
表366 中東およびアフリカのガラス製品市場、国別、2019-2028年(千個)
表367 中東およびアフリカのガラス製品市場、材質別、2019年~2028年(千米ドル)
表368 中東およびアフリカのガラス製品市場、材質別、2019年~2028年(千個)
表369 中東およびアフリカのガラス製品市場、スタイル別、2019年~2028年(千米ドル)
表370 中東およびアフリカのグラス製品市場(種類別)、2019年~2028年(単位:千米ドル)
表371 中東およびアフリカのガラス製品市場における赤ワイングラス、種類別、2019年~2028年(単位:千米ドル)
表372 中東およびアフリカのガラス製品市場における白ワイングラス、種類別、2019年~2028年(単位:千米ドル)
表373 中東およびアフリカのステムレスガラス製品市場、種類別、2019年~2028年(単位:千米ドル)
表374 中東およびアフリカのガラス製品市場、流通チャネル別、2019年~2028年(千米ドル)
表375 中東およびアフリカのガラス製品市場、価格帯別、2019年~2028年(単位:千米ドル)
表376 中東およびアフリカのガラス製品市場、用途別、2019年~2028年(千米ドル)
表377 UAEガラス製品市場、材質別、2019-2028年(千米ドル)
表378 UAEガラス製品市場、材質別、2019-2028年(千個)
表379 UAEガラス製品市場、スタイル別、2019-2028年(千米ドル)
表380 UAEのグラス製品市場における脚付きグラス、種類別、2019年~2028年(単位:千米ドル)
表381 UAEのガラス製品市場における赤ワイングラスの種類別、2019年~2028年(単位:千米ドル)
表382 UAEのガラス製品市場における白ワイングラスの種類別、2019年~2028年(単位:千米ドル)
表383 UAEのガラス製品市場におけるステムレスガラス、種類別、2019年~2028年(単位:千米ドル)
表384 UAEガラス製品市場、流通チャネル別、2019-2028年(千米ドル)
表385 UAEガラス製品市場、価格帯別、2019-2028年(千米ドル)
表386 UAEガラス製品市場、用途別、2019年~2028年(単位:千米ドル)
表387 サウジアラビアのガラス製品市場、材質別、2019年~2028年(千米ドル)
表388 サウジアラビアのガラス製品市場、材質別、2019年~2028年(千個)
表389 サウジアラビアのガラス製品市場、スタイル別、2019年~2028年(千米ドル)
表390 サウジアラビアのグラス製品市場(種類別)、2019年~2028年(単位:千米ドル)
表391 サウジアラビアのガラス製品市場における赤ワイングラスの種類別、2019年~2028年(単位:千米ドル)
表392 サウジアラビアのガラス製品市場における白ワイングラスの種類別、2019年~2028年(単位:千米ドル)
表393 サウジアラビアのガラス製品市場におけるステムレスガラス、種類別、2019年~2028年(単位:千米ドル)
表394 サウジアラビアのガラス製品市場、流通チャネル別、2019年~2028年(千米ドル)
表395 サウジアラビアのガラス製品市場、価格帯別、2019年~2028年(単位:千米ドル)
表396 サウジアラビアのガラス製品市場、用途別、2019年~2028年(千米ドル)
表397 南アフリカのガラス製品市場、材質別、2019-2028年(単位:千米ドル)
表398 南アフリカのガラス製品市場、材質別、2019-2028年(千個)
表399 南アフリカのガラス製品市場、スタイル別、2019-2028年(単位:千米ドル)
表400 南アフリカのグラス製品市場における脚付きグラス、種類別、2019年~2028年(単位:千米ドル)
表401 南アフリカのガラス製品市場における赤ワイングラス、種類別、2019年~2028年(単位:千米ドル)
表402 南アフリカのガラス製品市場における白ワイングラス、種類別、2019年~2028年(単位:千米ドル)
表403 南アフリカのガラス製品市場におけるステムレスガラス、種類別、2019年~2028年(単位:千米ドル)
表404 南アフリカのガラス製品市場、流通チャネル別、2019年~2028年(単位:千米ドル)
表405 南アフリカのガラス製品市場、価格帯別、2019年~2028年(単位:千米ドル)
表406 南アフリカのガラス製品市場、用途別、2019年~2028年(単位:千米ドル)
表407 エジプトのガラス製品市場、材質別、2019-2028年(千米ドル)
表408 エジプトのガラス製品市場、材質別、2019-2028年(千個)
表409 エジプトのガラス製品市場、スタイル別、2019-2028年(千米ドル)
表410 エジプトのグラス製品市場(種類別)、2019年~2028年(単位:千米ドル)
表411 エジプトのガラス製品市場における赤ワイングラスの種類別、2019年~2028年(単位:千米ドル)
表412 エジプトのガラス製品市場における白ワイングラスの種類別、2019年~2028年(単位:千米ドル)
表413 エジプトのガラス製品市場におけるステムレスガラス、種類別、2019年~2028年(単位:千米ドル)
表414 エジプトのガラス製品市場、流通チャネル別、2019年~2028年(千米ドル)
表415 エジプトのガラス製品市場、価格帯別、2019-2028年(千米ドル)
表416 エジプトのガラス製品市場、用途別、2019年~2028年(単位:千米ドル)
表417 イスラエルのガラス製品市場、材質別、2019-2028年(千米ドル)
表418 イスラエルのガラス製品市場、材質別、2019-2028年(千個)
表419 イスラエルのガラス製品市場、スタイル別、2019年~2028年(千米ドル)
表420 イスラエルのグラス製品市場における脚付きグラス、種類別、2019年~2028年(単位:千米ドル)
表421 イスラエルのガラス製品市場における赤ワイングラスの種類別、2019年~2028年(単位:千米ドル)
表422 イスラエルのガラス製品市場における白ワイングラスの種類別、2019年~2028年(単位:千米ドル)
表423 イスラエルのガラス製品市場におけるステムレスガラス、種類別、2019年~2028年(単位:千米ドル)
表424 イスラエルのガラス製品市場、流通チャネル別、2019年~2028年(千米ドル)
表425 イスラエルのガラス製品市場、価格帯別、2019年~2028年(単位:千米ドル)
表426 イスラエルのガラス製品市場、用途別、2019年~2028年(千米ドル)
表427 中東およびアフリカのその他の地域のガラス製品市場、材質別、2019-2028年(千米ドル)
表428 中東およびアフリカのその他の地域のガラス製品市場、材質別、2019-2028年(千個)
図表一覧
図1 世界のガラス製品市場:セグメンテーション
図2 世界のガラス製品市場:データの三角測量
図3 世界のガラス製品市場:DROC分析
図4 世界のガラス製品市場:世界市場と地域市場の比較分析
図5 世界のガラス製品市場:企業調査分析
図6 世界のガラス製品市場:製品ライフライン曲線
図7 世界のガラス製品市場:多変量モデリング
図8 世界のガラス製品市場:インタビュー人口統計
図9 世界のガラス製品市場:DBMR市場ポジショングリッド
図10 世界のガラス製品市場:市場アプリケーションカバレッジグリッド
図11 世界のガラス製品市場:市場課題マトリックス
図12 世界のガラス製品市場:ベンダーシェア分析
図13 世界のガラス製品市場:セグメンテーション
図14 アジア太平洋地域は世界のガラス製品市場を支配すると予想され、2021年から2028年の予測期間に最も高いCAGRで成長すると予想されています。
図15 世界中で高級レストランの人気の高まりが、2021年から2028年の予測期間における世界のガラス製品市場を牽引しています。
図16 ソーダ石灰ガラスセグメントは、2021年と2028年に世界のガラス製品市場で最大のシェアを占めると予想されています。
図17:アジア太平洋地域は、2021年から2028年の予測期間においてガラス製品市場メーカーにとって最も急速に成長する市場である。
図18 世界のガラス製品市場の推進要因、制約要因、機会、課題
図19 世界の高級ホテル数(ラグジュアリークラス)、2002年~2018年(概算)
図20 世界のガラス製品市場(材質別、2020年)
図21 世界のガラス製品市場(スタイル別、2020年)
図22 世界のガラス製品市場(流通チャネル別、2020年)
図23 世界のガラス製品市場(価格帯別、2020年)
図24 世界のガラス製品市場(最終用途別、2020年)
図25 世界のガラス製品市場:スナップショット(2020年)
図26 世界のガラス製品市場:地域別(2020年)
図27 世界のガラス製品市場:地域別(2021年と2028年)
図28 世界のガラス製品市場:地域別(2020年と2028年)
図29 世界のガラス製品市場:材質別(2021~2028年)
図30 アジア太平洋地域のガラス製品市場:スナップショット(2020年)
図31 アジア太平洋地域のガラス製品市場:国別(2020年)
図32 アジア太平洋地域のガラス製品市場:国別(2021年および2028年)
図33 アジア太平洋地域のガラス製品市場:国別(2020年と2028年)
図34 アジア太平洋地域のガラス製品市場:材質別(2021~2028年)
図35 ヨーロッパのガラス製品市場:スナップショット(2020年)
図36 ヨーロッパのガラス製品市場:国別(2020年)
図37 ヨーロッパのガラス製品市場:国別(2021年と2028年)
図38 ヨーロッパのガラス製品市場:国別(2020年と2028年)
図39 ヨーロッパのガラス製品市場:材質別(2021-2028年)
図40 北米ガラス製品市場:スナップショット(2020年)
図41 北米ガラス製品市場:国別(2020年)
図42 北米ガラス製品市場:国別(2021年および2028年)
図43 北米ガラス製品市場:国別(2020年と2028年)
図44 北米ガラス製品市場:材質別(2021-2028年)
図45 南米ガラス製品市場:スナップショット(2020年)
図46 南米ガラス製品市場:国別(2020年)
図47 南米ガラス製品市場:国別(2021年および2028年)
図48 南米ガラス製品市場:国別(2020年と2028年)
図49 南米ガラス製品市場:材質別(2021-2028年)
図50 中東およびアフリカのガラス製品市場:スナップショット(2020年)
図51 中東およびアフリカのガラス製品市場:国別(2020年)
図52 中東およびアフリカのガラス製品市場:国別(2021年および2028年)
図53 中東およびアフリカのガラス製品市場:国別(2020年および2028年)
図54 中東およびアフリカのガラス製品市場:材質別(2021-2028年)
図55 世界のガラス製品市場:企業シェア2020(%)
図56 北米ガラス製品市場:企業シェア2020(%)
図57 ヨーロッパのガラス製品市場:企業シェア2020(%)
図58 アジア太平洋地域のガラス製品市場:企業シェア2020(%)
調査方法
データ収集と基準年分析は、大規模なサンプル サイズのデータ収集モジュールを使用して行われます。この段階では、さまざまなソースと戦略を通じて市場情報または関連データを取得します。過去に取得したすべてのデータを事前に調査および計画することも含まれます。また、さまざまな情報ソース間で見られる情報の不一致の調査も含まれます。市場データは、市場統計モデルと一貫性モデルを使用して分析および推定されます。また、市場シェア分析と主要トレンド分析は、市場レポートの主要な成功要因です。詳細については、アナリストへの電話をリクエストするか、お問い合わせをドロップダウンしてください。
DBMR 調査チームが使用する主要な調査方法は、データ マイニング、データ変数が市場に与える影響の分析、および一次 (業界の専門家) 検証を含むデータ三角測量です。データ モデルには、ベンダー ポジショニング グリッド、市場タイムライン分析、市場概要とガイド、企業ポジショニング グリッド、特許分析、価格分析、企業市場シェア分析、測定基準、グローバルと地域、ベンダー シェア分析が含まれます。調査方法について詳しくは、お問い合わせフォームから当社の業界専門家にご相談ください。
カスタマイズ可能
Data Bridge Market Research は、高度な形成的調査のリーダーです。当社は、既存および新規のお客様に、お客様の目標に合致し、それに適したデータと分析を提供することに誇りを持っています。レポートは、対象ブランドの価格動向分析、追加国の市場理解 (国のリストをお問い合わせください)、臨床試験結果データ、文献レビュー、リファービッシュ市場および製品ベース分析を含めるようにカスタマイズできます。対象競合他社の市場分析は、技術ベースの分析から市場ポートフォリオ戦略まで分析できます。必要な競合他社のデータを、必要な形式とデータ スタイルでいくつでも追加できます。当社のアナリスト チームは、粗い生の Excel ファイル ピボット テーブル (ファクト ブック) でデータを提供したり、レポートで利用可能なデータ セットからプレゼンテーションを作成するお手伝いをしたりすることもできます。

