
Global Glassware Market
Market Size in USD Billion
 USD
2.88 Billion
USD
4.36 Billion
2024
2032
USD
2.88 Billion
USD
4.36 Billion
2024
2032
| 2025 - 2032 | |
| USD 2.88 Billion | |
| USD 4.36 Billion | |
| % | |
|
Glassware Market Size
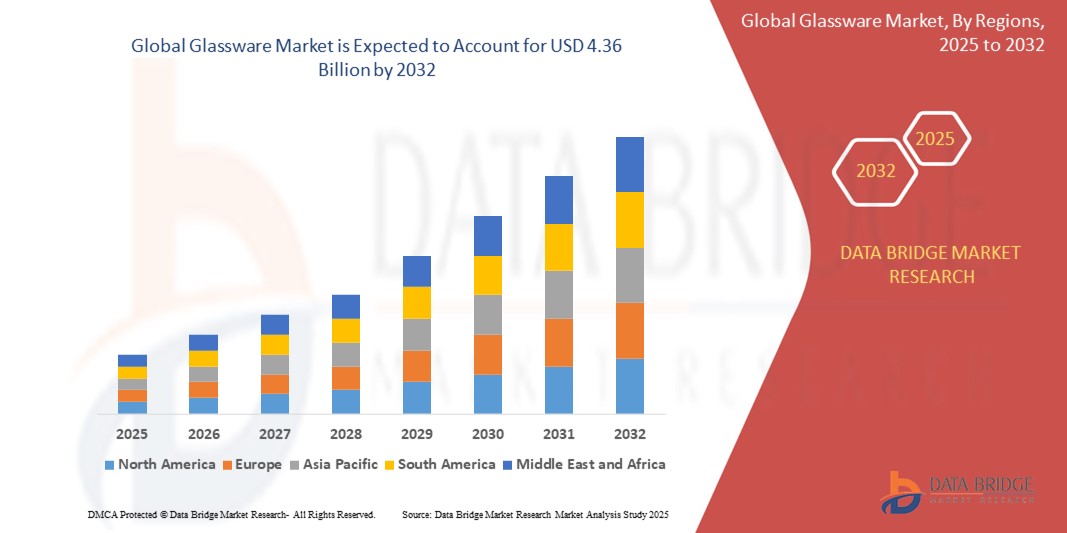
- The global glassware market size was valued at USD 2.88 billion in 2024 and is expected to reach USD 4.36 billion by 2032, at a CAGR of 5.30% during the forecast period
- The market growth is largely fuelled by the increasing demand for premium dining and kitchen products, rising consumer preference for eco-friendly and reusable alternatives to plastic, and expanding foodservice and hospitality sectors globally
- In addition, the rise of online retail channels and home décor influencers is significantly boosting the visibility and accessibility of designer and customized glassware across both urban and semi-urban regions
Glassware Market Analysis
- Rising adoption of stylish and durable glassware in residential settings, driven by home dining trends and aesthetic appeal, is a key contributor to market growth
- The foodservice and hospitality industry continues to be a major revenue generator, with restaurants, bars, and hotels investing in high-quality glassware to enhance customer experience
- North America dominated the global glassware market with the largest revenue share of 36.8% in 2024, driven by rising consumer preference for premium dining aesthetics, growing demand for reusable household items, and the increasing shift away from plastic
- Asia-Pacific region is expected to witness the highest growth rate in the global glassware market, driven by rising urbanization, increasing disposable incomes, and a surge in demand for modern homeware and premium dining products across emerging economies such as China, India, and Southeast Asian countries
- The soda lime glass segment accounted for the largest market revenue share in 2024, owing to its widespread use in everyday glassware due to its affordability, workability, and clear appearance. It is the most commonly used material for tumblers, plates, and general-purpose glass items across residential and commercial applications
Report Scope and Glassware Market Segmentation
|
Attributes |
Glassware Key Market Insights |
|
Segments Covered |
|
|
Countries Covered |
North America
Europe
Asia-Pacific
Middle East and Africa
South America
|
|
Key Market Players |
|
|
Market Opportunities |
|
|
Value Added Data Infosets |
In addition to the insights on market scenarios such as market value, growth rate, segmentation, geographical coverage, and major players, the market reports curated by the Data Bridge Market Research also include import export analysis, production capacity overview, production consumption analysis, price trend analysis, climate change scenario, supply chain analysis, value chain analysis, raw material/consumables overview, vendor selection criteria, PESTLE Analysis, Porter Analysis, and regulatory framework. |
Glassware Market Trends
“Growing Popularity of Handcrafted and Artisanal Glassware”
- Consumers are increasingly drawn to handcrafted and artisanal glassware that reflects personal taste, uniqueness, and cultural heritage, moving away from mass-produced items
- These products often showcase local craftsmanship, traditional glassblowing techniques, and distinct regional styles that appeal to both domestic and international buyers
- Artisanal glassware is gaining popularity in premium dining experiences, where aesthetics and storytelling are considered part of the overall customer journey
- Online platforms, home décor influencers, and lifestyle bloggers are playing a key role in amplifying awareness and demand for handmade glass items
- Customized and limited-edition glass pieces are frequently used for special occasions, luxury gifting, and interior decoration
- For instance, Brands such as Glassybaby (U.S.), which sells hand-blown votives with a social cause, and LSA International (U.K.), known for its hand-crafted barware, have seen sustained consumer interest through online and boutique channels
Glassware Market Dynamics
Driver
“Rising Demand for Eco-Friendly and Reusable Alternatives to Plastic”
- Growing environmental consciousness is leading both consumers and institutions to choose glass over plastic due to its recyclability, durability, and inert properties
- Glassware products such as bottles, storage jars, and lunch containers are becoming staples in eco-friendly households, particularly among millennial and Gen Z demographics
- Regulatory measures across regions — including bans on single-use plastics — are pushing manufacturers and retailers to expand their sustainable glassware offerings
- Businesses in the foodservice sector are transitioning to reusable glass drinkware and serving items to comply with green standards and improve brand image
- Increased innovation in tempered and borosilicate glass has improved product safety and lifespan, making glassware more practical for everyday use
- Following the EU’s single-use plastics directive, major supermarket chains in Germany and France replaced plastic packaging with glass containers for dairy and condiment products, boosting glassware demand across Europe
Restraint/Challenge
“High Fragility and Risk of Breakage During Transport and Usage”
- Glassware is inherently fragile and susceptible to cracking or shattering during shipping, handling, and cleaning, especially in high-traffic environments
- Distributors and retailers are required to invest in heavy-duty, shock-absorbing packaging materials that increase logistical costs and reduce profit margins
- The risk of injury or liability from broken glass deters certain commercial establishments from adopting glass over more impact-resistant materials
- Consumers in households with children or elderly individuals often avoid glassware due to safety concerns, limiting its appeal in family segments
- The lack of standardized insurance or replacement policies for glass products discourages bulk orders, particularly in cost-sensitive markets
- For instance, Independent restaurants and cafes in Southeast Asia report frequent breakage of imported glassware, leading them to opt for melamine or polycarbonate alternatives in day-to-day operations despite aesthetic compromises
Glassware Market Scope
The market is segmented on the basis of material, style, distribution channel, price range, and end-use.
• By Material
On the basis of material, the glassware market is segmented into soda lime glass, lead glass, heat resistant, and others. The soda lime glass segment accounted for the largest market revenue share in 2024, owing to its widespread use in everyday glassware due to its affordability, workability, and clear appearance. It is the most commonly used material for tumblers, plates, and general-purpose glass items across residential and commercial applications.
The heat resistant segment is expected to witness a fastest growth rate from 2025 to 2032, driven by growing consumer demand for microwave-safe and durable glassware. Its ability to withstand high thermal stress makes it suitable for baking, cooking, and food storage, particularly in urban households and commercial kitchens that prioritize multifunctional cookware.
• By Style
On the basis of style, the glassware market is segmented into stemless glass, stemware, everyday usage, and others. The everyday usage segment dominated the market in 2024, as these products serve a wide range of functions in homes, offices, and hospitality spaces. Consumers prefer these practical items for their versatility, ease of cleaning, and stackable design.
The stemware segment is expected to witness a fastest growth rate from 2025 to 2032, supported by rising consumption of wine and cocktails, and an increasing emphasis on dining aesthetics. Upscale restaurants, bars, and households are investing in premium stemware to enhance table presentation and user experience.
• By Distribution Channel
On the basis of distribution channel, the glassware market is segmented into B2B, specialized stores, supermarkets/hypermarkets, e-commerce, and others. The B2B segment accounted for the largest market share in 2024, primarily driven by bulk procurement from hotels, restaurants, and corporate caterers.
The e-commerce segment is expected to witness a fastest growth rate from 2025 to 2032, attributed to the convenience of online purchasing, access to a wider variety of designs, and growth in digital retailing platforms. Influencer marketing and online gifting trends are also accelerating online glassware sales.
• By Price Range
On the basis of price range, the glassware market is segmented into medium, premium, and economy. The medium segment held the largest share in 2024, as it offers a balanced combination of quality and affordability, appealing to the mass middle-income consumer base.
The premium segment is expected to witness a fastest growth rate from 2025 to 2032, owing to rising demand for branded, designer glassware collections for gifting, formal dining, and special occasions. The luxury hospitality sector’s inclination toward elegant tabletop products is also fueling this trend.
• By End-Use
On the basis of end-use, the market is segmented into hotels & restaurants, bars & café, household, corporate canteens, and others. The household segment led the market with the largest revenue share in 2024, driven by growing home dining, online food delivery, and gifting preferences.
The bars & café segment is expected to witness a fastest growth rate from 2025 to 2032, supported by the global expansion of casual dining chains and increasing social outings. These establishments prioritize glassware not just for functionality but also for creating a consistent brand and ambiance.
Glassware Market Regional Analysis
- North America dominated the global glassware market with the largest revenue share of 36.8% in 2024, driven by rising consumer preference for premium dining aesthetics, growing demand for reusable household items, and the increasing shift away from plastic
- Consumers in the region prioritize both functionality and design, favoring tempered, lead-free, and heat-resistant glassware for household and commercial use
- The market also benefits from strong demand across restaurants, hotels, and cafes, coupled with high disposable incomes and the influence of lifestyle trends that emphasize sustainable, elegant tableware
U.S. Glassware Market Insight
The U.S. glassware market accounted for the largest revenue share of 79.4% in 2024 within North America, supported by the rise in at-home dining, culinary experimentation, and premium kitchenware purchases. Demand for personalized and artisanal glassware continues to grow, especially through e-commerce platforms and specialty retailers. The increasing adoption of eco-conscious habits, such as using glass containers and reusable drinkware, also contributes to market expansion. The hospitality industry’s focus on enhancing presentation standards further drives the need for quality glassware.
Europe Glassware Market Insight
The Europe glassware market is expected to witness a fastest growth rate from 2025 to 2032, bolstered by a well-established culture of wine and spirits consumption, which fuels demand for high-quality stemware. Sustainability regulations and consumer awareness are encouraging the use of recyclable materials, with many European households and restaurants opting for durable, elegant glass options. Growth is particularly notable in countries with deep-rooted culinary traditions and evolving lifestyle trends favoring reusable and aesthetically appealing products.
U.K. Glassware Market Insight
The U.K. glassware market is expected to witness a fastest growth rate from 2025 to 2032, driven by rising e-commerce sales, shifting dining habits, and the growing popularity of home décor and kitchenware trends. Consumers are investing more in home-based experiences, such as personal dining setups and kitchen upgrades, leading to increased demand for affordable yet stylish glassware. Independent brands and artisan glassmakers are also gaining attention, especially in the gifting and premium household segment.
Germany Glassware Market Insight
Germany’s glassware market is expected to witness a fastest growth rate from 2025 to 2032, underpinned by its strong manufacturing base, high-quality craftsmanship, and consumer focus on sustainable, functional design. With a long-standing reputation for precision glass production, German companies continue to lead in innovation for both household and commercial-grade glassware. The foodservice industry’s preference for reusable and temperature-resistant glass items also plays a significant role in driving demand across sectors.
Asia-Pacific Glassware Market Insight
The Asia-Pacific glassware market is expected to witness a fastest growth rate from 2025 to 2032, fueled by rising urbanization, increasing disposable incomes, and expanding hospitality and foodservice industries. Markets such as China, India, and Japan are witnessing strong demand for both everyday and premium glassware as consumer preferences evolve. Government regulations encouraging sustainable packaging and dining solutions are also pushing businesses and households toward glass-based alternatives.
Japan Glassware Market Insight
The Japan glassware market is expected to witness a fastest growth rate from 2025 to 2032, due to rising interest in minimalist aesthetics, high-quality home goods, and traditional craftsmanship. The growing number of single-person and dual-income households has led to increased investment in compact, elegant, and versatile kitchenware. In addition, the cultural emphasis on food presentation supports steady demand for aesthetically refined tableware, including hand-crafted and high-durability glassware.
China Glassware Market Insight
The China glassware market captured the largest revenue share in Asia-Pacific in 2024, propelled by the country’s strong manufacturing ecosystem, expanding middle class, and rising preference for sustainable lifestyle products. Domestic brands are capitalizing on the growing appetite for decorative and functional glassware for both personal use and gifting. The surge in domestic tourism and hospitality development is also generating strong demand for commercial-grade glassware across hotels, restaurants, and cafes.
Glassware Market Share
The Glassware industry is primarily led by well-established companies, including:
- Corning Incorporated (U.S.)
- O-I Glass (U.S.)
- Ardagh Group S.A. (Luxembourg)
- Vidrala (Spain)
- Verallia (France)
- Nihon Yamamura Glass Co., Ltd. (Japan)
- AGC Inc. (Japan)
- Gerresheimer AG (Germany)
- Vetropack Holding Ltd (Switzerland)
- Stoelzle Glass Group (Austria)
- KOA GLASS CO., LTD. (South Korea)
- Hindusthan National Glass & Industries Limited (India)
- Nippon Sheet Glass Co., Ltd. (U.K.)
- Schott AG (Germany)
- PGP Glass (India)
- Saint-Gobain (France)
- Bormioli Luigi S.p.A. (Italy)
- Hindusthan National Glass & Industries Ltd. (India)
- Vitro (Mexico)
- Gerresheimer AG (Germany)
Latest Developments in Global Glassware Market
- In April 2022, Chiefway announced the establishment of Malaysia’s first smart glass manufacturing facility, marking a strategic development aimed at addressing the rising demand for sustainable and intelligent home solutions. The new plant is expected to boost the local supply of eco-friendly glass products, reduce reliance on imports, and support the growth of the regional smart home market. This development enhances Malaysia's position in the smart materials sector while aligning with global sustainability trends
- In June 2022, Saverglass unveiled its plans to expand its glass bottle production capacity by 2023 to meet the increasing demand from the American continent. This development is set to improve supply chain efficiency, reduce lead times for North and Latin American clients, and reinforce the company’s position as a key player in the premium glass packaging market. The expansion is expected to significantly support the growing beverage and luxury goods industries in the region
SKU-

- Interactive Data Analysis Dashboard
- Company Analysis Dashboard for high growth potential opportunities
- Research Analyst Access for customization & queries
- Competitor Analysis with Interactive dashboard
- Latest News, Updates & Trend analysis
- Harness the Power of Benchmark Analysis for Comprehensive Competitor Tracking
Table of Content
- introduction
- OBJECTIVES OF THE STUDY
- MARKET DEFINITION
- OVERVIEW of GLOBAL GLASSWARE MARKET
- LIMITATIONS
- MARKETS COVERED
- MARKET SEGMENTATION
- MARKETS COVERED
- geographicAL scope
- years considered for the study
- currency and pricing
- DBMR TRIPOD DATA VALIDATION MODEL
- product LIFE LINE CURVE
- MULTIVARIATE MODELING
- primary interviews with key opinion leaders
- DBMR MARKET POSITION GRID
- MARKET application COVERAGE GRID
- DBMR MARKET CHALLENGE MATRIX
- vendor share analysis
- IMPORT-EXPORT DATA
- secondary sourcEs
- assumptions
- EXECUTIVE SUMMARY
- premium insights
- global
- asia-pacific
- middle east and africa
- North America
- South America
- Europe
- market overview
- drivers
- Growing levels of investment in the hotel and catering industry
- Changes in lifestyle of the consumers
- Rising popularity of fine dining across the globe
- Increasing demand for premium decorative glassware products
- restraints
- Availability of cheap quality products
- Rising demand for steel and paper base drinkware
- Difficulty in maintaining the glassware products
- opportunities
- Advancements in glassware production technologies
- Rising demand for glassware products for clinical use in hospitals and forensic laboratories
- challenges
- Complexity in manufacturing glassware products
- Rising difficulty in recycling glassware products
- IMPACT OF COVID-19 on the Global GLASSWARE MARKET
- ANALYSIS on IMPACT OF COVID-19 ON THE GLOBAL GLASSWARE MARKET
- AFTERMATH OF COVID-19 AND GOVERNMENT INITIATIVE TO BOOST THE GLOBAL GLASSWARE MARKET
- STRATEGIC DECISIONS FOR MANUFACTURERS AFTER COVID-19 TO GAIN COMPETITIVE MARKET SHARE
- IMPACT ON PRICE
- IMPACT ON DEMAND
- IMPACT ON SUPPLY CHAIN
- CONCLUSION
- Global GLASSWARE market, BY Material
- overview
- Soda Lime Glass
- Lead Glass
- Heat Resistant
- OTHERS
- Global GLASSWARE market, BY style
- OVERVIEW
- Stemware
- Red wine glass
- BORDEAUX
- CABERNET
- ZINFANDEL
- BURGUNDY
- PINOT NOIR
- ROSE
- white wine glass
- SPARKLING
- CHARDONNAY
- VIOGNIER
- SWEET WINE
- VINTAGE
- STEMLESS GLASS
- Liquor Glass
- Beer Glass
- Everyday Usage
- Others
- Global GLASSWARE market, BY Distribution channel
- OVERVIEW
- B2B
- Specialized Stores
- Supermarkets/Hypermarkets
- E Commerce
- Others
- Global GLASSWARE market, BY price range
- OVERVIEW
- Medium
- Premium
- Economy
- Global GLASSWARE market, BY End-use
- OVERVIEW
- Hotels & Restaurants
- Bars & Cafe
- HOUSEHOLD
- Corporate Canteens
- others
- GLOBAL Glassware market, BY GEOGRAPHY
- overview
- Asia-PACIFIC
- China
- India
- Japan
- South Korea
- Singapore
- Malaysia
- Thailand
- Australia and New Zealand
- Indonesia
- Philippines
- Hong Kong
- Taiwan
- Rest of Asia-Pacific
- Europe
- Germany
- France
- italy
- u.k.
- turkey
- switzerland
- Spain
- russia
- netherlands
- belgium
- rest of europe
- North America
- U.S.
- CANADA
- Mexico
- South america
- brazil
- argentina
- rest of south america
- Middle East and Africa
- U.a.e
- Saudi Arabia
- South africa
- Egypt
- israel
- rest of middle east and africa
- GLOBAL GLASSWARE MARKET, COMPANY landscape
- company share analysis: GLOBAL
- company share analysis: north america
- company share analysis: EUROPE
- company share analysis: Asia-pacific
- Merger & Acquisition
- new product developments
- Awards
- Partnerships
- swot analysis
- company profiles
- Libbey inc
- COMPANY SNAPSHOT
- revenue analysis
- company share analysis
- Product Portfolio
- RECENT UPDATE
- Lifetime brands, inc.
- COMPANY SNAPSHOT
- revenue analysis
- company share analysis
- Product Portfolio
- RECENT UPDATE
- villeroy & Boch
- COMPANY SNAPSHOT
- revenue analysis
- company share analysis
- Product Portfolio
- RECENT UPDATEs
- WMF GmbH
- COMPANY SNAPSHOT
- revenue analysis
- company share analysis
- Product Portfolio
- RECENT UPDATE
- Fiskars Australia Pty Ltd.
- COMPANY SNAPSHOT
- revenue analysis
- company share analysis
- Product Portfolio
- RECENT UPDATE
- Bormioli Rocco S.p.A.
- COMPANY SNAPSHOT
- Product Portfolio
- RECENT UPDATE
- Cumbria Crystal
- COMPANY SNAPSHOT
- Product Portfolio
- RECENT UPDATE
- degrenne
- COMPANY SNAPSHOT
- Product Portfolio
- RECENT update
- Hrastnik1860
- COMPANY SNAPSHOT
- Product Portfolio
- RECENT UPDATEs
- lenox corporation
- COMPANY SNAPSHOT
- Product Portfolio
- RECENT UPDATE
- noritakechina
- COMPANY SNAPSHOT
- revenue analysis
- Product Portfolio
- RECENT UPDATE
- Stölzle Lausitz GmbH
- COMPANY SNAPSHOT
- Product Portfolio
- RECENT UPDATEs
- The Oneida Group Inc.
- COMPANY SNAPSHOT
- Product Portfolio
- RECENT UPDATE
- The Zrike Company, inc.
- COMPANY SNAPSHot
- Product Portfolio
- RECENT UPDATE
- QUESTIONNAIRE
- related reports
List of Table
TABLE 1 IMPORT DATA of Drinking glasses (excluding glasses of glass ceramics or of lead crystal and stemware) HS Code - 701337 (USD Thousand)
TABLE 2 EXPORT DATA OF DRINKING GLASSES (EXCLUDING GLASSES OF GLASS CERAMICS OR OF LEAD CRYSTAL AND STEMWARE) HS CODE - 701337 (USD THOUSAND)
TABLE 3 Type of reusable cups consumers would prefer for drinkware in U.S, 2015
TABLE 4 Global Glassware Market, By material, 2019-2028 (usd thousand)
TABLE 5 Global Glassware Market, By material, 2019-2028 (Thousand Units)
TABLE 6 Global Soda lime glass in GLASSWARE market, BY region, 2019-2028 (USD thousand)
TABLE 7 Global SODA LIME GLASS in GLASSWARE market, BY region, 2019-2028 (Thousand UNITS)
TABLE 8 Global Lead Glass in GLASSWARE market, BY region, 2019-2028 (USD thousand)
TABLE 9 Global Lead Glass in GLASSWARE market, BY region, 2019-2028 (Thousand Units)
TABLE 10 Global Heat resistant in GLASSWARE market, BY region, 2019-2028 (USD thousand)
TABLE 11 Global Heat resistant in GLASSWARE market, BY region, 2019-2028 (Thousand Units)
TABLE 12 Global others in GLASSWARE market, BY region, 2019-2028 (USD thousand)
TABLE 13 Global others in GLASSWARE market, BY region, 2019-2028 (Thousand Units)
TABLE 14 Global GLASSWARE market, BY style, 2019-2028 (USD Thousand)
TABLE 15 Global Stemware IN GLASSWARE market, BY region, 2019-2028 (USD thousand)
TABLE 16 Global Stemware IN GLASSWARE market, BY type, 2019-2028 (USD thousand)
TABLE 17 Global red wine glass IN GLASSWARE market, BY type, 2019-2028 (USD thousand)
TABLE 18 Global white wine glass IN GLASSWARE market, BY type, 2019-2028 (USD thousand)
TABLE 19 Global stemless glass IN GLASSWARE market, BY region, 2019-2028 (USD thousand)
TABLE 20 Global Stemless Glass IN GLASSWARE market, BY type, 2019-2028 (USD thousand)
TABLE 21 Global Everyday usage IN GLASSWARE market, BY region, 2019-2028 (USD thousand)
TABLE 22 Global Others IN GLASSWARE market, BY region, 2019-2028 (USD thousand)
TABLE 23 Global GLASSWARE market, BY distribution channel, 2019-2028 (USD Thousand)
TABLE 24 Global B2b in GLASSWARE market, BY region, 2019-2028 (USD thousand)
TABLE 25 Global specialized stores in GLASSWARE market, BY region, 2019-2028 (USD thousand)
TABLE 26 Global supermarkets/hypermarkets in GLASSWARE market, BY region, 2019-2028 (USD thousand)
TABLE 27 Global e-commerce in GLASSWARE market, BY region, 2019-2028 (USD thousand)
TABLE 28 Global others in GLASSWARE market, BY region, 2019-2028 (USD thousand)
TABLE 29 Global GLASSWARE market, BY price range, 2019-2028 (USD Thousand)
TABLE 30 Global medium in GLASSWARE market, BY region, 2019-2028 (USD thousand)
TABLE 31 Global Premium in GLASSWARE market, BY region, 2019-2028 (USD thousand)
TABLE 32 Global Economy in GLASSWARE market, BY region, 2019-2028 (USD thousand)
TABLE 33 Global GLASSWARE market, BY end-use, 2019-2028 (USD Thousand)
TABLE 34 Global Hotels & Restaurants IN GLASSWARE market, BY region, 2019-2028 (USD thousand)
TABLE 35 Global Bars & café IN GLASSWARE market, BY region, 2019-2028 (USD thousand)
TABLE 36 Global Household IN GLASSWARE market, BY region, 2019-2028 (USD thousand)
TABLE 37 Global Corporate Canteens IN GLASSWARE market, BY region, 2019-2028 (USD thousand)
TABLE 38 Global others IN GLASSWARE market, BY region, 2019-2028 (USD thousand)
TABLE 39 GLOBAL glassware market, By region, 2019-2028 (USD thousand)
TABLE 40 GLOBAL glassware market, By region, 2019-2028 (thousand Units)
TABLE 41 Asia-Pacific glassware Market, BY COUNtry, 2019-2028 (USD Thousand)
TABLE 42 Asia-Pacific glassware Market, BY COUNtry, 2019-2028 (Thousand Units)
TABLE 43 Asia-Pacific Glassware Market, By Material, 2019-2028 (USD Thousand)
TABLE 44 Asia-Pacific Glassware Market, By Material, 2019-2028 (Thousand Units)
TABLE 45 Asia-Pacific Glassware Market, By Style, 2019-2028 (USD Thousand)
TABLE 46 Asia-Pacific Stemware in Glassware Market, By Type, 2019-2028 (USD Thousand)
TABLE 47 Asia-Pacific Red Wine Glass in Glassware Market, By Type, 2019-2028 (USD Thousand)
TABLE 48 Asia-Pacific White Wine Glass in Glassware Market, By Type, 2019-2028 (USD Thousand)
TABLE 49 Asia-Pacific Stemless Glass in Glassware Market, By Type, 2019-2028 (USD Thousand)
TABLE 50 Asia-Pacific Glassware Market, By Distribution Channel, 2019-2028 (USD Thousand)
TABLE 51 Asia-Pacific Glassware Market, By Price Range, 2019-2028 (USD Thousand)
TABLE 52 Asia-Pacific Glassware Market, By End-Use, 2019-2028 (USD Thousand)
TABLE 53 CHINA Glassware Market, By Material, 2019-2028 (USD Thousand)
TABLE 54 CHINA Glassware Market, By Material, 2019-2028 (Thousand Units)
TABLE 55 CHINA Glassware Market, By Style, 2019-2028 (USD Thousand)
TABLE 56 CHINA Stemware in Glassware Market, By Type, 2019-2028 (USD Thousand)
TABLE 57 CHINA Red Wine Glass in Glassware Market, By Type, 2019-2028 (USD Thousand)
TABLE 58 CHINA White Wine Glass in Glassware Market, By Type, 2019-2028 (USD Thousand)
TABLE 59 CHINA Stemless Glass in Glassware Market, By Type, 2019-2028 (USD Thousand)
TABLE 60 CHINA Glassware Market, By Distribution Channel, 2019-2028 (USD Thousand)
TABLE 61 CHINA Glassware Market, By Price Range, 2019-2028 (USD Thousand)
TABLE 62 CHINA Glassware Market, By End-Use, 2019-2028 (USD Thousand)
TABLE 63 INDIA Glassware Market, By Material, 2019-2028 (USD Thousand)
TABLE 64 INDIA Glassware Market, By Material, 2019-2028 (Thousand Units)
TABLE 65 INDIA Glassware Market, By Style, 2019-2028 (USD Thousand)
TABLE 66 INDIA Stemware in Glassware Market, By Type, 2019-2028 (USD Thousand)
TABLE 67 INDIA Red Wine Glass in Glassware Market, By Type, 2019-2028 (USD Thousand)
TABLE 68 INDIA White Wine Glass in Glassware Market, By Type, 2019-2028 (USD Thousand)
TABLE 69 INDIA Stemless Glass in Glassware Market, By Type, 2019-2028 (USD Thousand)
TABLE 70 INDIA Glassware Market, By Distribution Channel, 2019-2028 (USD Thousand)
TABLE 71 INDIA Glassware Market, By Price Range, 2019-2028 (USD Thousand)
TABLE 72 INDIA Glassware Market, By End-Use, 2019-2028 (USD Thousand)
TABLE 73 JAPAN Glassware Market, By Material, 2019-2028 (USD Thousand)
TABLE 74 JAPAN Glassware Market, By Material, 2019-2028 (Thousand Units)
TABLE 75 JAPAN Glassware Market, By Style, 2019-2028 (USD Thousand)
TABLE 76 JAPAN Stemware in Glassware Market, By Type, 2019-2028 (USD Thousand)
TABLE 77 JAPAN Red Wine Glass in Glassware Market, By Type, 2019-2028 (USD Thousand)
TABLE 78 JAPAN White Wine Glass in Glassware Market, By Type, 2019-2028 (USD Thousand)
TABLE 79 JAPAN Stemless Glass in Glassware Market, By Type, 2019-2028 (USD Thousand)
TABLE 80 JAPAN Glassware Market, By Distribution Channel, 2019-2028 (USD Thousand)
TABLE 81 JAPAN Glassware Market, By Price Range, 2019-2028 (USD Thousand)
TABLE 82 JAPAN Glassware Market, By End-Use, 2019-2028 (USD Thousand)
TABLE 83 SOUTH KOREA Glassware Market, By Material, 2019-2028 (USD Thousand)
TABLE 84 SOUTH KOREA Glassware Market, By Material, 2019-2028 (Thousand Units)
TABLE 85 SOUTH KOREA Glassware Market, By Style, 2019-2028 (USD Thousand)
TABLE 86 SOUTH KOREA Stemware in Glassware Market, By Type, 2019-2028 (USD Thousand)
TABLE 87 SOUTH KOREA Red Wine Glass in Glassware Market, By Type, 2019-2028 (USD Thousand)
TABLE 88 SOUTH KOREA White Wine Glass in Glassware Market, By Type, 2019-2028 (USD Thousand)
TABLE 89 SOUTH KOREA Stemless Glass in Glassware Market, By Type, 2019-2028 (USD Thousand)
TABLE 90 SOUTH KOREA Glassware Market, By Distribution Channel, 2019-2028 (USD Thousand)
TABLE 91 SOUTH KOREA Glassware Market, By Price Range, 2019-2028 (USD Thousand)
TABLE 92 SOUTH KOREA Glassware Market, By End-Use, 2019-2028 (USD Thousand)
TABLE 93 SINGAPORE Glassware Market, By Material, 2019-2028 (USD Thousand)
TABLE 94 SINGAPORE Glassware Market, By Material, 2019-2028 (Thousand Units)
TABLE 95 SINGAPORE Glassware Market, By Style, 2019-2028 (USD Thousand)
TABLE 96 SINGAPORE Stemware in Glassware Market, By Type, 2019-2028 (USD Thousand)
TABLE 97 SINGAPORE Red Wine Glass in Glassware Market, By Type, 2019-2028 (USD Thousand)
TABLE 98 SINGAPORE White Wine Glass in Glassware Market, By Type, 2019-2028 (USD Thousand)
TABLE 99 SINGAPORE Stemless Glass in Glassware Market, By Type, 2019-2028 (USD Thousand)
TABLE 100 SINGAPORE Glassware Market, By Distribution Channel, 2019-2028 (USD Thousand)
TABLE 101 SINGAPORE Glassware Market, By Price Range, 2019-2028 (USD Thousand)
TABLE 102 SINGAPORE Glassware Market, By End-Use, 2019-2028 (USD Thousand)
TABLE 103 MALAYSIA Glassware Market, By Material, 2019-2028 (USD Thousand)
TABLE 104 MALAYSIA Glassware Market, By Material, 2019-2028 (Thousand Units)
TABLE 105 MALAYSIA Glassware Market, By Style, 2019-2028 (USD Thousand)
TABLE 106 MALAYSIA Stemware in Glassware Market, By Type, 2019-2028 (USD Thousand)
TABLE 107 MALAYSIA Red Wine Glass in Glassware Market, By Type, 2019-2028 (USD Thousand)
TABLE 108 MALAYSIA White Wine Glass in Glassware Market, By Type, 2019-2028 (USD Thousand)
TABLE 109 MALAYSIA Stemless Glass in Glassware Market, By Type, 2019-2028 (USD Thousand)
TABLE 110 MALAYSIA Glassware Market, By Distribution Channel, 2019-2028 (USD Thousand)
TABLE 111 MALAYSIA Glassware Market, By Price Range, 2019-2028 (USD Thousand)
TABLE 112 MALAYSIA Glassware Market, By End-Use, 2019-2028 (USD Thousand)
TABLE 113 THAILAND Glassware Market, By Material, 2019-2028 (USD Thousand)
TABLE 114 THAILAND Glassware Market, By Material, 2019-2028 (Thousand Units)
TABLE 115 THAILAND Glassware Market, By Style, 2019-2028 (USD Thousand)
TABLE 116 THAILAND Stemware in Glassware Market, By Type, 2019-2028 (USD Thousand)
TABLE 117 THAILAND Red Wine Glass in Glassware Market, By Type, 2019-2028 (USD Thousand)
TABLE 118 THAILAND White Wine Glass in Glassware Market, By Type, 2019-2028 (USD Thousand)
TABLE 119 THAILAND Stemless Glass in Glassware Market, By Type, 2019-2028 (USD Thousand)
TABLE 120 THAILAND Glassware Market, By Distribution Channel, 2019-2028 (USD Thousand)
TABLE 121 THAILAND Glassware Market, By Price Range, 2019-2028 (USD Thousand)
TABLE 122 THAILAND Glassware Market, By End-Use, 2019-2028 (USD Thousand)
TABLE 123 AUSTRALIA AND NEW ZEALAND Glassware Market, By Material, 2019-2028 (USD Thousand)
TABLE 124 AUSTRALIA AND NEW ZEALAND Glassware Market, By Material, 2019-2028 (Thousand Units)
TABLE 125 AUSTRALIA AND NEW ZEALAND Glassware Market, By Style, 2019-2028 (USD Thousand)
TABLE 126 AUSTRALIA AND NEW ZEALAND Stemware in Glassware Market, By Type, 2019-2028 (USD Thousand)
TABLE 127 AUSTRALIA AND NEW ZEALAND Red Wine Glass in Glassware Market, By Type, 2019-2028 (USD Thousand)
TABLE 128 AUSTRALIA AND NEW ZEALAND White Wine Glass in Glassware Market, By Type, 2019-2028 (USD Thousand)
TABLE 129 AUSTRALIA AND NEW ZEALAND Stemless Glass in Glassware Market, By Type, 2019-2028 (USD Thousand)
TABLE 130 AUSTRALIA AND NEW ZEALAND Glassware Market, By Distribution Channel, 2019-2028 (USD Thousand)
TABLE 131 AUSTRALIA AND NEW ZEALAND Glassware Market, By Price Range, 2019-2028 (USD Thousand)
TABLE 132 AUSTRALIA AND NEW ZEALAND Glassware Market, By End-Use, 2019-2028 (USD Thousand)
TABLE 133 INDONESIA Glassware Market, By Material, 2019-2028 (USD Thousand)
TABLE 134 INDONESIA Glassware Market, By Material, 2019-2028 (Thousand Units)
TABLE 135 INDONESIA Glassware Market, By Style, 2019-2028 (USD Thousand)
TABLE 136 INDONESIA Stemware in Glassware Market, By Type, 2019-2028 (USD Thousand)
TABLE 137 INDONESIA Red Wine Glass in Glassware Market, By Type, 2019-2028 (USD Thousand)
TABLE 138 INDONESIA White Wine Glass in Glassware Market, By Type, 2019-2028 (USD Thousand)
TABLE 139 INDONESIA Stemless Glass in Glassware Market, By Type, 2019-2028 (USD Thousand)
TABLE 140 INDONESIA Glassware Market, By Distribution Channel, 2019-2028 (USD Thousand)
TABLE 141 INDONESIA Glassware Market, By Price Range, 2019-2028 (USD Thousand)
TABLE 142 INDONESIA Glassware Market, By End-Use, 2019-2028 (USD Thousand)
TABLE 143 PHILIPPINES Glassware Market, By Material, 2019-2028 (USD Thousand)
TABLE 144 PHILIPPINES Glassware Market, By Material, 2019-2028 (Thousand Units)
TABLE 145 PHILIPPINES Glassware Market, By Style, 2019-2028 (USD Thousand)
TABLE 146 PHILIPPINES Stemware in Glassware Market, By Type, 2019-2028 (USD Thousand)
TABLE 147 PHILIPPINES Red Wine Glass in Glassware Market, By Type, 2019-2028 (USD Thousand)
TABLE 148 PHILIPPINES White Wine Glass in Glassware Market, By Type, 2019-2028 (USD Thousand)
TABLE 149 PHILIPPINES Stemless Glass in Glassware Market, By Type, 2019-2028 (USD Thousand)
TABLE 150 PHILIPPINES Glassware Market, By Distribution Channel, 2019-2028 (USD Thousand)
TABLE 151 PHILIPPINES Glassware Market, By Price Range, 2019-2028 (USD Thousand)
TABLE 152 PHILIPPINES Glassware Market, By End-Use, 2019-2028 (USD Thousand)
TABLE 153 HONG KONG Glassware Market, By Material, 2019-2028 (USD Thousand)
TABLE 154 HONG KONG Glassware Market, By Material, 2019-2028 (Thousand Units)
TABLE 155 HONG KONG Glassware Market, By Style, 2019-2028 (USD Thousand)
TABLE 156 HONG KONG Stemware in Glassware Market, By Type, 2019-2028 (USD Thousand)
TABLE 157 HONG KONG Red Wine Glass in Glassware Market, By Type, 2019-2028 (USD Thousand)
TABLE 158 HONG KONG White Wine Glass in Glassware Market, By Type 2019-2028 (USD Thousand)
TABLE 159 HONG KONG Stemless Glass in Glassware Market, By Type, 2019-2028 (USD Thousand)
TABLE 160 HONG KONG Glassware Market, By Distribution Channel, 2019-2028 (USD Thousand)
TABLE 161 HONG KONG Glassware Market, By Price Range, 2019-2028 (USD Thousand)
TABLE 162 HONG KONG Glassware Market, By End-Use, 2019-2028 (USD Thousand)
TABLE 163 TAIWAN Glassware Market, By Material, 2019-2028 (USD Thousand)
TABLE 164 TAIWAN Glassware Market, By Material, 2019-2028 (Thousand Units)
TABLE 165 TAIWAN Glassware Market, By Style, 2019-2028 (USD Thousand)
TABLE 166 TAIWAN Stemware in Glassware Market, By Type, 2019-2028 (USD Thousand)
TABLE 167 TAIWAN Red Wine Glass in Glassware Market, By Type, 2019-2028 (USD Thousand)
TABLE 168 TAIWAN White Wine Glass in Glassware Market, By Type 2019-2028 (USD Thousand)
TABLE 169 TAIWAN Stemless Glass in Glassware Market, By Type, 2019-2028 (USD Thousand)
TABLE 170 TAIWAN Glassware Market, By Distribution Channel, 2019-2028 (USD Thousand)
TABLE 171 TAIWAN Glassware Market, By Price Range, 2019-2028 (USD Thousand)
TABLE 172 TAIWAN Glassware Market, By End-Use, 2019-2028 (USD Thousand)
TABLE 173 REST OF ASIA-PACIFIC Glassware Market, By Material, 2019-2028 (USD Thousand)
TABLE 174 REST OF ASIA-PACIFIC Glassware Market, By Material, 2019-2028 (Thousand Units)
TABLE 175 Europe glassware Market, BY COUNtry, 2019-2028 (USD Thousand)
TABLE 176 Europe glassware Market, BY COUNtry, 2019-2028 (Thousand Units)
TABLE 177 Europe Glassware Market, By Material, 2019-2028 (USD Thousand)
TABLE 178 Europe Glassware Market, By Material, 2019-2028 (Thousand Units)
TABLE 179 Europe Glassware Market, By Style, 2019-2028 (USD Thousand)
TABLE 180 Europe Stemware in Glassware Market, By Type, 2019-2028 (USD Thousand)
TABLE 181 Europe Red Wine Glass in Glassware Market, By Type, 2019-2028 (USD Thousand)
TABLE 182 Europe White Wine Glass in Glassware Market, By Type, 2019-2028 (USD Thousand)
TABLE 183 Europe Stemless Glass in Glassware Market, By Type, 2019-2028 (USD Thousand)
TABLE 184 Europe Glassware Market, By Distribution Channel, 2019-2028 (USD Thousand)
TABLE 185 Europe Glassware Market, By Price Range, 2019-2028 (USD Thousand)
TABLE 186 Europe Glassware Market, By End-Use, 2019-2028 (USD Thousand)
TABLE 187 Germany Glassware Market, By Material, 2019-2028 (USD Thousand)
TABLE 188 Germany Glassware Market, By Material, 2019-2028 (Thousand Units)
TABLE 189 Germany Glassware Market, By Style, 2019-2028 (USD Thousand)
TABLE 190 Germany Stemware in Glassware Market, By Type, 2019-2028 (USD Thousand)
TABLE 191 Germany Red Wine Glass in Glassware Market, By Type, 2019-2028 (USD Thousand)
TABLE 192 Germany White Wine Glass in Glassware Market, By Type, 2019-2028 (USD Thousand)
TABLE 193 Germany Stemless Glass in Glassware Market, By Type, 2019-2028 (USD Thousand)
TABLE 194 Germany Glassware Market, By Distribution Channel, 2019-2028 (USD Thousand)
TABLE 195 Germany Glassware Market, By Price Range, 2019-2028 (USD Thousand)
TABLE 196 Germany Glassware Market, By End-Use, 2019-2028 (USD Thousand)
TABLE 197 France Glassware Market, By Material, 2019-2028 (USD Thousand)
TABLE 198 France Glassware Market, By Material, 2019-2028 (Thousand Units)
TABLE 199 France Glassware Market, By Style, 2019-2028 (USD Thousand)
TABLE 200 France Stemware in Glassware Market, By Type, 2019-2028 (USD Thousand)
TABLE 201 France Red Wine Glass in Glassware Market, By Type, 2019-2028 (USD Thousand)
TABLE 202 France White Wine Glass in Glassware Market, By Type, 2019-2028 (USD Thousand)
TABLE 203 France Stemless Glass in Glassware Market, By Type, 2019-2028 (USD Thousand)
TABLE 204 France Glassware Market, By Distribution Channel, 2019-2028 (USD Thousand)
TABLE 205 France Glassware Market, By Price Range, 2019-2028 (USD Thousand)
TABLE 206 France Glassware Market, By End-Use, 2019-2028 (USD Thousand)
TABLE 207 Italy Glassware Market, By Material, 2019-2028 (USD Thousand)
TABLE 208 Italy Glassware Market, By Material, 2019-2028 (Thousand Units)
TABLE 209 Italy Glassware Market, By Style, 2019-2028 (USD Thousand)
TABLE 210 Italy Stemware in Glassware Market, By Type, 2019-2028 (USD Thousand)
TABLE 211 Italy Red Wine Glass in Glassware Market, By Type, 2019-2028 (USD Thousand)
TABLE 212 Italy White Wine Glass in Glassware Market, By Type, 2019-2028 (USD Thousand)
TABLE 213 Italy Stemless Glass in Glassware Market, By Type, 2019-2028 (USD Thousand)
TABLE 214 Italy Glassware Market, By Distribution Channel, 2019-2028 (USD Thousand)
TABLE 215 Italy Glassware Market, By Price Range, 2019-2028 (USD Thousand)
TABLE 216 Italy Glassware Market, By End-Use, 2019-2028 (USD Thousand)
TABLE 217 U.K. Glassware Market, By Material, 2019-2028 (USD Thousand)
TABLE 218 U.K. Glassware Market, By Material, 2019-2028 (Thousand Units)
TABLE 219 U.K. Glassware Market, By Style, 2019-2028 (USD Thousand)
TABLE 220 U.K. Stemware in Glassware Market, By Type, 2019-2028 (USD Thousand)
TABLE 221 U.K. Red Wine Glass in Glassware Market, By Type, 2019-2028 (USD Thousand)
TABLE 222 U.K. White Wine Glass in Glassware Market, By Type, 2019-2028 (USD Thousand)
TABLE 223 U.K. Stemless Glass in Glassware Market, By Type, 2019-2028 (USD Thousand)
TABLE 224 U.K. Glassware Market, By Distribution Channel, 2019-2028 (USD Thousand)
TABLE 225 U.K. Glassware Market, By Price Range, 2019-2028 (USD Thousand)
TABLE 226 U.K. Glassware Market, By End-Use, 2019-2028 (USD Thousand)
TABLE 227 Turkey Glassware Market, By Material, 2019-2028 (USD Thousand)
TABLE 228 Turkey Glassware Market, By Material, 2019-2028 (Thousand Units)
TABLE 229 Turkey Glassware Market, By Style, 2019-2028 (USD Thousand)
TABLE 230 Turkey Stemware in Glassware Market, By Type, 2019-2028 (USD Thousand)
TABLE 231 Turkey Red Wine Glass in Glassware Market, By Type, 2019-2028 (USD Thousand)
TABLE 232 Turkey White Wine Glass in Glassware Market, By Type, 2019-2028 (USD Thousand)
TABLE 233 Turkey Stemless Glass in Glassware Market, By Type, 2019-2028 (USD Thousand)
TABLE 234 Turkey Glassware Market, By Distribution Channel, 2019-2028 (USD Thousand)
TABLE 235 Turkey Glassware Market, By Price Range, 2019-2028 (USD Thousand)
TABLE 236 Turkey Glassware Market, By End-Use, 2019-2028 (USD Thousand)
TABLE 237 Switzerland Glassware Market, By Material, 2019-2028 (USD Thousand)
TABLE 238 Switzerland Glassware Market, By Material, 2019-2028 (Thousand Units)
TABLE 239 Switzerland Glassware Market, By Style, 2019-2028 (USD Thousand)
TABLE 240 Switzerland Stemware in Glassware Market, By Type, 2019-2028 (USD Thousand)
TABLE 241 Switzerland Red Wine Glass in Glassware Market, By Type, 2019-2028 (USD Thousand)
TABLE 242 Switzerland White Wine Glass in Glassware Market, By Type, 2019-2028 (USD Thousand)
TABLE 243 Switzerland Stemless Glass in Glassware Market, By Type, 2019-2028 (USD Thousand)
TABLE 244 Switzerland Glassware Market, By Distribution Channel, 2019-2028 (USD Thousand)
TABLE 245 Switzerland Glassware Market, By Price Range, 2019-2028 (USD Thousand)
TABLE 246 Switzerland Glassware Market, By End-Use, 2019-2028 (USD Thousand)
TABLE 247 Spain Glassware Market, By Material, 2019-2028 (USD Thousand)
TABLE 248 Spain Glassware Market, By Material, 2019-2028 (Thousand Units)
TABLE 249 Spain Glassware Market, By Style, 2019-2028 (USD Thousand)
TABLE 250 Spain Stemware in Glassware Market, By Type, 2019-2028 (USD Thousand)
TABLE 251 Spain Red Wine Glass in Glassware Market, By Type, 2019-2028 (USD Thousand)
TABLE 252 Spain White Wine Glass in Glassware Market, By Type, 2019-2028 (USD Thousand)
TABLE 253 Spain Stemless Glass in Glassware Market, By Type, 2019-2028 (USD Thousand)
TABLE 254 Spain Glassware Market, By Distribution Channel, 2019-2028 (USD Thousand)
TABLE 255 Spain Glassware Market, By Price Range, 2019-2028 (USD Thousand)
TABLE 256 Spain Glassware Market, By End-Use, 2019-2028 (USD Thousand)
TABLE 257 Russia Glassware Market, By Material, 2019-2028 (USD Thousand)
TABLE 258 Russia Glassware Market, By Material, 2019-2028 (Thousand Units)
TABLE 259 Russia Glassware Market, By Style, 2019-2028 (USD Thousand)
TABLE 260 Russia Stemware in Glassware Market, By Type, 2019-2028 (USD Thousand)
TABLE 261 Russia Red Wine Glass in Glassware Market, By Type, 2019-2028 (USD Thousand)
TABLE 262 Russia White Wine Glass in Glassware Market, By Type, 2019-2028 (USD Thousand)
TABLE 263 Russia Stemless Glass in Glassware Market, By Type, 2019-2028 (USD Thousand)
TABLE 264 Russia Glassware Market, By Distribution Channel, 2019-2028 (USD Thousand)
TABLE 265 Russia Glassware Market, By Price Range, 2019-2028 (USD Thousand)
TABLE 266 Russia Glassware Market, By End-Use, 2019-2028 (USD Thousand)
TABLE 267 Netherlands Glassware Market, By Material, 2019-2028 (USD Thousand)
TABLE 268 Netherlands Glassware Market, By Material, 2019-2028 (Thousand Units)
TABLE 269 Netherlands Glassware Market, By Style, 2019-2028 (USD Thousand)
TABLE 270 Netherlands Stemware in Glassware Market, By Type, 2019-2028 (USD Thousand)
TABLE 271 Netherlands Red Wine Glass in Glassware Market, By Type, 2019-2028 (USD Thousand)
TABLE 272 Netherlands White Wine Glass in Glassware Market, By Type, 2019-2028 (USD Thousand)
TABLE 273 Netherlands Stemless Glass in Glassware Market, By Type, 2019-2028 (USD Thousand)
TABLE 274 Netherlands Glassware Market, By Distribution Channel, 2019-2028 (USD Thousand)
TABLE 275 Netherlands Glassware Market, By Price Range, 2019-2028 (USD Thousand)
TABLE 276 Netherlands Glassware Market, By End-Use, 2019-2028 (USD Thousand)
TABLE 277 Belgium Glassware Market, By Material, 2019-2028 (USD Thousand)
TABLE 278 Belgium Glassware Market, By Material, 2019-2028 (Thousand Units)
TABLE 279 Belgium Glassware Market, By Style, 2019-2028 (USD Thousand)
TABLE 280 Belgium Stemware in Glassware Market, By Type, 2019-2028 (USD Thousand)
TABLE 281 Belgium Red Wine Glass in Glassware Market, By Type, 2019-2028 (USD Thousand)
TABLE 282 Belgium White Wine Glass in Glassware Market, By Type, 2019-2028 (USD Thousand)
TABLE 283 Belgium Stemless Glass in Glassware Market, By Type, 2019-2028 (USD Thousand)
TABLE 284 Belgium Glassware Market, By Distribution Channel, 2019-2028 (USD Thousand)
TABLE 285 Belgium Glassware Market, By Price Range, 2019-2028 (USD Thousand)
TABLE 286 Belgium Glassware Market, By End-Use, 2019-2028 (USD Thousand)
TABLE 287 rest of europe Glassware Market, By Material, 2019-2028 (USD Thousand)
TABLE 288 rest of europe Glassware Market, By Material, 2019-2028 (Thousand Units)
TABLE 289 North America Glassware Market, BY COUNTRY, 2019-2028 (USD Thousand)
TABLE 290 North America Glassware Market, BY COUNTRY,2019-2028 (Thousand units)
TABLE 291 North America Glassware Market, By Material, 2019-2028 (USD Thousand)
TABLE 292 North America Glassware Market, By Material, 2019-2028 (Thousand Units)
TABLE 293 North America Glassware Market, By Style, 2019-2028 (USD Thousand)
TABLE 294 North America Stemware in Glassware Market, By Type, 2019-2028 (USD Thousand)
TABLE 295 North America Red Wine Glass in Glassware Market, By Type, 2019-2028 (USD Thousand)
TABLE 296 North America White Wine Glass in Glassware Market, By Type, 2019-2028 (USD Thousand)
TABLE 297 North America Stemless Glass in Glassware Market, By Type, 2019-2028 (USD Thousand)
TABLE 298 North America Glassware Market, By Distribution Channel, 2019-2028 (USD Thousand)
TABLE 299 North America Glassware Market, By Price Range, 2019-2028 (USD Thousand)
TABLE 300 North America Glassware Market, By End-Use, 2019-2028 (USD Thousand)
TABLE 301 U.S. Glassware Market, By Material, 2019-2028 (USD Thousand)
TABLE 302 U.S. Glassware Market, By Material, 2019-2028 (Thousand Units)
TABLE 303 U.S. Glassware Market, By Style, 2019-2028 (USD Thousand)
TABLE 304 U.S. Stemware in Glassware Market, By Type, 2019-2028 (USD Thousand)
TABLE 305 U.S. Red Wine Glass in Glassware Market, By Type, 2019-2028 (USD Thousand)
TABLE 306 U.S. White Wine Glass in Glassware Market, By Type, 2019-2028 (USD Thousand)
TABLE 307 U.S. Stemless Glass in Glassware Market, By Type, 2019-2028 (USD Thousand)
TABLE 308 U.S. Glassware Market, By Distribution Channel, 2019-2028 (USD Thousand)
TABLE 309 U.S. Glassware Market, By Price Range, 2019-2028 (USD Thousand)
TABLE 310 U.S. Glassware Market, By End-Use, 2019-2028 (USD Thousand)
TABLE 311 CANADA Glassware Market, By Material, 2019-2028 (USD Thousand)
TABLE 312 CANADA Glassware Market, By Material, 2019-2028 (Thousand Units)
TABLE 313 CANADA Glassware Market, By Style, 2019-2028 (USD Thousand)
TABLE 314 CANADA Stemware in Glassware Market, By Type, 2019-2028 (USD Thousand)
TABLE 315 CANADA Red Wine Glass in Glassware Market, By Type, 2019-2028 (USD Thousand)
TABLE 316 CANADA White Wine Glass in Glassware Market, By Type, 2019-2028 (USD Thousand)
TABLE 317 CANADA Stemless Glass in Glassware Market, By Type, 2019-2028 (USD Thousand)
TABLE 318 CANADA Glassware Market, By Distribution Channel, 2019-2028 (USD Thousand)
TABLE 319 CANADA Glassware Market, By Price Range, 2019-2028 (USD Thousand)
TABLE 320 CANADA Glassware Market, By End-Use, 2019-2028 (USD Thousand)
TABLE 321 MEXICO Glassware Market, By Material, 2019-2028 (USD Thousand)
TABLE 322 MEXICO Glassware Market, By Material, 2019-2028 (Thousand Units)
TABLE 323 MEXICO Glassware Market, By Style, 2019-2028 (USD Thousand)
TABLE 324 MEXICO Stemware in Glassware Market, By Type, 2019-2028 (USD Thousand)
TABLE 325 MEXICO Red Wine Glass in Glassware Market, By Type, 2019-2028 (USD Thousand)
TABLE 326 MEXICO White Wine Glass in Glassware Market, By Type, 2019-2028 (USD Thousand)
TABLE 327 MEXICO Stemless Glass in Glassware Market, By Type, 2019-2028 (USD Thousand)
TABLE 328 MEXICO Glassware Market, By Distribution Channel, 2019-2028 (USD Thousand)
TABLE 329 MEXICO Glassware Market, By Price Range, 2019-2028 (USD Thousand)
TABLE 330 MEXICO Glassware Market, By End-Use, 2019-2028 (USD Thousand)
TABLE 331 South america glassware Market, BY COUNtry,2019-2028 (USD Thousand)
TABLE 332 South america glassware Market, BY COUNtry,2019-2028 (Thousand Units)
TABLE 333 South america Glassware Market, By Material, 2019-2028 (USD Thousand)
TABLE 334 South america Glassware Market, By Material, 2019-2028 (Thousand Units)
TABLE 335 South america Glassware Market, By Style, 2019-2028 (USD Thousand)
TABLE 336 South america Stemware in Glassware Market, By Type, 2019-2028 (USD Thousand)
TABLE 337 South america Red Wine Glass in Glassware Market, By Type, 2019-2028 (USD Thousand)
TABLE 338 South america White Wine Glass in Glassware Market, By Type, 2019-2028 (USD Thousand)
TABLE 339 South america Stemless Glass in Glassware Market, By Type, 2019-2028 (USD Thousand)
TABLE 340 South america Glassware Market, By Distribution Channel, 2019-2028 (USD Thousand)
TABLE 341 South america Glassware Market, By Price Range, 2019-2028 (USD Thousand)
TABLE 342 South america Glassware Market, By End-Use, 2019-2028 (USD Thousand)
TABLE 343 Brazil Glassware Market, By Material, 2019-2028 (USD Thousand)
TABLE 344 Brazil Glassware Market, By Material, 2019-2028 (Thousand Units)
TABLE 345 Brazil Glassware Market, By Style, 2019-2028 (USD Thousand)
TABLE 346 Brazil Stemware in Glassware Market, By Type, 2019-2028 (USD Thousand)
TABLE 347 Brazil Red Wine Glass in Glassware Market, By Type, 2019-2028 (USD Thousand)
TABLE 348 Brazil White Wine Glass in Glassware Market, By Type, 2019-2028 (USD Thousand)
TABLE 349 Brazil Stemless Glass in Glassware Market, By Type, 2019-2028 (USD Thousand)
TABLE 350 Brazil Glassware Market, By Distribution Channel, 2019-2028 (USD Thousand)
TABLE 351 Brazil Glassware Market, By Price Range, 2019-2028 (USD Thousand)
TABLE 352 Brazil Glassware Market, By End-Use, 2019-2028 (USD Thousand)
TABLE 353 Argentina Glassware Market, By Material, 2019-2028 (USD Thousand)
TABLE 354 Argentina Glassware Market, By Material, 2019-2028 (Thousand Units)
TABLE 355 Argentina Glassware Market, By Style, 2019-2028 (USD Thousand)
TABLE 356 Argentina Stemware in Glassware Market, By Type, 2019-2028 (USD Thousand)
TABLE 357 Argentina Red Wine Glass in Glassware Market, By Type, 2019-2028 (USD Thousand)
TABLE 358 Argentina White Wine Glass in Glassware Market, By Type, 2019-2028 (USD Thousand)
TABLE 359 Argentina Stemless Glass in Glassware Market, By Type, 2019-2028 (USD Thousand)
TABLE 360 Argentina Glassware Market, By Distribution Channel, 2019-2028 (USD Thousand)
TABLE 361 Argentina Glassware Market, By Price Range, 2019-2028 (USD Thousand)
TABLE 362 Argentina Glassware Market, By End-Use, 2019-2028 (USD Thousand)
TABLE 363 rest of south america Glassware Market, By Material, 2019-2028 (USD Thousand)
TABLE 364 rest of south america Glassware Market, By Material, 2019-2028 (Thousand Units)
TABLE 365 Middle East and Africa glassware Market, BY COUNtry,2019-2028 (USD Thousand)
TABLE 366 Middle East and Africa glassware Market, BY COUNtry, 2019-2028 (Thousand Units)
TABLE 367 Middle East and Africa Glassware Market, By Material, 2019-2028 (USD Thousand)
TABLE 368 Middle East and Africa Glassware Market, By Material, 2019-2028 (Thousand Units)
TABLE 369 Middle East and Africa Glassware Market, By Style, 2019-2028 (USD Thousand)
TABLE 370 Middle East and Africa Stemware in Glassware Market, By Type, 2019-2028 (USD Thousand)
TABLE 371 Middle East and Africa Red Wine Glass in Glassware Market, By Type, 2019-2028 (USD Thousand)
TABLE 372 Middle East and Africa White Wine Glass in Glassware Market, By Type, 2019-2028 (USD Thousand)
TABLE 373 Middle East and Africa Stemless Glass in Glassware Market, By Type, 2019-2028 (USD Thousand)
TABLE 374 Middle East and Africa Glassware Market, By Distribution Channel, 2019-2028 (USD Thousand)
TABLE 375 Middle East and Africa Glassware Market, By Price Range, 2019-2028 (USD Thousand)
TABLE 376 Middle East and Africa Glassware Market, By End-Use, 2019-2028 (USD Thousand)
TABLE 377 U.A.E Glassware Market, By Material, 2019-2028 (USD Thousand)
TABLE 378 U.A.E Glassware Market, By Material, 2019-2028 (Thousand Units)
TABLE 379 U.A.E Glassware Market, By Style, 2019-2028 (USD Thousand)
TABLE 380 U.A.E Stemware in Glassware Market, By Type, 2019-2028 (USD Thousand)
TABLE 381 U.A.E Red Wine Glass in Glassware Market, By Type, 2019-2028 (USD Thousand)
TABLE 382 U.A.E White Wine Glass in Glassware Market, By Type, 2019-2028 (USD Thousand)
TABLE 383 U.A.E Stemless Glass in Glassware Market, By Type, 2019-2028 (USD Thousand)
TABLE 384 U.A.E Glassware Market, By Distribution Channel, 2019-2028 (USD Thousand)
TABLE 385 U.A.E Glassware Market, By Price Range, 2019-2028 (USD Thousand)
TABLE 386 U.A.E Glassware Market, By End-Use, 2019-2028 (USD Thousand)
TABLE 387 Saudi Arabia Glassware Market, By Material, 2019-2028 (USD Thousand)
TABLE 388 Saudi Arabia Glassware Market, By Material, 2019-2028 (Thousand Units)
TABLE 389 Saudi Arabia Glassware Market, By Style, 2019-2028 (USD Thousand)
TABLE 390 Saudi Arabia Stemware in Glassware Market, By Type, 2019-2028 (USD Thousand)
TABLE 391 Saudi Arabia Red Wine Glass in Glassware Market, By Type, 2019-2028 (USD Thousand)
TABLE 392 Saudi Arabia White Wine Glass in Glassware Market, By Type, 2019-2028 (USD Thousand)
TABLE 393 Saudi Arabia Stemless Glass in Glassware Market, By Type, 2019-2028 (USD Thousand)
TABLE 394 Saudi Arabia Glassware Market, By Distribution Channel, 2019-2028 (USD Thousand)
TABLE 395 Saudi Arabia Glassware Market, By Price Range, 2019-2028 (USD Thousand)
TABLE 396 Saudi Arabia Glassware Market, By End-Use, 2019-2028 (USD Thousand)
TABLE 397 South africa Glassware Market, By Material, 2019-2028 (USD Thousand)
TABLE 398 South africa Glassware Market, By Material, 2019-2028 (Thousand Units)
TABLE 399 South africa Glassware Market, By Style, 2019-2028 (USD Thousand)
TABLE 400 South africa Stemware in Glassware Market, By Type, 2019-2028 (USD Thousand)
TABLE 401 South africa Red Wine Glass in Glassware Market, By Type, 2019-2028 (USD Thousand)
TABLE 402 South africa White Wine Glass in Glassware Market, By Type, 2019-2028 (USD Thousand)
TABLE 403 South africa Stemless Glass in Glassware Market, By Type, 2019-2028 (USD Thousand)
TABLE 404 South africa Glassware Market, By Distribution Channel, 2019-2028 (USD Thousand)
TABLE 405 South africa Glassware Market, By Price Range, 2019-2028 (USD Thousand)
TABLE 406 South africa Glassware Market, By End-Use, 2019-2028 (USD Thousand)
TABLE 407 Egypt Glassware Market, By Material, 2019-2028 (USD Thousand)
TABLE 408 Egypt Glassware Market, By Material, 2019-2028 (Thousand Units)
TABLE 409 Egypt Glassware Market, By Style, 2019-2028 (USD Thousand)
TABLE 410 Egypt Stemware in Glassware Market, By Type, 2019-2028 (USD Thousand)
TABLE 411 Egypt Red Wine Glass in Glassware Market, By Type, 2019-2028 (USD Thousand)
TABLE 412 Egypt White Wine Glass in Glassware Market, By Type, 2019-2028 (USD Thousand)
TABLE 413 Egypt Stemless Glass in Glassware Market, By Type, 2019-2028 (USD Thousand)
TABLE 414 Egypt Glassware Market, By Distribution Channel, 2019-2028 (USD Thousand)
TABLE 415 Egypt Glassware Market, By Price Range, 2019-2028 (USD Thousand)
TABLE 416 Egypt Glassware Market, By End-Use, 2019-2028 (USD Thousand)
TABLE 417 Israel Glassware Market, By Material, 2019-2028 (USD Thousand)
TABLE 418 Israel Glassware Market, By Material, 2019-2028 (Thousand Units)
TABLE 419 Israel Glassware Market, By Style, 2019-2028 (USD Thousand)
TABLE 420 Israel Stemware in Glassware Market, By Type, 2019-2028 (USD Thousand)
TABLE 421 Israel Red Wine Glass in Glassware Market, By Type, 2019-2028 (USD Thousand)
TABLE 422 Israel White Wine Glass in Glassware Market, By Type, 2019-2028 (USD Thousand)
TABLE 423 Israel Stemless Glass in Glassware Market, By Type, 2019-2028 (USD Thousand)
TABLE 424 Israel Glassware Market, By Distribution Channel, 2019-2028 (USD Thousand)
TABLE 425 Israel Glassware Market, By Price Range, 2019-2028 (USD Thousand)
TABLE 426 Israel Glassware Market, By End-Use, 2019-2028 (USD Thousand)
TABLE 427 rest of Middle East and Africa Glassware Market, By Material, 2019-2028 (USD Thousand)
TABLE 428 rest of Middle East and Africa Glassware Market, By Material, 2019-2028 (Thousand Units)
List of Figure
FIGURE 1 GLOBAL GLASSWARE MARKET: segmentation
FIGURE 2 GLOBAL GLASSWARE MARKET: data triangulation
FIGURE 3 GLOBAL GLASSWARE MARKET: DROC ANALYSIS
FIGURE 4 GLOBAL GLASSWARE MARKET: global VS regional MARKET analysis
FIGURE 5 GLOBAL GLASSWARE MARKET: company research analysis
FIGURE 6 GLOBAL GLASSWARE MARKET: THE product LIFE LINE CURVE
FIGURE 7 GLOBAL GLASSWARE MARKET: MULTIVARIATE MODELLING
FIGURE 8 GLOBAL GLASSWARE MARKET: INTERVIEW DEMOGRAPHICS
FIGURE 9 GLOBAL GLASSWARE MARKET: DBMR MARKET POSITION GRID
FIGURE 10 GLOBAL GLASSWARE MARKET: MARKET application COVERAGE GRID
FIGURE 11 GLOBAL GLASSWARE MARKET: THE MARKET CHALLENGE MATRIX
FIGURE 12 GLOBAL GLASSWARE MARKET: vendor share analysis
FIGURE 13 GLOBAL GLASSWARE MARKET: SEGMENTATION
FIGURE 14 Asia-PAcific is expected to DOMINATE THE GLOBAL GLASSWARE MARKET and IS EXPECTED TO GROW WITH THE HIGHEST CAGR IN the forecast period of 2021 to 2028
FIGURE 15 Rising popularity of fine dining across the globe is DRIVING the GLOBAL GLASSWARE MARKET in the forecast period of 2021 to 2028
FIGURE 16 soda lime glass SEGMENT is expected to account for the largest share of the GLOBAL GLASSWARE MARKET in 2021 & 2028
FIGURE 17 Asia-Pacific is the fastest growing market for GLASSWARE MARKET manufacturers in the forecast period of 2021 to 2028
FIGURE 18 DRIVERS, RESTRAINTs, OPPORTUNITies AND CHALLENGEs OF global glassware Market
FIGURE 19 Global Luxury Hotel Count, in Luxury Class, 2002-2018 (Approximate)
FIGURE 20 Global GLASSWARE market, BY material, 2020
FIGURE 21 Global GLASSWARE market,BY style, 2020
FIGURE 22 Global GLASSWARE market, BY distribution channel, 2020
FIGURE 23 Global GLASSWARE market, BY price range, 2020
FIGURE 24 Global GLASSWARE market, BY end-use, 2020
FIGURE 25 GLOBAL glassware market: SNAPSHOT (2020)
FIGURE 26 GLOBAL glassware market: by geography (2020)
FIGURE 27 GLOBAL glassware market: by geography (2021 & 2028)
FIGURE 28 GLOBAL glassware market: by geography (2020 & 2028)
FIGURE 29 GLOBAL glassware market: by material (2021-2028)
FIGURE 30 ASIA-PACIFIC Glassware market: SNAPSHOT (2020)
FIGURE 31 ASIA-PACIFIC Glassware market: by COUNTRY (2020)
FIGURE 32 ASIA-PACIFIC Glassware market: by COUNTRY (2021 & 2028)
FIGURE 33 ASIA-PACIFIC Glassware market: by COUNTRY (2020 & 2028)
FIGURE 34 ASIA-PACIFIC Glassware market: by Material (2021-2028)
FIGURE 35 EUROPE Glassware market: SNAPSHOT (2020)
FIGURE 36 EUROPE Glassware market: by COUNTRY (2020)
FIGURE 37 EUROPE Glassware market: by COUNTRY (2021 & 2028)
FIGURE 38 EUROPE Glassware market: by COUNTRY (2020 & 2028)
FIGURE 39 EUROPE Glassware market: by Material (2021-2028)
FIGURE 40 NORTH AMERICA Glassware market: SNAPSHOT (2020)
FIGURE 41 NORTH AMERICA Glassware market: by COUNTRY (2020)
FIGURE 42 NORTH AMERICA Glassware market: by COUNTRY (2021 & 2028)
FIGURE 43 NORTH AMERICA Glassware market: by COUNTRY (2020 & 2028)
FIGURE 44 NORTH AMERICA Glassware market: by material (2021-2028)
FIGURE 45 SOUTH AMERICA Glassware market: SNAPSHOT (2020)
FIGURE 46 SOUTH AMERICA Glassware market: by COUNTRY (2020)
FIGURE 47 SOUTH AMERICA Glassware market: by COUNTRY (2021 & 2028)
FIGURE 48 SOUTH AMERICA Glassware market: by COUNTRY (2020 & 2028)
FIGURE 49 SOUTH AMERICA Glassware market: by Material (2021-2028)
FIGURE 50 MIDDLE EAST AND AFRICA Glassware market: SNAPSHOT (2020)
FIGURE 51 MIDDLE EAST AND AFRICA Glassware market: by COUNTRY (2020)
FIGURE 52 MIDDLE EAST AND AFRICA Glassware market: by COUNTRY (2021 & 2028)
FIGURE 53 MIDDLE EAST AND AFRICA Glassware market: by COUNTRY (2020 & 2028)
FIGURE 54 MIDDLE EAST AND AFRICA Glassware market: by Material (2021-2028)
FIGURE 55 GLOBAL GLASSWARE MARKET: company share 2020 (%)
FIGURE 56 north AMERICA GLASSWARE MARKET: COMPANY SHARE 2020 (%)
FIGURE 57 EUROPE GLASSWARE MARKET: company share 2020 (%)
FIGURE 58 Asia-Pacific GLASSWARE MARKET: COMPANY SHARE 2020 (%)
Global Glassware Market, Supply Chain Analysis and Ecosystem Framework
To support market growth and help clients navigate the impact of geopolitical shifts, DBMR has integrated in-depth supply chain analysis into its Global Glassware Market research reports. This addition empowers clients to respond effectively to global changes affecting their industries. The supply chain analysis section includes detailed insights such as Global Glassware Market consumption and production by country, price trend analysis, the impact of tariffs and geopolitical developments, and import and export trends by country and HSN code. It also highlights major suppliers with data on production capacity and company profiles, as well as key importers and exporters. In addition to research, DBMR offers specialized supply chain consulting services backed by over a decade of experience, providing solutions like supplier discovery, supplier risk assessment, price trend analysis, impact evaluation of inflation and trade route changes, and comprehensive market trend analysis.
Data collection and base year analysis are done using data collection modules with large sample sizes. The stage includes obtaining market information or related data through various sources and strategies. It includes examining and planning all the data acquired from the past in advance. It likewise envelops the examination of information inconsistencies seen across different information sources. The market data is analysed and estimated using market statistical and coherent models. Also, market share analysis and key trend analysis are the major success factors in the market report. To know more, please request an analyst call or drop down your inquiry.
The key research methodology used by DBMR research team is data triangulation which involves data mining, analysis of the impact of data variables on the market and primary (industry expert) validation. Data models include Vendor Positioning Grid, Market Time Line Analysis, Market Overview and Guide, Company Positioning Grid, Patent Analysis, Pricing Analysis, Company Market Share Analysis, Standards of Measurement, Global versus Regional and Vendor Share Analysis. To know more about the research methodology, drop in an inquiry to speak to our industry experts.
Data Bridge Market Research is a leader in advanced formative research. We take pride in servicing our existing and new customers with data and analysis that match and suits their goal. The report can be customized to include price trend analysis of target brands understanding the market for additional countries (ask for the list of countries), clinical trial results data, literature review, refurbished market and product base analysis. Market analysis of target competitors can be analyzed from technology-based analysis to market portfolio strategies. We can add as many competitors that you require data about in the format and data style you are looking for. Our team of analysts can also provide you data in crude raw excel files pivot tables (Fact book) or can assist you in creating presentations from the data sets available in the report.


