Asia Pacific Electrostatic Precipitator Market
시장 규모 (USD 10억)
연평균 성장률 :
% 
 USD
2.29 Billion
USD
3.54 Billion
2024
2032
USD
2.29 Billion
USD
3.54 Billion
2024
2032
| 2025 –2032 | |
| USD 2.29 Billion | |
| USD 3.54 Billion | |
| % | |
|
아시아 태평양 전기 집진기 시장 세분화, 유형(건식 ESP 및 습식 ESP), 제공 항목(하드웨어, 소프트웨어 및 서비스), 응용 분야(석탄 발전, 전기 아크로, 가스터빈, 고형 폐기물 소각로, 산업 발전 및 기타), 최종 사용자(발전, 금속 가공, 시멘트, 제조, 화학, 석유 화학, 해양 및 기타) - 산업 동향 및 2032년까지의 전망
아시아 태평양 전기 집진기 시장 규모
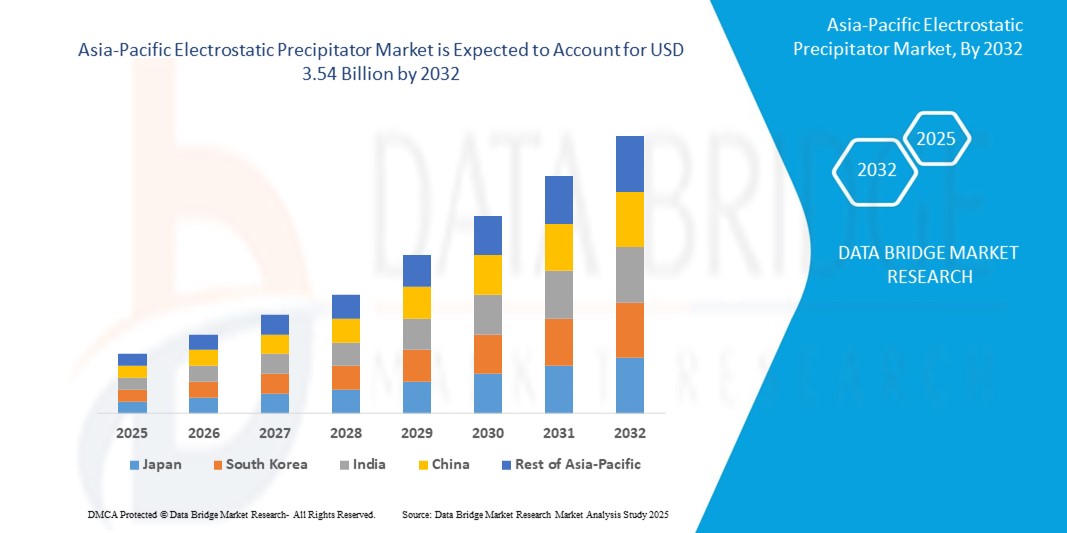
- 아시아 태평양 전기 집진기 시장 규모는 2024년에 22억 9천만 달러 로 평가되었으며 예측 기간 동안 5.60%의 CAGR 로 2032년까지 35억 4천만 달러에 도달할 것으로 예상됩니다 .
- 시장 성장은 주요 경제권 전반의 대기 오염 통제 규정 강화, 발전 및 시멘트 제조를 포함한 산업 인프라 확장, 그리고 지역 전체의 공중 보건 및 환경 질을 개선하기 위한 미립자 배출 완화에 대한 정부의 집중 강화에 의해 크게 촉진되었습니다.
- 또한, 인도, 중국, 동남아시아 등 신흥 경제권에서 대기 오염의 건강 영향에 대한 대중의 인식이 높아지고 첨단 배출 제어 기술이 점점 더 많이 도입되면서 시장 성장 궤적이 크게 가속화되고 있습니다.
아시아 태평양 전기 집진기 시장 분석
- 아시아 태평양 전기 집진기 시장은 발전 및 시멘트 제조와 같은 산업 분야에서 고급 공기 여과에 대한 수요가 증가함에 따라 꾸준한 성장을 보이고 있습니다.
- 제조 단위 전반에 걸친 오염 제어 시스템 현대화에 대한 투자로 인해 해당 지역에서 전기 집진기의 지속적인 도입이 촉진되고 있습니다.
- 중국은 2024년 아시아 태평양 전기 집진기 시장에서 가장 큰 시장 수익 점유율을 차지했으며, 이는 국가의 대규모 산업 운영, 증가하는 에너지 수요, 엄격한 대기 질 관리 정책에 힘입은 것입니다.
- 일본은 엄격한 환경 규제, 청정 기술에 대한 강력한 집중, 에너지 효율적이고 저배출 장비를 갖춘 산업 시설 현대화 이니셔티브 확대로 인해 아시아 태평양 전기 집진기 시장에서 가장 높은 연평균 성장률(CAGR)을 기록할 것으로 예상됩니다.
- 건식 ESP 부문은 2024년 68.5%의 매출 점유율로 시장을 장악하며 가장 큰 매출 점유율을 기록했습니다. 이는 발전소, 시멘트 가마, 제철소와 같은 고온 산업 분야에서 널리 사용되고 있기 때문입니다. 건식 ESP는 물을 사용하지 않고도 배기가스에서 미세먼지를 효과적으로 제거하여 폐기물 처리 문제를 최소화하고 유지 보수 비용을 절감합니다. 석탄 기반 에너지 생산 분야에서 효율적인 미세먼지 제어에 대한 높은 수요는 이 부문의 성장을 지속적으로 뒷받침하고 있습니다.
보고서 범위 및 아시아 태평양 전기 집진기 시장 세분화
|
속성 |
아시아 태평양 전기 집진기 주요 시장 통찰력 |
|
다루는 세그먼트 |
|
|
포함 국가 |
아시아 태평양
|
|
주요 시장 참여자 |
|
|
시장 기회 |
• 배출 기준을 충족하기 위한 해양 및 철도 부문의 사용 증가 |
|
부가가치 데이터 정보 세트 |
Data Bridge Market Research에서 큐레이팅한 시장 보고서에는 시장 가치, 성장률, 세분화, 지리적 범위, 주요 기업 등 시장 시나리오에 대한 통찰력 외에도 심층적인 전문가 분석, 지리적으로 대표되는 회사별 생산 및 용량, 유통업체 및 파트너의 네트워크 레이아웃, 자세하고 업데이트된 가격 추세 분석, 공급망 및 수요에 대한 부족 분석이 포함됩니다. |
아시아 태평양 전기 집진기 시장 동향
“산업용 애플리케이션에서 하이브리드 전기 집진기로의 전환 증가”
- 전기 및 기계적 여과 방법을 통합한 하이브리드 전기 집진기(ESP)는 초미세 입자를 효율적으로 제거하는 능력으로 인해 점점 더 많이 채택되고 있습니다.
- 예를 들어, 인도 발전소에 설치된 하이브리드 ESP는 PM2.5 포집에 있어 눈에 띄는 개선을 보였습니다.
- 시멘트와 화력발전 등에서 배출가스가 많은 하이브리드 ESP에 대한 수요가 급증하고 있습니다. 동남아시아의 주요 시멘트 제조업체들은 새로운 배출 기준 준수를 위해 하이브리드 ESP로 업그레이드하기 시작했습니다.
- 하이브리드 시스템은 플랜트 출력이 변동하더라도 보다 일관된 입자 제거를 제공하므로 다양한 운영 부하가 있는 시설에 이상적입니다.
- 중국 및 인도와 같은 국가에서 대기 질 규정이 더욱 엄격해짐에 따라 업계에서는 규정을 준수하기 위해 하이브리드 ESP와 같은 고급 솔루션을 도입해야 합니다.
- 이 지역의 산업은 효율성을 개선하고 변화하는 환경 기준을 충족하기 위해 하이브리드 기술을 사용하여 기존 ESP를 개조하는 데 투자하고 있습니다.
아시아 태평양 전기 집진기 시장 동향
운전사
“산업 대기 오염 억제를 위한 규제 압력 강화”
- 아시아 태평양 전기 집진기 시장은 중국, 인도, 인도네시아 등 급속히 발전하는 국가에서 산업 대기 오염을 억제하기 위한 노력의 확대에 의해 주도되고 있습니다.
- 중국의 Blue Sky Protection Campaign 및 인도의 National Clean Air Programme(NCAP)과 같은 규제 프레임워크는 ESP를 포함한 첨단 배출 제어 기술의 설치를 오염이 심한 부문 전반에 의무화하고 있습니다.
- 발전, 시멘트, 금속 가공, 화학 등의 산업은 배출 기준을 충족하고 규제 처벌을 피하기 위해 여과 시스템을 업그레이드해야 한다는 압력이 점점 커지고 있습니다.
- 초미세먼지(PM2.5 이하)를 포집할 수 있는 시스템에 대한 수요가 증가함에 따라 공공 및 민간 시설 모두에서 고효율 ESP 구축이 가속화되고 있습니다.
- 환경 지속 가능성에 대한 약속과 ESG 목표가 기업들이 청정 기술에 투자하도록 촉구하는 가운데, 국내 ESP 제조업체들은 지역적 요구를 충족하고 비용 장벽을 줄이기 위해 제품을 확대하고 있습니다.
제지/도전
“높은 자본 및 유지 관리 비용이 도입을 방해하고 있습니다.”
- 전기 집진기(ESP) 시스템의 높은 자본 비용은 아시아 태평양 시장, 특히 비용에 민감한 중소 규모 산업에 있어 계속해서 주요 과제로 남아 있습니다.
- ESP, 특히 고급형 또는 하이브리드형 모델은 고전압 전원 장치, 방전 전극, 정교한 제어 시스템과 같은 구성 요소에 상당한 투자가 필요하므로 초기 조달 비용이 증가합니다.
- 개발도상국의 중소기업은 환경적 의무에도 불구하고 이러한 비용을 정당화하는 데 어려움을 겪으며 이로 인해 저항이나 도입 지연이 발생합니다.
- 숙련된 노동력, 정기적인 시스템 유지 관리, 전극과 같은 중요 부품 교체가 필요하기 때문에 운영 비용이 더욱 증가합니다. 특히 철강이나 시멘트 제조와 같은 고먼지 응용 분야에서는 더욱 그렇습니다.
- 신뢰할 수 없는 전기 인프라가 있는 지역에서는 불안정한 전력 공급으로 인해 ESP 성능과 수명이 저하될 수 있으며, 이로 인해 일부 산업에서는 유지 관리가 쉽지만 시간이 지남에 따라 입자 제거 효율성이 떨어지는 백하우스 필터와 같은 비용이 덜 드는 대안을 선택하게 됩니다.
아시아 태평양 전기 집진기 시장 범위
아시아 태평양 전기집진기 시장은 유형, 제공 제품, 응용 분야 및 최종 사용자를 기준으로 세분화됩니다.
- 유형별
아시아 태평양 전기집진기 시장은 유형별로 건식 ESP와 습식 ESP로 구분됩니다. 건식 ESP 부문은 발전소, 시멘트 가마, 제철소와 같은 고온 산업 분야에서 널리 사용되면서 2024년 68.5%의 매출 점유율로 시장을 장악했습니다. 건식 ESP는 물을 사용하지 않고도 배기가스에서 미세먼지를 효과적으로 제거하여 폐기물 처리 문제를 최소화하고 유지보수 비용을 절감합니다. 석탄 기반 에너지 생산 분야에서 효율적인 미세먼지 제어에 대한 높은 수요는 이 부문의 성장을 지속적으로 뒷받침하고 있습니다.
습식 ESP 부문은 폐기물 소각, 금속 정제, 화학 제조 등의 산업에서 점착성 또는 습한 입자를 처리하는 데 적합하기 때문에 2025년부터 2032년까지 가장 빠른 성장을 보일 것으로 예상됩니다. 습식 ESP는 초미세 입자, 산성 미스트, 연기 포집에 탁월한 성능을 제공하여 해당 지역의 엄격한 배출 규제를 충족합니다.
- 제공함으로써
아시아 태평양 전기집진기 시장은 제품 제공을 기준으로 하드웨어, 소프트웨어, 서비스로 구분됩니다. 하드웨어 부문은 에너지 및 산업 분야에서 전기집진기 장치의 지속적인 도입에 힘입어 2024년에 가장 큰 매출 점유율을 기록했습니다. 노후화된 ESP 인프라를 첨단 하드웨어 솔루션으로 교체해야 하는 필요성이 커지면서 성장세가 더욱 가속화되고 있습니다.
서비스 부문은 배출 기준을 준수하고 장비 수명을 연장하기 위한 정기적인 유지관리, 개량, 성능 최적화에 대한 수요 증가에 힘입어 2025년부터 2032년까지 가장 빠른 성장률을 보일 것으로 예상됩니다.
- 응용 프로그램별
아시아 태평양 전기집진기 시장은 적용 분야별로 석탄 화력 발전, 전기 아크로, 가스터빈, 고형 폐기물 소각로, 산업용 발전 등으로 구분됩니다. 중국과 인도 등 여러 국가에서 가동 중인 화력 발전소가 많기 때문에 2024년에는 석탄 화력 발전 부문이 시장을 주도했습니다. 전기집진기는 이러한 발전소에서 발생하는 미세먼지 배출을 줄이는 데 중요한 역할을 하며, 지역 오염 관리 규정을 준수합니다.
고형 폐기물 소각로 부문은 도시화 증가와 효과적인 폐기물 에너지화 솔루션에 대한 수요 증가에 힘입어 2025년부터 2032년까지 가장 빠른 성장률을 기록할 것으로 예상됩니다. 각국 정부가 친환경 소각 기술에 투자함에 따라 고성능 ESP 시스템에 대한 수요도 꾸준히 증가하고 있습니다.
- 최종 사용자별
아시아 태평양 전기집진기 시장은 최종 사용자 기준으로 발전, 금속 가공, 시멘트, 제조, 화학, 석유화학, 해양 및 기타 분야로 세분화됩니다. 발전 부문은 석탄 기반 에너지 생산 시설의 미세먼지 배출을 줄이기 위해 ESP(Electrostatic Power System)에 의존함에 따라 2024년 시장 점유율이 가장 높았습니다. 배출 관련 엄격한 규제 체계는 전력회사들이 효율적인 ESP 시스템을 업그레이드하거나 설치하도록 장려하고 있습니다.
화학 부문은 청정 생산 방식과 오염 관리에 대한 강조가 강화됨에 따라 2025년부터 2032년까지 가장 빠른 성장률을 기록할 것으로 예상됩니다. 화학 공장들은 미세먼지, 산성 미스트, 공정 증기 배출을 제어하기 위해 ESP(전자식 미세먼지 저감 시스템)를 도입하고 있으며, 이는 지역의 변화하는 환경 정책에 발맞추고 있습니다.
아시아 태평양 전기 집진기 시장 지역 분석
- 중국은 2024년 아시아 태평양 전기 집진기 시장에서 가장 큰 시장 수익 점유율을 차지했으며, 이는 국가의 대규모 산업 운영, 증가하는 에너지 수요, 엄격한 대기 질 관리 정책에 힘입은 것입니다.
- 중국 정부는 청정 대기 이니셔티브에 따라 산업 배출 감소를 적극적으로 추진하고 있으며, 이로 인해 시멘트, 금속 및 발전 부문 전반에 걸쳐 정전기 집진기가 광범위하게 배치되고 있습니다.
- 주요 국내 제조업체들의 존재와 진행 중인 인프라 개발 프로젝트는 수요를 더욱 증폭시키고 있습니다. 또한, 대기 오염의 건강 영향에 대한 인식이 높아짐에 따라 공공 및 민간 부문 모두에서 대기 오염 방지 기술 도입이 더욱 가속화되고 있습니다.
일본 전기 집진기 시장 분석
일본 전기집진기 시장은 2025년부터 2032년까지 가장 빠른 성장을 보일 것으로 예상됩니다. 이는 일본의 강력한 환경 규제 기준과 에너지 효율적이고 깨끗한 산업 관행에 대한 집중적인 노력 덕분입니다. 기술 주도 국가인 일본은 첨단 배출 제어 시스템을 활용한 산업 인프라 현대화에 중점을 두고 있습니다. 특히 발전 및 제조 부문에서 친환경 생산 방식으로의 전환은 시장 확대에 기여하고 있습니다. 또한, 미세먼지 배출 감축을 위한 정부 지원 사업과 기존 발전소 개량 투자는 일본 시장의 전기집진기 도입에 긍정적인 영향을 미치고 있습니다.
아시아 태평양 전기 집진기 시장 점유율
아시아 태평양 전기 집진기 산업은 주로 다음을 포함한 잘 확립된 회사들이 주도하고 있습니다.
- Thermax Limited(인도)
- 스미토모 중공업 주식회사(일본)
- Fujian Longking Co., Ltd.(중국)
- 미쓰비시 파워 주식회사(일본)
- KC 코트렐(한국)
- 클린(한국)
- Bharat Heavy Electricals Limited(인도)
- Pennar Industries Limited(인도)
SKU-
세계 최초의 시장 정보 클라우드 보고서에 온라인으로 접속하세요

- 대화형 데이터 분석 대시보드
- 높은 성장 잠재력 기회를 위한 회사 분석 대시보드
- 사용자 정의 및 질의를 위한 리서치 분석가 액세스
- 대화형 대시보드를 통한 경쟁자 분석
- 최신 뉴스, 업데이트 및 추세 분석
- 포괄적인 경쟁자 추적을 위한 벤치마크 분석의 힘 활용
목차
- 소개
- 연구 목적
- 시장 정의
- 아시아 태평양 전기 집진기 시장 개요
- 통화 및 가격
- 제한 사항
- 다루는 시장
- 시장 세분화
- 다루는 시장
- 지리적 범위
- 연구를 위해 고려된 연도
- DBMR TRIPOD 데이터 검증 모델
- 주요 의견 리더와의 1차 인터뷰
- DBMR 시장 포지션 그리드
- 공급업체 점유율 분석
- 시장 유형 커버리지 그리드
- 다변량 모델링
- 타입 타임라인 커브
- 2차 출처
- 가정
- 요약
- 프리미엄 인사이트
- 시장 개요
- 운전자
- 전 세계적으로 건설 활동 증가
- 배출 제어 솔루션의 기술적 발전
- 급속한 도시화로 인해 신흥국 전역에서 전기 수요 증가
- 제약
- 엄격한 정부 규제
- ESP의 높은 설치 비용
- 기회
- 조직 간의 전략적 제휴 및 파트너십
- 정부의 오염 방지 프로그램 이니셔티브 증가
- 정부의 광범위한 R&D 투자
- 도전
- 배출 제어 시스템에 대한 인식 부족
- 작동상의 어려움 및 장치 오작동
- 불리한 경제 상황과 대체 에너지원의 등장
- COVID-19가 시장에 미치는 영향 분석
- 전기 집진기 시장의 여파
- COVID-19 팬데믹 이후 시장의 기회
- 공급, 수요 및 가격에 미치는 영향
- 결론
- 유형별 아시아 태평양 전기 집진기 시장
- 개요
- 드라이 ESP
- 습식 ESP
- 아시아 태평양 전기 집진기 시장, 제공별
- 개요
- 하드웨어 및 소프트웨어
- 방전 전극
- 고전압 전기 시스템
- 수집 전극
- 래퍼들
- 호퍼스
- 껍데기
- 기타
- 서비스
- 아시아 태평양 전기 집진기 시장, 응용 분야별
- 개요
- 석탄 화력 발전
- 전기 아크로
- 가스터빈
- 산업 전력
- 고형 폐기물 소각로
- 기타
- 최종 사용자별 아시아 태평양 전기 집진기 시장
- 개요
- 발전
- 유형별
- 석탄 발전소
- 석유 정제소 및 발전소
- ESP 유형별
- 드라이 ESP
- 습식 ESP
- 금속 가공
- 유형별
- 철강 제조
- 비철금속 생산 및 가공
- 파운드리
- 알루미늄 제련
- ESP 유형별
- 드라이 ESP
- 습식 ESP
- 시멘트
- ESP 유형별
- 드라이 ESP
- 습식 ESP
- 화학 및 석유화학
- 유형별
- 기초화학제조
- 특수 화학 제조업체
- 소비자 화학 제조업체
- ESP 유형별
- 드라이 ESP
- 습식 ESP
- 조작
- ESP 유형별
- 드라이 ESP
- 습식 ESP
- 선박
- ESP 유형별
- 드라이 ESP
- 습식 ESP
- 기타
- 국가별 아시아 태평양 전기 집진기 시장
- 중국
- 인도
- 일본
- 대한민국
- 인도네시아 공화국
- 호주
- 태국
- 말레이시아
- 필리핀 제도
- 싱가포르
- 아시아 태평양의 나머지 지역
- 아시아 태평양 전기 집진기 시장: 회사 현황
- 회사 주식 분석: 아시아 태평양
- SWOT 분석
- 회사 프로필
- 푸젠 롱킹 주식회사
- 회사 스냅샷
- 사업 포트폴리오
- 최근 개발
- 미쓰비시 파워 주식회사(미쓰비시 중공업 주식회사의 자회사)
- 회사 스냅샷
- 수익 분석
- 제품 포트폴리오
- 최근 개발 사항
- 바라트 헤비 일렉트리컬스 리미티드
- 회사 스냅샷
- 수익 분석
- 제품 포트폴리오
- 최근 개발 사항
- 스미토모 중공업 주식회사
- 회사 스냅샷
- 수익 분석
- 제품 포트폴리오
- 최근 개발 사항
- 제너럴 일렉트릭
- 회사 스냅샷
- 수익 분석
- 제품 포트폴리오
- 최근 개발
- 배브콕 & 윌콕스 엔터프라이즈 주식회사
- 회사 스냅샷
- 수익 분석
- 제품 포트폴리오
- 최근 개발 사항
- 플스미스
- 회사 스냅샷
- 수익 분석
- 제품 포트폴리오
- 최근 개발 사항
- GEA 그룹 주식회사
- 회사 스냅샷
- 수익 분석
- 제품 포트폴리오
- 최근 개발
- 존 우드 그룹 PLC
- 회사 스냅샷
- 수익 분석
- 제품 포트폴리오
- 최근 개발
- KC 코트렐
- 회사 스냅샷
- 수익 분석
- 제품 포트폴리오
- 최근 개발
- 클린
- 회사 스냅샷
- 제품 포트폴리오
- 최근 개발
- 페나르 인더스트리즈 리미티드
- 회사 스냅샷
- 수익 분석
- 제품 포트폴리오
- 최근 개발
- 지멘스 에너지
- 회사 스냅샷
- 수익 분석
- 제품 포트폴리오
- 최근 개발 사항
- 사 하몬
- 회사 스냅샷
- 수익 분석
- 제품 포트폴리오
- 최근 개발 사항
- 테르맥스 리미티드
- 회사 스냅샷
- 수익 분석
- 제품 포트폴리오
- 최근 개발
- 설문지
- 관련 보고서
표 목록
표 1 석탄화력발전소 배출기준
표 2 발전소의 전기 집진기 평균 비용
표 3 아시아 태평양 전기 집진기 시장, 유형별, 2019-2028 (USD 천 달러)
표 4 아시아 태평양 전기 집진기 시장, 제공 품목별, 2019-2028 (USD 천 달러)
표 5 아시아 태평양 전기 집진기 시장의 하드웨어 및 소프트웨어, 유형별, 2019-2028 (USD 천 달러)
표 6 아시아 태평양 전기 집진기 시장, 응용 분야별, 2019-2028 (USD 천 달러)
표 7 아시아 태평양 전기 집진기 시장, 최종 사용자별, 2019-2028 (USD 천 달러)
표 8 아시아 태평양 전기 집진기 시장, 유형별, 2019-2028 (USD 천 달러)
표 9 전기 집진기 시장에서 아시아 태평양 발전량, ESP 유형별, 2019-2028 (USD 천 달러)
표 10 아시아 태평양 전기 집진기 시장의 금속 가공 유형별, 2019-2028년(USD 천 달러)
표 11 전기 집진기 시장의 아시아 태평양 금속 가공, ESP 유형별, 2019-2028(USD 천 달러)
표 12 전기 집진기 시장의 아시아 태평양 시멘트, ESP 유형별, 2019-2028(USD 천 달러)
표 13 아시아 태평양 전기 집진기 시장의 화학 및 석유화학 제품 유형별, 2019-2028년(USD 천 달러)
표 14 아시아 태평양 전기 집진기 시장의 화학 및 석유화학 제품, ESP 유형별, 2019-2028 (USD 천 달러)
표 15 전기 집진기 시장의 아시아 태평양 제조업, ESP 유형별, 2019-2028 (USD 천 달러)
표 16 아시아 태평양 해양 전기 집진기 시장, ESP 유형별, 2019-2028 (USD 천 달러)
표 17 아시아 태평양 전기 집진기 시장, 국가별, 2019-2028 (USD 천)
표 18 중국 전기 집진기 시장, 유형별, 2019-2028 (USD 천)
표 19 중국 전기 집진기 시장, 제공량 기준, 2019-2028 (USD 천)
표 20 중국 전기 집진기 시장의 하드웨어 및 소프트웨어, 유형별, 2019-2028 (USD 천 달러)
표 21 중국 전기 집진기 시장, 용도별, 2019-2028 (USD 천)
표 22 중국 전기 집진기 시장, 최종 사용자별, 2019-2028 (USD 천 달러)
표 23 중국 전기 집진기 시장 발전량, 유형별, 2019-2028 (USD 천)
표 24 전기 집진기 시장에서 중국 발전량, ESP 유형별, 2019-2028 (USD 천)
표 25 중국 전기 집진기 시장(유형별) (2019-2028년, 천 달러)
표 26 중국 전기 집진기 시장(ESP 유형별), 2019-2028(USD 천 달러)
표 27 중국 시멘트 전기 집진기 시장, ESP 유형별, 2019-2028 (USD 천 달러)
표 28 중국 화학 및 석유화학 전기집진기 시장, 유형별, 2019-2028 (USD 천)
표 29 중국 화학 및 석유화학 전기 집진기 시장, ESP 유형별, 2019-2028 (USD 천)
표 30 전기 집진기 시장(ESP 유형별) 중국 제조업, 2019-2028년(USD 천 달러)
표 31 중국 해양 전기 집진기 시장, ESP 유형별, 2019-2028 (USD 천)
표 32 인도 전기 집진기 시장, 유형별, 2019-2028(USD 천)
표 33 인도 전기 집진기 시장, 제공 품목별, 2019-2028년(USD 천 달러)
표 34 인도 전기 집진기 시장의 하드웨어 및 소프트웨어, 유형별, 2019-2028(USD 천 달러)
표 35 인도 전기 집진기 시장, 용도별, 2019-2028 (USD 천)
표 36 인도 전기 집진기 시장, 최종 사용자별, 2019-2028 (USD 천 달러)
표 37 인도 전기 집진기 시장, 유형별, 2019-2028(USD 천)
표 38 전기 집진기 시장의 인도 발전량, ESP 유형별, 2019-2028(USD 천 달러)
표 39 인도 전기 집진기 시장(유형별) 2019-2028년(USD 천 달러)
표 40: ESP 유형별 인도 전기 집진기 시장 금속 가공, 2019-2028년(USD 천 달러)
표 41: ESP 유형별 전기 집진기 시장의 인도 시멘트, 2019-2028년(USD 천 달러)
표 42 인도 화학 및 석유화학 전기 집진기 시장, 유형별, 2019-2028(USD 천)
표 43 인도 화학 및 석유화학 전기 집진기 시장, ESP 유형별, 2019-2028(USD 천 달러)
표 44 전기 집진기 시장(ESP 유형별)의 인도 제조업, 2019-2028년(USD 천 달러)
표 45 인도 해양 전기 집진기 시장, ESP 유형별, 2019-2028(USD 천 달러)
표 46 일본 전기 집진기 시장, 유형별, 2019-2028 (USD 천)
표 47 일본 전기 집진기 시장, 제공 품목별, 2019-2028 (USD 천)
표 48 전기 집진기 시장의 일본 하드웨어 및 소프트웨어, 유형별, 2019-2028 (USD 천 달러)
표 49 일본 전기 집진기 시장, 용도별, 2019-2028 (USD 천)
표 50 일본 전기 집진기 시장, 최종 사용자별, 2019-2028 (USD 천 달러)
표 51 전기 집진기 시장의 일본 발전량, 유형별, 2019-2028 (USD 천)
표 52 전기 집진기 시장에서의 일본 발전량, ESP 유형별, 2019-2028 (USD 천)
표 53 일본 금속 가공 전기 집진기 시장, 유형별, 2019-2028 (USD 천)
표 54 전기 집진기 시장에서의 일본 금속 가공, ESP 유형별, 2019-2028 (USD 천 달러)
표 55 전기 집진기 시장에서 일본 시멘트 시장, ESP 유형별, 2019-2028 (USD 천 달러)
표 56 일본 화학 및 석유화학 전기집진기 시장, 유형별, 2019-2028 (USD 천)
표 57 일본 화학 및 석유화학 전기집진기 시장, ESP 유형별, 2019-2028 (USD 천 달러)
표 58 전기 집진기 시장의 일본 제조업, ESP 유형별, 2019-2028 (USD 천 달러)
표 59 일본 해양의 전기 집진기 시장, ESP 유형별, 2019-2028 (USD 천 달러)
표 60 한국 전기 집진기 시장, 유형별, 2019-2028 (USD 천)
표 61 한국 전기 집진기 시장, 제공 품목별, 2019-2028 (USD 천)
표 62 한국 전기집진기 시장 하드웨어 및 소프트웨어, 유형별, 2019-2028 (USD 천 달러)
표 63 한국 전기 집진기 시장, 용도별, 2019-2028 (USD 천)
표 64 한국 전기 집진기 시장, 최종 사용자별, 2019-2028 (USD 천)
표 65 전기집진기 시장 유형별 한국 발전 시장, 2019-2028 (USD 천)
표 66 전기집진기 시장 내 한국의 발전량, ESP 유형별, 2019-2028 (USD 천)
표 67 한국 금속 가공 전기 집진기 시장, 유형별, 2019-2028 (USD 천)
표 68 전기 집진기 시장(ESP 유형별) 한국 금속 가공 시장, 2019-2028 (USD 천 달러)
표 69 한국 시멘트 전기집진기 시장, ESP 유형별, 2019-2028 (USD 천 달러)
표 70 한국 화학 및 석유화학 전기집진기 시장, 유형별, 2019-2028 (USD 천)
표 71. 2019-2028년 ESP 유형별 한국 화학 및 석유화학 전기집진기 시장(USD 천 달러)
표 72 전기 집진기 시장(ESP 유형별)의 한국 제조업, 2019-2028년(USD 천 달러)
표 73 한국 해양 전기 집진기 시장, ESP 유형별, 2019-2028 (USD 천 달러)
표 74 인도네시아 전기 집진기 시장, 유형별, 2019-2028 (USD 천)
표 75 인도네시아 전기 집진기 시장, 제공 기준, 2019-2028 (USD 천)
표 76 인도네시아 전기 집진기 시장 하드웨어 및 소프트웨어, 유형별, 2019-2028 (USD 천)
표 77 인도네시아 전기 집진기 시장, 용도별, 2019-2028 (USD 천)
표 78 인도네시아 전기 집진기 시장, 최종 사용자별, 2019-2028 (USD 천 달러)
표 79 인도네시아 전기 집진기 시장 유형별 발전량, 2019-2028년(USD 천 달러)
표 80: 인도네시아 전기 집진기 시장 발전량, ESP 유형별, 2019-2028년(USD 천 달러)
표 81 인도네시아 전기 집진기 시장 유형별 금속 가공, 2019-2028년(USD 천 달러)
표 82 인도네시아 전기 집진기 시장, ESP 유형별, 2019-2028년(USD 천 달러)
표 83 2019-2028년 ESP 유형별 인도네시아 시멘트 전기 집진기 시장(USD 천 달러)
표 84 인도네시아 화학 및 석유화학 전기집진기 시장, 유형별, 2019-2028(USD 천)
표 85 인도네시아 전기 집진기 시장(ESP 유형별), 2019-2028(USD 천 달러)
표 86 ESP 유형별 인도네시아 전기 집진기 시장 제조, 2019-2028 (USD 천)
표 87 인도네시아 해양 전기 집진기 시장, ESP 유형별, 2019-2028 (USD 천 달러)
표 88 호주 전기 집진기 시장, 유형별, 2019-2028 (USD 천)
표 89 호주 전기 집진기 시장, 제공 기준, 2019-2028 (USD 천)
표 90: 호주 전기 집진기 시장의 하드웨어 및 소프트웨어, 유형별, 2019-2028 (USD 천 달러)
표 91 호주 전기 집진기 시장, 용도별, 2019-2028 (USD 천)
표 92 호주 전기 집진기 시장, 최종 사용자별, 2019-2028 (USD 천 달러)
표 93 호주 전기 집진기 시장, 유형별, 2019-2028(USD 천)
표 94 전기 집진기 시장에서의 호주 발전량, ESP 유형별, 2019-2028 (USD 천)
표 95 호주 전기 집진기 시장 유형별 금속 가공, 2019-2028년(USD 천 달러)
표 96. ESP 유형별 호주 금속 가공 전기 집진기 시장, 2019-2028 (USD 천 달러)
표 97 전기 집진기 시장에서 사용되는 호주 시멘트, ESP 유형별, 2019-2028 (USD 천 달러)
표 98 호주 화학 및 석유화학 전기 집진기 시장, 유형별, 2019-2028 (USD 천)
표 99 호주 화학 및 석유화학 전기 집진기 시장, ESP 유형별, 2019-2028 (USD 천)
표 100 전기 집진기 시장(ESP 유형별) 호주 제조업, 2019-2028년(USD 천 달러)
표 101. 호주 해양 전기 집진기 시장, ESP 유형별, 2019-2028 (USD 천 달러)
표 102 태국 전기 집진기 시장, 유형별, 2019-2028 (USD 천)
표 103 태국 전기 집진기 시장, 제공량 기준, 2019-2028 (USD 천)
표 104 태국 전기 집진기 시장 하드웨어 및 소프트웨어, 유형별, 2019-2028 (USD 천)
표 105 태국 전기 집진기 시장, 용도별, 2019-2028 (USD 천)
표 106 태국 전기 집진기 시장, 최종 사용자별, 2019-2028 (USD 천 달러)
표 107 태국 전기 집진기 시장, 유형별, 2019-2028(USD 천)
표 108 태국 전기 집진기 시장 발전량, ESP 유형별, 2019-2028 (USD 천)
표 109 태국 전기 집진기 시장(유형별) 2019-2028년(USD 천 달러)
표 110 태국 전기 집진기 시장(ESP 유형별), 2019-2028(USD 천 달러)
표 111 태국 시멘트 전기 집진기 시장, ESP 유형별, 2019-2028 (USD 천)
표 112 태국 화학 및 석유화학 전기 집진기 시장, 유형별, 2019-2028(USD 천)
표 113 태국 화학 및 석유화학 전기 집진기 시장, ESP 유형별, 2019-2028(USD 천)
표 114 태국 전기 집진기 시장 제조, ESP 유형별, 2019-2028 (USD 천)
표 115 태국 해양 전기 집진기 시장, ESP 유형별, 2019-2028 (USD 천)
표 116 말레이시아 전기 집진기 시장, 유형별, 2019-2028 (USD 천)
표 117 말레이시아 전기 집진기 시장, 제공 기준, 2019-2028 (USD 천)
표 118 말레이시아 전기 집진기 시장의 하드웨어 및 소프트웨어, 유형별, 2019-2028 (USD 천)
표 119 말레이시아 전기 집진기 시장, 용도별, 2019-2028 (USD 천)
표 120 말레이시아 전기 집진기 시장, 최종 사용자별, 2019-2028 (USD 천 달러)
표 121 말레이시아 전기 집진기 시장, 유형별, 2019-2028 (USD 천)
표 122 전기 집진기 시장에서의 말레이시아 발전량, ESP 유형별, 2019-2028 (USD 천)
표 123 말레이시아 전기 집진기 시장 유형별 금속 가공, 2019-2028년(USD 천 달러)
표 124 말레이시아 전기 집진기 시장, ESP 유형별, 2019-2028(USD 천 달러)
표 125 전기 집진기 시장의 말레이시아 시멘트, ESP 유형별, 2019-2028 (USD 천 달러)
표 126 말레이시아 화학 및 석유화학 전기 집진기 시장, 유형별, 2019-2028(USD 천)
표 127 말레이시아 화학 및 석유화학 전기 집진기 시장, ESP 유형별, 2019-2028 (USD 천)
표 128 ESP 유형별 말레이시아 전기 집진기 시장 제조, 2019-2028 (USD 천)
표 129 말레이시아 해양 전기 집진기 시장, ESP 유형별, 2019-2028 (USD 천 달러)
표 130 필리핀 전기 집진기 시장, 유형별, 2019-2028 (USD 천)
표 131 필리핀 전기 집진기 시장, 제공 기준, 2019-2028 (USD 천)
표 132 필리핀 전기 집진기 시장의 하드웨어 및 소프트웨어, 유형별, 2019-2028 (USD 천)
표 133 필리핀 전기 집진기 시장, 용도별, 2019-2028 (USD 천)
표 134 필리핀 전기 집진기 시장, 최종 사용자별, 2019-2028 (USD 천)
표 135 필리핀 전기 집진기 시장, 유형별, 2019-2028 (USD 천)
표 136 필리핀 전기 집진기 시장 발전량, ESP 유형별, 2019-2028 (USD 천)
표 137 필리핀 전기 집진기 시장 유형별 금속 가공, 2019-2028년(USD 천 달러)
표 138 필리핀 전기 집진기 시장(ESP 유형별), 2019-2028(USD 천 달러)
표 139 필리핀 시멘트 전기 집진기 시장, ESP 유형별, 2019-2028 (USD 천 달러)
표 140 필리핀 화학 및 석유화학 전기집진기 시장, 유형별, 2019-2028 (USD 천)
표 141 필리핀 화학 및 석유화학 전기집진기 시장, ESP 유형별, 2019-2028 (USD 천)
표 142 필리핀 전기 집진기 시장 제조, ESP 유형별, 2019-2028 (USD 천)
표 143 필리핀 해양 전기 집진기 시장, ESP 유형별, 2019-2028 (USD 천 달러)
표 144 싱가포르 전기 집진기 시장, 유형별, 2019-2028 (USD 천)
표 145 싱가포르 전기 집진기 시장, 제공 기준, 2019-2028 (USD 천)
표 146 싱가포르 전기 집진기 시장 하드웨어 및 소프트웨어, 유형별, 2019-2028 (USD 천 달러)
표 147 싱가포르 전기 집진기 시장, 용도별, 2019-2028 (USD 천 달러)
표 148 싱가포르 전기 집진기 시장, 최종 사용자별, 2019-2028 (USD 천 달러)
표 149 싱가포르 전기 집진기 시장, 유형별, 2019-2028 (USD 천)
표 150 싱가포르 전기 집진기 시장, ESP 유형별, 2019-2028 (USD 천 달러)
표 151 싱가포르 금속 가공 전기 집진기 시장, 유형별, 2019-2028 (USD 천)
표 152 싱가포르 금속 가공 전기 집진기 시장, ESP 유형별, 2019-2028 (USD 천 달러)
표 153 전기 집진기 시장에서 사용되는 싱가포르 시멘트, ESP 유형별, 2019-2028년(USD 천 달러)
표 154 싱가포르 화학 및 석유화학 전기집진기 시장, 유형별, 2019-2028 (USD 천)
표 155 싱가포르 화학 및 석유화학 전기집진기 시장, ESP 유형별, 2019-2028 (USD 천)
표 156 전기 집진기 시장, ESP 유형별 싱가포르 제조, 2019-2028 (USD 천)
표 157 싱가포르 해양 전기 집진기 시장, ESP 유형별, 2019-2028 (USD 천 달러)
표 158 아시아 태평양 전기 집진기 시장, 유형별, 2019-2028년(USD 천 달러)
그림 목록
그림 1 아시아 태평양 전기 집진기 시장 세분화
그림 2 아시아 태평양 전기 집진기 시장: 데이터 삼각 측량
그림 3 아시아 태평양 전기 집진기 시장: DROC 분석
그림 4 아시아 태평양 전기 집진기 시장: 지역별 대 국가별 시장 분석
그림 5 아시아 태평양 전기 집진기 시장: 회사 연구 분석
그림 6 아시아 태평양 전기 집진기 시장: 인터뷰 인구 통계
그림 7 아시아 태평양 전기 집진기 시장: DBMR 시장 위치 그리드
그림 8 아시아 태평양 전기 집진기 시장: 공급업체 점유율 분석
그림 9 아시아 태평양 전기 집진기 시장: 유형 범위 그리드
그림 10 아시아 태평양 전기 집진기 시장 세분화
그림 11 전 세계적으로 건설 활동이 증가함에 따라 아시아 태평양 전기 집진기 시장이 성장할 것으로 예상됩니다. 2021년부터 2028년까지의 예측 기간
그림 12 건식 ESP 부문은 2021년과 2028년에 아시아 태평양 전기 집진기 시장에서 가장 큰 점유율을 차지할 것으로 예상됩니다.
그림 13 아시아 태평양 전기 집진기 시장의 동인, 제약, 기회 및 과제
그림 14 다양한 산업의 에너지 관련 이산화탄소 배출량(백분율), 2020
그림 15 아시아 태평양 지역의 주요 석탄 발전 용량 기여자, 2018
그림 16 아시아 태평양 전기 집진기 시장, 유형별, 2020
그림 17 아시아 태평양 전기 집진기 시장, OFFERING 기준, 2020
그림 18 아시아 태평양 전기 집진기 시장, 응용 분야별, 2020
그림 19 아시아 태평양 전기 집진기 시장, 최종 사용자별, 2020
그림 20 아시아 태평양 전기 집진기 시장: 스냅샷(2020)
그림 21 아시아 태평양 전기 집진기 시장: 국가별(2020년)
그림 22 아시아 태평양 전기 집진기 시장: 국가별(2021년 및 2028년)
그림 23 아시아 태평양 전기 집진기 시장: 국가별(2020년 및 2028년)
그림 24 아시아 태평양 전기 집진기 시장: 유형별(2021-2028)
그림 25 아시아 태평양 전기 집진기 시장: 회사 점유율 2020(%)
연구 방법론
데이터 수집 및 기준 연도 분석은 대규모 샘플 크기의 데이터 수집 모듈을 사용하여 수행됩니다. 이 단계에는 다양한 소스와 전략을 통해 시장 정보 또는 관련 데이터를 얻는 것이 포함됩니다. 여기에는 과거에 수집한 모든 데이터를 미리 검토하고 계획하는 것이 포함됩니다. 또한 다양한 정보 소스에서 발견되는 정보 불일치를 검토하는 것도 포함됩니다. 시장 데이터는 시장 통계 및 일관된 모델을 사용하여 분석하고 추정합니다. 또한 시장 점유율 분석 및 주요 추세 분석은 시장 보고서의 주요 성공 요인입니다. 자세한 내용은 분석가에게 전화를 요청하거나 문의 사항을 드롭하세요.
DBMR 연구팀에서 사용하는 주요 연구 방법론은 데이터 마이닝, 시장에 대한 데이터 변수의 영향 분석 및 주요(산업 전문가) 검증을 포함하는 데이터 삼각 측량입니다. 데이터 모델에는 공급업체 포지셔닝 그리드, 시장 타임라인 분석, 시장 개요 및 가이드, 회사 포지셔닝 그리드, 특허 분석, 가격 분석, 회사 시장 점유율 분석, 측정 기준, 글로벌 대 지역 및 공급업체 점유율 분석이 포함됩니다. 연구 방법론에 대해 자세히 알아보려면 문의를 통해 업계 전문가에게 문의하세요.
사용자 정의 가능
Data Bridge Market Research는 고급 형성 연구 분야의 선두 주자입니다. 저희는 기존 및 신규 고객에게 목표에 맞는 데이터와 분석을 제공하는 데 자부심을 느낍니다. 보고서는 추가 국가에 대한 시장 이해(국가 목록 요청), 임상 시험 결과 데이터, 문헌 검토, 재생 시장 및 제품 기반 분석을 포함하도록 사용자 정의할 수 있습니다. 기술 기반 분석에서 시장 포트폴리오 전략에 이르기까지 타겟 경쟁업체의 시장 분석을 분석할 수 있습니다. 귀하가 원하는 형식과 데이터 스타일로 필요한 만큼 많은 경쟁자를 추가할 수 있습니다. 저희 분석가 팀은 또한 원시 엑셀 파일 피벗 테이블(팩트북)로 데이터를 제공하거나 보고서에서 사용 가능한 데이터 세트에서 프레젠테이션을 만드는 데 도움을 줄 수 있습니다.

