Europe Optical Power Meter Market, By Type (Thermal Detectors and Photo Detectors), Instrument/Product Type (Benchtop Meter, Portable Meter, Virtual Meters, Optical Wavelength, Hand-Held Meter, and Others), Detector Type (InGaAs (Indium Gallium Arsenide), Germanium, Silicon, and Others), Power Range (High, Medium, and Low), Wavelength (850NM TO 1650NM and 400NM to 1100NM), Light Source (Laser, and LED), Application (Installation & Maintenance, Testing, Manufacturing, Research & Development, and Others), End User (Telecommunication Industry, Electrical & Electronics Industry, Automotive Industry, Military & Aerospace Industry, Energy & Utilities Industry, and Others) – Industry Trends and Forecast to 2030.
Europe Optical Power Meter Market Analysis and Size
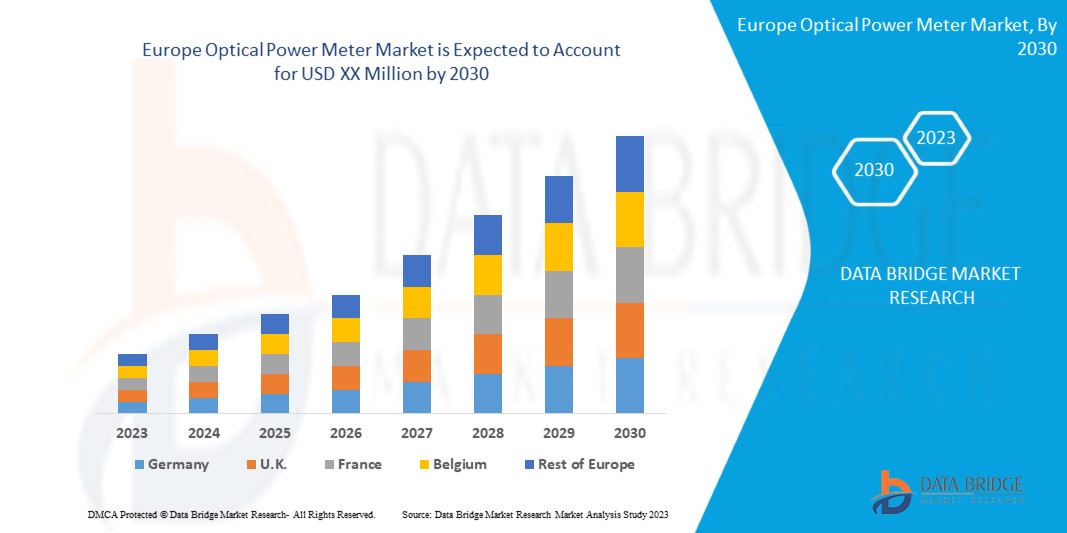
Europe Optical power meter market is expected to gain market growth in the forecast period of 2023 to 2030. Data Bridge Market Research analyses that the market is growing with a CAGR of 6.2%. Growing demand for research and development activities is acting as a major factor for the growth of the market.
This optical power meter market report provides details of market share, new developments, and product pipeline analysis, the impact of domestic and localized market players, analyses opportunities in terms of emerging revenue pockets, changes in market regulations, product approvals, strategic decisions, product launches, geographic expansions, and technological innovations in the market. To understand the analysis and the market scenario, contact us for an Analyst Brief, and our team will help you create a revenue impact solution to achieve your desired goal.
|
Report Metric |
Details |
|
Forecast Period |
2023 to 2030 |
|
Base Year |
2022 |
|
Historic Years |
2021 (Customizable to 2015-2020) |
|
Quantitative Units |
Revenue in Thousand, Volumes in Units, Pricing in USD |
|
Segments Covered |
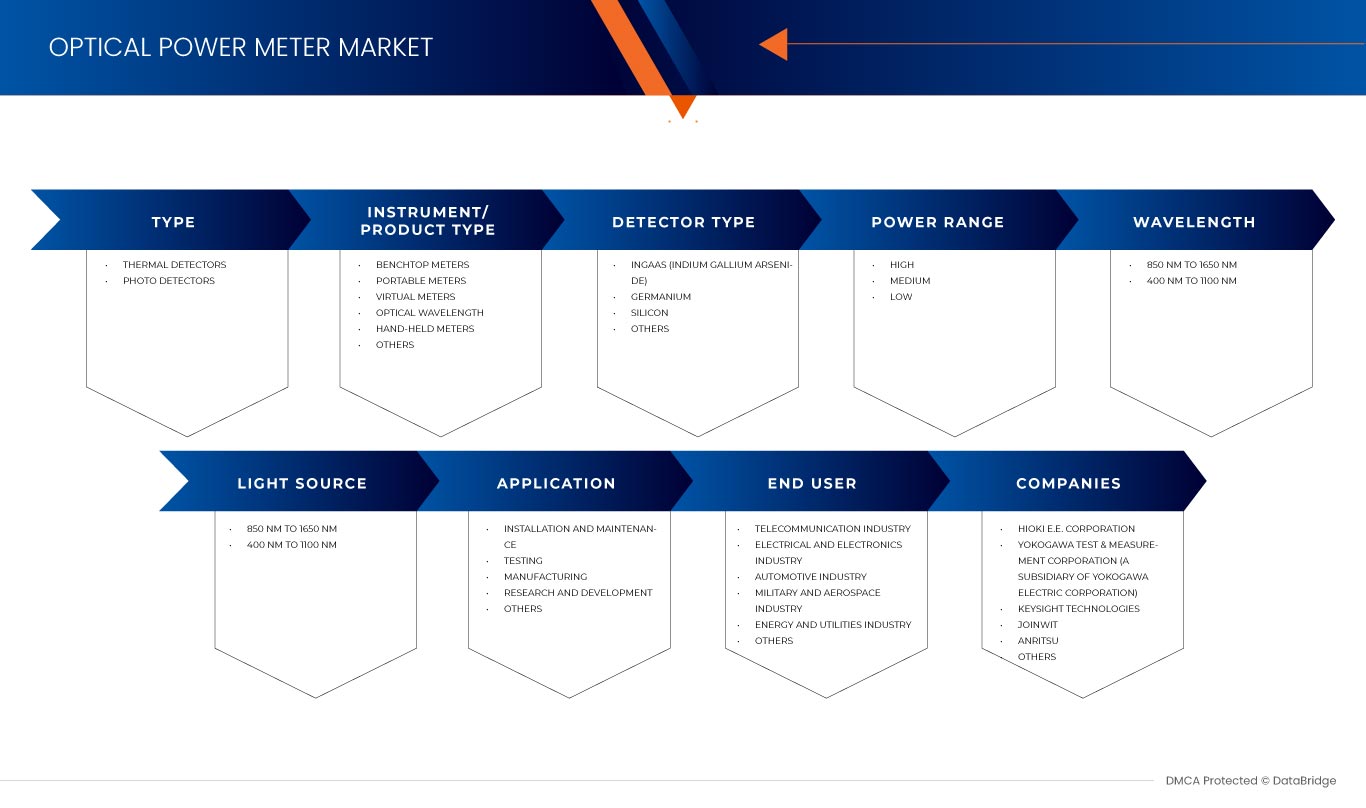
Type (Thermal Detectors and Photo Detectors), Instrument/Product Type (Benchtop Meter, Portable Meter, Virtual Meters, Optical Wavelength, Hand-Held Meter, and Others), Detector Type (InGaAs (Indium Gallium Arsenide), Germanium, Silicon, and Others), Power Range (High, Medium, and Low), Wavelength (850NM TO 1650NM and 400NM to 1100NM), Light Source (Laser, and LED), Application (Installation & Maintenance, Testing, Manufacturing, Research & Development, and Others), End User (Telecommunication Industry, Electrical & Electronics Industry, Automotive Industry, Military & Aerospace Industry, Energy & Utilities Industry, and Others) |
|
Countries Covered |
Germany, France, U.K., Italy, Spain, Switzerland, Netherlands, Russia, Turkey, Belgium, Poland, Finland, Norway, Sweden, Denmark, and Rest of Europe |
|
Market Players Covered |
Thorlabs (U.S.), Inc., Kingfisher International (Australia), GAO Tek & GAO Group Inc. (U.S.), VIAVI Solutions Inc. (U.S.), Fluke Corporation (U.S.), EXFO Inc.(Canada), AFL(U.S.), Newport Corporation (A Subsidiary of MKS Instruments) (U.S.), Stanlay (India), Keysight Technologies (U.S.), Anritsu (Japan), Tech Optics Ltd.(England), JOINWIT (China), Artifex Engineering GmbH & Co KG. (Germany), HIOKI E.E. CORPORATION (Japan), Edmund Optics Inc. (U.S.), BIOPTIC CO., LTD (South Korea), ComSonics (U.S.), ADC CORPORATION (Japan), Deviser Instruments (U.S.), Incorporated, PDR World (India), Jonard Tools (U.S.), OZ Optics Ltd. (Canada), APEX Technologies (France), Ophir Optronics Solutions Ltd (Israel), Santec Corporation (Japan) and Yokogawa Test & Measurement Corporation (Japan), among others |
Market Definition
An optical power meter is a device that measures electricity and power in an optical signal. Optical power meters were used to test the average amount of power in fiber optic networks and systems. A power meter is a combination and integration of a calibrated sensor, display and measuring amplifier and display, which measures and monitors the range of wavelengths and power levels. The calibrated sensor is integrated with a photodiode which is used to measure the wavelengths and power levels in the system. The sensors consist of silicon, germanium or InGaAs based semiconductor. Different sensor types used in optical power meters have different characteristics. A measuring amplifier is used to verify accuracy and to deliver data and information. The display unit provides the monitored and measured optical power reading and set wavelength. An optical power meter also helps to determine the power loss incurred by the optical signal while passing through the optical media.
Europe Optical Power Meter Market Dynamics
This section deals with understanding the market drivers, advantages, opportunities, restraints and challenges. All of this is discussed in detail as below:
Drivers
- INCREASING DEMAND FOR OPTICAL POWER METER
An optical power meter is a device that measures electricity and power in an optical signal. Optical power meters were used to test the average amount of power in fiber optic networks and systems. A power meter is a combination and integration of a calibrated sensor, display and measuring amplifier, which measures and monitors the range of wavelengths and power levels. An optical power meter also helps to determine the power loss incurred by the optical signal while passing through the optical media.
The Europe optical power meter market is expected to witness significant growth in the coming years due to the increasing demand for optical power meters. Optical power meters are widely used in the telecommunication industry, as they provide accurate measurements of the optical power of a fiber-optic cable or system.
- RISE IN REQUISITE OF TRANSMISSION QUALITY EVALUATION
The transmission network is an important factor in the communication network to provide better consumer services. For the evaluation and monitoring of the quality of the transmission network, there is no general standard. One of the main aims on which the telecommunication industry has a major focus is to transmit signals through the cables with the least disruption, maximum capacity, least noise, low energy consumption, and optimal transmission quality
Nowadays, different traffic-consumptive services such as ultra HD videos, 3D Televisions, online commerce, cloud computing and others increase the demand of internet consumers for IP traffic.
These access applications led to the use of fixed wireless network antennas, key security, mobile network base stations and monitoring & measuring structures, which then require higher information and data throughput. Consequently, the increase of the transport capacity of access networks becomes crucial for internet service providers.
The transmission wires are exposed to external conditions, and many factors can lead to miscalibration. So it is important to regularly evaluate the transmission quality, including the evaluation of power within the cables through optical power meters.
Opportunities
- RISING POWER GRID PROBLEMS
A power grid is, also referred to as an electrical grid, is an interconnected network structure for delivering electricity and power from producers to consumers for daily usage. The power grid consists of three stages are generation, transmission, and distribution.
Power plants convert mechanical energy into electrical energy by the use of a generator. Electrical transmission is carried out with the use of power lines. The distribution process connects substations from large industrial buildings to small homes to provide electricity for them.
Restraints/Challenges
- LACK OF TECHNICAL KNOWLEDGE
Increasing technological advances, innovations, and digitization of business processes make it difficult for workers, employees, and staff to match their skill sets with the needs of growing and technologically updated operations.
This creates a skill gap between the staff and the business. There is a shortage of skilled technical expertise with relevant qualifications and knowledge as technology upgrades day by day.
As computers get upgraded with smarter and innovative solutions, it becomes more capable of performing tasks that were earlier performed by humans, so the employees and staff will need to develop and upgrade their skill set that will provide them the advantage over computer machines such as critical thinking, innovations and creativity.
The optical power meters fall under semiconductors and require huge technical knowledge regarding units, conversions and others, which makes it difficult for normal staff to operate power meters.
Post COVID-19 Impact on Europe Optical Power Meter Market
COVID-19 has had a significant impact on the Europe economy, and the optical power meter market is no exception. With the pandemic causing disruptions in supply chains and production, the demand for optical power meters may have been affected.
However, the increasing use of optical power meters in the telecommunications industry, data centers, and other applications has kept the demand relatively stable. The need for reliable and high-speed communication networks has only increased during the pandemic due to the shift to remote work and online learning.
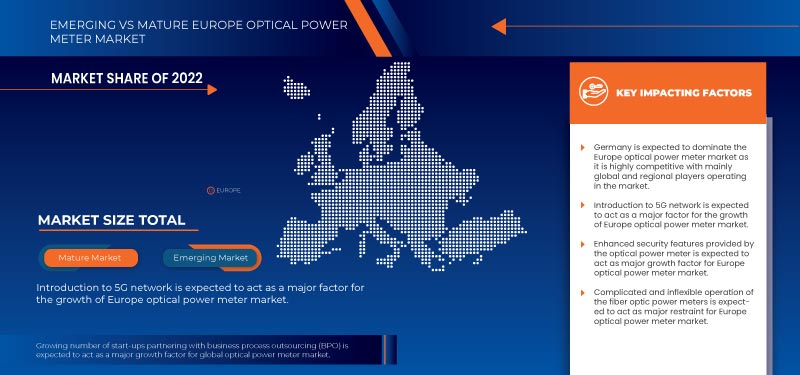
Additionally, with the increasing adoption of 5G technology and the expansion of fiber optic networks, the demand for optical power meters will likely continue to grow in the coming years.
Overall, while COVID-19 may have caused some disruptions in the optical power meter market, the increasing demand for high-speed and reliable communication networks is expected to drive growth in the long term
Recent Developments
- In September 2020, EXFO Inc. acquired InOpticals Inc., which offers ultra-high-speed test instruments for the laboratory and manufacturing markets. Under this acquisition, the company’s optical test offerings will be combined with InOpticals’ solutions. Through this, the company will be able to enhance its product portfolio, leverage InOpticals’ innovative test solutions and grow in the market.
- In May 2020, Kingfisher International expanded its capability to calibrate fiber optic power meters in the visible and UV-A spectrum. Through this, the company accurately calibrated semiconductor optical power meters from 350 to 1650 nm at 5 nm intervals. This has helped the company to better meet customer's need.
Europe Optical Power Meter Market Scope
Europe optical power meter market is segmented on the basis of component, type, instrument\product type, detector type, power range, wavelength, light source, application and end-user. The growth amongst these segments will help you analyze meagre growth segments in the industries and provide the users with a valuable market overview and market insights to help them make strategic decisions for identifying core market applications.
TYPE
- THERMAL DETECTORS
- PHOTO DETECTORS
On the basis of type, the Europe optical power meter market is segmented into thermal detectors and photo detectors.
INSTRUMENT/PRODUCT TYPE
- BENCHTOP METER
- PORTABLE METER
- VIRTUAL METERS
- OPTICAL WAVELENGTH
- HAND-HELD METER
- OTHERS
On the basis of instrument/product type, the Europe optical power meter market has been segmented into benchtop meter, portable meter, virtual meters, optical wavelength, hand-held meters and others.
DETECTOR TYPE
- INGAAS (INDIUM GALLIUM ARSENIDE)
- GERMANIUM
- SILICON
- OTHERS
On the basis of detector type, the Europe optical power meter market has been segmented into InGaAs (indium gallium arsenide), germanium, silicon, and others.
POWER RANGE
- HIGH
- MEDIUM
- LOW
On the basis of power range, the optical power meter market has been segmented into the high, medium, and low.
WAVELENGTH
- 850NM TO 1650NM
- 400NM TO 1100NM
On the basis of wavelength, the Europe optical power meter market has been segmented into 850NM to 1650NM and 400NM to 1100NM.
LIGHT SOURCE
- LASER
- LED
On the basis of the light source, the Europe optical power meter market has been segmented into laser and led.
APPLICATION
- INSTALLATION & MAINTENANCE
- TESTING
- MANUFACTURING
- RESEARCH & DEVELOPMENT
- OTHERS
On the basis of application, the Europe optical power meter market has been segmented into installation & maintenance, testing, manufacturing, research & development, and others.
END-USER
- TELECOMMUNICATION INDUSTRY
- ELECTRICAL & ELECTRONICS INDUSTRY
- AUTOMOTIVE INDUSTRY
- MILITARY & AEROSPACE INDUSTRY
- ENERGY & UTILITIES INDUSTRY
- OTHERS
On the basis of end-user, the Europe optical power meter market has been segmented into the telecommunication industry, electrical & electronics industry, automotive industry, military & aerospace industry, energy & utilities industry, and others.
Europe Optical Power Meter Market Regional Analysis/Insights
Europe optical power meter market is analysed, and market size information is provided by country, component, type, instrument\product type, detector type, power range, wavelength, light source, application and end-user.
The countries covered in Europe optical power meter market report are Germany, France, U.K., Italy, Spain, Switzerland, Netherlands, Russia, Turkey, Belgium, Poland, Finland, Norway, Sweden, Denmark, Rest of Europe.
Germany dominates the Europe optical power meter market owing to factors such as increasing fiber optic network coverage in various cities, surging focus of the telecom companies toward fiber optic investments, and favorable support from the government toward the implementation of fiber networks.
The country section of the report also provides individual market impacting factors and changes in market regulation that impact the current and future trends of the market. Data points like down-stream and upstream value chain analysis, technical trends and porter's five forces analysis, and case studies are some of the pointers used to forecast the market scenario for individual countries. Also, the presence and availability of Europe brands and the challenges faced due to large or scarce competition from local and domestic brands, the impact of domestic tariffs and trade routes are considered while providing forecast analysis of the country data.
Competitive Landscape and Europe Optical Power Meter Market Share Analysis
Europe optical power meter market competitive landscape provides details of competitors. Details included are company overview, company financials, revenue generated, market potential, investment in research and development, new market initiatives, Europe presence, production sites and facilities, production capacities, company strengths and weaknesses, product launch, product width and breadth, application dominance. The above data points provided are only related to the companies' focus related to Europe Optical power meter market.
Some of the major players operating in the Europe optical power meter market are Keysight Technologies, Anritsu, Newport Corporation (A Subsidiary of MKS Instruments), Yokogawa Test & Measurement Corporation, HIOKI E.E. CORPORATION, AFL, EXFO Inc., Fluke Corporation, APEX Technologies, PDR World, Thorlabs, Inc, VIAVI Solutions Inc., JOINWIT, ComSonics, BIOPTIC CO., LTD, OZ Optics Ltd, Santec Corporation, Jonard Tools., ADC CORPORATION, Ophir Optronics Solutions Ltd, Deviser Instruments, Incorporated, Edmund Optics, Kingfisher International, Artifex Engineering GmbH & Co KG., GAO Tek & GAO Group Inc., Tech Optics Ltd. and Stanlay.
SKU-
세계 최초의 시장 정보 클라우드 보고서에 온라인으로 접속하세요

- 대화형 데이터 분석 대시보드
- 높은 성장 잠재력 기회를 위한 회사 분석 대시보드
- 사용자 정의 및 질의를 위한 리서치 분석가 액세스
- 대화형 대시보드를 통한 경쟁자 분석
- 최신 뉴스, 업데이트 및 추세 분석
- 포괄적인 경쟁자 추적을 위한 벤치마크 분석의 힘 활용
목차
1 서론
1.1 연구 목적
1.2 시장 정의
1.3 유럽 광 파워 미터 시장 개요
1.4 통화 및 가격
1.5 제한 사항
1.6 대상 시장
2 시장 세분화
2.1 대상 시장
2.2 지리적 범위
연구에 2.3년이 고려됨
2.4 DBMR TRIPOD 데이터 검증 모델
2.5 주요 여론 리더와의 1차 인터뷰
2.6 DBMR 시장 위치 그리드
2.7 공급업체 점유율 분석
2.8 다변량 모델링
2.9 유형 타임라인 곡선
2.1 시장 적용 범위 그리드
2.11 2차 소스
2.12 가정
3 요약
4가지 프리미엄 인사이트
4.1 포터의 5가지 힘
4.2 규제 기준
4.3 기술 동향
4.4 특허 분석
4.5 가치 사슬 분석
4.6 회사 비교 분석
4.6.1 요코가와 전기 주식회사:
4.6.2 VIAVI SOLUTIONS INC.:
4.6.3 키사이트테크놀로지스 주식회사:
4.7 사례 연구
4.7.1 제어되지 않는 ONU에서 비정상적인 광파 방출로 인한 오류
4.7.2 커넥터의 광섬유 끝 표면의 치명적 손상
5 지역 요약
6 시장 개요
6.1 드라이버
6.1.1 광 파워 미터에 대한 수요 증가
6.1.2 전송 품질 평가 요건의 증가
6.1.3 실시간 분석에 대한 증가하는 요구
6.1.4 고대역폭 통신에 대한 수요 증가
6.1.5 광 파워 미터가 제공하는 고급 기능
6.2 제약
6.2.1 높은 제조 비용
6.2.2 광섬유 전력계의 복잡하고 유연성이 부족한 작동
6.2.3 OE 및 EO 변환 문제
6.3 기회
6.3.1 증가하는 전력망 문제
6.3.2 자동화 사용 증가
6.3.3 기술적 진보의 필요성
6.3.4 저감쇠 응용 분야에 대한 증가하는 요구 사항
6.3.5 5G 네트워크 소개
6.4 과제
6.4.1 기술 지식 부족
6.4.2 동적 범위 유지의 어려움
7 유럽 광 파워 미터 시장, 유형별
7.1 개요
7.2 사진 검출기
7.3 열 감지기
8 유럽 광 파워 미터 시장, 장비/제품 유형별
8.1 개요
8.2 핸드헬드 미터
8.2.1 멀티모드
8.2.2 단일 모드
8.3 휴대용 미터
8.4 벤치탑 미터
8.5 광파장
8.6 가상 미터
8.7 기타
9 유럽 광학 파워 미터 시장, 검출기 유형별
9.1 개요
9.2 게르마늄
9.3 실리콘
9.4 잉가스(인듐갈륨비소화물)
9.5 기타
10 유럽 광 파워 미터 시장, 파워 범위별
10.1 개요
10.2 중간
10.3 높음
10.4 낮음
11 유럽 광 파워 미터 시장, 파장별
11.1 개요
11.2 850NM에서 1650NM까지
11.3 400NM에서 1100NM까지
12 유럽 광 파워 미터 시장, 광원별
12.1 개요
12.2 레이저
12.3 LED
13 유럽 광 파워 미터 시장, 응용 분야별
13.1 개요
13.2 테스트
13.3 설치 및 유지 관리
13.4 제조
13.5 연구 및 개발
13.6 기타
14 유럽 광 파워 미터 시장, 최종 사용자별
14.1 개요
14.2 통신산업
14.2.1 광자 검출기
14.2.2 열 감지기
14.3 자동차 산업
14.3.1 광자 검출기
14.3.2 열 감지기
14.4 군사 및 항공우주 산업
14.4.1 광자 검출기
14.4.2 열 감지기
14.5 에너지 및 유틸리티 산업
14.5.1 광자 검출기
14.5.2 열 감지기
14.6 전기 및 전자 산업
14.6.1 광자 검출기
14.6.2 열 감지기
14.7 기타
15 유럽 광 파워 미터 시장, 지역별
15.1 유럽
15.1.1 독일
15.1.2 영국
15.1.3 프랑스
15.1.4 스페인
15.1.5 이탈리아
15.1.6 터키
15.1.7 러시아
15.1.8 벨기에
15.1.9 네덜란드
15.1.10 스위스
15.1.11 덴마크
15.1.12 스웨덴
15.1.13 노르웨이
15.1.14 핀란드
15.1.15 폴란드
15.1.16 유럽의 나머지 지역
16 유럽 광 파워 미터 시장, 회사 환경
16.1 회사 점유율 분석: 유럽
17 SWOT 분석
18 회사 프로파일링
18.1 키사이트 기술
18.1.1 회사 스냅샷
18.1.2 수익 분석
18.1.3 회사 점유율 분석
18.1.4 제품 포트폴리오
18.1.5 최근 개발 사항
18.2 안리츠
18.2.1 회사 스냅샷
18.2.2 수익 분석
18.2.3 회사 점유율 분석
18.2.4 제품 포트폴리오
18.2.5 최근 개발 사항
18.3 NEWPORT CORPORATION(MKS INSTRUMENTS의 자회사)
18.3.1 회사 스냅샷
18.3.2 수익 분석
18.3.3 회사 점유율 분석
18.3.4 제품 포트폴리오
18.3.5 최근 개발 사항
18.4 YOKOGAWA TEST & MEASUREMENT CORPORATION (YOKOGAWA ELECTRIC CORPORATION의 자회사)
18.4.1 회사 스냅샷
18.4.2 수익 분석
18.4.3 회사 점유율 분석
18.4.4 제품 포트폴리오
18.4.5 최근 개발 사항
18.5 히오키이이코퍼레이션
18.5.1 회사 스냅샷
18.5.2 수익 분석
18.5.3 회사 점유율 분석
18.5.4 제품 포트폴리오
18.5.5 최근 개발 사항
18.6 ADC 주식회사
18.6.1 회사 스냅샷
18.6.2 제품 포트폴리오
18.6.3 최근 개발
18.7 AFL (후지쿠라 주식회사의 자회사)
18.7.1 회사 스냅샷
18.7.2 수익 분석
18.7.3 제품 포트폴리오
18.7.4 최근 개발
18.8 APEX 기술
18.8.1 회사 스냅샷
18.8.2 제품 포트폴리오
18.8.3 최근 개발
18.9 아티펙스 엔지니어링 유한회사.
18.9.1 회사 스냅샷
18.9.2 제품 포트폴리오
18.9.3 최근 개발 사항
18.1 바이오옵틱 주식회사
18.10.1 회사 스냅샷
18.10.2 제품 포트폴리오
18.10.3 최근 개발
18.11 콤소닉스
18.11.1 회사 스냅샷
18.11.2 제품 포트폴리오
18.11.3 최근 개발 사항
18.12 고안자 도구
18.12.1 회사 스냅샷
18.12.2 제품 포트폴리오
18.12.3 최근 개발 사항
18.13 에드먼드 옵틱스 주식회사
18.13.1 회사 스냅샷
18.13.2 제품 포트폴리오
18.13.3 최근 개발 사항
18.14 엑스포 주식회사
18.14.1 회사 스냅샷
18.14.2 제품 포트폴리오
18.14.3 최근 개발 사항
18.15 플루크 코퍼레이션
18.15.1 회사 스냅샷
18.15.2 제품 포트폴리오
18.15.3 최근 개발 사항
18.16 GAO TEK & GAO 그룹 INC.
18.16.1 회사 스냅샷
18.16.2 제품 포트폴리오
18.16.3 최근 개발
18.17 조인윗
18.17.1 회사 스냅샷
18.17.2 제품 포트폴리오
18.17.3 최근 개발 사항
18.18 조나드 툴스
18.18.1 회사 스냅샷
18.18.2 제품 포트폴리오
18.18.3 최근 개발 사항
18.19 킹피셔 인터내셔널
18.19.1 회사 스냅샷
18.19.2 제품 포트폴리오
18.19.3 최근 개발 사항
18.2 오피르 옵트로닉스 솔루션 유한회사
18.20.1 회사 스냅샷
18.20.2 제품 포트폴리오
18.20.3 최근 개발
18.21 오즈 옵틱스 유한회사
18.21.1 회사 스냅샷
18.21.2 제품 포트폴리오
18.21.3 최근 개발 사항
18.22 PDR 세계
18.22.1 회사 스냅샷
18.22.2 제품 포트폴리오
18.22.3 최근 개발 사항
18.23 산텍 주식회사
18.23.1 회사 스냅샷
18.23.2 수익 분석
18.23.3 제품 포트폴리오
18.23.4 최근 개발 사항
18.24 스탠레이
18.24.1 회사 스냅샷
18.24.2 제품 포트폴리오
18.24.3 최근 개발
18.25 기술 광학 유한회사
18.25.1 회사 스냅샷
18.25.2 제품 포트폴리오
18.25.3 최근 개발
18.26 THORLABS 주식회사
18.26.1 회사 스냅샷
18.26.2 제품 포트폴리오
18.26.3 최근 개발 사항
18.27 VIAVI 솔루션 주식회사
18.27.1 회사 스냅샷
18.27.2 수익 분석
18.27.3 제품 포트폴리오
18.27.4 최근 개발 사항
19 설문지
20 관련 보고서
표 목록
표 1 유럽 광 파워 미터 시장, 유형별, 2021-2030 (USD 천)
표 2 유럽 광 검출기 시장, 지역별 광 파워 미터 시장, 2021-2030 (USD 천)
표 3 유럽 열 감지기 광학 파워 미터 시장, 지역별, 2021-2030 (USD 천)
표 4 유럽 광 파워 미터 시장, 계측기/제품 유형별, 2021-2030년(USD 천 달러)
표 5 유럽 핸드헬드 미터, 지역별 광 파워 미터 시장, 2021-2030 (USD 천)
표 6 유럽 핸드헬드 미터, 광 파워 미터 시장, 유형별, 2021-2030 (USD 천)
표 7 유럽 휴대용 미터 광 파워 미터 시장, 지역별, 2021-2030 (USD 천)
표 8 유럽 벤치탑 미터, 지역별 광 파워 미터 시장, 2021-2030 (USD 천)
표 9 유럽 광파워 미터 시장에서 지역별 광파장, 2021-2030 (USD 천)
표 10 유럽 가상 미터, 지역별 광 파워 미터 시장, 2021-2030 (USD 천)
표 11 유럽 기타 지역별 광 파워 미터 시장, 2021-2030 (USD 천)
표 12 검출기 유형별 유럽 광학 파워 미터 시장, 2021-2030년(USD 천 달러)
표 13 지역별 광 파워 미터 시장에서의 유럽 게르마늄, 2021-2030 (USD 천)
표 14 유럽 실리콘 광 파워 미터 시장, 지역별, 2021-2030 (USD 천)
표 15 유럽 INGAAS(인듐 갈륨 비소화물) 광 파워 미터 시장, 지역별, 2021-2030(USD 천)
표 16 유럽 기타 지역별 광 파워 미터 시장, 2021-2030 (USD 천)
표 17 유럽 광 파워 미터 시장, 파워 범위별, 2021-2030 (USD 천)
표 18 지역별 광 파워 미터 시장에서 유럽 중간 규모, 2021-2030년(USD 천 달러)
표 19 유럽, 지역별 광 파워 미터 시장이 가장 높음, 2021-2030년(USD 천 달러)
표 20 유럽 지역별 광 파워 미터 시장 저조, 2021-2030 (USD 천)
표 21 유럽 광 파워 미터 시장, 파장별, 2021-2030 (USD 천)
표 22 유럽 850NM~1650NM 광 파워 미터 시장, 지역별, 2021~2030년(USD 천 달러)
표 23 유럽 400NM~1100NM 광 파워 미터 시장, 지역별, 2021~2030년(USD 천 달러)
표 24 유럽 광 파워 미터 시장, 광원별, 2021-2030년(USD 천)
표 25 유럽 레이저 광 파워 미터 시장, 지역별, 2021-2030 (USD 천)
표 26 유럽 LED 광 파워 미터 시장, 지역별, 2021-2030 (USD 천)
표 27 유럽 광 파워 미터 시장, 응용 분야별, 2021-2030 (USD 천)
표 28 지역별 유럽 광 파워 미터 시장 테스트, 2021-2030 (USD 천)
표 29 유럽 광 파워 미터 시장의 설치 및 유지 관리, 지역별, 2021-2030 (USD 천)
표 30 유럽 광 파워 미터 시장 제조, 지역별, 2021-2030 (USD 천)
표 31 지역별 유럽 광 파워 미터 시장의 연구 및 개발, 2021-2030 (USD 천)
표 32 유럽 기타 지역별 광 파워 미터 시장, 2021-2030 (USD 천 달러)
표 33 최종 사용자별 유럽 광 파워 미터 시장 2021-2030 (USD 천)
표 34 지역별 광 파워 미터 시장에서의 유럽 통신 산업, 2021-2030 (USD 천)
표 35 유럽 통신 산업의 광 파워 미터 시장, 유형별, 2021-2030 (USD 천)
표 36 지역별 광학 파워 미터 시장에서 유럽 자동차 산업, 2021-2030 (USD 천)
표 37 유럽 자동차 산업의 광학 파워 미터 시장, 유형별, 2021-2030 (USD 천)
표 38 유럽 군사 및 항공우주 산업의 광 파워 미터 시장, 지역별, 2021-2030 (USD 천)
표 39 유럽 군사 및 항공우주 산업의 광 파워 미터 시장, 유형별, 2021-2030(USD 천)
표 40 유럽 에너지 및 유틸리티 산업의 광 파워 미터 시장, 지역별, 2021-2030 (USD 천)
표 41 유럽 에너지 및 유틸리티 산업의 광 파워 미터 시장, 유형별, 2021-2030 (USD 천)
표 42 유럽 전기 및 전자 산업의 광 파워 미터 시장, 지역별, 2021-2030 (USD 천)
표 43 유럽 전기 및 전자 산업의 광 파워 미터 시장, 유형별, 2021-2030 (USD 천)
표 44 유럽 기타 지역별 광 파워 미터 시장, 2021-2030 (USD 천)
표 45 유럽 광 파워 미터 시장, 국가별, 2021-2030 (USD 천)
표 46 유럽 광 파워 미터 시장, 유형별, 2021-2030 (USD 천)
표 47 유럽 광 파워 미터 시장, 계측기/제품 유형별, 2021-2030년(USD 천 달러)
표 48 유럽 핸드헬드 미터, 광 파워 미터 시장, 유형별, 2021-2030 (USD 천)
표 49 검출기 유형별 유럽 광학 파워 미터 시장, 2021-2030년(USD 천 달러)
표 50 유럽 광 파워 미터 시장, 파워 범위별, 2021-2030 (USD 천)
표 51 유럽 광 파워 미터 시장, 파장별, 2021-2030 (USD 천)
표 52 유럽 광 파워 미터 시장, 광원별, 2021-2030년(USD 천)
표 53 유럽 광 파워 미터 시장, 응용 분야별, 2021-2030 (USD 천)
표 54 최종 사용자별 유럽 광 파워 미터 시장 2021-2030 (USD 천)
표 55 유럽 통신 산업의 광 파워 미터 시장, 유형별, 2021-2030 (USD 천)
표 56 유럽 자동차 산업의 광학 파워 미터 시장, 유형별, 2021-2030 (USD 천)
표 57 유럽 군사 및 항공우주 산업의 광 파워 미터 시장, 유형별, 2021-2030(USD 천 달러)
표 58 유럽 에너지 및 유틸리티 산업의 광 파워 미터 시장, 유형별, 2021-2030 (USD 천)
표 59 유럽 전기 및 전자 산업의 광 파워 미터 시장, 유형별, 2021-2030 (USD 천)
표 60 독일 광 파워 미터 시장, 유형별, 2021-2030 (USD 천)
표 61 독일 광 파워 미터 시장, 계측기/제품 유형별, 2021-2030년(USD 천 달러)
표 62 독일 핸드헬드 미터 광 파워 미터 시장, 유형별, 2021-2030 (USD 천)
표 63 독일 광학 파워 미터 시장, 검출기 유형별, 2021-2030 (USD 천)
표 64 독일 광 파워 미터 시장, 파워 범위별, 2021-2030 (USD 천)
표 65 독일 광 파워 미터 시장, 파장별, 2021-2030 (USD 천)
표 66 독일 광 파워 미터 시장, 광원별, 2021-2030 (USD 천)
표 67 독일 광 파워 미터 시장, 응용 분야별, 2021-2030 (USD 천)
표 68 독일 광 파워 미터 시장, 최종 사용자별 2021-2030 (USD 천)
표 69 독일 통신 산업의 광 파워 미터 시장, 유형별, 2021-2030 (USD 천)
표 70 독일 자동차 산업의 광학 파워 미터 시장, 유형별, 2021-2030 (USD 천)
표 71 독일 군사 및 항공우주 산업의 광 파워 미터 시장, 유형별, 2021-2030 (USD 천)
표 72 독일 에너지 및 유틸리티 산업의 광 파워 미터 시장, 유형별, 2021-2030 (USD 천)
표 73 독일 전기 및 전자 산업의 광 파워 미터 시장, 유형별, 2021-2030 (USD 천)
표 74 영국 광 파워 미터 시장, 유형별, 2021-2030 (USD 천)
표 75 영국 광 파워 미터 시장, 계측기/제품 유형별, 2021-2030년(USD 천 달러)
표 76 영국 핸드헬드 미터, 광 파워 미터 시장, 유형별, 2021-2030 (USD 천)
표 77 영국 광학 파워 미터 시장, 검출기 유형별, 2021-2030년(USD 천 달러)
표 78 영국 광 파워 미터 시장, 파워 범위별, 2021-2030(USD 천)
표 79 영국 광 파워 미터 시장, 파장별, 2021-2030 (USD 천)
표 80 영국 광 파워 미터 시장, 광원별, 2021-2030년(USD 천)
표 81 영국 광 파워 미터 시장, 응용 분야별, 2021-2030 (USD 천)
표 82 최종 사용자별 영국 광 파워 미터 시장 2021-2030 (USD 천 달러)
표 83 영국 통신 산업의 광 파워 미터 시장, 유형별, 2021-2030 (USD 천)
표 84 영국 자동차 산업의 광학 파워 미터 시장, 유형별, 2021-2030 (USD 천)
표 85 영국 군사 및 항공우주 산업의 광 파워 미터 시장, 유형별, 2021-2030(USD 천)
표 86 영국 에너지 및 유틸리티 산업의 광 파워 미터 시장, 유형별, 2021-2030(USD 천)
표 87 영국 전기 및 전자 산업의 광 파워 미터 시장, 유형별, 2021-2030 (USD 천)
표 88 프랑스 광 파워 미터 시장, 유형별, 2021-2030 (USD 천)
표 89 프랑스 광 파워 미터 시장, 계측기/제품 유형별, 2021-2030년(USD 천 달러)
표 90 프랑스 핸드헬드 미터 광 파워 미터 시장, 유형별, 2021-2030 (USD 천)
표 91 프랑스 광학 파워 미터 시장, 검출기 유형별, 2021-2030 (USD 천)
표 92 프랑스 광 파워 미터 시장, 파워 범위별, 2021-2030 (USD 천)
표 93 파장별 프랑스 광 파워 미터 시장, 2021-2030년(USD 천)
표 94 프랑스 광 파워 미터 시장, 광원별, 2021-2030 (USD 천)
표 95 프랑스 광 파워 미터 시장, 응용 분야별, 2021-2030 (USD 천)
표 96 최종 사용자별 프랑스 광 파워 미터 시장 2021-2030 (USD 천)
표 97 프랑스 통신 산업의 광 파워 미터 시장, 유형별, 2021-2030 (USD 천)
표 98 프랑스 자동차 산업의 광학 파워 미터 시장, 유형별, 2021-2030 (USD 천)
표 99 프랑스 군사 및 항공우주 산업의 광 파워 미터 시장, 유형별, 2021-2030(USD 천)
표 100 프랑스 에너지 및 유틸리티 산업의 광 파워 미터 시장, 유형별, 2021-2030 (USD 천)
표 101 프랑스 전기 및 전자 산업의 광 파워 미터 시장, 유형별, 2021-2030 (USD 천)
표 102 스페인 광 파워 미터 시장, 유형별, 2021-2030 (USD 천)
표 103 스페인 광 파워 미터 시장, 계측기/제품 유형별, 2021-2030년(USD 천 달러)
표 104 스페인 핸드헬드 미터, 광 파워 미터 시장, 유형별, 2021-2030 (USD 천)
표 105 스페인 광학 파워 미터 시장, 검출기 유형별, 2021-2030 (USD 천)
표 106 스페인 광 파워 미터 시장, 파워 범위별, 2021-2030 (USD 천)
표 107 스페인 광 파워 미터 시장, 파장별, 2021-2030 (USD 천)
표 108 스페인 광 파워 미터 시장, 광원별, 2021-2030 (USD 천)
표 109 스페인 광 파워 미터 시장, 응용 분야별, 2021-2030 (USD 천)
표 110 스페인 광 파워 미터 시장, 최종 사용자별 2021-2030 (USD 천)
표 111 스페인 통신 산업의 광 파워 미터 시장, 유형별, 2021-2030 (USD 천)
표 112 스페인 자동차 산업의 광학 파워 미터 시장, 유형별, 2021-2030 (USD 천)
표 113 스페인 군사 및 항공우주 산업의 광 파워 미터 시장, 유형별, 2021-2030(USD 천)
표 114 스페인 에너지 및 유틸리티 산업의 광 파워 미터 시장, 유형별, 2021-2030 (USD 천)
표 115 스페인 전기 및 전자 산업의 광 파워 미터 시장, 유형별, 2021-2030 (USD 천)
표 116 이탈리아 광 파워 미터 시장, 유형별, 2021-2030 (USD 천)
표 117 이탈리아 광 파워 미터 시장, 계측기/제품 유형별, 2021-2030년(USD 천 달러)
표 118 이탈리아 핸드헬드 미터, 광학 파워 미터 시장, 유형별, 2021-2030 (USD 천)
표 119 이탈리아 광학 파워 미터 시장, 검출기 유형별, 2021-2030 (USD 천)
표 120 이탈리아 광 파워 미터 시장, 파워 범위별, 2021-2030 (USD 천)
표 121 이탈리아 광 파워 미터 시장, 파장별, 2021-2030 (USD 천)
표 122 이탈리아 광 파워 미터 시장, 광원별, 2021-2030 (USD 천)
표 123 이탈리아 광 파워 미터 시장, 응용 분야별, 2021-2030 (USD 천)
표 124 이탈리아 광 파워 미터 시장, 최종 사용자별 2021-2030 (USD 천)
표 125 이탈리아 통신 산업의 광 파워 미터 시장, 유형별, 2021-2030 (USD 천)
표 126 이탈리아 자동차 산업의 광학 파워 미터 시장, 유형별, 2021-2030 (USD 천)
표 127 이탈리아 군사 및 항공우주 산업의 광 파워 미터 시장, 유형별, 2021-2030(USD 천)
표 128 이탈리아 에너지 및 유틸리티 산업의 광 파워 미터 시장, 유형별, 2021-2030(USD 천)
표 129 이탈리아 전기 및 전자 산업의 광 파워 미터 시장, 유형별, 2021-2030 (USD 천)
표 130 터키 광 파워 미터 시장, 유형별, 2021-2030 (USD 천)
표 131 터키 광 파워 미터 시장, 계측기/제품 유형별, 2021-2030년(USD 천 달러)
표 132 터키 핸드헬드 미터, 광 파워 미터 시장, 유형별, 2021-2030 (USD 천)
표 133 터키 광학 파워 미터 시장, 검출기 유형별, 2021-2030 (USD 천)
표 134 터키 광 파워 미터 시장, 파워 범위별, 2021-2030 (USD 천)
표 135 파장별 터키 광 파워 미터 시장, 2021-2030년(USD 천 달러)
표 136 터키 광 파워 미터 시장, 광원별, 2021-2030 (USD 천)
표 137 터키 광 파워 미터 시장, 응용 분야별, 2021-2030 (USD 천)
표 138 터키 광 파워 미터 시장, 최종 사용자별 2021-2030 (USD 천)
표 139 터키 통신 산업의 광 파워 미터 시장 유형별, 2021-2030 (USD 천)
표 140 터키 자동차 산업의 광학 파워 미터 시장, 유형별, 2021-2030 (USD 천)
표 141 터키 군사 및 항공우주 산업의 광 파워 미터 시장, 유형별, 2021-2030(USD 천)
표 142 터키 에너지 및 유틸리티 산업의 광 파워 미터 시장, 유형별, 2021-2030(USD 천)
표 143 터키 전기 및 전자 산업의 광 파워 미터 시장, 유형별, 2021-2030 (USD 천)
표 144 러시아 광 파워 미터 시장, 유형별, 2021-2030 (USD 천)
표 145 러시아 광 파워 미터 시장, 계측기/제품 유형별, 2021-2030년(USD 천 달러)
표 146 러시아 핸드헬드 미터, 광 파워 미터 시장, 유형별, 2021-2030 (USD 천)
표 147 러시아 광학 파워 미터 시장, 검출기 유형별, 2021-2030 (USD 천)
표 148 러시아 광 파워 미터 시장, 파워 범위별, 2021-2030 (USD 천)
표 149 러시아 광 파워 미터 시장, 파장별, 2021-2030 (USD 천)
표 150 러시아 광 파워 미터 시장, 광원별, 2021-2030 (USD 천)
표 151 러시아 광 파워 미터 시장, 응용 분야별, 2021-2030 (USD 천)
표 152 러시아 광 파워 미터 시장, 최종 사용자별 2021-2030 (USD 천)
표 153 러시아 통신 산업의 광 파워 미터 시장 유형별, 2021-2030 (USD 천)
표 154 러시아 자동차 산업의 광학 파워 미터 시장, 유형별, 2021-2030 (USD 천)
표 155 러시아 군사 및 항공우주 산업의 광 파워 미터 시장, 유형별, 2021-2030(USD 천)
표 156 러시아 에너지 및 유틸리티 산업의 광 파워 미터 시장, 유형별, 2021-2030 (USD 천)
표 157 러시아 전기 및 전자 산업의 광 파워 미터 시장, 유형별, 2021-2030 (USD 천)
표 158 벨기에 광 파워 미터 시장, 유형별, 2021-2030 (USD 천)
표 159 벨기에 광 파워 미터 시장, 계측기/제품 유형별, 2021-2030년(USD 천 달러)
표 160 벨기에 핸드헬드 미터, 광 파워 미터 시장, 유형별, 2021-2030 (USD 천)
표 161 벨기에 광학 파워 미터 시장, 검출기 유형별, 2021-2030 (USD 천)
표 162 벨기에 광 파워 미터 시장, 파워 범위별, 2021-2030 (USD 천)
표 163 벨기에 광 파워 미터 시장, 파장별, 2021-2030 (USD 천)
표 164 벨기에 광 파워 미터 시장, 광원별, 2021-2030 (USD 천)
표 165 벨기에 광 파워 미터 시장, 응용 분야별, 2021-2030 (USD 천)
표 166 벨기에 광 파워 미터 시장, 최종 사용자별 2021-2030 (USD 천)
표 167 벨기에 통신 산업의 광 파워 미터 시장 유형별, 2021-2030 (USD 천)
표 168 벨기에 자동차 산업의 광학 파워 미터 시장, 유형별, 2021-2030 (USD 천)
표 169 벨기에 군사 및 항공우주 산업의 광 파워 미터 시장, 유형별, 2021-2030 (USD 천)
표 170 벨기에 에너지 및 유틸리티 산업의 광 파워 미터 시장, 유형별, 2021-2030 (USD 천)
표 171 벨기에 전기 및 전자 산업의 광 파워 미터 시장, 유형별, 2021-2030 (USD 천)
표 172 네덜란드 광 파워 미터 시장, 유형별, 2021-2030 (USD 천)
표 173 네덜란드 광 파워 미터 시장, 계측기/제품 유형별, 2021-2030년(USD 천 달러)
표 174 네덜란드 핸드헬드 미터, 광 파워 미터 시장, 유형별, 2021-2030 (USD 천)
표 175 네덜란드 광학 파워 미터 시장, 검출기 유형별, 2021-2030 (USD 천)
표 176 네덜란드 광 파워 미터 시장, 파워 범위별, 2021-2030 (USD 천)
표 177 네덜란드 광 파워 미터 시장, 파장별, 2021-2030 (USD 천)
표 178 네덜란드 광 파워 미터 시장, 광원별, 2021-2030 (USD 천)
표 179 네덜란드 광 파워 미터 시장, 응용 분야별, 2021-2030 (USD 천)
표 180 네덜란드 광 파워 미터 시장, 최종 사용자별 2021-2030 (USD 천)
표 181 네덜란드 통신 산업의 광 파워 미터 시장 유형별, 2021-2030 (USD 천)
표 182 네덜란드 자동차 산업의 광학 파워 미터 시장, 유형별, 2021-2030 (USD 천)
표 183 네덜란드 군사 및 항공우주 산업의 광 파워 미터 시장, 유형별, 2021-2030(USD 천)
표 184 네덜란드 에너지 및 유틸리티 산업의 광 파워 미터 시장, 유형별, 2021-2030 (USD 천)
표 185 네덜란드 전기 및 전자 산업의 광 파워 미터 시장, 유형별, 2021-2030 (USD 천)
표 186 스위스 광 파워 미터 시장, 유형별, 2021-2030 (USD 천)
표 187 스위스 광 파워 미터 시장, 계측기/제품 유형별, 2021-2030년(USD 천 달러)
표 188 스위스 핸드헬드 미터, 광 파워 미터 시장, 유형별, 2021-2030 (USD 천)
표 189 스위스 광학 파워 미터 시장, 검출기 유형별, 2021-2030 (USD 천)
표 190 스위스 광 파워 미터 시장, 파워 범위별, 2021-2030 (USD 천)
표 191 스위스 광 파워 미터 시장, 파장별, 2021-2030 (USD 천)
표 192 스위스 광 파워 미터 시장, 광원별, 2021-2030 (USD 천)
표 193 스위스 광 파워 미터 시장, 응용 분야별, 2021-2030 (USD 천)
표 194 스위스 광 파워 미터 시장, 최종 사용자별 2021-2030 (USD 천)
표 195 스위스 통신 산업의 광 파워 미터 시장 유형별, 2021-2030 (USD 천)
표 196 스위스 자동차 산업의 광 파워 미터 시장, 유형별, 2021-2030 (USD 천)
표 197 스위스 군사 및 항공우주 산업의 광 파워 미터 시장, 유형별, 2021-2030 (USD 천)
표 198 스위스 에너지 및 유틸리티 산업의 광 파워 미터 시장, 유형별, 2021-2030 (USD 천)
표 199 스위스 전기 및 전자 산업의 광 파워 미터 시장, 유형별, 2021-2030 (USD 천)
표 200 덴마크 광 파워 미터 시장, 유형별, 2021-2030 (USD 천)
표 201 덴마크 광 파워 미터 시장, 계측기/제품 유형별, 2021-2030년(USD 천 달러)
표 202 덴마크 핸드헬드 미터 광 파워 미터 시장, 유형별, 2021-2030 (USD 천)
표 203 덴마크 광학 파워 미터 시장, 검출기 유형별, 2021-2030 (USD 천)
표 204 덴마크 광 파워 미터 시장, 파워 범위별, 2021-2030 (USD 천)
표 205 덴마크 광 파워 미터 시장, 파장별, 2021-2030 (USD 천)
표 206 덴마크 광 파워 미터 시장, 광원별, 2021-2030 (USD 천)
표 207 덴마크 광 파워 미터 시장, 응용 분야별, 2021-2030 (USD 천)
표 208 덴마크 광 파워 미터 시장, 최종 사용자별 2021-2030 (USD 천)
표 209 덴마크 통신 산업의 광 파워 미터 시장, 유형별, 2021-2030 (USD 천)
표 210 덴마크 자동차 산업의 광 파워 미터 시장, 유형별, 2021-2030 (USD 천)
표 211 덴마크 군사 및 항공우주 산업의 광 파워 미터 시장, 유형별, 2021-2030 (USD 천)
표 212 덴마크 에너지 및 유틸리티 산업의 광 파워 미터 시장, 유형별, 2021-2030 (USD 천)
표 213 덴마크 전기 및 전자 산업의 광 파워 미터 시장, 유형별, 2021-2030 (USD 천)
표 214 스웨덴 광 파워 미터 시장, 유형별, 2021-2030 (USD 천)
표 215 스웨덴 광 파워 미터 시장, 계측기/제품 유형별, 2021-2030년(USD 천 달러)
표 216 스웨덴 핸드헬드 미터, 광 파워 미터 시장, 유형별, 2021-2030 (USD 천)
표 217 스웨덴 광학 파워 미터 시장, 검출기 유형별, 2021-2030 (USD 천)
표 218 스웨덴 광 파워 미터 시장, 파워 범위별, 2021-2030 (USD 천)
표 219 스웨덴 광 파워 미터 시장, 파장별, 2021-2030 (USD 천)
표 220 스웨덴 광 파워 미터 시장, 광원별, 2021-2030 (USD 천)
표 221 스웨덴 광 파워 미터 시장, 응용 분야별, 2021-2030 (USD 천)
표 222 스웨덴 광 파워 미터 시장, 최종 사용자별 2021-2030 (USD 천)
표 223 스웨덴 통신 산업의 광 파워 미터 시장 유형별, 2021-2030 (USD 천)
표 224 스웨덴 자동차 산업의 광학 파워 미터 시장, 유형별, 2021-2030 (USD 천)
표 225 스웨덴 군사 및 항공우주 산업의 광 파워 미터 시장, 유형별, 2021-2030(USD 천)
표 226 스웨덴 에너지 및 유틸리티 산업의 광 파워 미터 시장, 유형별, 2021-2030 (USD 천)
표 227 스웨덴 전기 및 전자 산업의 광 파워 미터 시장, 유형별, 2021-2030 (USD 천)
표 228 노르웨이 광 파워 미터 시장, 유형별, 2021-2030 (USD 천)
표 229 노르웨이 광 파워 미터 시장, 계측기/제품 유형별, 2021-2030년(USD 천 달러)
표 230 노르웨이 핸드헬드 미터, 광 파워 미터 시장, 유형별, 2021-2030 (USD 천)
표 231 검출기 유형별 노르웨이 광학 파워 미터 시장, 2021-2030년(USD 천 달러)
표 232 전력 범위별 노르웨이 광 파워 미터 시장, 2021-2030년(USD 천 달러)
표 233 파장별 노르웨이 광 파워 미터 시장, 2021-2030년(USD 천)
표 234 광원별 노르웨이 광 파워 미터 시장, 2021-2030년(USD 천)
표 235 노르웨이 광 파워 미터 시장, 응용 분야별, 2021-2030 (USD 천)
표 236 최종 사용자별 노르웨이 광 파워 미터 시장 2021-2030 (USD 천 달러)
표 237 2021-2030년 유형별 광 파워 미터 시장에서의 노르웨이 통신 산업(USD 천)
표 238 노르웨이 자동차 산업의 광 파워 미터 시장, 유형별, 2021-2030 (USD 천)
표 239 노르웨이 군사 및 항공우주 산업의 광 파워 미터 시장, 유형별, 2021-2030(USD 천)
표 240 노르웨이 에너지 및 유틸리티 산업의 광 파워 미터 시장, 유형별, 2021-2030 (USD 천)
표 241 노르웨이 전기 및 전자 산업의 광 파워 미터 시장, 유형별, 2021-2030 (USD 천)
표 242 핀란드 광 파워 미터 시장, 유형별, 2021-2030 (USD 천)
표 243 핀란드 광 파워 미터 시장, 계측기/제품 유형별, 2021-2030년(USD 천 달러)
표 244 핀란드 광학 파워 미터 시장에서의 핸드헬드 미터, 유형별, 2021-2030 (USD 천)
표 245 핀란드 광학 파워 미터 시장, 검출기 유형별, 2021-2030 (USD 천)
표 246 핀란드 광 파워 미터 시장, 파워 범위별, 2021-2030 (USD 천)
표 247 파장별 핀란드 광 파워 미터 시장, 2021-2030년(USD 천)
표 248 핀란드 광 파워 미터 시장, 광원별, 2021-2030 (USD 천)
표 249 핀란드 광 파워 미터 시장, 응용 분야별, 2021-2030 (USD 천)
표 250 최종 사용자별 핀란드 광 파워 미터 시장 2021-2030 (USD 천 달러)
표 251 핀란드 통신 산업의 광 파워 미터 시장 유형별, 2021-2030 (USD 천)
표 252 핀란드 자동차 산업의 광학 파워 미터 시장, 유형별, 2021-2030 (USD 천)
표 253 핀란드 군사 및 항공우주 산업의 광 파워 미터 시장, 유형별, 2021-2030(USD 천)
표 254 핀란드 에너지 및 유틸리티 산업의 광 파워 미터 시장, 유형별, 2021-2030 (USD 천)
표 255 핀란드 전기 및 전자 산업의 광 파워 미터 시장, 유형별, 2021-2030 (USD 천)
표 256 폴란드 광 파워 미터 시장, 유형별, 2021-2030 (USD 천)
표 257 폴란드 광 파워 미터 시장, 계측기/제품 유형별, 2021-2030년(USD 천 달러)
표 258 폴란드 핸드헬드 미터 광 파워 미터 시장, 유형별, 2021-2030 (USD 천)
표 259 폴란드 광학 파워 미터 시장, 검출기 유형별, 2021-2030 (USD 천)
표 260 폴란드 광 파워 미터 시장, 파워 범위별, 2021-2030 (USD 천)
표 261 폴란드 광 파워 미터 시장, 파장별, 2021-2030 (USD 천)
표 262 폴란드 광 파워 미터 시장, 광원별, 2021-2030 (USD 천)
표 263 폴란드 광 파워 미터 시장, 응용 분야별, 2021-2030 (USD 천)
표 264 폴란드 광 파워 미터 시장, 최종 사용자별 2021-2030 (USD 천)
표 265 폴란드 통신 산업의 광 파워 미터 시장, 유형별, 2021-2030 (USD 천)
표 266 폴란드 자동차 산업의 광학 파워 미터 시장, 유형별, 2021-2030 (USD 천)
표 267 폴란드 군사 및 항공우주 산업의 광 파워 미터 시장, 유형별, 2021-2030(USD 천)
표 268 폴란드 에너지 및 유틸리티 산업의 광 파워 미터 시장, 유형별, 2021-2030 (USD 천)
표 269 폴란드 전기 및 전자 산업의 광 파워 미터 시장, 유형별, 2021-2030 (USD 천)
표 270 유럽 나머지 지역 광 파워 미터 시장, 유형별, 2021-2030 (USD 천 달러)
그림 목록
그림 1 유럽 광 파워 미터 시장: 세분화
그림 2 유럽 광 파워 미터 시장: 데이터 삼각 측량
그림 3 유럽 광 파워 미터 시장: DROC 분석
그림 4 유럽 광 파워 미터 시장: 유럽 대 지역 시장 분석
그림 5 유럽 광 파워 미터 시장: 회사 연구 분석
그림 6 유럽 광 파워 미터 시장: 인터뷰 인구 통계
그림 7 유럽 광 파워 미터 시장: DBMR 시장 위치 그리드
그림 8 유럽 광 파워 미터 시장: 공급업체 점유율 분석
그림 9 유럽 광 파워 미터 시장: 유형 수명선 곡선
그림 10 유럽 광 파워 미터 시장: 시장 응용 범위 그리드
그림 11 유럽 광 파워 미터 시장: 세분화
그림 12 통신 산업에서 광 파워 미터에 대한 수요 증가는 2023년에서 2030년까지의 예측 기간 동안 유럽 광 파워 미터 시장을 주도할 것으로 예상됩니다.
그림 13 유형 세그먼트는 2023년과 2030년에 유럽 광 파워 미터 시장에서 가장 큰 점유율을 차지할 것으로 예상됩니다.
그림 14 아시아 태평양 지역은 2023년~2030년 예측 기간 동안 유럽 광 파워 미터 시장에서 우위를 점하고 가장 빠르게 성장하는 지역이 될 것으로 예상됩니다.
그림 15 아시아 태평양 지역은 2023년~2030년 예측 기간 동안 광 파워 미터 제조업체를 위한 가장 빠르게 성장하는 시장입니다.
그림 16 가치 사슬 분석
그림 17 유럽 광 파워 미터 시장의 동인, 제약, 기회 및 과제
그림 18 유럽 광 파워 미터 시장: 유형별, 2022
그림 19 유럽 광 파워 미터 시장: 계측기/제품 유형별, 2022년
그림 20 유럽 광학 파워 미터 시장, 검출기 유형별, 2022
그림 21 유럽 광 파워 미터 시장: 파워 범위별, 2022
그림 22 유럽 광 파워 미터 시장: 파장별, 2022
그림 23 유럽 광 파워 미터 시장, 광원별, 2022
그림 24 유럽 광 파워 미터 시장, 응용 분야별, 2022
그림 25 최종 사용자별 유럽 광 파워 미터 시장, 2022
그림 26 유럽 광 파워 미터 시장: 스냅샷(2022)
그림 27 유럽 광 파워 미터 시장: 국가별(2022년)
그림 28 유럽 광 파워 미터 시장: 국가별(2023-2030)
그림 29 유럽 광 파워 미터 시장: 국가별(2022-2030)
그림 30 유럽 광 파워 미터 시장: 유형별(2023-2030)
그림 31 유럽 광 파워 미터 시장: 회사 점유율 2022(%)
연구 방법론
데이터 수집 및 기준 연도 분석은 대규모 샘플 크기의 데이터 수집 모듈을 사용하여 수행됩니다. 이 단계에는 다양한 소스와 전략을 통해 시장 정보 또는 관련 데이터를 얻는 것이 포함됩니다. 여기에는 과거에 수집한 모든 데이터를 미리 검토하고 계획하는 것이 포함됩니다. 또한 다양한 정보 소스에서 발견되는 정보 불일치를 검토하는 것도 포함됩니다. 시장 데이터는 시장 통계 및 일관된 모델을 사용하여 분석하고 추정합니다. 또한 시장 점유율 분석 및 주요 추세 분석은 시장 보고서의 주요 성공 요인입니다. 자세한 내용은 분석가에게 전화를 요청하거나 문의 사항을 드롭하세요.
DBMR 연구팀에서 사용하는 주요 연구 방법론은 데이터 마이닝, 시장에 대한 데이터 변수의 영향 분석 및 주요(산업 전문가) 검증을 포함하는 데이터 삼각 측량입니다. 데이터 모델에는 공급업체 포지셔닝 그리드, 시장 타임라인 분석, 시장 개요 및 가이드, 회사 포지셔닝 그리드, 특허 분석, 가격 분석, 회사 시장 점유율 분석, 측정 기준, 글로벌 대 지역 및 공급업체 점유율 분석이 포함됩니다. 연구 방법론에 대해 자세히 알아보려면 문의를 통해 업계 전문가에게 문의하세요.
사용자 정의 가능
Data Bridge Market Research는 고급 형성 연구 분야의 선두 주자입니다. 저희는 기존 및 신규 고객에게 목표에 맞는 데이터와 분석을 제공하는 데 자부심을 느낍니다. 보고서는 추가 국가에 대한 시장 이해(국가 목록 요청), 임상 시험 결과 데이터, 문헌 검토, 재생 시장 및 제품 기반 분석을 포함하도록 사용자 정의할 수 있습니다. 기술 기반 분석에서 시장 포트폴리오 전략에 이르기까지 타겟 경쟁업체의 시장 분석을 분석할 수 있습니다. 귀하가 원하는 형식과 데이터 스타일로 필요한 만큼 많은 경쟁자를 추가할 수 있습니다. 저희 분석가 팀은 또한 원시 엑셀 파일 피벗 테이블(팩트북)로 데이터를 제공하거나 보고서에서 사용 가능한 데이터 세트에서 프레젠테이션을 만드는 데 도움을 줄 수 있습니다.

