Global Virtual Router Market
시장 규모 (USD 10억)
연평균 성장률 :
% 
 USD
532.55 Million
USD
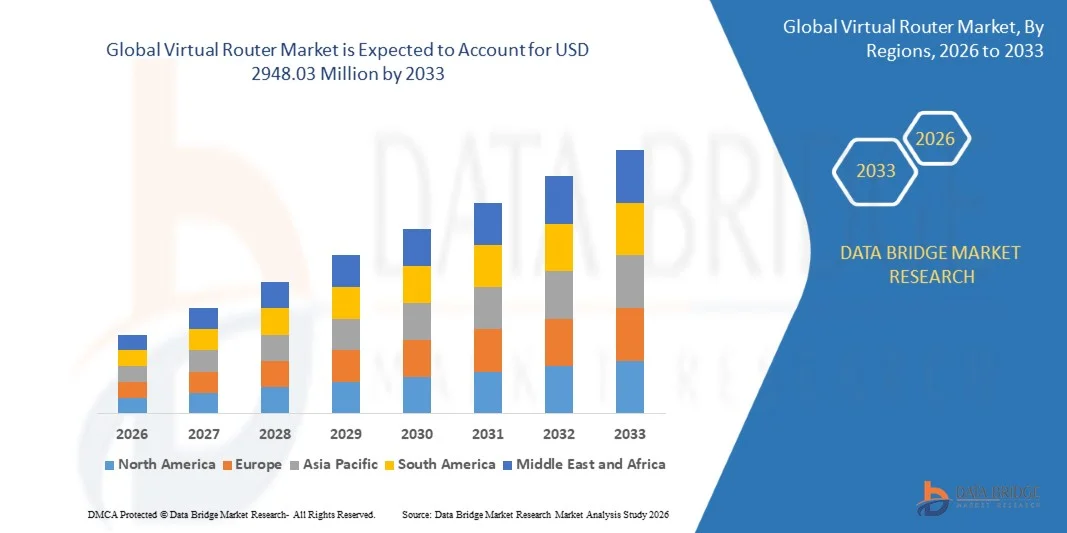
2,948.03 Million
2025
2033
USD
532.55 Million
USD
2,948.03 Million
2025
2033
| 2026 –2033 | |
| USD 532.55 Million | |
| USD 2,948.03 Million | |
| % | |
|
글로벌 가상 라우터 시장, 구성 요소 (Solution and Service), 유형 (Custom and Predefined), 최종 사용자 (Service Providers and Enterprises) - 산업 동향 및 예측 2033
가상 라우터 마켓제품정보
가상 라우터 시장은 가치있었습니다.2025년 USD 532.55 백만프로젝트2948.03 백만 2033, 성장하는2026년부터 2033년까지 23.85%의 CAGR. 시장은 네트워크 기능 가상화 기술의 채택 증가에 의해 구동되는 일관된 성장, 클라우드 기반 인프라의 상승, 확장 및 비용 효율적인 네트워킹 솔루션에 대한 수요 증가. 5G 및 Edge 컴퓨팅 생태계의 소프트웨어 정의 네트워킹 아키텍처 및 신속한 개발 구현은 엔터프라이즈 및 텔레콤 환경에서 시장 확장을 지원합니다.
디지털 혁신 및 네트워크 현대화에 대한 글로벌 초점 증가, 유연한 연결에 대한 데이터 트래픽 및 수요 증가, 소프트웨어 기반 가상 라우터와 전통적인 하드웨어 기반 라우팅 시스템을 대체하는 데 필요한 조직입니다. 가상 라우팅 솔루션은 통신 사업자, 클라우드 서비스 제공 업체 및 기업에서 점점 채택되어 네트워크 민첩성을 개선하고 인프라 비용을 절감하고 운영 효율성을 향상시킵니다. 클라우드 네트워크 기술 및 자동화 기능의 지속적인 발전은 전 세계 시장 성장을 가속화하고 있습니다.
주요 시장 동향 & 통찰력
- 북미는 네트워크 기능 가상화 기술, 강력한 클라우드 인프라의 초기 채택에 의해 지원되는 2025 년 최대 수익 점유율을 가진 가상 라우터 시장을 지배하고 기업과 통신 사업자의 소프트웨어 정의 네트워킹 솔루션의 배포를 증가
- 서비스 제공 업체 세그먼트는 통신 사업자, ISP 및 클라우드 제공 업체에 의해 가상 라우팅 기술의 광범위한 채택에 의해 구동 2025에서 65 %의 점유율을 가진 시장을 주도
- 아시아 태평양은 2026년부터 2033년까지 24.3%의 CAGR에서 가장 빠르게 성장하는 지역이 될 것으로 예상되고, 급속한 디지털화에 의해 연료를 공급하고, 인터넷 침투를 증가시키고, 5G 네트워크의 배포 확대
- 사용자 정의는 가장 빠르게 성장하는 유형이며, 2026에서 2033에 15 %의 CAGR을 등록하여 복잡한 기업 및 통신 환경에서 맞춤형 라우팅 아키텍처를 늘리고 지원됩니다.
- 솔루션 세그먼트는 텔레콤 및 클라우드 환경에서 소프트웨어 정의 네트워킹 및 NFV 기반 라우팅 솔루션의 광범위한 배포에 의해 주도 2025 년 62%의 수익 공유와 구성 요소 범주를 지배
- 2025년 시장의 58%를 차지한 Predefined는 빠른 배포 및 낮은 구현 복잡성을 가능하게 하는 표준화된 가상 라우팅 패키지에 의해 선호됩니다.
- 서비스 부문은 2026년부터 2033년까지 14%의 CAGR로 가장 빠르게 성장하는 구성 요소 범주이며, 관리 네트워크 서비스 및 아웃소싱 가상 라우팅 운영에 대한 수요가 늘어나고 있습니다.
시장 크기 & Forecast
- 글로벌 시장 가치 (2025) : USD 55 백만
- 예상 시장 가치 (2033): USD 2948.03 백만
- 캐스트 CAGR (2026–2033): 23.85%
- 2025년에 지도하는 지역: 북아메리카
- 가장 빠른 성장 지역: Asia-Pacific
보고서 범위 및 가상 라우터 시장회사연혁
|
관련 기사 |
가상 라우터 키시장 통찰력 |
|
Segments 적용 |
|
|
국가 덮음 |
북아메리카 · 미국 · 캐나다 · 멕시코 · · 독일 · 프랑스 · 미국 · 네덜란드 · 스위스 · 벨기에 · 러시아 · 이탈리아 · 스페인 · 터키 · 유럽의 나머지 아시아 태평양 · 중국 · 일본 · 인도 · 대한민국 · 싱가포르 · 말레이시아 · 호주 · 태국 · 인도네시아 · 필리핀 · 아시아 태평양의 휴식 중동 및 아프리카 · 사우디 아라비아 · 미국 · 남아프리카 공화국 · 이집트 · 이스라엘 · 중동 및 아프리카의 나머지 대한민국 · 브라질 · 아르헨티나 · 남미의 휴식 |
|
핵심 시장 선수 |
·Cisco 시스템, Inc. (미국) · Telefonaktiebolaget LM 에릭슨 (스웨덴) ·화웨이 기술 유한 회사. (중국) ·노키아(핀란드) ·Juniper 네트워크, Inc.(미국) · IBM Corporation (미국) · netElastic (미국) ·Hewlett Packard 기업 개발 LP(미국) · Arista Networks, Inc. (미국) · ZTE Corporation (중국) · Palo Alto Networks, Inc. (미국) · Ross Video Ltd. (캐나다) · 6WIND (프랑스) · 128 기술 (미국) · TRENDnet (미국) · Belkin International, Inc. (미국) · Linksys (미국) · Allied Telesis, Inc. (일본) · 포인트 소프트웨어 기술 (Israel) 확인 · DriveNets (이스라엘) |
|
시장 기회 |
· Edge Computing Infrastructure의 Virtual Routing Solutions에 대한 수요 상승 · 가상 라우터의 Adoption 확장 기업 SD-WAN 배포 · AI-Driven 및 자동화 된 네트워크 관리 솔루션의 성장 투자 |
|
Value 추가 데이터 Infosets |
시장 가치, 성장률, 시장 세그먼트, 지리적 적용, 시장 플레이어 및 시장 시나리오와 같은 시장 통찰력 외에도 데이터 브리지 시장 연구 팀은 심층적 인 전문가 분석, 수입 / 수출 분석, 가격 분석, 생산 소비 분석 및 pestle 분석이 포함됩니다. |
가상 라우터 시장 동향
트렌드 : Cloud-Native 및 Software-Defined Networking 아키텍처의 채택
텔레콤, 클라우드 및 엔터프라이즈 부문의 조직은 클라우드 기반 네트워킹 및 소프트웨어 정의 아키텍처를 채택하여 네트워크 민첩성, 확장성 및 운영 효율을 향상시킵니다. 가상 라우터는 공공 클라우드, 개인 클라우드, 하이브리드 환경에서 유연한 배포를 가능하게하여 고유의 하드웨어에 의존성을 줄입니다. Edge 컴퓨팅 인프라 구축 및 자동화 네트워크 관리 수요 증가는 소프트웨어 기반 라우팅 기술의 채택을 가속화하고 있습니다. 분산된 네트워킹 모델을 향한 전환은 또한 가상화된 라우팅 솔루션의 광범위한 구현을 지원합니다.
노키아와 같은 회사는 적극적으로 클라우드 기반 라우팅 포트폴리오를 확장하고, 6 월 2025에서 회사는 혁신적인 7705 서비스 Aggregation Router 및 7250 Interconnect Router 플랫폼을 도입하여 현대 IP 네트워크와 중요한 인프라 애플리케이션을 지원하며 가상화 및 소프트웨어 정의 네트워킹 환경의 채택을 강화했습니다.
가상 라우터 마켓 Dynamics
주요 시장 드라이버: 5G 네트워크 및 네트워크 기능 가상화 기술의 배포
5G 네트워크의 급속한 확장 및 네트워크 기능 가상화 기술의 채택 증가는 전 세계 가상 대패를 위한 상당히 모는 수요입니다. 통신 사업자는 데이터 트래픽, 초저 대기 시간 애플리케이션 및 클라우드 기반 서비스 제공을 지원하는 네트워크 인프라를 현대화하고 있습니다. Virtual routing 솔루션은 인프라 및 운영 비용을 절감하면서 네트워크 유연성을 개선하기 위해 서비스 제공업체를 가능하게 합니다. 엣지 컴퓨팅 및 차세대 통신 네트워크의 투자는 시장 성장을 지원하는 것입니다.
Vodafone Idea 및 Nokia와 같은 주요 회사는 네트워크 현대화 이니셔티브를 가속화하고 있으며, 3 월 2025 노키아는 Vodafone Idea와의 3 년 계약을 체결하여 7750 서비스 라우터 및 7250 IXR 솔루션을 사용하여 운영자의 IP 백홀 네트워크를 확장하고 업그레이드 할 수 있습니다. 4G 및 5G 연결 기능을 향상시킵니다.
Key Restraint/Challenge: Multi-Vendor 및 Hybrid Network 환경 관리의 복잡성
Virtual Router 시장의 주요 과제는 멀티 벤더 및 하이브리드 네트워크 인프라 관리와 관련된 복잡성입니다. 엔터프라이즈 및 서비스 제공 업체는 점점 물리적 라우터, 가상 라우팅 플랫폼, 클라우드 인프라 및 소프트웨어 정의 네트워크로 구성된 환경을 운영하며 상호 운용성 및 관현 도전을 창출합니다. 이진 네트워크의 원활한 트래픽 관리, 보안 및 성능 최적화를 통해 고급 전문성과 정교한 관리 도구를 필요로 합니다. 통합 문제 및 호환성 요구 사항은 배포 비용을 늘리고 구현 시간을 연장할 수 있습니다.
7월 2025일 Hewlett Packard Enterprise에 의해 Juniper Networks의 인수는 조직이 점점 복잡하고 다양한 네트워크 환경을 통해 작업을 단순화 할 수있는 통합 솔루션을 찾는 통합 된 네트워킹 생태계의 중요성을 강조합니다.
주요 시장 기회 : 가상 라우터의 Adoption을 확장 엔터프라이즈 SD-WAN 배포
기업의 SD-WAN 기술의 증가 채택은 가상 라우터 시장의 상당한 성장 기회를 창출하고 있습니다. 조직은 소프트웨어 정의 넓은 지역 네트워크를 구축하여 연결성을 개선하고 애플리케이션 성능을 최적화하고 하이브리드 작업 환경을 지원합니다. Virtual Routers는 분산 네트워크를 통해 중앙화된 트래픽 관리 및 유연한 서비스 배포를 가능하게 하여 SD-WAN 아키텍처의 중요한 역할을 합니다. 클라우드 마이그레이션 및 디지털 애플리케이션에 의존도를 증가하는 것은 소프트웨어 기반 라우팅 솔루션에 대한 수요를 더욱 강화하고 있습니다.
Cisco Systems 및 HPE Aruba Networking과 같은 기업은 기업 요구사항을 해결하기 위해 SD-WAN 포트폴리오를 적극적으로 확장하고 있습니다. Cisco의 SD-WAN의 지속적인 투자 및 보안 네트워킹 솔루션은 확장성 및 비용 효율적인 네트워크 아키텍처를 추구하는 기업의 가상 라우팅 기술의 광범위한 배포를 지원합니다.
가상 라우터 시장 범위
가상 라우터 시장은 구성 요소, 유형 및 최종 사용자를 기준으로 구분됩니다.
- 으로 구성
구성 요소의 기초에, 가상 대패 시장은 해결책과 서비스로 구분됩니다. 해결책 세그먼트는 2025년에 62%의 가장 큰 점유율을 가진 시장을, 텔레콤과 클라우드 환경의 맞은편에 소프트웨어 정의 네트워킹과 NFV 근거한 여정 해결책의 광대한 배치에 의해 모였습니다. 엔터프라이즈 및 서비스 제공 업체는 점점 확장 가능한 트래픽 관리 및 네트워크 민첩성을 위해 가상 라우터 소프트웨어를 선호합니다. 비용 효율적인 네트워크 가상화에 대한 강력한 요구는 대규모 데이터 센터를 통해 채택을 더욱 강화하고 있습니다. SD-WAN 및 클라우드 기반 아키텍처와 통합은 세그먼트 리더십을 강화하는 것입니다. 통신망에 걸쳐 급속한 디지털 변환 이니셔티브의 세그먼트 이점.
서비스 부문은 2026년부터 2033년까지 14%의 CAGR에서 가장 빠르게 성장할 것으로 예상되며, 관리 네트워크 서비스 및 아웃소싱 가상 라우팅 운영에 대한 수요가 늘어나고 있습니다. 조직은 좀 더 복잡한 배포, 관현관 및 가상 라우터 인프라의 유지보수를 처리하는 타사 전문 지식에 의존하고 있습니다. 하이브리드 클라우드 환경의 채택은 지속적인 최적화 및 모니터링에 대한 더 많은 서비스 요구 사항입니다. 텔레콤 현대화 프로그램의 확장은 컨설팅 및 통합 서비스에 대한 신뢰를 가속화하고 있습니다. 운영 효율에 중점을두고 사내 네트워크 복잡성을 감소시켜 신속한 서비스 세그먼트 확장을 지원합니다.
- 이름 *
Virtual Router Market은 사용자 정의 및 사전 정의 솔루션으로 구분됩니다. Predefined 세그먼트는 2025 년에 58%의 점유율을 가진 시장을 지배하고, 더 빠른 배포 및 더 낮은 구현 복잡성을 가능하게하는 표준화 된 가상 라우팅 패키지에 대한 강한 수요에 의해 구동. 통신 사업자 및 기업은 빠른 확장성에 대한 사전 정의 구성을 선호하고 구성 오버 헤드를 감소시킵니다. 클라우드 플랫폼의 공급 업체 지원 템플릿의 광범위한 가용성은 채택을 강화하고 있습니다. 기존 네트워크 인프라와 통합의 비용 효율성과 용이함은 더 많은 지원 시장 지배력을 지원합니다. 납품업자의 지속적인 향상은 표준화한 제안의 맞은편에 성과 그리고 신뢰성을 개량합니다.
사용자 정의 세그먼트는 2026에서 2033에 15 %의 CAGR에서 가장 빠른 성장을 등록하기 위해 계획되어 복잡한 기업 및 통신 환경에 맞는 라우팅 아키텍처를 늘리고 있습니다. 전문 작업로드를 가진 조직은 성능과 보안을 최적화하기 위해 맞춤형 가상 라우팅 기능을 요구합니다. 하이브리드 및 멀티 클라우드 전략의 채택은 유연한 구성 모델에 대한 수요를 가속화하는 것입니다. 엔터프라이즈는 대기 상태 감지 애플리케이션과 대규모 데이터 트래픽 관리를 지원하기 위해 맞춤형 네트워크 설계에 투자하고 있습니다. 차별화된 네트워크 성능에 중점을 두는 것은 고급 디지털 생태계를 통해 맞춤 솔루션 배포를 크게 향상시킵니다.
- 최종 사용자
최종 사용자의 기초에, 가상 라우터 시장은 서비스 제공 업체 및 기업으로 구분됩니다. 서비스 제공자 세그먼트는 텔레콤 사업자, ISP 및 클라우드 제공 업체에 의해 가상 라우팅 기술의 광범위한 채택에 의해 구동 2025 년에 65 %의 최대 점유율을 가진 시장을 지배했습니다. 이 조직은 대규모 및 동적 네트워크 트래픽을 효율적으로 관리하기 위해 고성능 라우팅 기능을 요구합니다. 5G 인프라와 가장자리 컴퓨팅 네트워크의 급속한 확장은 더 많은 배포를 강화하고 있습니다. 네트워크 가상화의 강력한 투자는 하드웨어 의존도를 줄이기 위해 지속적인 지배력을 지원합니다. 글로벌 통신 인프라의 대규모 현대화의 세그먼트 혜택.
기업 세그먼트는 IT, BFSI 및 제조 부문에서 디지털 전환 가속화에 의해 구동 2026에서 2033 %의 CAGR에서 가장 빠른 성장을 등록하기 위해 계획됩니다. 엔터프라이즈는 네트워크 유연성, 보안 및 클라우드 연결을 강화하기 위해 가상 라우터를 채택하고 있습니다. 원격 작업 모델의 상승 사용 및 분산 IT 아키텍처는 확장 가능한 라우팅 솔루션에 대한 수요를 높입니다. Cloud-native 애플리케이션과 SD-WAN 플랫폼과 가상 라우터의 통합은 더 채택을 지원합니다. 운영 비용을 절감하고 네트워크 민첩성을 개선하는 데 중점을두고 급속한 기업 세그먼트 확장을 구동합니다.
Virtual Router 시장 지역 분석
북미는 가상 라우터 시장을 지배하고 2025 년 최대 수익 점유율을 차지했으며 네트워크 기능 가상화 기술, 강력한 클라우드 인프라의 초기 채택에 의해 구동되고 기업 및 통신 사업자의 소프트웨어 정의 네트워킹 솔루션의 배포를 증가시킵니다. 5G 및 Edge 컴퓨팅 인프라의 광범위한 디지털 전환 이니셔티브 및 성장 투자의 지역 이점. IT 및 통신, BFSI, 의료, 정부 부문의 조직은 네트워크 확장성을 개선하고 하드웨어 의존성을 감소시키기 위해 가상 라우팅 솔루션을 구현하고 있습니다. 안전하고 유연한 네트워크 아키텍처에 대한 수요는 시장 확장을 지원하는 것입니다. 또한, 선도적인 네트워킹 기술 회사의 존재는 북미의 글로벌 시장에서 리더십 위치를 강화하는 것을 계속합니다.
미국 가상 라우터 시장 통찰력
미국 가상 라우터 시장은 클라우드 컴퓨팅의 급속한 확장에 의해 구동되는 강력한 성장, SD-WAN 기술의 채택 증가, 차세대 통신 인프라에 투자 상승. 기업 및 통신 사업자는 점점 가상 라우터를 배포하여 네트워크 효율성을 개선하고 데이터 트래픽 볼륨을 증가시킵니다. 주요 클라우드 서비스 제공업체의 선진 데이터 센터 생태계와 강력한 존재는 소프트웨어 기반 네트워킹 솔루션의 원활한 통합을 가능하게 합니다. 5G 네트워크의 롤아웃 증가는 가상화 네트워크 인프라에 대한 추가 기회를 창출하고 있습니다. 또한 자동화 및 네트워크 민첩성은 미국 전역의 시장 성장을 가속화하고 있습니다.
캐나다 가상 라우터 시장 통찰력
캐나다 가상 라우터 시장은 클라우드 채택과 현대 통신 네트워크의 투자 증가에 의해 지원되는 꾸준한 성장을 목격하고있다. 기업은 점점 가상 라우팅 기술을 구현하여 운영 유연성을 향상시키고 네트워크 성능을 최적화합니다. 금융, 의료, IT 분야의 보안 및 확장 가능한 네트워킹 솔루션에 대한 수요가 증가하여 시장 개발을 지원합니다. 디지털 서비스의 확장 및 원격 연결에 의존 증가는 채택에 더 기여. 또한, 통신 인프라의 지속적인 투자는 캐나다의 시장 성장을 강화하고 있습니다.
유럽 가상 라우터 시장 통찰력
유럽 가상 라우터 시장은 가상화 네트워크 인프라 구축 및 클라우드 기반 기술의 채택을 증가시키기 위해 꾸준히 확장되고 있습니다. 강력한 디지털 혁신 이니셔티브의 지역 혜택 및 기업의 전체 및 서비스 제공 업체의 유연한 네트워킹 솔루션에 대한 수요 증가. 제조, 자동차, 금융 서비스 및 통신 부문의 조직은 네트워크 관리를 개선하고 인프라 비용을 절감하기 위해 가상 라우터를 채택하고 점점 더 채택됩니다. 엣지 컴퓨팅 및 5G 연결에 대한 투자는 시장 성장을 지원합니다. 안전하고 에너지 효율적인 네트워크 아키텍처에 중점을 두는 것은 지역 확장을 가속화합니다.
U.K. 가상 라우터 시장 통찰력
U.K. Virtual Router 시장은 클라우드 마이그레이션 증가, SD-WAN 솔루션의 상승 배치, 및 agile 네트워크 인프라에 대한 강한 수요에 의해 구동 꾸준히 성장하고 있습니다. Enterprise는 디지털 전환 및 원격 연결 요구 사항을 지원하는 가상화 네트워킹 기술에 중점을 둡니다. 국가의 성숙한 원거리 통신 분야 및 진보된 디지털 생태계는 채택을 위한 호의를 베푸는 조건을 창조하고 있습니다. 5G 배포 및 가장자리 컴퓨팅의 성장 투자는 시장 기회를 더욱 강화하고 있습니다. 또한, 네트워크 운영 비용을 줄이는 데 초점을 증가는 미국에 확장을 지원한다.
독일 가상 라우터 시장 통찰력
독일 가상 라우터 시장은 강력한 산업 디지털화로 인해 확장되고, Industry 4.0 기술을 채택하고 소프트웨어 정의 네트워킹 인프라에 투자를 증가시킵니다. 제조, 자동차 및 산업 분야의 기업은 가상 라우팅 솔루션을 구현하여 연결 및 네트워크 효율성을 향상시킵니다. 안전하고 확장 가능한 통신 시스템에 대한 수요가 증가하여 시장 개발을 지원합니다. 자동화 및 디지털 혁신에 대한 국가의 강력한 초점은 고급 네트워킹 기술의 도입입니다. 또한, 민간 5G 네트워크의 배포 증가는 독일에서 시장 성장을 가속화하는 것입니다.
Asia-Pacific 가상 라우터 시장 통찰력
Asia-Pacific Virtual Router 시장은 급속한 디지털화에 의해 구동되는 2026년에서 2033년까지 24.3%의 CAGR로 가장 빠른 성장을 등록하고, 인터넷 침투를 증가시키고, 5G 네트워크의 배포를 확장할 것으로 예상됩니다. 클라우드 컴퓨팅 인프라 및 데이터 센터의 성장 투자는 소프트웨어 기반 라우팅 기술에 대한 수요가 크게 향상됩니다. 중국, 인도, 일본 및 대한민국과 같은 국가는 통신 및 기업 분야의 네트워크 가상화 솔루션의 강력한 채택을 목격하고 있습니다. SME 및 대형 조직 중 디지털 전환 이니셔티브는 시장 확장을 지원합니다. 또한, 비용 효율적인 확장 가능한 네트워크 인프라에 대한 수요 증가는 지역 성장을 가속화하고 있습니다.
일본 가상 라우터 시장 통찰력
일본 가상 라우터 시장은 첨단 네트워킹 솔루션에 대한 높은 기술 채택, 강력한 투자에 의해 지원되는 꾸준한 성장을 목격하고 있습니다. 엔터프라이즈는 가상 라우터를 배포하여 네트워크 유연성을 향상시키고 디지털 워크로드를 지원합니다. 국가의 잘 개발 된 통신 인프라 및 자동화 초점은 시장 확장을 지원합니다. 클라우드 서비스 및 가장자리 컴퓨팅 기술의 채택은 더 성장 기회를 창출하는 것입니다. 또한, 네트워크 효율 강화에 초점을 증가 일본에 수요 강화.
중국 가상 라우터 시장 통찰력
중국 가상 라우터 시장은 클라우드 인프라의 대규모 확장, 5G 네트워크의 강력한 배포 및 디지털 전환 이니셔티브의 투자 증가로 인해 빠르게 성장하고 있습니다. 통신 사업자 및 기업은 가상 라우팅 기술을 채택하여 데이터 트래픽을 관리하고 네트워크 확장성을 향상시킵니다. 주요 기술 회사의 강력한 디지털 생태계와 강력한 존재는 소프트웨어 정의 네트워킹 솔루션의 급속한 채택을 가능하게합니다. 데이터 센터 현대화 및 지능형 네트워크 관리에 대한 수요가 증가하는 것은 더 많은 시장 성장을 지원합니다. 또한 디지털 인프라 개발을 촉진하는 정부 이니셔티브는 중국의 확장을 가속화하고 있습니다.
가상 라우터 마켓 공유
가상 라우터 산업은 주로 잘 설립 된 회사에 의해 주도된다 :
- Cisco 시스템, Inc. (미국)
- Telefonaktiebolaget LM 에릭슨 (스웨덴)
- Huawei 기술 Co., 주식 회사 (중국)
- 노키아 (핀란드)
- Juniper Networks, Inc. (미국)
- IBM Corporation (미국)
- netElastic (미국)
- Hewlett Packard Enterprise 개발 LP (미국)
- Arista Networks, Inc. (미국)
- ZTE Corporation (중국)
- Palo Alto Networks, Inc. (미국)
- Ross Video Ltd. (캐나다)
- 6WIND (프랑스)
- 128 기술 (미국)
- TRENDnet (미국)
- Belkin International, Inc. (미국)
- Linksys (미국)
- Allied Telesis, Inc. (일본)
- 포인트 소프트웨어 기술 (Israel)
- DriveNets (이스라엘)
Virtual Router Market의 최신 개발
- 7월 2025일, Hewlett Packard Enterprise는 약 14억 달러에 달하는 거래에서 Juniper Networks의 인수를 완료하여 AI 기반 네트워킹 및 클라우드 기반 인프라 포트폴리오를 크게 강화했습니다. 인수는 소프트웨어 정의 네트워킹 및 가상 라우팅 기술에 혁신을 가속화 할 것으로 예상되며 기업과 통신 환경의 확장성 및 지능형 네트워크 아키텍처의 광범위한 채택을 지원합니다.
- 6 월 2025에서 노키아는 향상된 7705 서비스 Aggregation Router 및 7250 Interconnect Router 플랫폼으로 IP 라우팅 포트폴리오를 확장하여 유틸리티 및 스마트 그리드 애플리케이션을 목표로했습니다. 이 개발은 고급 소프트웨어 기반 라우팅 솔루션에 대한 수요 증가로 가상 라우터 시장을 강화하고 중요한 통신 인프라의 현대화 지원
- 6월 2025일, Cisco Systems 및 VAST Data는 AI 운영 체제와 네트워킹 플랫폼을 결합하는 통합 AI 인프라 솔루션을 제공하는 전략적 파트너십을 확장했습니다. 협력은 가상화 네트워크의 성능을 향상시키고 엔터프라이즈 데이터 센터의 지능형 여정 솔루션을 구축 할 것으로 예상됩니다.
- 3 월 2025에서 노키아는 7750 서비스 라우터 및 7250 IXR 솔루션을 사용하여 운영자의 IP backhaul 네트워크를 업그레이드하고 확장하기 위해 Vodafone Idea와 3 년 계약을 체결했습니다. 이 개발은 4G 및 5G 트래픽 수요 증가 및 가상 네트워크 인프라의 광범위한 채택을 지원하는 가상 라우터 시장의 성장에 기여하고 있습니다.
- 3 월 2025, Cisco Systems, Nokia, AMD 및 Jio Platforms는 네트워크 인텔리전스 및 자동화 기능을 개선하는 데 중점을 둔 Open Telecom AI Platform을 개발하는 파트너십을 발표했습니다. 이 이니셔티브는 AI-enabled 가상 라우팅 기술의 채택을 촉진하고 전 세계 차세대 통신 네트워크의 진화를 강화합니다
SKU-
세계 최초의 시장 정보 클라우드 보고서에 온라인으로 접속하세요

- 대화형 데이터 분석 대시보드
- 높은 성장 잠재력 기회를 위한 회사 분석 대시보드
- 사용자 정의 및 질의를 위한 리서치 분석가 액세스
- 대화형 대시보드를 통한 경쟁자 분석
- 최신 뉴스, 업데이트 및 추세 분석
- 포괄적인 경쟁자 추적을 위한 벤치마크 분석의 힘 활용
목차
1 INTRODUCTION
1.1 OBJECTIVES OF THE STUDY
1.2 MARKET DEFINITION
1.3 OVERVIEW OF GLOBAL VIRTUAL ROUTER MARKET
1.4 CURRENCY AND PRICING
1.5 IMPACT OF COVID-19 PANDEMIC ON THE MARKET
1.5.1 PRICE IMPACT
1.5.2 IMPACT ON DEMAND
1.5.3 IMPACT ON SUPPLY CHAIN
1.5.4 CONCLUSION
1.6 LIMITATION
1.7 MARKETS COVERED
2 MARKET SEGMENTATION
2.1 KEY TAKEAWAYS
2.2 ARRIVING AT THE GLOBAL VIRTUAL ROUTER MARKET
2.2.1 VENDOR POSITIONING GRID
2.2.2 TECHNOLOGY LIFE LINE CURVE
2.2.3 MARKET GUIDE
2.2.4 COMPANY POSITIONING GRID
2.2.5 COMAPANY MARKET SHARE ANALYSIS
2.2.6 MULTIVARIATE MODELLING
2.2.7 TOP TO BOTTOM ANALYSIS
2.2.8 STANDARDS OF MEASUREMENT
2.2.9 VENDOR SHARE ANALYSIS
2.2.10 DATA POINTS FROM KEY PRIMARY INTERVIEWS
2.2.11 DATA POINTS FROM KEY SECONDARY DATABASES
2.3 GLOBAL VIRTUAL ROUTER MARKET: RESEARCH SNAPSHOT
2.4 ASSUMPTIONS
3 MARKET OVERVIEW
3.1 DRIVERS
3.2 RESTRAINTS
3.3 OPPORTUNITIES
3.4 CHALLENGES
4 EXECUTIVE SUMMARY
5 PREMIUM INSIGHTS
6 GLOBAL VIRTUAL ROUTER MARKET, BY COMPONENTS
6.1 OVERVIEW
6.2 SOLUTIONS
6.2.1 INTEGRATED SOLUTION
6.2.2 STANDALONE SOLUTIONS
6.3 SERVICE
6.3.1 PROFESSIONAL SERVICES
6.3.2 MANAGED SERVICES
7 GLOBAL VIRTUAL ROUTER MARKET, BY TYPE
7.1 OVERVIEW
7.2 PRE-DEFINED
7.2.1 TRUST-VR
7.2.2 UNTRUST-VR
7.3 CUSTOM
8 GLOBAL VIRTUAL ROUTER MARKET, BY WINDOWS TYPE
8.1 OVERVIEW
8.2 WINDOWS 07
8.3 WINDOWS 08
8.4 OTHERS
9 GLOBAL VIRTUAL ROUTER MARKET, BY APPLICATION
9.1 OVERVIEW
9.2 HOME
9.3 OFFICE
9.4 SCHOOL
9.5 AIRPORT
9.6 BUS STATION
9.7 THE PARK
9.8 OTHERS
10 GLOBAL VIRTUAL ROUTER MARKET, BY MODE
10.1 OVERVIEW
10.2 STATIC
10.3 DYNAMIC
10.4 MULTICAST
11 GLOBAL VIRTUAL ROUTER MARKET, BY PROVIDER TYPE
11.1 OVERVIEW
11.2 SERVICE PROVIDER
11.2.1 TELECOM
11.2.2 DATA CENTER
11.2.3 CLOUD
11.3 ENTERPRISE
11.3.1 BANKING, FINANCE SERVICES AND INSURANCE
11.3.2 MANUFACTURING
11.3.3 HEALTHCARE
11.3.4 GOVERNMENT AND DEFENSE
11.3.5 EDUCATION
11.3.6 OTHERS
12 GLOBAL VIRTUAL ROUTER MARKET, BY GEOGRAPHY
12.1 GLOBAL VIRTUAL ROUTER MARKET, (ALL SEGMENTATION PROVIDED ABOVE IS REPRESENTED IN THIS CHAPTER BY COUNTRY)
12.1.1 NORTH AMERICA
12.1.1.1. U.S.
12.1.1.2. CANADA
12.1.1.3. MEXICO
12.1.2 EUROPE
12.1.2.1. GERMANY
12.1.2.2. FRANCE
12.1.2.3. U.K.
12.1.2.4. ITALY
12.1.2.5. SPAIN
12.1.2.6. RUSSIA
12.1.2.7. TURKEY
12.1.2.8. BELGIUM
12.1.2.9. NETHERLANDS
12.1.2.10. SWITZERLAND
12.1.2.11. REST OF EUROPE
12.1.3 ASIA PACIFIC
12.1.3.1. JAPAN
12.1.3.2. CHINA
12.1.3.3. SOUTH KOREA
12.1.3.4. INDIA
12.1.3.5. AUSTRALIA
12.1.3.6. SINGAPORE
12.1.3.7. THAILAND
12.1.3.8. MALAYSIA
12.1.3.9. INDONESIA
12.1.3.10. PHILIPPINES
12.1.3.11. REST OF ASIA PACIFIC
12.1.4 SOUTH AMERICA
12.1.4.1. BRAZIL
12.1.4.2. ARGENTINA
12.1.4.3. REST OF SOUTH AMERICA
12.1.5 MIDDLE EAST AND AFRICA
12.1.5.1. SOUTH AFRICA
12.1.5.2. EGYPT
12.1.5.3. SAUDI ARABIA
12.1.5.4. U.A.E
12.1.5.5. ISRAEL
12.1.5.6. REST OF MIDDLE EAST AND AFRICA
12.2 KEY PRIMARY INSIGHTS: BY MAJOR COUNTRIES
13 GLOBAL VIRTUAL ROUTER MARKET,COMPANY LANDSCAPE
13.1 COMPANY SHARE ANALYSIS: GLOBAL
13.2 COMPANY SHARE ANALYSIS: NORTH AMERICA
13.3 COMPANY SHARE ANALYSIS: EUROPE
13.4 COMPANY SHARE ANALYSIS: ASIA PACIFIC
13.5 MERGERS & ACQUISITIONS
13.6 NEW PRODUCT DEVELOPMENT AND APPROVALS
13.7 EXPANSIONS
13.8 REGULATORY CHANGES
13.9 PARTNERSHIP AND OTHER STRATEGIC DEVELOPMENTS
14 GLOBAL VIRTUAL ROUTER MARKET , SWOT & DBMR ANALYSIS
15 GLOBAL VIRTUAL ROUTER MARKET, COMPANY PROFILE
15.1 CISCO
15.1.1 COMPANY SNAPSHOT
15.1.2 REVENUE ANALYSIS
15.1.3 GEOGRAPHIC PRESENCE
15.1.4 PRODUCT PORTFOLIO
15.1.5 RECENT DEVELOPMENTS
15.2 PATTON ELECTRONICS CO.
15.2.1 COMPANY SNAPSHOT
15.2.2 REVENUE ANALYSIS
15.2.3 GEOGRAPHIC PRESENCE
15.2.4 PRODUCT PORTFOLIO
15.2.5 RECENT DEVELOPMENTS
15.3 ERICSSON
15.3.1 COMPANY SNAPSHOT
15.3.2 REVENUE ANALYSIS
15.3.3 GEOGRAPHIC PRESENCE
15.3.4 PRODUCT PORTFOLIO
15.3.5 RECENT DEVELOPMENTS
15.4 HUAWEI TECHNOLOGIES
15.4.1 COMPANY SNAPSHOT
15.4.2 REVENUE ANALYSIS
15.4.3 GEOGRAPHIC PRESENCE
15.4.4 PRODUCT PORTFOLIO
15.4.5 RECENT DEVELOPMENTS
15.5 NOKIA
15.5.1 COMPANY SNAPSHOT
15.5.2 REVENUE ANALYSIS
15.5.3 GEOGRAPHIC PRESENCE
15.5.4 PRODUCT PORTFOLIO
15.5.5 RECENT DEVELOPMENTS
15.6 JUPINER NETWORKS
15.6.1 COMPANY SNAPSHOT
15.6.2 REVENUE ANALYSIS
15.6.3 GEOGRAPHIC PRESENCE
15.6.4 PRODUCT PORTFOLIO
15.6.5 RECENT DEVELOPMENTS
15.7 IBM
15.7.1 COMPANY SNAPSHOT
15.7.2 REVENUE ANALYSIS
15.7.3 GEOGRAPHIC PRESENCE
15.7.4 PRODUCT PORTFOLIO
15.7.5 RECENT DEVELOPMENTS
15.8 NETELASTIC
15.8.1 COMPANY SNAPSHOT
15.8.2 REVENUE ANALYSIS
15.8.3 GEOGRAPHIC PRESENCE
15.8.4 PRODUCT PORTFOLIO
15.8.5 RECENT DEVELOPMENTS
15.9 BROCADE
15.9.1 COMPANY SNAPSHOT
15.9.2 REVENUE ANALYSIS
15.9.3 GEOGRAPHIC PRESENCE
15.9.4 PRODUCT PORTFOLIO
15.9.5 RECENT DEVELOPMENTS
15.1 HPE
15.10.1 COMPANY SNAPSHOT
15.10.2 REVENUE ANALYSIS
15.10.3 GEOGRAPHIC PRESENCE
15.10.4 PRODUCT PORTFOLIO
15.10.5 RECENT DEVELOPMENTS
15.11 ARISTA NETWORKS
15.11.1 COMPANY SNAPSHOT
15.11.2 REVENUE ANALYSIS
15.11.3 GEOGRAPHIC PRESENCE
15.11.4 PRODUCT PORTFOLIO
15.11.5 RECENT DEVELOPMENTS
15.12 ZTE CORPORATION
15.12.1 COMPANY SNAPSHOT
15.12.2 REVENUE ANALYSIS
15.12.3 GEOGRAPHIC PRESENCE
15.12.4 PRODUCT PORTFOLIO
15.12.5 RECENT DEVELOPMENTS
15.13 CARBYNE
15.13.1 COMPANY SNAPSHOT
15.13.2 REVENUE ANALYSIS
15.13.3 GEOGRAPHIC PRESENCE
15.13.4 PRODUCT PORTFOLIO
15.13.5 RECENT DEVELOPMENTS
15.14 PALO ALTO NETWORKS
15.14.1 COMPANY SNAPSHOT
15.14.2 REVENUE ANALYSIS
15.14.3 GEOGRAPHIC PRESENCE
15.14.4 PRODUCT PORTFOLIO
15.14.5 RECENT DEVELOPMENTS
15.15 ROSS VIDEO
15.15.1 COMPANY SNAPSHOT
15.15.2 REVENUE ANALYSIS
15.15.3 GEOGRAPHIC PRESENCE
15.15.4 PRODUCT PORTFOLIO
15.15.5 RECENT DEVELOPMENTS
15.16 TRENDNET
15.16.1 COMPANY SNAPSHOT
15.16.2 REVENUE ANALYSIS
15.16.3 GEOGRAPHIC PRESENCE
15.16.4 PRODUCT PORTFOLIO
15.16.5 RECENT DEVELOPMENTS
15.17 ALLIED TELESIS
15.17.1 COMPANY SNAPSHOT
15.17.2 REVENUE ANALYSIS
15.17.3 GEOGRAPHIC PRESENCE
15.17.4 PRODUCT PORTFOLIO
15.17.5 RECENT DEVELOPMENTS
15.18 CHECK POINT
15.18.1 COMPANY SNAPSHOT
15.18.2 REVENUE ANALYSIS
15.18.3 GEOGRAPHIC PRESENCE
15.18.4 PRODUCT PORTFOLIO
15.18.5 RECENT DEVELOPMENTS
15.19 INVENTUM
15.19.1 COMPANY SNAPSHOT
15.19.2 REVENUE ANALYSIS
15.19.3 GEOGRAPHIC PRESENCE
15.19.4 PRODUCT PORTFOLIO
15.19.5 RECENT DEVELOPMENTS
15.2 DRIVENETS
15.20.1 COMPANY SNAPSHOT
15.20.2 REVENUE ANALYSIS
15.20.3 GEOGRAPHIC PRESENCE
15.20.4 PRODUCT PORTFOLIO
15.20.5 RECENT DEVELOPMENTS
15.21 ACCESS CONNECTIVITY
15.21.1 COMPANY SNAPSHOT
15.21.2 REVENUE ANALYSIS
15.21.3 GEOGRAPHIC PRESENCE
15.21.4 PRODUCT PORTFOLIO
15.21.5 RECENT DEVELOPMENTS
*NOTE: THE COMPANIES PROFILED IS NOT EXHAUSTIVE LIST AND IS AS PER OUR PREVIOUS CLIENT REQUIREMENT. WE PROFILE MORE THAN 100 COMPANIES IN OUR STUDY AND HENCE THE LIST OF COMPANIES CAN BE MODIFIED OR REPLACED ON REQUEST
16 CONCLUSION
17 RELATED REPORTS
18 ABOUT DATA BRIDGE MARKET RESEARCH
연구 방법론
데이터 수집 및 기준 연도 분석은 대규모 샘플 크기의 데이터 수집 모듈을 사용하여 수행됩니다. 이 단계에는 다양한 소스와 전략을 통해 시장 정보 또는 관련 데이터를 얻는 것이 포함됩니다. 여기에는 과거에 수집한 모든 데이터를 미리 검토하고 계획하는 것이 포함됩니다. 또한 다양한 정보 소스에서 발견되는 정보 불일치를 검토하는 것도 포함됩니다. 시장 데이터는 시장 통계 및 일관된 모델을 사용하여 분석하고 추정합니다. 또한 시장 점유율 분석 및 주요 추세 분석은 시장 보고서의 주요 성공 요인입니다. 자세한 내용은 분석가에게 전화를 요청하거나 문의 사항을 드롭하세요.
DBMR 연구팀에서 사용하는 주요 연구 방법론은 데이터 마이닝, 시장에 대한 데이터 변수의 영향 분석 및 주요(산업 전문가) 검증을 포함하는 데이터 삼각 측량입니다. 데이터 모델에는 공급업체 포지셔닝 그리드, 시장 타임라인 분석, 시장 개요 및 가이드, 회사 포지셔닝 그리드, 특허 분석, 가격 분석, 회사 시장 점유율 분석, 측정 기준, 글로벌 대 지역 및 공급업체 점유율 분석이 포함됩니다. 연구 방법론에 대해 자세히 알아보려면 문의를 통해 업계 전문가에게 문의하세요.
사용자 정의 가능
Data Bridge Market Research는 고급 형성 연구 분야의 선두 주자입니다. 저희는 기존 및 신규 고객에게 목표에 맞는 데이터와 분석을 제공하는 데 자부심을 느낍니다. 보고서는 추가 국가에 대한 시장 이해(국가 목록 요청), 임상 시험 결과 데이터, 문헌 검토, 재생 시장 및 제품 기반 분석을 포함하도록 사용자 정의할 수 있습니다. 기술 기반 분석에서 시장 포트폴리오 전략에 이르기까지 타겟 경쟁업체의 시장 분석을 분석할 수 있습니다. 귀하가 원하는 형식과 데이터 스타일로 필요한 만큼 많은 경쟁자를 추가할 수 있습니다. 저희 분석가 팀은 또한 원시 엑셀 파일 피벗 테이블(팩트북)로 데이터를 제공하거나 보고서에서 사용 가능한 데이터 세트에서 프레젠테이션을 만드는 데 도움을 줄 수 있습니다.

