
Global Virtual Router Market
Market Size in USD Million
 USD
532.55 Million
USD
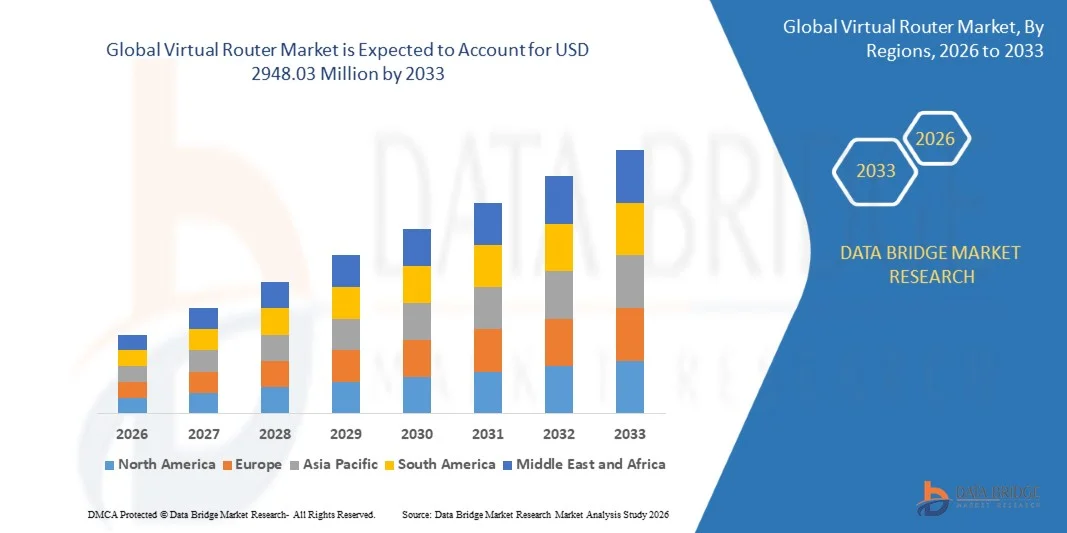
2,948.03 Million
2025
2033
USD
532.55 Million
USD
2,948.03 Million
2025
2033
| 2026 - 2033 | |
| USD 532.55 Million | |
| USD 2,948.03 Million | |
| % | |
|
Virtual Router Market Overview
The Virtual Router Market was valued at USD 532.55 Million in 2025 and is projected to reach USD 2948.03 Million by 2033, growing at a CAGR of 23.85% from 2026 to 2033. The market is experiencing consistent growth driven by increasing adoption of network function virtualization technologies, rising deployment of cloud-based infrastructure, and growing demand for scalable and cost-efficient networking solutions. Expanding implementation of software-defined networking architectures and rapid development of 5G and edge computing ecosystems are further supporting market expansion across enterprise and telecom environments.
The increasing global focus on digital transformation and network modernization, combined with rising data traffic and demand for flexible connectivity, is encouraging organizations to replace traditional hardware-based routing systems with software-driven virtual routers. Virtual routing solutions are increasingly being adopted across telecom operators, cloud service providers, and enterprises to improve network agility, reduce infrastructure costs, and enhance operational efficiency. Continuous advancements in cloud-native networking technologies and automation capabilities are further accelerating market growth worldwide.
Key Market Trends & Insights
- North America dominated the Virtual Router Market with the largest revenue share of 40% in 2025, supported by early adoption of network function virtualization technologies, strong cloud infrastructure, and increasing deployment of software-defined networking solutions across enterprises and telecom operators
- The service providers segment led the market with a 65% share in 2025, driven by extensive adoption of virtual routing technologies by telecom operators, ISPs, and cloud providers
- Asia-Pacific is expected to be the fastest-growing region at a CAGR of 24.3% from 2026 to 2033, fueled by rapid digitalization, increasing internet penetration, and expanding deployment of 5G networks
- Custom is the fastest-growing type, projected to register a CAGR of 15% from 2026 to 2033, supported by increasing need for tailored routing architectures in complex enterprise and telecom environments
- The solution segment dominated the component category with a 62% revenue share in 2025, led by widespread deployment of software-defined networking and NFV-based routing solutions across telecom and cloud environments
- Predefined accounted for 58% of the market in 2025, preferred by standardized virtual routing packages that enable faster deployment and lower implementation complexity
- The service segment is the fastest-growing component category, with a CAGR of 14% from 2026 to 2033, driven by rising demand for managed network services and outsourced virtual routing operations
Market Size & Forecast
- Global Market Value (2025): USD 55 Million
- Expected Market Value (2033): USD 2948.03 Million
- Forecast CAGR (2026–2033): 23.85%
- Leading Region in 2025: North America
- Fastest Growing Region: Asia-Pacific
Report Scope and Virtual Router Market Segmentation
|
Attributes |
Virtual Router Key Market Insights |
|
Segments Covered |
|
|
Countries Covered |
North America · U.S. · Canada · Mexico Europe · Germany · France · U.K. · Netherlands · Switzerland · Belgium · Russia · Italy · Spain · Turkey · Rest of Europe Asia-Pacific · China · Japan · India · South Korea · Singapore · Malaysia · Australia · Thailand · Indonesia · Philippines · Rest of Asia-Pacific Middle East and Africa · Saudi Arabia · U.A.E. · South Africa · Egypt · Israel · Rest of Middle East and Africa South America · Brazil · Argentina · Rest of South America |
|
Key Market Players |
· Cisco Systems, Inc. (U.S.) · Telefonaktiebolaget LM Ericsson (Sweden) · Huawei Technologies Co., Ltd. (China) · Nokia (Finland) · Juniper Networks, Inc. (U.S.) · IBM Corporation (U.S.) · netElastic (U.S.) · Hewlett Packard Enterprise Development LP (U.S.) · Arista Networks, Inc. (U.S.) · ZTE Corporation (China) · Palo Alto Networks, Inc. (U.S.) · Ross Video Ltd. (Canada) · 6WIND (France) · 128 Technology (U.S.) · TRENDnet (U.S.) · Belkin International, Inc. (U.S.) · Linksys (U.S.) · Allied Telesis, Inc. (Japan) · Check Point Software Technologies Ltd. (Israel) · DriveNets (Israel) |
|
Market Opportunities |
· Rising Demand for Virtual Routing Solutions in Edge Computing Infrastructure · Expanding Adoption of Virtual Routers Across Enterprise SD-WAN Deployments · Growing Investments in AI-Driven and Automated Network Management Solutions |
|
Value Added Data Infosets |
In addition to the market insights such as market value, growth rate, market segments, geographical coverage, market players, and market scenario, the market report curated by the Data Bridge Market Research team includes in-depth expert analysis, import/export analysis, pricing analysis, production consumption analysis, and pestle analysis. |
Virtual Router Market Trends
Trend: Growing Adoption of Cloud-Native and Software-Defined Networking Architectures
Organizations across telecom, cloud, and enterprise sectors are increasingly adopting cloud-native networking and software-defined architectures to improve network agility, scalability, and operational efficiency. Virtual routers are gaining significant traction as they enable flexible deployment across public cloud, private cloud, and hybrid environments while reducing dependence on proprietary hardware. Growing deployment of edge computing infrastructure and increasing demand for automated network management are further accelerating adoption of software-based routing technologies. The transition toward disaggregated networking models is also supporting widespread implementation of virtualized routing solutions.
Companies such as Nokia are actively expanding their cloud-native routing portfolio, and in June 2025 the company introduced enhanced 7705 Service Aggregation Router and 7250 Interconnect Router platforms to support modern IP networks and critical infrastructure applications, strengthening the adoption of virtualized and software-defined networking environments.
Virtual Router Market Dynamics
Key Market Driver: Increasing Deployment of 5G Networks and Network Function Virtualization Technologies
The rapid expansion of 5G networks and increasing adoption of network function virtualization technologies are significantly driving demand for virtual routers worldwide. Telecom operators are modernizing network infrastructure to support growing data traffic, ultra-low latency applications, and cloud-based service delivery. Virtual routing solutions enable service providers to improve network flexibility while lowering infrastructure and operational costs. Rising investments in edge computing and next-generation communication networks are further supporting market growth.
Major companies such as Vodafone Idea and Nokia are accelerating network modernization initiatives, and in March 2025 Nokia signed a three-year agreement with Vodafone Idea to expand and upgrade the operator's IP backhaul network using its 7750 Service Router and 7250 IXR solutions to enhance 4G and 5G connectivity capabilities.
Key Restraint/Challenge: Complexity in Managing Multi-Vendor and Hybrid Network Environments
A major challenge in the Virtual Router market is the complexity associated with managing multi-vendor and hybrid network infrastructures. Enterprises and service providers increasingly operate environments consisting of physical routers, virtual routing platforms, cloud infrastructure, and software-defined networks from multiple vendors, creating interoperability and orchestration challenges. Ensuring seamless traffic management, security, and performance optimization across heterogeneous networks requires advanced expertise and sophisticated management tools. Integration issues and compatibility requirements can increase deployment costs and prolong implementation timelines.
The acquisition of Juniper Networks by Hewlett Packard Enterprise in July 2025 highlights the growing importance of unified networking ecosystems, as organizations are seeking integrated solutions capable of simplifying operations across increasingly complex and multi-vendor network environments.
Key Market Opportunity: Expanding Adoption of Virtual Routers Across Enterprise SD-WAN Deployments
The increasing adoption of SD-WAN technologies across enterprises is creating significant growth opportunities for the Virtual Router market. Organizations are deploying software-defined wide area networks to improve connectivity, optimize application performance, and support hybrid work environments. Virtual routers play a critical role in SD-WAN architectures by enabling centralized traffic management and flexible service deployment across distributed networks. Rising cloud migration and increasing dependence on digital applications are further enhancing demand for software-based routing solutions.
Companies such as Cisco Systems and HPE Aruba Networking are actively expanding their SD-WAN portfolios to address enterprise requirements. Cisco's continued investments in SD-WAN and secure networking solutions are supporting broader deployment of virtual routing technologies across enterprises seeking scalable and cost-efficient network architectures.
Virtual Router Market Scope
The virtual router market is segmented on the basis of component, type, and end users.
- By Component
On the basis of component, the Virtual Router Market is segmented into solution and service. The Solution segment dominated the market with the largest share of 62% in 2025, driven by widespread deployment of software-defined networking and NFV-based routing solutions across telecom and cloud environments. Enterprises and service providers increasingly prefer virtual router software for scalable traffic management and network agility. Strong demand for cost-efficient network virtualization is further strengthening adoption across large-scale data centers. Integration with SD-WAN and cloud-native architectures continues to reinforce segment leadership. The segment benefits from rapid digital transformation initiatives across communication networks.
The Service segment is projected to register the fastest growth at a CAGR of 14% from 2026 to 2033, driven by rising demand for managed network services and outsourced virtual routing operations. Organizations are increasingly relying on third-party expertise to handle complex deployment, orchestration, and maintenance of virtual router infrastructure. Growing adoption of hybrid cloud environments is further increasing service requirements for continuous optimization and monitoring. Expansion of telecom modernization programs is accelerating reliance on consulting and integration services. Increasing focus on operational efficiency and reduced in-house network complexity is supporting rapid service segment expansion.
- By Type
On the basis of type, the Virtual Router Market is segmented into custom and predefined solutions. The Predefined segment dominated the market with a share of 58% in 2025, driven by strong demand for standardized virtual routing packages that enable faster deployment and lower implementation complexity. Telecom operators and enterprises prefer predefined configurations for quick scalability and reduced configuration overhead. Widespread availability of vendor-supported templates across cloud platforms is strengthening adoption. Cost efficiency and ease of integration with existing network infrastructure further support market dominance. Continuous upgrades from vendors are improving performance and reliability across standardized offerings.
The Custom segment is projected to register the fastest growth at a CAGR of 15% from 2026 to 2033, driven by increasing need for tailored routing architectures in complex enterprise and telecom environments. Organizations with specialized workloads require customized virtual routing capabilities to optimize performance and security. Rising adoption of hybrid and multi-cloud strategies is further accelerating demand for flexible configuration models. Enterprises are investing in bespoke network designs to support latency-sensitive applications and large-scale data traffic management. Growing emphasis on differentiated network performance is significantly boosting custom solution deployment across advanced digital ecosystems.
- By End Users
On the basis of end users, the Virtual Router Market is segmented into service providers and enterprises. The Service Providers segment dominated the market with the largest share of 65% in 2025, driven by extensive adoption of virtual routing technologies by telecom operators, ISPs, and cloud providers. These organizations require high-performance routing capabilities to manage massive and dynamic network traffic efficiently. Rapid expansion of 5G infrastructure and edge computing networks is further strengthening deployment. Strong investment in network virtualization to reduce hardware dependency supports continued dominance. The segment benefits from large-scale modernization of global communication infrastructure.
The Enterprises segment is projected to register the fastest growth at a CAGR of 16% from 2026 to 2033, driven by accelerating digital transformation across IT, BFSI, and manufacturing sectors. Enterprises are increasingly adopting virtual routers to enhance network flexibility, security, and cloud connectivity. Rising use of remote work models and distributed IT architectures is boosting demand for scalable routing solutions. Integration of virtual routers with cloud-native applications and SD-WAN platforms is further supporting adoption. Increasing focus on reducing operational costs and improving network agility is driving rapid enterprise segment expansion.
Virtual Router Market Regional Analysis
North America dominated the virtual router market and accounted for the largest revenue share of 40% in 2025, driven by early adoption of network function virtualization technologies, strong cloud infrastructure, and increasing deployment of software-defined networking solutions across enterprises and telecom operators. The region benefits from widespread digital transformation initiatives and growing investments in 5G and edge computing infrastructure. Organizations across IT and telecom, BFSI, healthcare, and government sectors are increasingly implementing virtual routing solutions to improve network scalability and reduce hardware dependency. Rising demand for secure and flexible network architectures is further supporting market expansion. In addition, the presence of leading networking technology companies continues to strengthen North America’s leadership position in the global market.
U.S. Virtual Router Market Insight
The U.S. Virtual Router market is experiencing strong growth driven by rapid expansion of cloud computing, increasing adoption of SD-WAN technologies, and rising investments in next-generation communication infrastructure. Enterprises and telecom operators are increasingly deploying virtual routers to improve network efficiency and support growing data traffic volumes. The country’s advanced data center ecosystem and strong presence of major cloud service providers are enabling seamless integration of software-based networking solutions. Increasing rollout of 5G networks is creating additional opportunities for virtualized network infrastructure. In addition, growing emphasis on automation and network agility is accelerating market growth across the U.S.
Canada Virtual Router Market Insight
The Canada Virtual Router market is witnessing steady growth supported by increasing cloud adoption and rising investments in modern communication networks. Enterprises are increasingly implementing virtual routing technologies to enhance operational flexibility and optimize network performance. Growing demand for secure and scalable networking solutions across banking, healthcare, and IT sectors is supporting market development. Expansion of digital services and increasing reliance on remote connectivity are further contributing to adoption. In addition, continuous investments in telecommunications infrastructure are strengthening market growth in Canada.
Europe Virtual Router Market Insight
The Europe Virtual Router market is expanding steadily due to increasing deployment of virtualized network infrastructure and rising adoption of cloud-native technologies. The region benefits from strong digital transformation initiatives and growing demand for flexible networking solutions across enterprises and service providers. Organizations in manufacturing, automotive, financial services, and telecommunications sectors are increasingly adopting virtual routers to improve network management and reduce infrastructure costs. Rising investments in edge computing and 5G connectivity are further supporting market growth. In addition, growing emphasis on secure and energy-efficient network architectures is accelerating regional expansion.
U.K. Virtual Router Market Insight
The U.K. Virtual Router market is growing steadily, driven by increasing cloud migration, rising deployment of SD-WAN solutions, and strong demand for agile network infrastructure. Enterprises are focusing on virtualized networking technologies to support digital transformation and remote connectivity requirements. The country's mature telecommunications sector and advanced digital ecosystem are creating favorable conditions for adoption. Growing investments in 5G deployment and edge computing are further strengthening market opportunities. In addition, increasing focus on reducing network operational costs is supporting expansion in the U.K.
Germany Virtual Router Market Insight
The Germany Virtual Router market is expanding due to strong industrial digitization, increasing adoption of Industry 4.0 technologies, and rising investments in software-defined networking infrastructure. Enterprises across manufacturing, automotive, and industrial sectors are implementing virtual routing solutions to improve connectivity and network efficiency. Growing demand for secure and scalable communication systems is supporting market development. The country's strong focus on automation and digital innovation is encouraging adoption of advanced networking technologies. In addition, increasing deployment of private 5G networks is further accelerating market growth in Germany.
Asia-Pacific Virtual Router Market Insight
The Asia-Pacific Virtual Router market is expected to register the fastest growth with a CAGR of 24.3% from 2026 to 2033, driven by rapid digitalization, increasing internet penetration, and expanding deployment of 5G networks. Growing investments in cloud computing infrastructure and data centers are significantly boosting demand for software-based routing technologies. Countries such as China, India, Japan, and South Korea are witnessing strong adoption of network virtualization solutions across telecom and enterprise sectors. Rising digital transformation initiatives among SMEs and large organizations are further supporting market expansion. In addition, increasing demand for cost-effective and scalable network infrastructure is accelerating regional growth.
Japan Virtual Router Market Insight
The Japan Virtual Router market is witnessing steady growth supported by high technology adoption, strong investments in 5G infrastructure, and increasing demand for advanced networking solutions. Enterprises are deploying virtual routers to improve network flexibility and support growing digital workloads. The country's well-developed telecommunications infrastructure and focus on automation are supporting market expansion. Rising adoption of cloud services and edge computing technologies is further creating growth opportunities. In addition, increasing focus on enhancing network efficiency is strengthening demand in Japan.
China Virtual Router Market Insight
The China Virtual Router market is growing rapidly due to large-scale expansion of cloud infrastructure, strong deployment of 5G networks, and increasing investments in digital transformation initiatives. Telecom operators and enterprises are actively adopting virtual routing technologies to manage rising data traffic and improve network scalability. The country's robust digital ecosystem and strong presence of major technology companies are enabling rapid adoption of software-defined networking solutions. Increasing demand for data center modernization and intelligent network management is further supporting market growth. In addition, rising government initiatives promoting digital infrastructure development are accelerating expansion in China.
Virtual Router Market Share
The virtual router industry is primarily led by well-established companies, including:
- Cisco Systems, Inc. (U.S.)
- Telefonaktiebolaget LM Ericsson (Sweden)
- Huawei Technologies Co., Ltd. (China)
- Nokia (Finland)
- Juniper Networks, Inc. (U.S.)
- IBM Corporation (U.S.)
- netElastic (U.S.)
- Hewlett Packard Enterprise Development LP (U.S.)
- Arista Networks, Inc. (U.S.)
- ZTE Corporation (China)
- Palo Alto Networks, Inc. (U.S.)
- Ross Video Ltd. (Canada)
- 6WIND (France)
- 128 Technology (U.S.)
- TRENDnet (U.S.)
- Belkin International, Inc. (U.S.)
- Linksys (U.S.)
- Allied Telesis, Inc. (Japan)
- Check Point Software Technologies Ltd. (Israel)
- DriveNets (Israel)
Latest Developments in Virtual Router Market
- In July 2025, Hewlett Packard Enterprise completed the acquisition of Juniper Networks in a transaction valued at approximately USD 14 billion, significantly strengthening its AI-driven networking and cloud-native infrastructure portfolio. The acquisition is expected to accelerate innovation in software-defined networking and virtual routing technologies, supporting broader adoption of scalable and intelligent network architectures across enterprise and telecom environments
- In June 2025, Nokia expanded its IP routing portfolio with enhanced 7705 Service Aggregation Router and 7250 Interconnect Router platforms aimed at utility and smart grid applications. This development is strengthening the Virtual Router market by increasing demand for advanced software-based routing solutions and supporting the modernization of critical communication infrastructure
- In June 2025, Cisco Systems and VAST Data expanded their strategic partnership to deliver integrated AI infrastructure solutions that combine networking platforms with AI operating systems. The collaboration is expected to enhance the performance of virtualized networks and accelerate the deployment of intelligent routing solutions across enterprise data centers
- In March 2025, Nokia entered into a three-year agreement with Vodafone Idea to upgrade and expand the operator’s IP backhaul network using its 7750 Service Router and 7250 IXR solutions. This development is contributing to the growth of the Virtual Router market by supporting increasing 4G and 5G traffic demands and encouraging wider adoption of virtualized network infrastructure
- In March 2025, Cisco Systems, Nokia, AMD, and Jio Platforms announced a partnership to develop an Open Telecom AI Platform focused on improving network intelligence and automation capabilities. The initiative is expected to promote the adoption of AI-enabled virtual routing technologies and strengthen the evolution of next-generation telecom networks worldwide
SKU-

- Interactive Data Analysis Dashboard
- Company Analysis Dashboard for high growth potential opportunities
- Research Analyst Access for customization & queries
- Competitor Analysis with Interactive dashboard
- Latest News, Updates & Trend analysis
- Harness the Power of Benchmark Analysis for Comprehensive Competitor Tracking
Data collection and base year analysis are done using data collection modules with large sample sizes. The stage includes obtaining market information or related data through various sources and strategies. It includes examining and planning all the data acquired from the past in advance. It likewise envelops the examination of information inconsistencies seen across different information sources. The market data is analysed and estimated using market statistical and coherent models. Also, market share analysis and key trend analysis are the major success factors in the market report. To know more, please request an analyst call or drop down your inquiry.
The key research methodology used by DBMR research team is data triangulation which involves data mining, analysis of the impact of data variables on the market and primary (industry expert) validation. Data models include Vendor Positioning Grid, Market Time Line Analysis, Market Overview and Guide, Company Positioning Grid, Patent Analysis, Pricing Analysis, Company Market Share Analysis, Standards of Measurement, Global versus Regional and Vendor Share Analysis. To know more about the research methodology, drop in an inquiry to speak to our industry experts.
Data Bridge Market Research is a leader in advanced formative research. We take pride in servicing our existing and new customers with data and analysis that match and suits their goal. The report can be customized to include price trend analysis of target brands understanding the market for additional countries (ask for the list of countries), clinical trial results data, literature review, refurbished market and product base analysis. Market analysis of target competitors can be analyzed from technology-based analysis to market portfolio strategies. We can add as many competitors that you require data about in the format and data style you are looking for. Our team of analysts can also provide you data in crude raw excel files pivot tables (Fact book) or can assist you in creating presentations from the data sets available in the report.


