Middle East and Africa Accounts Payable Automation Market, By Component (Solutions and Services), Organization Size (Large Enterprise and Small and Medium Enterprise), Process (Invoice Capture, Invoice Approval, Payment Authorization, Payment Execution, and Export), Deployment Mode (Cloud and On-Premise), Vertical (Manufacturing, Consumer Goods and Retail, Energy and Utilities, Healthcare, Banking, Financial Services, and Insurance, IT and Telecom, Government, Automotive, and Others) – Industry Trends and Forecast to 2029
Middle East and Africa Accounts Payable Automation Market Analysis and Size
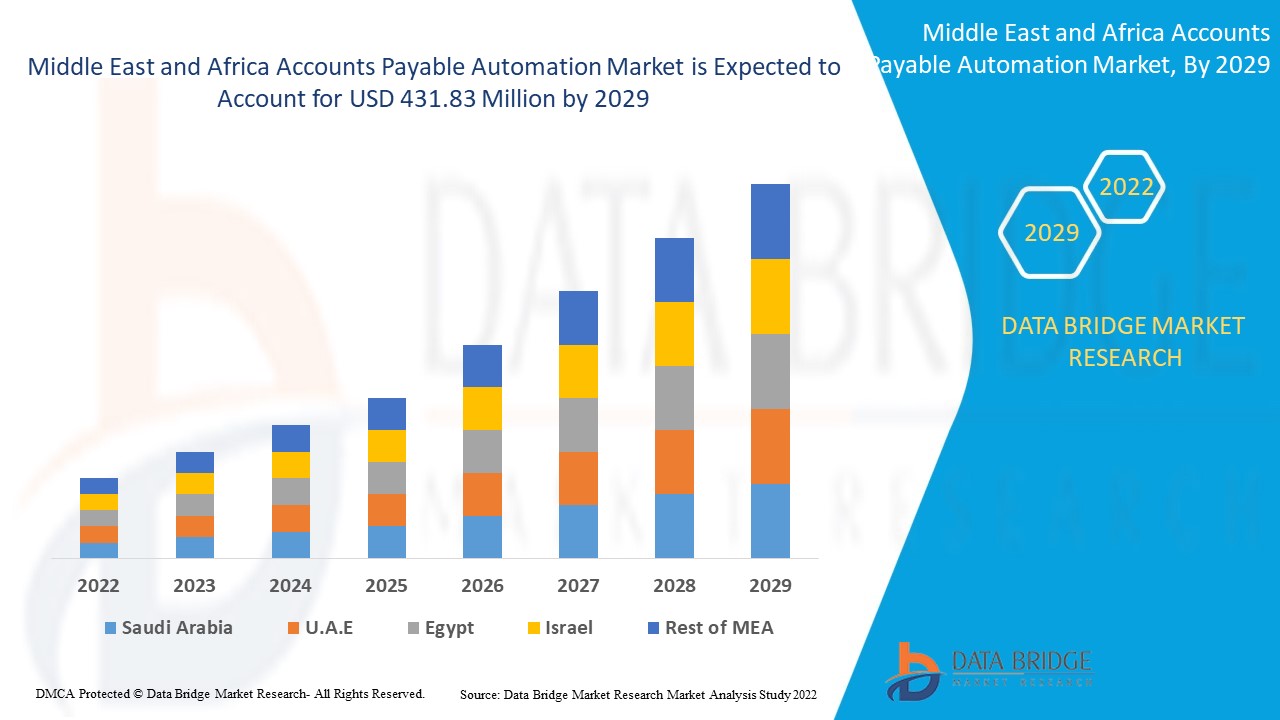
Account payable is important to ensure payment of bills on a timely basis, which improves the company's credit rating. This increasing demand for account payable bill generation is due to the timely payment of invoices, ensuring an uninterrupted flow of supplies and services. Timely payment avoids overdue payments and penalties. The Middle East and Africa accounts payable automation market is growing rapidly due to AL, ML, and cloud services. The companies are even launching new software to gain a larger market share.
Data Bridge Market Research analyses that the accounts payable automation market are expected to reach USD 431.83 million by 2029, at a CAGR of 10.1% from 2022 to 2029. "Solutions" accounts for the most prominent modules mode segment.
|
Report Metric |
Details |
|
Forecast Period |
2022 to 2029 |
|
Base Year |
2021 |
|
Historic Years |
2020 (Customizable to 2019 - 2014) |
|
Quantitative Units |
USD Million in 2022 |
|
Segments Covered |
By Components (Solution and Services), Organization Size (Large Enterprise and Small and Medium Enterprise), Process (Invoice Capture, Invoice Approval, Payment Authorization, Payment Execution, and Export), Deployment Mode (Cloud and On-Premise), Vertical (Manufacturing, Consumer Goods and Retail, Energy and Utilities, Healthcare, Banking, Financial Services, and Insurance, IT and Telecom, Government, Automotive, and Others) |
|
Countries Covered |
UAE, Saudi Arabia, Israel, South Africa, Egypt, the Rest of the Middle East and Africa |
|
Market Players Covered |
|
Market Definition
Accounts Payable (AP) Automation is the act of processing invoices in a digital format and through a touchless process using an AP automation solution. In an ideal situation, 100% of invoices a company receives can be processed automatically without human intervention. AP automation is more than just Optical Character Recognition (OCR). It is automation across the entire AP process, from data capture using OCR or digital invoice formats (such as EDI and e-invoices) through AP workflow, such as routing, coding, reviewing, and approving invoices and automatically matching them to Purchase Orders (PO), to the seamless integration with your Enterprise Resource Planning system.
The Middle East and Africa Accounts Payable Automation Market Dynamics
This section deals with understanding the market drivers, advantages, opportunities, restraints, and challenges. All of this is discussed in detail below:
Drivers
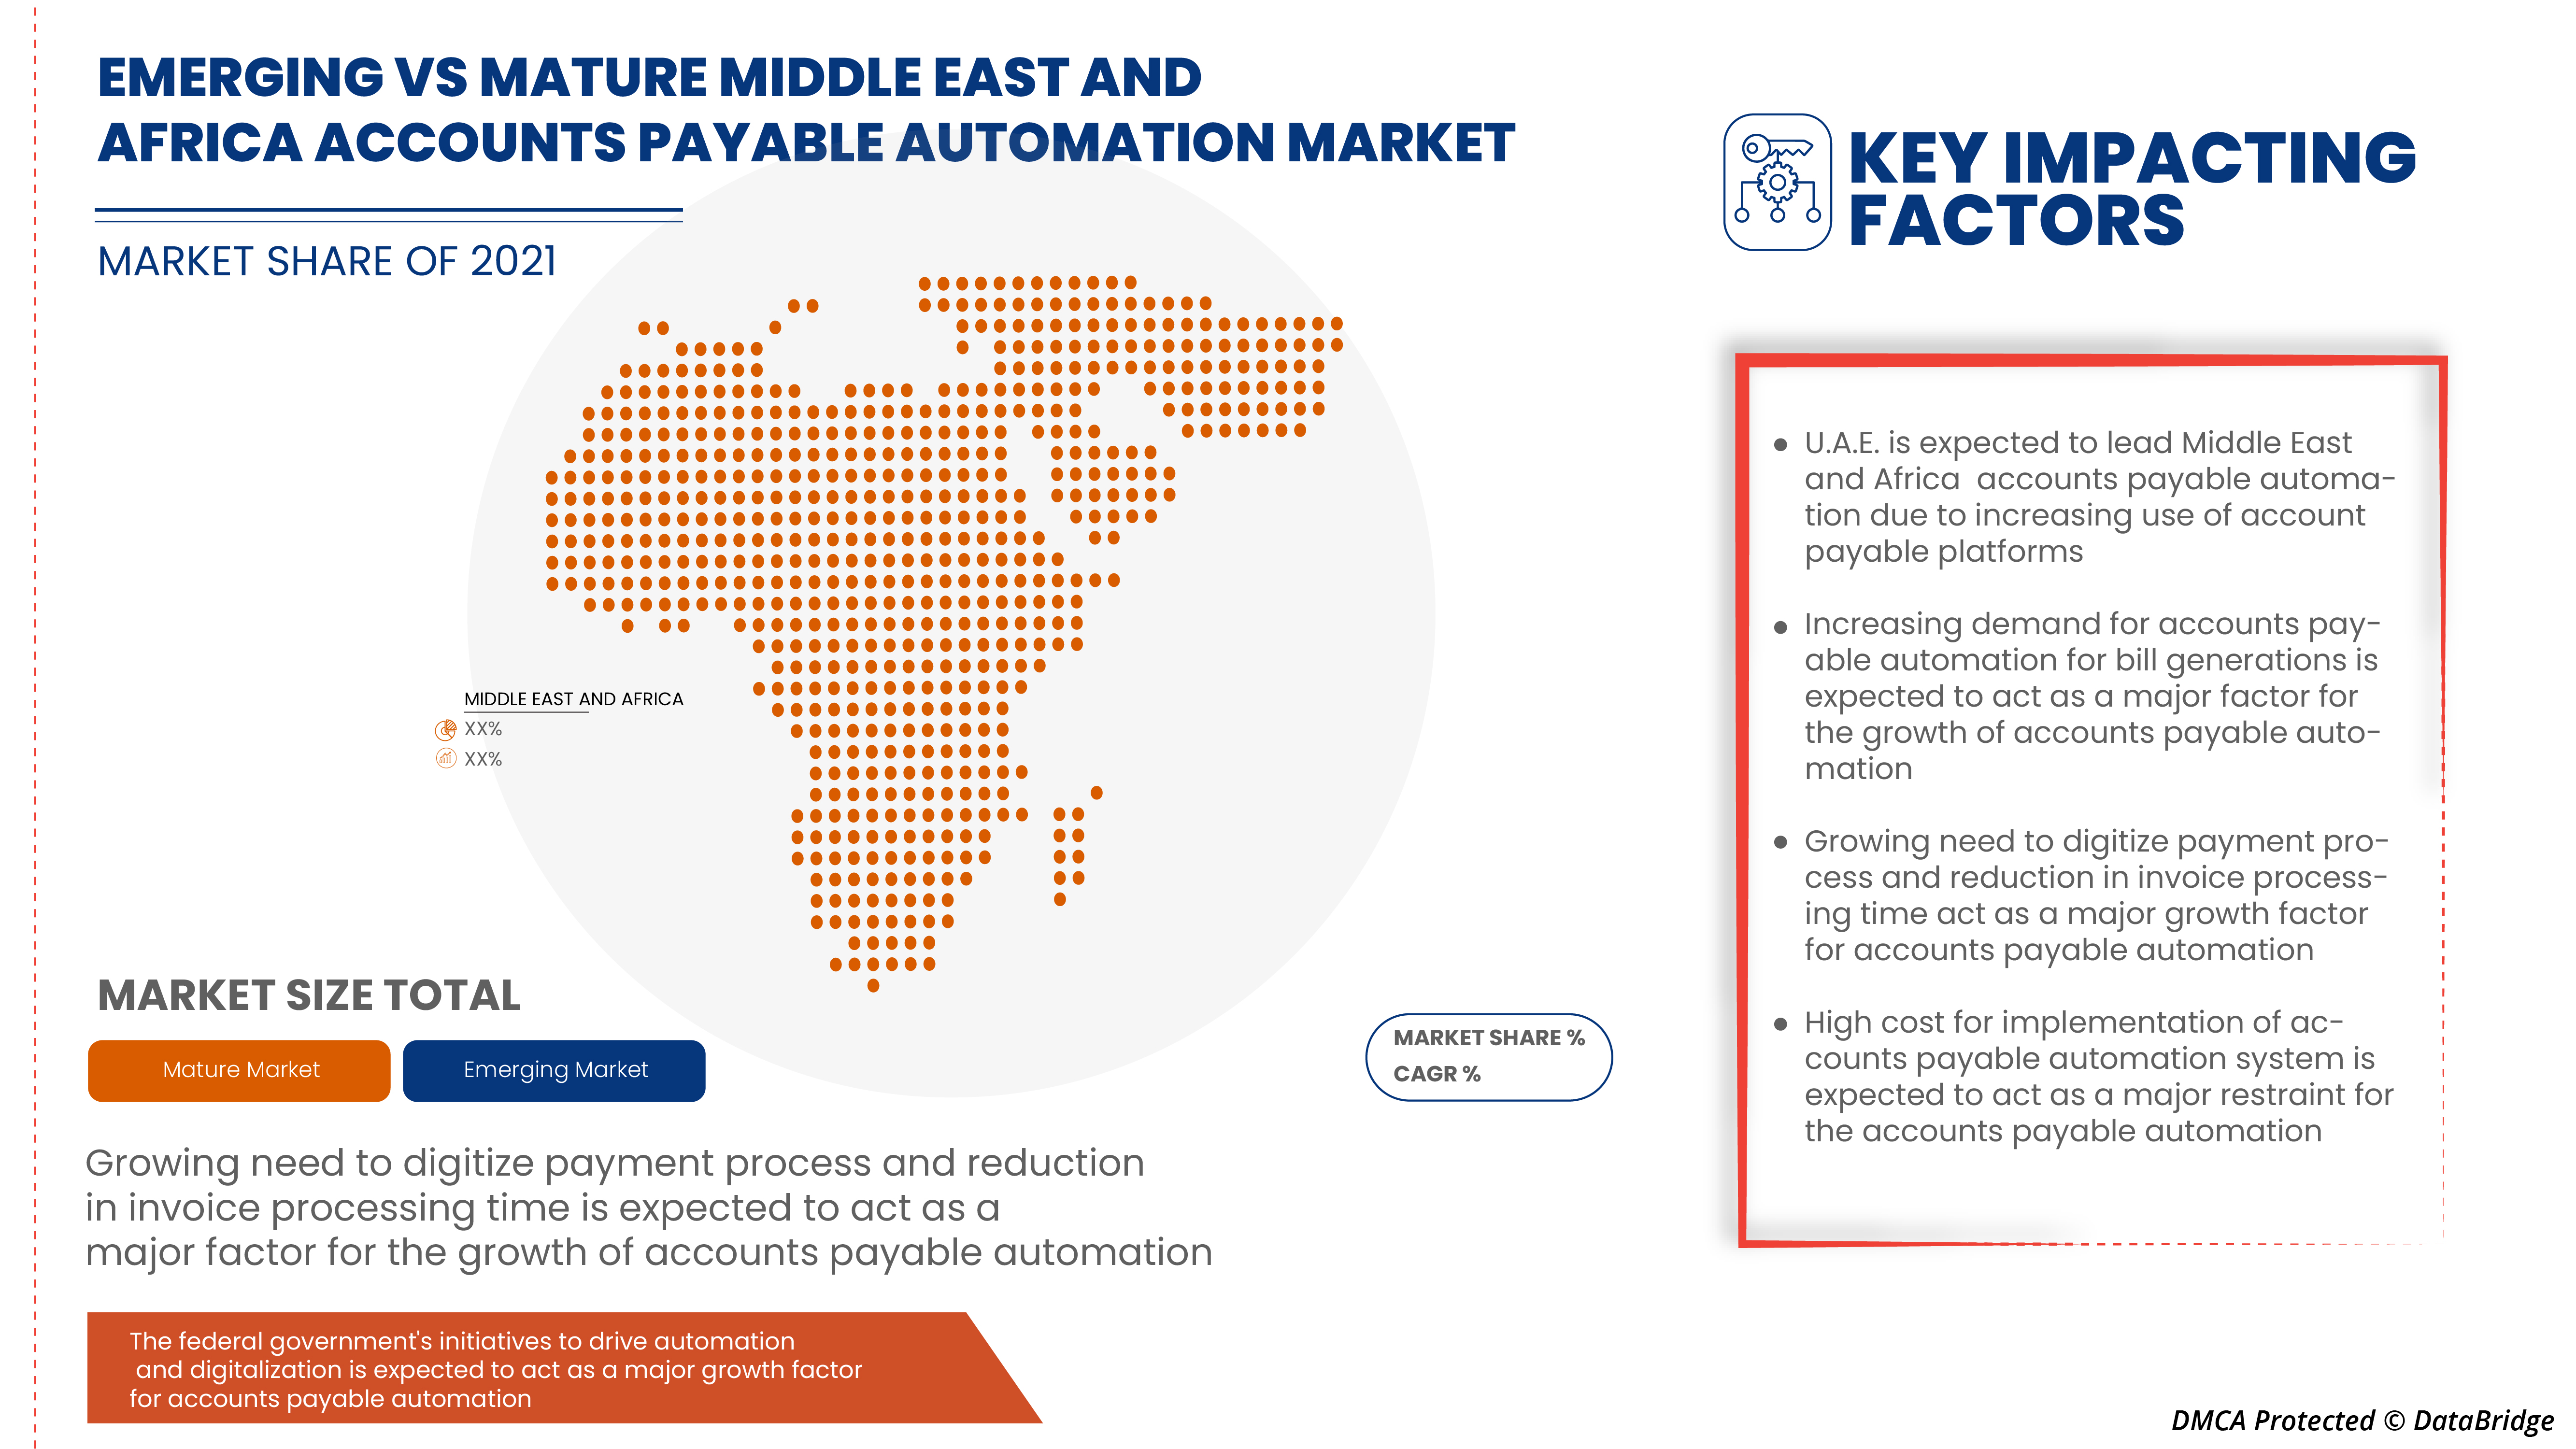
- Growth in the need to digitize the payment process and reduction in invoice processing time
The growth of digitalization is revolutionizing the interaction between customers and businesses and building a new platform for the interaction of ideas. Digitalization is the process of converting information into digital information by using various data and software. Since 2009 there has been a transformation of financial institutions towards digitalization by integrating digital technologies. Digital transformation has provided automation, better services, and efficiency to financial processes. Even the customers are inclined more towards digital platforms for the transaction of their financial assets; this has even boosted up more during this pandemic. The increasing need to digitize payment processes and reduce invoice time is thus leading to the growth of the global account payable automation market.
- Increasing demand for account payable automation for bill generation
Account payable is important to ensure payment of bills on a timely basis, which improves the company's credit rating. This increasing demand for account payable bill generation due to the timely payment of invoices ensures an uninterrupted flow of supplies and services. Timely payment avoids overdue payments, penalties, and other late fees among organizations, thus creating huge growth for the global account payable automation market.
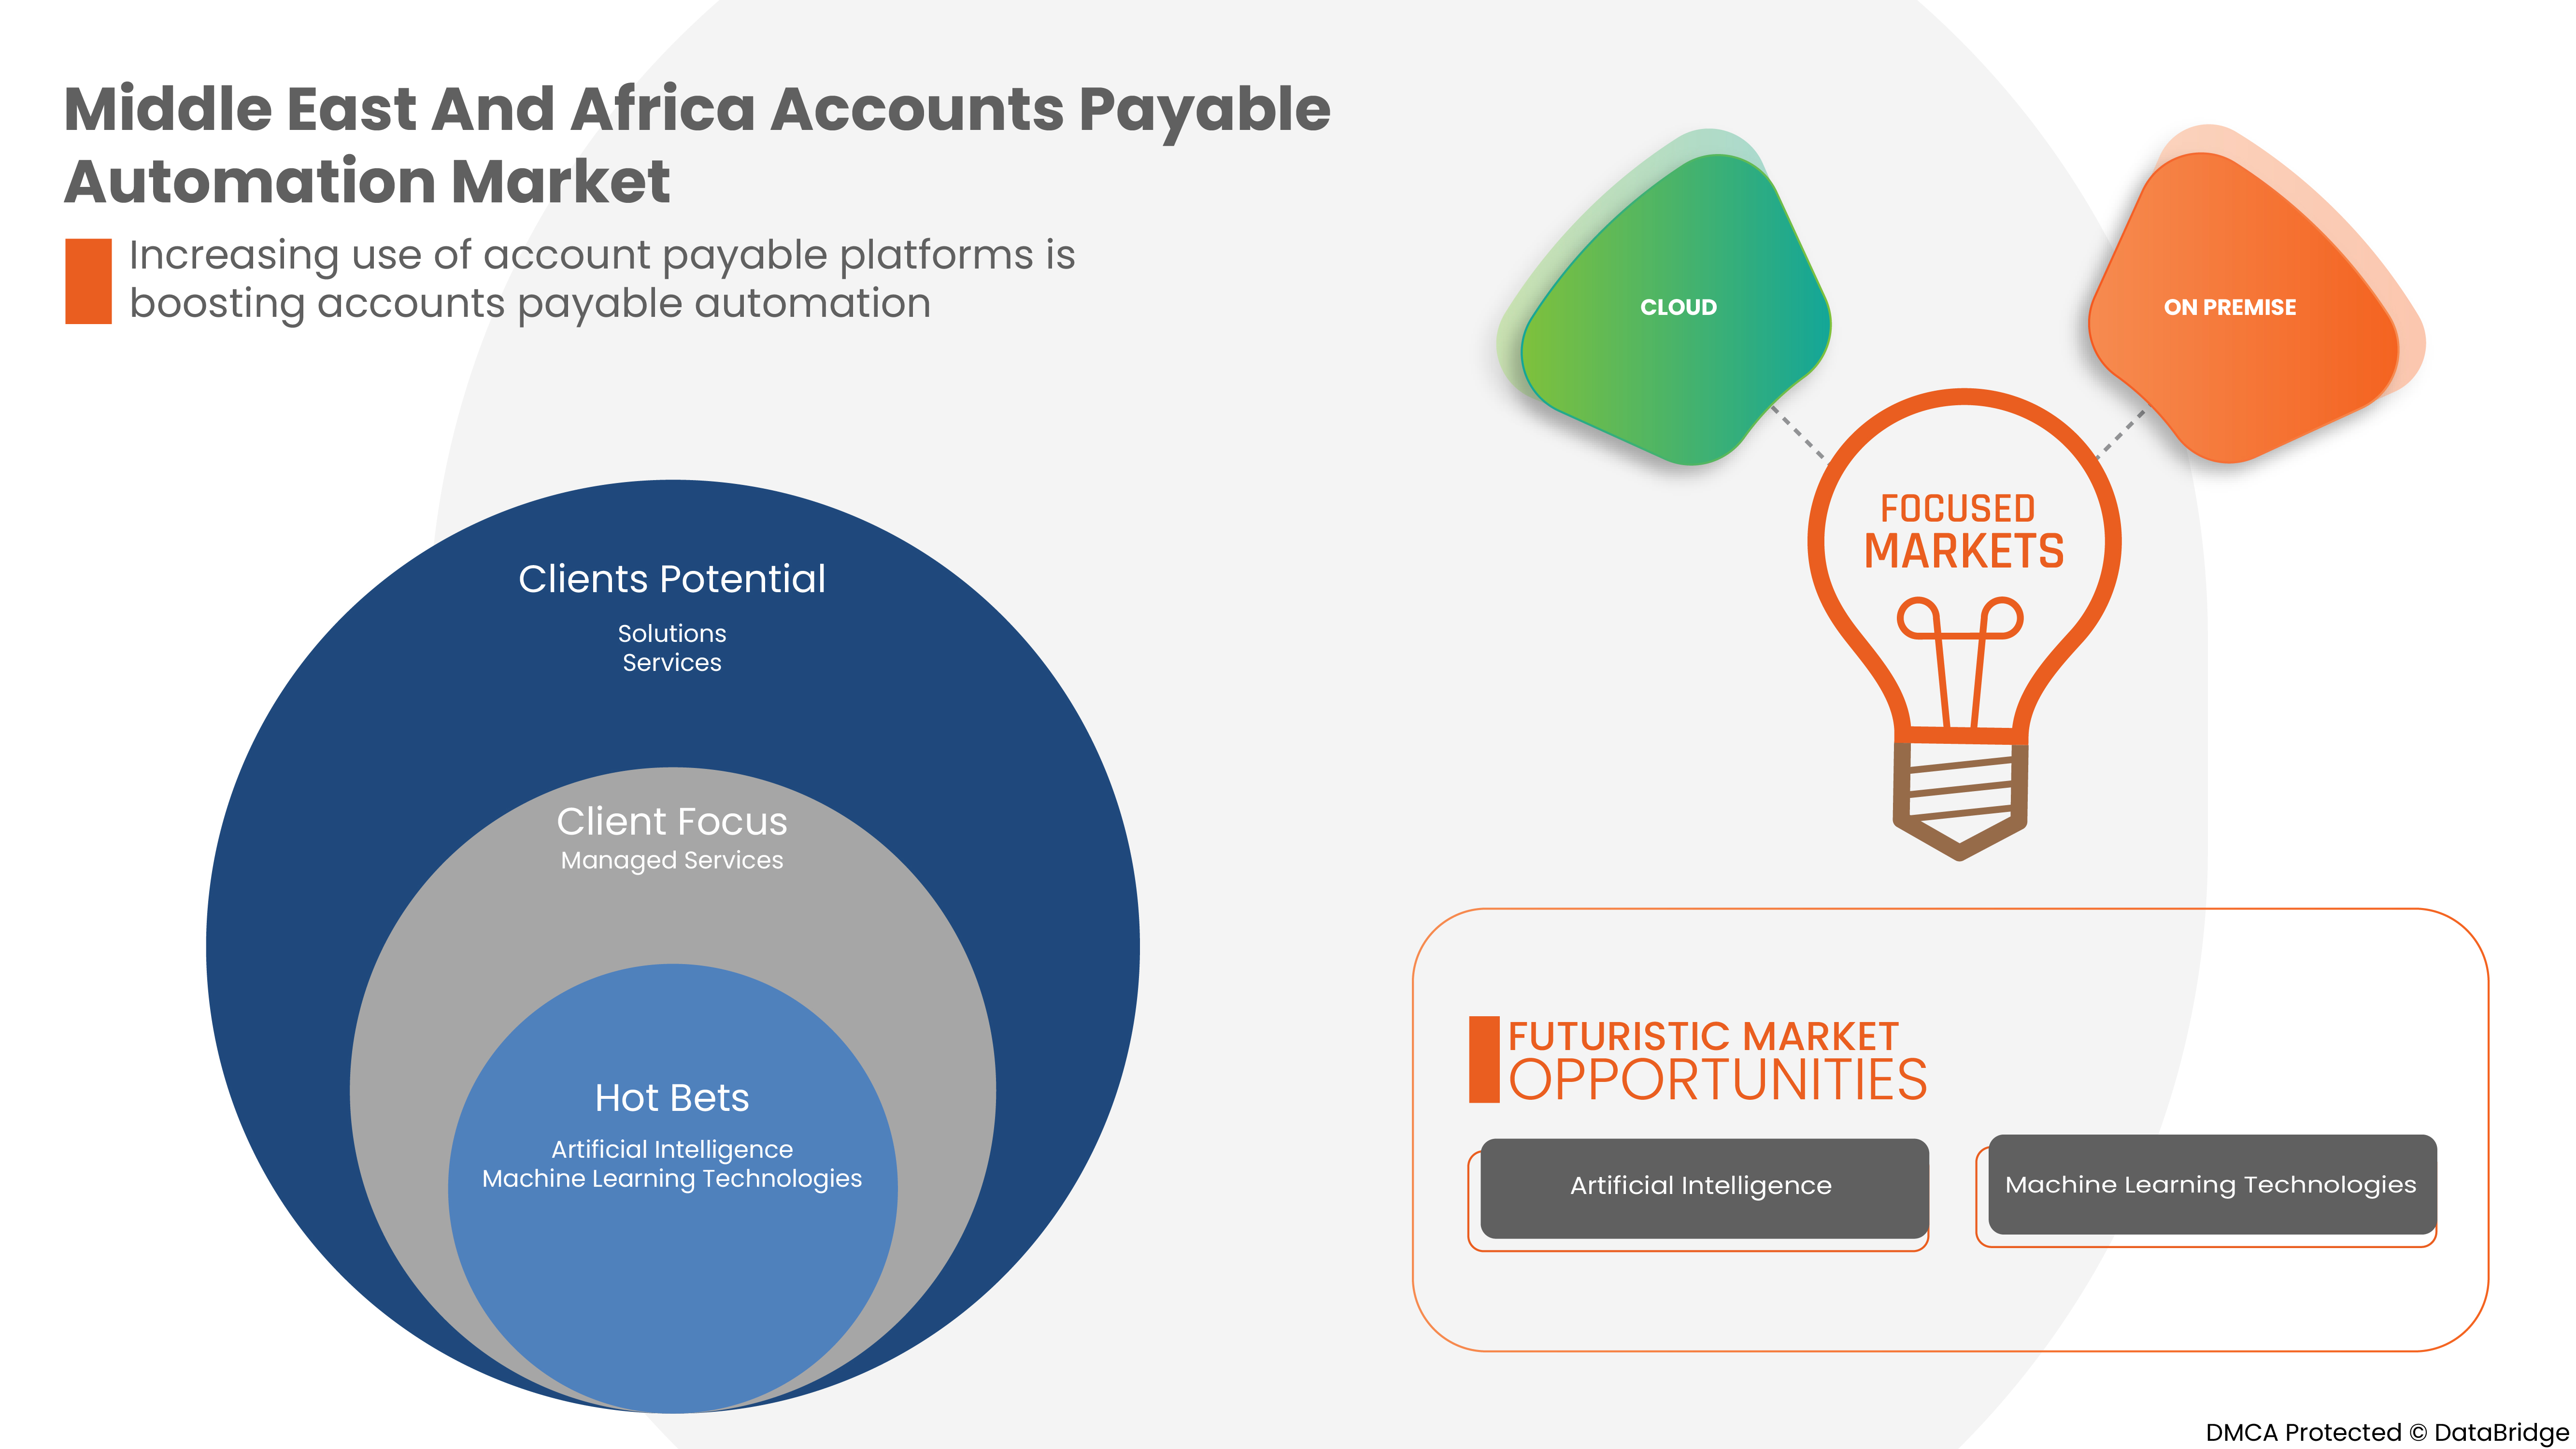
- Increase in the use of account payable platforms
Individual companies are getting more accustomed to account payable platforms for making transactions for their basic usage, such as gaining basic information, buying goods, or using it as a platform for their business.
Restraints/Challenges
- Higher cost for implementation of account payable automation systems
Generally, the cost of account payable automation depends on the specific needs and application. However, purchasing and implementing automation software in various systems for streamlining the transaction processes can seem daunting and expensive. Hence the higher cost can raise an issue in some companies, where the budget allocated for the system set up by the company remains unvaried.
- Rise in complexities of payable automation systems in large enterprises
Payable automation systems and software have been implemented across the globe to benefit from decreasing the necessity for human staff and to perform repetitive tasks by implementing automated machine processes instead. But the higher the system's complexity, the greater the risk that a system failure would seriously affect payable-related functioning. Many critical system failures, especially involving the assembly lines, would require restoring manual procedures for managing data and payment information of different clients. Although in most companies, it is found that resources are a limiting factor for development. A traditional way to manage the bills and coordinate schedules of payments to the supplier's connections manually.
Post COVID-19 Impact on Middle East and Africa Accounts Payable Automation Market
The confinement and lockdown period during the COVID-19 crisis has shown the importance of good, reliable internet connectivity in a large industry. A high-speed connection in the large industry has allowed efficient teleworking, maintaining entertainment habits, and keeping close contacts. Data traffic in all networks has increased significantly during the pandemic period. COVID-19 has increased the demand for data integration in the market. Fixed broadband networks have gained immense popularity for keeping the world connected. Traffic grew 30-40% overnight, driven primarily by working from large industries (video conferencing and collaboration, VPNs), learning from large industries (video conferencing and collaboration, e-learning platforms), and entertainment (online gaming, video streaming, social media). Moreover, limited supply and shortage of software have significantly affected data integration in the market. The flow of new equipment, such as computers, servers, switches, and Customer Premise Equipment (CPE), has either been fully stopped or delayed, with lead times of up to 12 months for different items.
Manufacturers are making various strategic decisions to bounce back post-COVID-19. The players are conducting multiple research and development activities to improve the technology involved in data integration. With this, the companies will bring advanced data integration to the market.
Recent Development
- In January 2022, SAP SE partnered with Icertis to deliver enterprise contract intelligence. The partnership took place to expand solution portfolio of contract management. The partnership will leverage the company's technology to deliver more valuable services to their customer base
- In November 2021, Oracle Corporation launched an oracle fusion ERP analytics instrument for financial insights. This solution was designed to enable data process easier. This solution was a reliable solution for large-sized and mid-sized businesses, thereby helping the company to expand its market
Middle East and Africa Accounts Payable Automation Market Scope
The Middle East and Africa accounts payable automation market is segmented based on components, organization size, deployment modes, vertical, and process. The growth amongst these segments will help you analyze meager growth segments in the industries and provide the users with a valuable market overview and market insights to help them make strategic decisions for identifying core market applications.
By Component
- Solutions
- Services
On the basis of component, the Middle East and Africa accounts payable automation market is segmented into solutions and services.
By Organization Size
- Large Enterprise
- Small And Medium Enterprise
On the basis of organization size, the Middle East and Africa accounts payable automation market has been segmented into large enterprise and small and medium enterprise.
By Process
- Invoice Capture,
- Invoice Approval
- Payment Authorization
- Payment Execution
- Export
On the basis of process, the Middle East and Africa account payable automation market has been segmented into invoice capture, invoice approval, payment authorization, payment execution, and export.
By Delpoyment Mode
- Cloud
- On-Premise
On the basis of deployment mode, the Middle East and Africa accounts payable automation market has been segmented into cloud and on-premise.
By Vertical
- Manufacturing
- Consumer Goods And Retail
- Energy and Utilities
- Healthcare
- Banking, Financial Services
- Insurance
- IT and Telecom
- Government
- Automotive
- Others
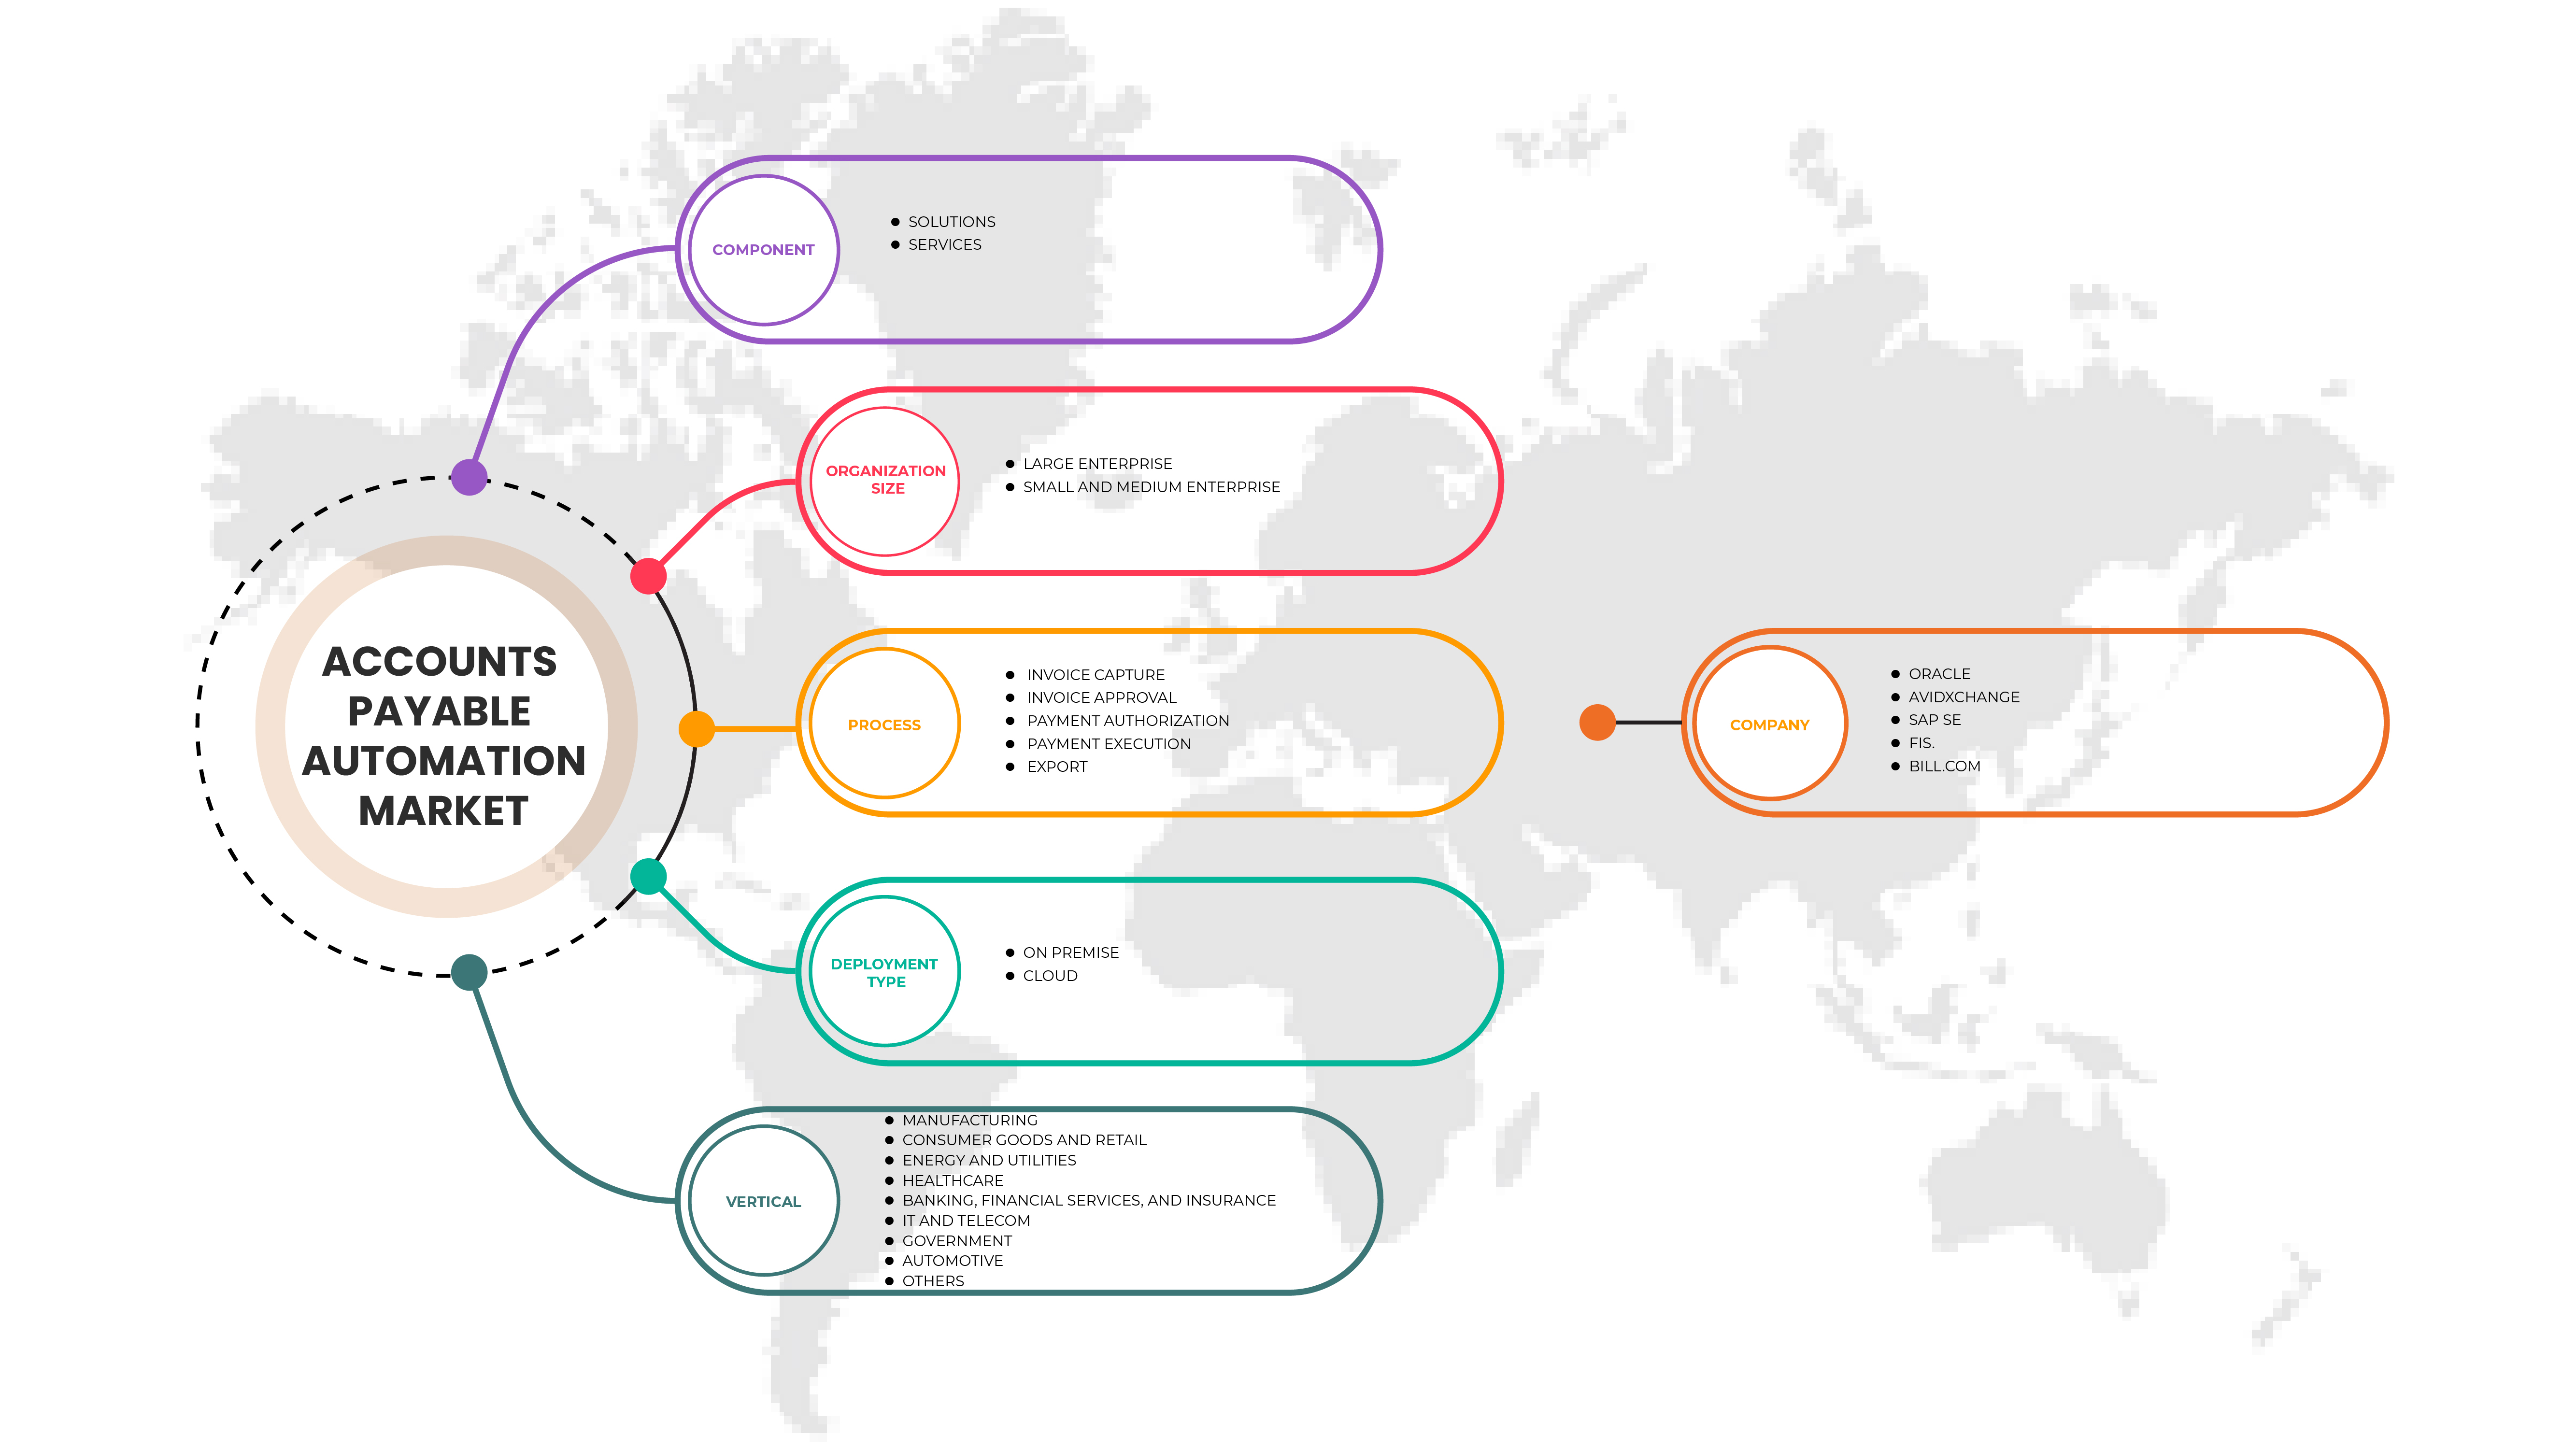
On the basis of vertical, the Middle East and Africa accounts payable automation market has been segmented into manufacturing, consumer goods and retail, energy and utilities, healthcare, banking, financial services and insurance, IT and telecom, government, automotive, and others.
Middle East and Africa Accounts Payable Automation Market Regional Analysis/Insights
The Middle East and Africa accounts payable automation market is analyzed. As referenced above, market size insights and trends are provided by country, organization size, deployment mode, component, vertical, and process, as referenced above.
The countries covered in the Middle East and Africa accounts payable automation market report are UAE, Saudi Arabia, Israel, South Africa, Egypt, and the Rest of Middle East and Africa.
UAE is expected to dominate the Middle East and Africa accounts payable automation market as the country is witnessing increasing Hybrid automation has been in use lately due to its ability to connect applications, data files, and business partners across cloud and on-premises systems and also accounts payable automation compliance program is a set of regulations or rules that a financial institution, companies such as large enterprises, small enterprises, and medium enterprises must follow to prevent data loss and the growth of the country in the Middle East and Africa accounts payable automation market.
The country section of the report also provides individual market-impacting factors and market regulation changes that impact the market's current and future trends. Data points like downstream and upstream value chain analysis, technical trends, porter's five forces analysis, and case studies are some of the pointers used to forecast the market scenario for individual countries. Also, the presence and availability of Global brands and their challenges faced due to large or scarce competition from local and domestic brands, the impact of domestic tariffs, and trade routes are considered while providing forecast analysis of the country data.
Competitive Landscape and Middle East and Africa Accounts Payable Automation Market Share Analysis
The Middle East and Africa accounts payable automation market competitive landscape provides details by competitors. Details include company overview, company financials, revenue generated, market potential, investment in research and development, new market initiatives, Global presence, production sites and facilities, production capacities, company strengths and weaknesses, product launch, product width and breadth, and application dominance. The above data points provided are only related to the companies' focus related to Middle East and Africa accounts payable automation market.
Some of the major players operating in the Middle East and Africa accounts payable automation market are:
- Oracle Corporation
- AvidXchange
- SAP SE
- FIS.
- FLEETCOR TECHNOLOGIES, INC.
- Kofax Inc.
- Coupa Software Inc.
- FreshBooks
- Zycus Inc.
- Comarch SA.
- Zoho Corporation Pvt. Ltd.
- Bottomline Technologies, Inc.
SKU-
세계 최초의 시장 정보 클라우드 보고서에 온라인으로 접속하세요

- 대화형 데이터 분석 대시보드
- 높은 성장 잠재력 기회를 위한 회사 분석 대시보드
- 사용자 정의 및 질의를 위한 리서치 분석가 액세스
- 대화형 대시보드를 통한 경쟁자 분석
- 최신 뉴스, 업데이트 및 추세 분석
- 포괄적인 경쟁자 추적을 위한 벤치마크 분석의 힘 활용
목차
1 서론
1.1 연구 목적
1.2 시장 정의
1.3 중동 및 아프리카 미지급금 자동화 시장 개요
1.4 통화 및 가격
1.5 제한 사항
1.6 대상 시장
2 시장 세분화
2.1 대상 시장
연구에 2.2년이 고려됨
2.3 지리적 범위
2.4 DBMR TRIPOD 데이터 검증 모델
2.5 주요 여론 리더와의 1차 인터뷰
2.6 DBMR 시장 위치 그리드
2.7 공급업체 점유율 분석
2.8 시장 수직 범위 그리드
2.9 다변량 모델링
2.1 구성 요소 곡선
2.11 챌린지 매트릭스
2.12 2차 소스
2.13 가정
3 요약
4가지 프리미엄 인사이트
5 지역 요약: 중동 및 아프리카 미지급금 자동화 시장
6 DBMR 분석
6.1 강도:
6.2 위협:
6.3 기회:
6.4 약점:
7 시장 개요
7.1 드라이버
7.1.1 지불 프로세스 디지털화 필요성 증가 및 송장 처리 시간 단축
7.1.2 청구서 생성을 위한 미지급금 자동화에 대한 수요 증가
7.1.3 지불 계정 플랫폼 사용 증가
7.2 제약
7.2.1 미지급금 자동화 시스템 구현에 대한 더 높은 비용
7.2.2 대기업의 지불 자동화 시스템 복잡성 증가
7.3 기회
7.3.1 반복적이고 노동 집약적인 작업을 처리하기 위한 AI, ML 및 RPA 기술의 등장
7.3.2 인공 지능(AI) 및 머신 러닝(ML) 애플리케이션
7.3.3 로봇 프로세스 자동화(RPA)
7.3.4 클라우드 기반 자동화 지불 솔루션 채택
7.3.5 자동화 및 디지털화를 추진하기 위한 정부 이니셔티브
7.4 과제
7.4.1 다양한 솔루션 제공업체의 다중 시스템 구성 요소의 상호 운용성
7.4.2 조직 내 AP 자동화의 장점에 대한 인식 부족
8 중동 및 아프리카 미지급금 자동화 시장, 구성 요소별
8.1 개요
8.2 솔루션
8.3 서비스
8.3.1 관리 서비스
8.3.2 구현 및 통합
8.3.3 전문 서비스
8.3.4 지원 및 유지 관리
8.3.5 권고사항
9 중동 및 아프리카 지불금 자동화 시장, 조직 규모별
9.1 개요
9.2 대기업
9.3 중소기업
10 중동 및 아프리카 미지급금 자동화 시장(공정별)
10.1 개요
10.2 송장 캡처
10.2.1 광학 문자 인식(OCR)
10.2.2 컴퓨터 비전
10.2.3 지능형 문서 처리(IDP)
10.2.4 기타
10.3 송장 승인
10.4 지불 승인
10.5 지불 실행
10.6 수출
11 중동 및 아프리카 미지급금 자동화 시장, 배포 유형별
11.1 개요
11.2 현장
11.3 클라우드
11.3.1 공개
11.3.2 개인
12 중동 및 아프리카 지불금 자동화 시장, 수직별
12.1 개요
12.2 제조
12.3 소비재 및 소매
12.4 에너지 및 유틸리티
12.5 건강관리
12.6 은행업, 금융 서비스 및 보험
12.7 IT 및 통신
12.8 정부
12.9 자동차
12.1 기타
13 중동 및 아프리카 지역별 미지급금 자동화 시장
13.1 중동 및 아프리카
13.1.1 아랍에미리트
13.1.2 남아프리카 공화국
13.1.3 사우디 아라비아
13.1.4 이스라엘
13.1.5 이집트
13.1.6 중동 및 아프리카의 나머지 지역
14 중동 및 아프리카 미지급금 자동화 시장, 회사 환경
14.1 회사 점유율 분석: 중동 및 아프리카
15 SWOT 분석
16 회사 프로필
16.1 오라클
16.1.1 회사 스냅샷
16.1.2 수익 분석
16.1.3 회사 점유율 분석
16.1.4 제품 포트폴리오
16.1.5 최근 개발 사항
16.2 아비드엑스체인지
16.2.1 회사 스냅샷
16.2.2 수익 분석
16.2.3 제품 포트폴리오
16.2.4 최근 개발
16.3 SAP SE
16.3.1 회사 스냅샷
16.3.2 수익 분석
16.3.3 회사 점유율 분석
16.3.4 제품 포트폴리오
16.3.5 최근 개발 사항
16.4 국제조약.
16.4.1 회사 스냅샷
16.4.2 수익 분석
16.4.3 회사 점유율 분석
16.4.4 솔루션 포트폴리오
16.4.5 최근 개발 사항
16.5 빌닷컴
16.5.1 회사 스냅샷
16.5.2 수익 분석
16.5.3 회사 점유율 분석
16.5.4 제품 포트폴리오
16.5.5 최근 개발
16.6 에어베이스 주식회사
16.6.1 회사 스냅샷
16.6.2 제품 포트폴리오
16.6.3 최근 개발
16.7 바텀라인 테크놀로지 주식회사
16.7.1 회사 스냅샷
16.7.2 수익 분석
16.7.3 제품 포트폴리오
16.7.4 최근 개발
16.8 코마르크 SA.
16.8.1 회사 스냅샷
16.8.2 수익 분석
16.8.3 솔루션 및 제품 포트폴리오
16.8.4 최근 개발
16.9 쿠파 소프트웨어 주식회사
16.9.1 회사 스냅샷
16.9.2 수익 분석
16.9.3 솔루션 및 제품 포트폴리오
16.9.4 최근 개발
16.1 재정력
16.10.1 회사 스냅샷
16.10.2 제품 포트폴리오
16.10.3 최근 개발 사항
16.11 플리트코어 테크놀로지 주식회사
16.11.1 회사 스냅샷
16.11.2 수익 분석
16.11.3 제품 포트폴리오
16.11.4 최근 개발
16.12 프레쉬북스
16.12.1 회사 스냅샷
16.12.2 제품 포트폴리오
16.12.3 최근 개발
16.13 코팩스 주식회사
16.13.1 회사 스냅샷
16.13.2 제품 포트폴리오
16.13.3 최근 개발 사항
16.14 미네랄트리
16.14.1 회사 스냅샷
16.14.2 제품 포트폴리오
16.14.3 최근 개발 사항
16.15 MHC 자동화
16.15.1 회사 스냅샷
16.15.2 제품 포트폴리오
16.15.3 최근 개발 사항
16.16 프로큐리파이 테크놀로지 주식회사
16.16.1 회사 스냅샷
16.16.2 제품 포트폴리오
16.16.3 최근 개발
16.17 세이지그룹 PLC
16.17.1 회사 스냅샷
16.17.2 수익 분석
16.17.3 솔루션 포트폴리오
16.17.4 최근 개발 사항
16.18 티팔티 주식회사
16.18.1 회사 스냅샷
16.18.2 솔루션 포트폴리오
16.18.3 최근 개발 사항
16.19 조호 주식회사
16.19.1 회사 스냅샷
16.19.2 제품 포트폴리오
16.19.3 최근 개발 사항
16.2 지쿠스 주식회사
16.20.1 회사 스냅샷
16.20.2 솔루션 포트폴리오
16.20.3 최근 개발 사항
17 설문지
18 관련 보고서
표 목록
표 1 중동 및 아프리카 미지급금 자동화 시장, 구성 요소별, 2020-2029년(백만 달러)
표 2 중동 및 아프리카 지역별 미지급금 자동화 시장 솔루션, 2020-2029년(백만 달러)
표 3 중동 및 아프리카 서비스, 지역별 미지급금 자동화 시장, 2020-2029년(백만 달러)
표 4 중동 및 아프리카 서비스, 유형별 미지급금 자동화 시장, 2020-2029년(백만 달러)
표 5 중동 및 아프리카 미지급금 자동화 시장, 조직 규모별, 2020-2029년(백만 달러)
표 6 중동 및 아프리카 지역별 미지급금 자동화 시장의 대기업, 2020-2029년(백만 달러)
표 7 중동 및 아프리카 중소기업의 지역별 미지급금 자동화 시장, 2020-2029년(백만 달러)
표 8 중동 및 아프리카 미지급금 자동화 시장, 프로세스별, 2020-2029년(백만 달러)
표 9 중동 및 아프리카 지역별 미지급금 자동화 시장에서의 송장 캡처, 2020-2029년(백만 달러)
표 10 중동 및 아프리카 지불금 자동화 시장에서의 송장 캡처, 방법별, 2020-2029년(백만 달러)
표 11 중동 및 아프리카 지역별 미지급금 자동화 시장에서의 송장 승인, 2020-2029년(백만 달러)
표 12 중동 및 아프리카 지역별 미지급금 자동화 시장의 지불 승인, 2020-2029년(백만 달러)
표 13 중동 및 아프리카 지역별 미지급금 자동화 시장에서의 지불 실행, 2020-2029년(백만 달러)
표 14 중동 및 아프리카 지역별 미지급금 자동화 시장 수출, 2020-2029년(백만 달러)
표 15 중동 및 아프리카 미지급금 자동화 시장, 배포 유형별, 2020-2029년(백만 달러)
표 16 중동 및 아프리카 온프레미스(지역별) 미지급금 자동화 시장, 2020-2029년(백만 달러)
표 17 중동 및 아프리카 클라우드의 미지급금 자동화 시장, 지역별, 2020-2029년(백만 달러)
표 18 중동 및 아프리카 클라우드 지불금 자동화 시장 유형별, 2020-2029년(백만 달러)
표 19 중동 및 아프리카 미지급금 자동화 시장, 수직별, 2020-2029년(백만 달러)
표 20 중동 및 아프리카 지역별 미지급금 자동화 시장 제조업, 2020-2029년(백만 달러)
표 21 중동 및 아프리카 소비재 및 소매 미지급금 자동화 시장, 지역별, 2020-2029년(백만 달러)
표 22 중동 및 아프리카 에너지 및 유틸리티, 지역별 미지급금 자동화 시장, 2020-2029년(백만 달러)
표 23 중동 및 아프리카 의료 서비스, 지역별 미지급금 자동화 시장, 2020-2029년(백만 달러)
표 24 중동 및 아프리카 은행, 금융 서비스 및 보험, 지역별 미지급금 자동화 시장, 2020-2029년(백만 달러)
표 25 중동 및 아프리카 IT 및 통신, 지역별 미지급금 자동화 시장, 2020-2029년(백만 달러)
표 26 중동 및 아프리카 정부의 미지급금 자동화 시장, 지역별, 2020-2029년(백만 달러)
표 27 중동 및 아프리카 자동차 미지급금 자동화 시장, 지역별, 2020-2029(백만 달러)
표 28 중동 및 아프리카 기타 지역별 미지급금 자동화 시장, 2020-2029년(백만 달러)
표 29 중동 및 아프리카 미지급금 자동화 시장, 국가별, 2020-2029년(백만 달러)
표 30 중동 및 아프리카 미지급금 자동화 시장, 구성 요소별, 2020-2029년(백만 달러)
표 31 중동 및 아프리카 서비스, 유형별 미지급금 자동화 시장, 2020-2029년(백만 달러)
표 32 중동 및 아프리카 미지급금 자동화 시장, 조직 규모별, 2020-2029년(백만 달러)
표 33 중동 및 아프리카 미지급금 자동화 시장, 프로세스별, 2020-2029년(백만 달러)
표 34 중동 및 아프리카 지불금 자동화 시장에서의 송장 캡처, 방법별, 2020-2029년(백만 달러)
표 35 중동 및 아프리카 미지급금 자동화 시장, 배포 유형별, 2020-2029년(백만 달러)
표 36 중동 및 아프리카 클라우드 지불금 자동화 시장 유형별, 2020-2029년(백만 달러)
표 37 중동 및 아프리카 미지급금 자동화 시장, 수직별, 2020-2029년(백만 달러)
표 38 UAE 미지급금 자동화 시장, 구성 요소별, 2020-2029년(백만 달러)
표 39 2020-2029년 유형별 미지급금 자동화 시장의 UAE 서비스(백만 달러)
표 40 UAE 지급금 자동화 시장, 조직 규모별, 2020-2029년(백만 달러)
표 41 UAE 미지급금 자동화 시장, 프로세스별, 2020-2029년(백만 달러)
표 42 2020-2029년 방법별 미지급금 자동화 시장에서의 UAE 송장 캡처(백만 달러)
표 43 배포 유형별 UAE 미지급금 자동화 시장, 2020-2029년(백만 달러)
표 44 2020-2029년 유형별 미지급금 자동화 시장에서의 UAE 클라우드(백만 달러)
표 45 UAE 지급금 자동화 시장, 수직별, 2020-2029년(백만 달러)
표 46 남아프리카 공화국 미지급금 자동화 시장, 구성 요소별, 2020-2029년(백만 달러)
표 47 2020-2029년 유형별 미지급금 자동화 시장에서의 남아프리카 서비스(백만 달러)
표 48 남아프리카 공화국 미지급금 자동화 시장, 조직 규모별, 2020-2029년(백만 달러)
표 49 남아프리카 공화국 미지급금 자동화 시장, 프로세스별, 2020-2029년(백만 달러)
표 50 2020-2029년 방법별 미지급금 자동화 시장에서의 남아프리카 송장 캡처(백만 달러)
표 51 남아프리카 공화국 미지급금 자동화 시장, 배포 유형별, 2020-2029년(백만 달러)
표 52 2020-2029년 유형별 미지급금 자동화 시장에서의 남아프리카 클라우드(백만 달러)
표 53 남아프리카 공화국 미지급금 자동화 시장, 수직별, 2020-2029년(백만 달러)
표 54 사우디 아라비아 지급금 자동화 시장, 구성 요소별, 2020-2029년(백만 달러)
표 55 사우디 아라비아의 지불금 자동화 시장에서의 서비스, 유형별, 2020-2029년(백만 달러)
표 56 사우디 아라비아 지급금 자동화 시장, 조직 규모별, 2020-2029년(백만 달러)
표 57 사우디 아라비아 미지급금 자동화 시장, 프로세스별, 2020-2029년(백만 달러)
표 58 사우디 아라비아의 지불금 자동화 시장에서의 송장 캡처, 방법별, 2020-2029년(백만 달러)
표 59 사우디 아라비아 지급금 자동화 시장, 배포 유형별, 2020-2029(백만 달러)
표 60 사우디 아라비아 클라우드의 지불금 자동화 시장 유형별, 2020-2029년(백만 달러)
표 61 사우디 아라비아 지급금 자동화 시장, 수직별, 2020-2029년(백만 달러)
표 62 이스라엘 미지급금 자동화 시장, 구성 요소별, 2020-2029년(백만 달러)
표 63 2020-2029년 유형별 미지급금 자동화 시장에서의 이스라엘 서비스(백만 달러)
표 64 이스라엘 미지급금 자동화 시장, 조직 규모별, 2020-2029년(백만 달러)
표 65 이스라엘 미지급금 자동화 시장, 프로세스별, 2020-2029년(백만 달러)
표 66 2020-2029년 방법별 미지급금 자동화 시장에서의 이스라엘 송장 캡처(백만 달러)
표 67 이스라엘 미지급금 자동화 시장, 배포 유형별, 2020-2029년(백만 달러)
표 68 이스라엘 클라우드의 미지급금 자동화 시장 유형별, 2020-2029년(백만 달러)
표 69 이스라엘 미지급금 자동화 시장, 수직별, 2020-2029년(백만 달러)
표 70 이집트 미지급금 자동화 시장, 구성 요소별, 2020-2029년(백만 달러)
표 71 2020-2029년 유형별 미지급금 자동화 시장에서의 이집트 서비스(백만 달러)
표 72 이집트 미지급금 자동화 시장, 조직 규모별, 2020-2029년(백만 달러)
표 73 이집트 미지급금 자동화 시장, 프로세스별, 2020-2029년(백만 달러)
표 74 2020-2029년 방법별 미지급금 자동화 시장에서의 이집트 송장 캡처(백만 달러)
표 75 이집트 미지급금 자동화 시장, 배포 유형별, 2020-2029년(백만 달러)
표 76 이집트 클라우드의 미지급금 자동화 시장 유형별, 2020-2029년(백만 달러)
표 77 이집트 미지급금 자동화 시장, 수직별, 2020-2029년(백만 달러)
표 78 중동 및 아프리카 나머지 지역 미지급금 자동화 시장, 구성 요소별, 2020-2029년(백만 달러)
그림 목록
그림 1 중동 및 아프리카 미지급금 자동화 시장: 세분화
그림 2 중동 및 아프리카 미지급금 자동화 시장: 데이터 삼각 측량
그림 3 중동 및 아프리카 미지급금 자동화 시장: DROC 분석
그림 4 중동 및 아프리카 미지급금 자동화 시장: 중동 및 아프리카 대 지역 시장 분석
그림 5 중동 및 아프리카 미지급금 자동화 시장: 회사 연구 분석
그림 6 중동 및 아프리카 미지급금 자동화 시장: 인터뷰 인구 통계
그림 7 중동 및 아프리카 미지급금 자동화 시장: DBMR 시장 위치 그리드
그림 8 중동 및 아프리카 미지급금 자동화 시장: 공급업체 점유율 분석
그림 9 중동 및 아프리카 미지급금 자동화 시장: 시장 수직 범위 그리드
그림 10 중동 및 아프리카 미지급금 자동화 시장: 세분화
그림 11 지불 프로세스 디지털화에 대한 필요성 증가 및 송장 처리 시간 단축은 2022년~2029년 예측 기간 동안 중동 및 아프리카 미지급금 자동화 시장 시장의 주요 동인이 될 것으로 예상됩니다.
그림 12 솔루션 세그먼트는 2022년부터 2029년까지 중동 및 아프리카 미지급금 자동화 시장에서 가장 큰 점유율을 차지할 것으로 예상됩니다.
그림 13 중동 및 아프리카 미지급금 자동화 시장의 동인, 제약, 기회 및 과제
그림 14 중동 및 아프리카 미지급금 자동화 시장: 구성 요소별, 2021년
그림 15 중동 및 아프리카 미지급금 자동화 시장: 조직 규모별, 2021년
그림 16 중동 및 아프리카 미지급금 자동화 시장: 프로세스별, 2021년
그림 17 중동 및 아프리카 미지급금 자동화 시장: 배포 유형별, 2021년
그림 18 중동 및 아프리카 미지급금 자동화 시장: 수직별, 2021년
그림 19 중동 및 아프리카 미지급금 자동화 시장: 스냅샷(2021)
그림 20 중동 및 아프리카 미지급금 자동화 시장: 국가별(2021년)
그림 21 중동 및 아프리카 미지급금 자동화 시장: 국가별(2022년 및 2029년)
그림 22 중동 및 아프리카 미지급금 자동화 시장: 국가별(2021년 및 2029년)
그림 23 중동 및 아프리카 미지급금 자동화 시장: 구성 요소별(2022-2029)
그림 24 중동 및 아프리카 미지급금 자동화 시장: 회사 점유율 2021(%)
연구 방법론
데이터 수집 및 기준 연도 분석은 대규모 샘플 크기의 데이터 수집 모듈을 사용하여 수행됩니다. 이 단계에는 다양한 소스와 전략을 통해 시장 정보 또는 관련 데이터를 얻는 것이 포함됩니다. 여기에는 과거에 수집한 모든 데이터를 미리 검토하고 계획하는 것이 포함됩니다. 또한 다양한 정보 소스에서 발견되는 정보 불일치를 검토하는 것도 포함됩니다. 시장 데이터는 시장 통계 및 일관된 모델을 사용하여 분석하고 추정합니다. 또한 시장 점유율 분석 및 주요 추세 분석은 시장 보고서의 주요 성공 요인입니다. 자세한 내용은 분석가에게 전화를 요청하거나 문의 사항을 드롭하세요.
DBMR 연구팀에서 사용하는 주요 연구 방법론은 데이터 마이닝, 시장에 대한 데이터 변수의 영향 분석 및 주요(산업 전문가) 검증을 포함하는 데이터 삼각 측량입니다. 데이터 모델에는 공급업체 포지셔닝 그리드, 시장 타임라인 분석, 시장 개요 및 가이드, 회사 포지셔닝 그리드, 특허 분석, 가격 분석, 회사 시장 점유율 분석, 측정 기준, 글로벌 대 지역 및 공급업체 점유율 분석이 포함됩니다. 연구 방법론에 대해 자세히 알아보려면 문의를 통해 업계 전문가에게 문의하세요.
사용자 정의 가능
Data Bridge Market Research는 고급 형성 연구 분야의 선두 주자입니다. 저희는 기존 및 신규 고객에게 목표에 맞는 데이터와 분석을 제공하는 데 자부심을 느낍니다. 보고서는 추가 국가에 대한 시장 이해(국가 목록 요청), 임상 시험 결과 데이터, 문헌 검토, 재생 시장 및 제품 기반 분석을 포함하도록 사용자 정의할 수 있습니다. 기술 기반 분석에서 시장 포트폴리오 전략에 이르기까지 타겟 경쟁업체의 시장 분석을 분석할 수 있습니다. 귀하가 원하는 형식과 데이터 스타일로 필요한 만큼 많은 경쟁자를 추가할 수 있습니다. 저희 분석가 팀은 또한 원시 엑셀 파일 피벗 테이블(팩트북)로 데이터를 제공하거나 보고서에서 사용 가능한 데이터 세트에서 프레젠테이션을 만드는 데 도움을 줄 수 있습니다.

